DEPARTMENT OF FISHERIES ANNUAL REPORT TO THE ...
DEPARTMENT OF FISHERIES ANNUAL REPORT TO THE ...
DEPARTMENT OF FISHERIES ANNUAL REPORT TO THE ...

You also want an ePaper? Increase the reach of your titles
YUMPU automatically turns print PDFs into web optimized ePapers that Google loves.
<strong>DEPARTMENT</strong> <strong>OF</strong> <strong>FISHERIES</strong><br />
<strong>ANNUAL</strong> <strong>REPORT</strong> <strong>TO</strong> <strong>THE</strong> PARLIAMENT<br />
2010/11
Norman Moore,<br />
Minister for Fisheries<br />
To The hon. noRMAn<br />
FReDeRICK MooRe<br />
MLC BA DIP eD<br />
MInIsTeR FoR FIsheRIes<br />
Department of Fisheries Major Metropolitan and Regional Locations<br />
Head Office<br />
3rd Floor, The Atrium<br />
168 St. Georges Terrace<br />
Perth WA 6000<br />
Telephone: (08) 9482 7333<br />
Facsimile: (08) 9482 7389<br />
Website: www.fish.wa.gov.au<br />
Email: headoffice@fish.wa.gov.au<br />
Metropolitan<br />
Regional Office<br />
14 Capo d’Orlando Drive<br />
South Fremantle WA 6162<br />
Telephone: (08) 9432 8000<br />
Facsimile: (08) 9432 8060<br />
Published by the Department of Fisheries, 3rd Floor, The Atrium,<br />
168 St. Georges Terrace PERTH WA 6000. www.fish.wa.gov.au<br />
Southern<br />
Regional Office<br />
Suite 7 Frederick House<br />
70-74 Frederick Street<br />
Albany WA 6330<br />
Telephone: (08) 9845 7400<br />
Facsimile: (08) 9845 7457<br />
Mid-West<br />
Regional Office<br />
69-75 Connell Road<br />
Geraldton WA 6530<br />
Telephone: (08) 9921 6800<br />
Facsimile: (08) 9921 3617<br />
Sir<br />
In accordance with Section 61 of the Financial Management Act 2006 (FMA) and<br />
Section 263 of the Fish Resources Management Act 1994 (FRMA), I submit for your<br />
information the Annual Report to Parliament of the Department of Fisheries of<br />
Western Australia for the financial year ending 30 June 2011.<br />
The Department also produces a companion State of the Fisheries and Aquatic<br />
Resources Report, as required by Section 263 of the FRMA. This Annual Report also<br />
includes a table on stock status and catch ranges for major commercial fisheries,<br />
derived from the State of the Fisheries and Aquatic Resources Report.<br />
Stuart Smith<br />
Gascoyne<br />
Regional Office<br />
82 Olivia Terrace<br />
Carnarvon WA 6701<br />
Telephone: (08) 9941 1185<br />
Facsimile: (08) 9941 1951<br />
Northern<br />
Regional Office<br />
Port of Pearls House<br />
401 Port Drive<br />
Broome WA 6725<br />
Telephone: (08) 9193 8600<br />
Facsimile: (08) 9193 8699<br />
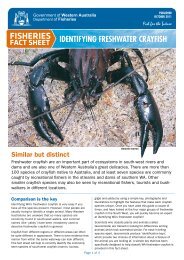
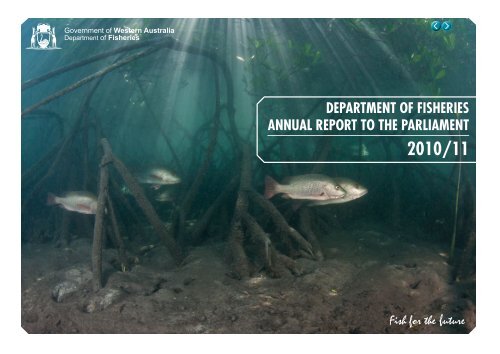
Cover image: Mangrove jack (Lutjanus argentimaculatus) among mangrove roots in the<br />
Pilbara/Kimberley (North Coast Bioregion) Photo: Shannon Conway.<br />
WA Fisheries and Marine<br />
Research Laboratories<br />
39 Northside Drive<br />
Hillarys WA 6025<br />
Telephone: (08) 9203 0111<br />
Facsimile: (08) 9203 0199<br />
ii<br />
ABN 55 689 794 771<br />
ISSN 1833-198X
CONteNtS<br />
SummAry of the yeAr .............................................. 1<br />
From the Chief Executive Officer ...................................... 2<br />
Highlights At-a-Glance 2010/11 ...................................... 8<br />
Stock Status and Catch Ranges for Major<br />
Commercial Fisheries ................................................... 10<br />
Financial Overview ........................................................ 16<br />
Fish Pies (and Other Graphs) ......................................... 38<br />
overvIew of AgeNcy ................................................ 46<br />
Profile of the Department of Fisheries ............................ 47<br />
Operating Environment – Significant Issues Impacting<br />
the Agency ................................................................... 51<br />
Operational Structure ................................................... 53<br />
Corporate Executive ..................................................... 55<br />
Performance Management Framework ........................... 60<br />
AgeNcy PerformANce ............................................. 65<br />
Agency Performance – Overview ..................................... 66<br />
Service 1 – Fisheries Management ................................ 67<br />
Service 2 – Compliance and Education .......................... 73<br />
Rock Lobster in Focus – the transition to quota management<br />
and the low recruitment of young lobsters ..........................79<br />
Recreational Fisheries Management in Focus ..................83<br />
Aboriginal community commercial fishing:<br />
the Western Australian trochus Fishery ............................88<br />
Service 3 – Research and Monitoring ............................ 90<br />
Research and Monitoring in Focus – Scientists join forces to<br />
investigate marine heatwave and climate variability .......97<br />
Service 4 – Marine Safety Service .............................. 100<br />
Corporate Services ..................................................... 101<br />
dIScloSureS ANd legAl comPlIANce ................... 106<br />
Independent Audit Opinion on Financial Statements<br />
and Key Performance Indicators .................................. 107<br />
Certification of financial statements for the year<br />
ended 30 June 2011 .................................................. 108<br />
Other Financial Disclosures ......................................... 137<br />
Detailed Key Performance Indicators ........................... 140<br />
Other Legal Requirements ........................................... 156<br />
Government Policy Requirements ................................. 162<br />
APPeNdIceS ............................................................ 165<br />
Advisory Committees .................................................. 166<br />
Major Publications Produced by the Department<br />
of Fisheries during 2010/11 ....................................... 167<br />
Legislative Amendments and New Legislation ............... 170<br />
State Register of Authorisations, Exemptions and<br />
Aquaculture Leases .................................................... 179<br />
iii
SUMMARy <strong>OF</strong> <strong>THE</strong> yEAR<br />
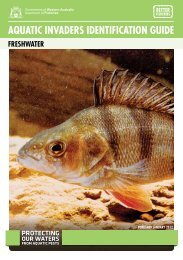
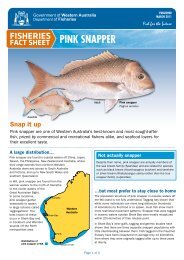
The Department of Fisheries is the lead agency for WA’s marine environment, in addition to managing our fisheries and aquaculture. 6,800 ships enter WA ports annually and<br />
can bring with them invasive marine pests on their hulls or in ballast water. In 2010/11, funding was announced to enable the Department to raise awareness of biosecurity<br />
issues and carry out associated research. Pictured: (centre) blue striped sea perch (Lutjanus kasmira) at the Rowley Shoals. Photo: Shannon Conway<br />
SUMMARy <strong>OF</strong> <strong>THE</strong> yEAR<br />
From the Chief Executive Officer ___________________________________________________________ 2<br />
Highlights At-a-Glance 2010/11 ___________________________________________________________ 8<br />
Stock Status and Catch Ranges for Major Commercial Fisheries ______________________________10<br />
Financial Overview _____________________________________________________________________16<br />
Fish Pies (and Other Graphs) ____________________________________________________________38<br />
1
SUMMARy <strong>OF</strong> <strong>THE</strong> yEAR � FROM <strong>THE</strong> CHIEF ExECUTIvE <strong>OF</strong>FICER<br />
Stuart Smith, Chief Executive Officer<br />
of the Department of Fisheries<br />
From the Chief executive Officer<br />
Western Australians are fortunate that after<br />
nearly two centuries of rural, urban and industrial<br />
development in the State, the vast majority of its<br />
marine environment remains in excellent shape<br />
supporting healthy fisheries. Similarly, Western<br />
Australia’s major river systems, while affected<br />
by this development, still provide quality fishing<br />
opportunities throughout the year.<br />
However, these marine and riverine ecosystems have<br />
been placed under stress in recent decades owing<br />
to a growing population. During the last 30 years,<br />
the State’s population has increased by almost one<br />
million people to 2.25 million. This growth has put<br />
significant pressures on the State’s fish resources<br />
and their environments from related factors<br />
including increasing coastal residential development,<br />
discarded plastics, the emergence of new industries,<br />
increased shipping, new port development, offshore<br />
energy production, growing boat ownership and the<br />
proliferation of affordable fish-finding technology such<br />
as echo sounders and global positioning systems.<br />
As a result, the management of the State’s<br />
wildstock fisheries has become a more complex<br />
task. With Western Australia’s population projected<br />
to nearly double again over the next 40 years, the<br />
complexity of this challenge is expected to increase<br />
even more. This growth will lead to even greater<br />
competition among users of the marine environment<br />
for oil and gas production, port development and<br />
expansion, marine reserves and aquaculture. The<br />
environmental impacts of global population growth<br />
and the related increasing consumption of renewable<br />
and non-renewable resources are also likely to result<br />
in increased local environmental pressures.<br />
Against this background of accelerated social,<br />
economic and environmental change, the year in<br />
review was both challenging and rewarding, as the<br />
Department worked with the community to ensure<br />
the continuing sustainability of Western Australia’s<br />
fish resources and their habitats.<br />
Overall, the State’s fisheries remain in healthy<br />
condition, with stock assessments undertaken<br />
during the course of the year showing that 32 of<br />
the 36 managed fisheries have breeding stocks<br />
considered to be satisfactory. Of the other managed<br />
fisheries, the Department is taking action in the<br />
West Coast Demersal Gillnet and Demersal Longline<br />
2
SUMMARy <strong>OF</strong> <strong>THE</strong> yEAR � FROM <strong>THE</strong> CHIEF ExECUTIvE <strong>OF</strong>FICER<br />
Fishery (commonly known as the West Coast shark<br />
fishery), the West Coast Demersal Scalefish Fishery<br />
(targeting dhufish, pink snapper, breaksea cod) and<br />
the Northern Shark Fishery to address sustainability<br />
issues. The Department is also undertaking further<br />
research to determine the sustainability status of<br />
the commercial herring fishery on WA’s south coast.<br />
The highest priority for the Department in<br />
2010/11 was the progression of measures to<br />
secure the long-term sustainability of the western<br />
rock lobster fishery, following the dramatic decline<br />
The West Coast rock lobster fishery will operate under a fully<br />
Individual Transferable Quota system in the 2013/14 fishing year.<br />
Photo: Henrique Kwong<br />
in observed recruitment of juveniles to the fishery<br />
three years ago. The measures included a reduction<br />
in the total allowable commercial catch to 5,500<br />
tonnes (roughly half of the long-term average annual<br />
catch) and the introduction of a catch limit (or<br />
quota) for each pot (or unit) permitted to be used in<br />
the West Coast Rock Lobster Managed Fishery.<br />
The introduction of a unit catch limit was a<br />
significant milestone in transitioning the fishery<br />
from an input-controlled fishery (based on the<br />
number of allowable pots, as it operated prior to the<br />
2009/10 season), to a full Individual Transferable<br />
Quota system (based on the weight of rock lobster<br />
that may be taken by authorisation holders) as will<br />
apply in the 2013/14 fishing year.<br />
The move to pot catch limits created a number<br />
of challenges and obligations on both the industry<br />
and the Department of Fisheries. The Department<br />
needed to design a robust management and<br />
compliance strategy that was also capable of<br />
accommodating the practicalities of an industry that<br />
requires some licensees to continue to land their<br />
catch in remote locations. This strategy involved<br />
considerable effort from all areas of the Department<br />
and industry in determining new rules for the<br />
fishery, the design and printing of new catch and<br />
disposal records for use by industry, the drafting of<br />
substantial amendments to the fishery management<br />
plan and running a number of workshops to inform<br />
industry about the new rules prior to the start of the<br />
2010/11 fishing season.<br />
3
SUMMARy <strong>OF</strong> <strong>THE</strong> yEAR � FROM <strong>THE</strong> CHIEF ExECUTIvE <strong>OF</strong>FICER<br />
From an industry perspective, fishers were<br />
required to rapidly understand the new management<br />
settings, adjust their fishing gear and the containers<br />
used to transport lobster, and adhere to strict<br />
fishing activity and catch landing, disposal and<br />
receiving reporting requirements. However, the<br />
new management arrangements have provided<br />
western rock lobster fishers with the opportunity to<br />
maximise the prices they receive for their product by<br />
redirecting fishing effort from the high-volume, lowprice<br />
‘white’ lobsters at the start of the season to a<br />
more even fishing spread throughout the year.<br />
The commercial season for western rock<br />
lobster was also extended by two months until 31<br />
August 2011, with fishing permitted seven-daysa-week<br />
during the final months to provide fishers<br />
with ample opportunity to catch their full quota. The<br />
educative and cooperative approach adopted by<br />
fishers and the Department during this transition to<br />
quota has been the key to the successful progress<br />
already made.<br />
Significantly, the Department’s strategies for<br />
increasing the breeding stock and recruitment of<br />
juveniles into the fishery have passed the annual<br />
audit of the independent Marine Stewardship<br />
Council. The Department and the Western<br />
Rock Lobster Council have completed all the<br />
requirements for re-certification of the West Coast<br />
Rock Lobster Managed Fishery as a sustainably<br />
managed fishery for the next five years, subject<br />
to it meeting annual audit requirements. For more<br />
information on the management of this fishery,<br />
please see the ‘Rock Lobster in Focus’ section of<br />
this Annual Report.<br />
Another major achievement during the year<br />
was the commencement of new management<br />
arrangements for the Gascoyne Demersal<br />
Scalefish Fishery to provide an integrated fisheries<br />
management framework for demersal (living at<br />
or near the bottom of the water) scalefish in the<br />
southern Gascoyne. The new fishery incorporates<br />
the pre-existing Shark Bay Snapper Fishery, the<br />
offshore demersal scalefish stocks and 27 nautical<br />
miles of previously open access fishery adjacent to<br />
Coral Bay. In addition to existing pink snapper quota<br />
entitlement, licence holders will also now receive<br />
non-pink snapper demersal scalefish entitlement,<br />
providing increased economic value and flexibility for<br />
operators.<br />
The aquaculture industry has had a number<br />
of exciting developments during the year. After<br />
obtaining the necessary environmental approval,<br />
Marine Produce Australia increased its production<br />
to 1,000 tonnes of barramundi per annum from<br />
its farm in Cone Bay in the Kimberley and is now<br />
seeking approval to gradually expand its production<br />
capability to 5,000 tonnes per annum. The company<br />
produces high-quality barramundi that command a<br />
premium price in Australian markets.<br />
In the Pilbara Region, Aurora Algae has<br />
started a demonstration project culturing marine<br />
micro-algae near Karratha. Aurora selected the<br />
4
SUMMARy <strong>OF</strong> <strong>THE</strong> yEAR � FROM <strong>THE</strong> CHIEF ExECUTIvE <strong>OF</strong>FICER<br />
site following a global search for the ideal location<br />
to commercialise its technology, which uses<br />
marine algae to convert waste carbon dioxide from<br />
industrial processes into three products: biofuel for<br />
use in the mining sector; protein-rich biomass for<br />
use in manufactured animal feeds; and omega-3<br />
oils for human nutrition. The company is planning<br />
for significant increases in scale and production<br />
capability in the future.<br />
In the Mid-West Region, Cognis Australia is<br />
developing the commercial production of artemia<br />
(commonly known as brine shrimp) at Hutt Lagoon,<br />
Port Gregory. Research staff from the Department<br />
of Fisheries helped develop and build sophisticated<br />
filtration, aeration and harvesting systems to suit<br />
the high volume of water passing through the<br />
facility, which is a world-first in the commercial<br />
tank production of artemia. The project won the<br />
‘Developing the Economy’ category of the 2010<br />
Premier’s Awards.<br />
Apart from managing the State’s fisheries<br />
and aquaculture, the Department is also the lead<br />
agency for the management of the State’s marine<br />
environment. During the year the Department<br />
received additional funding of $9.4 million over two<br />
years (2011/12 and 2012/13) that will enable it<br />
to better protect the State’s marine environment<br />
from the threat of invasive marine species that can<br />
enter WA in the ballast water or on the hulls of the<br />
6,800 ships entering WA ports annually. The funding<br />
will enable the Department to raise awareness of<br />
In 2010/11 it was announced the Department of Fisheries would<br />
receive $9.4 million to better protect WA from invasive marine<br />
species, which can enter WA on ship hulls or in ballast water.<br />
marine biosecurity issues, carry out research to<br />
identify better methods of in-water inspection and<br />
hull cleaning, and increase the number of vessel<br />
and port inspections carried out.<br />
Significant resources of the Department have<br />
been applied to the marine reserves planning<br />
process being undertaken by government at both<br />
the State and Commonwealth level, with the<br />
aim of achieving balanced environmental, social<br />
and economic outcomes for the Department’s<br />
stakeholders.<br />
An estimated 80 per cent of Western<br />
Australian state waters would now meet<br />
5
SUMMARy <strong>OF</strong> <strong>THE</strong> yEAR � FROM <strong>THE</strong> CHIEF ExECUTIvE <strong>OF</strong>FICER<br />
International Union for the Conservation of<br />
Nature (IUCN) criteria for classification as marine<br />
protected areas under the Conservation and Land<br />
Management Act 1984 and the Fish Resources<br />
Management Act 1994. In State waters additional<br />
marine reserves are being planned for the<br />
Kimberley and in the South West ‘Capes’ area. At<br />
the same time the Commonwealth is in the process<br />
of implementing a system of marine reserves<br />
beyond the State three-nautical-mile-limit in waters<br />
stretching from the Northern Territory to the South<br />
Australian border.<br />
A very strong Leeuwin Current and unusually<br />
high water temperatures – in some places the<br />
highest-ever recorded – contributed to a number<br />
of marine ‘fish kills’ over the 2010/11 summer,<br />
with abalone deaths reported near the Greenough<br />
River mouth and in the waters north of Kalbarri.<br />
Fish kills were also recorded in Jurien Bay and<br />
Leeman and coral bleaching was observed at the<br />
Abrolhos Islands. The strength of the Leeuwin<br />
Current also saw many tropical species extend<br />
their range as far south as Albany over the<br />
summer months.<br />
To help us better understand the likely<br />
causes and significance of this unusual event the<br />
Department convened a workshop of more than 80<br />
marine scientists and managers from organisations<br />
including the Department of Environment and<br />
Conservation, the CSIRO, the Australian Institute of<br />
Marine Science and the Department of Fisheries.<br />
In addition, a joint Department of Fisheries/CSIRO<br />
project to closely examine climate change effects<br />
on Western Australia’s marine environment was<br />
commenced.<br />
Implementation of a new fee-setting model<br />
applying a royalty-like access fee of 5.75 per cent<br />
of the gross value of production (GVP) for each<br />
commercial fishery commenced on 1 July 2010.<br />
This new approach removes the inequity evident<br />
under the old model where some licence fees were<br />
as high as 20 per cent of the GVP of the fishery,<br />
while others were as low as one per cent.<br />
Importantly, the new model moves away from<br />
cost recovery, where the bulk of the Department’s<br />
revenue was tied to the level of service provision<br />
in the State’s major fisheries – West Coast Rock<br />
Lobster, Shark Bay Scallop, Shark Bay Prawn,<br />
Exmouth Gulf Prawn, pearling and, to a lesser<br />
extent, abalone – with limited funding available to<br />
address sustainability issues of other fisheries.<br />
In future, all revenue raised through<br />
commercial access fees will be able to be directed<br />
to commercial fisheries research, management<br />
and compliance projects of the greatest need,<br />
with the exception of funds allocated to the<br />
Commonwealth’s Fisheries Research and<br />
Development Corporation (0.25 per cent of GVP)<br />
for fisheries research and to the WA Fishing<br />
Industry Council (0.5 per cent of GVP).<br />
In 2010/11 the commercial fishing industry<br />
contributed $19.8 million in access fees.<br />
6
SUMMARy <strong>OF</strong> <strong>THE</strong> yEAR � FROM <strong>THE</strong> CHIEF ExECUTIvE <strong>OF</strong>FICER<br />
The year also saw the first full year’s<br />
implementation of changes to recreational fishing<br />
management arrangements, including a new fee<br />
applicable when fishing from a powered recreational<br />
vessel. All State funding and fees received for<br />
recreational fishing licences flowing from the revised<br />
arrangements is spent on research, management<br />
and compliance in the State’s recreational fisheries.<br />
The new funding has so far been used to improve<br />
compliance with recreational fishing rules by<br />
purchasing and deploying six new mobile fisheries<br />
patrol vehicles, increasing support for Recfishwest<br />
as the peak body representing recreational<br />
fishers, exploring the potential of artificial reefs,<br />
progressing fish stocking programs in the Kimberley,<br />
and delivering recreational fishing guides and<br />
information to a broad network of tackle shops and<br />
other retail outlets.<br />
In 2010/11 the recreational fishing sector<br />
contributed $6.1 million to the cost of managing the<br />
State’s recreational fisheries.<br />
The Government’s legislative reform agenda<br />
was also progressed, with two acts clarifying the<br />
scope of the Department’s fee-setting powers<br />
being passed by the Parliament. A further bill<br />
proposing a number of amendments to the Fish<br />
Resources Management Act 1994 was introduced<br />
into the Parliament. The bill provides an improved<br />
administrative and legislative framework for the<br />
sustainable management of aquaculture and the<br />
State’s fish resources. Work also continued on the<br />
development of new legislation to replace the Fish<br />
Resources Management Act 1994 and the Pearling<br />
Act 1990.<br />
I would like to acknowledge the full range of<br />
stakeholders that have worked with the Department<br />
and contributed to positive initiatives throughout<br />
the course of 2010/11. I would also like to<br />
acknowledge the professionalism and dedication<br />
of the staff and executive team in their efforts to<br />
ensure the sustainability of our fisheries and the<br />
aquatic environment. My thanks also go to the<br />
Minister for Fisheries, the Hon. Norman Moore MLC<br />
and his staff for the guidance and support provided<br />
during the year.<br />
Stuart Smith<br />
Chief Executive Officer<br />
7
SUMMARy <strong>OF</strong> <strong>THE</strong> yEAR � HIgHLIgHTS AT-A-gLANCE 2010/11<br />
Highlights At-a-Glance 2010/11<br />
Key achievements for the Department of Fisheries<br />
in 2010/11 included:<br />
• Successful implementation of a total allowable<br />
commercial catch for the West Coast Rock<br />
Lobster Managed Fishery and the start of the<br />
transition to an Individual Transferrable Quota<br />
system of catch management commencing in<br />
the 2013/14 fishing season.<br />
• New management arrangements commenced<br />
for the Gascoyne Demersal Scalefish Fishery,<br />
which incorporates the Shark Bay Snapper<br />
Fishery, offshore demersal scalefish stocks<br />
and 27 nautical miles of previously open<br />
access fishery adjacent to Coral Bay.<br />
• A number of new recreational fishing initiatives<br />
were started using funds derived from the<br />
new Recreational Fishing from Boat Licence,<br />
including increased research, progressing fish<br />
restocking and artificial reefs, and the most<br />
comprehensive recreational fishing survey ever<br />
conducted in WA.<br />
• The Department’s state-wide education<br />
program won the Science Outreach Initiative<br />
prize at the 2010 Western Australian Science<br />
Awards. The education program delivers<br />
marine science education to teachers, school<br />
students and the community and operates<br />
from the Naturaliste Marine Discovery Centre<br />
(NMDC) at Hillarys and in regional locations<br />
including Broome, Carnarvon, Geraldton,<br />
Busselton, Bunbury, Albany and Esperance,<br />
and Christmas Island and Cocos-Keeling<br />
Islands.<br />
• Investment, innovation and growth was<br />
achieved in the State’s aquaculture industry<br />
through an establishment of the brine shrimp<br />
aquaculture project at Hutt Lagoon north of<br />
Geraldton, increased barramundi production<br />
at Cone Bay in the Kimberley and the<br />
establishment of a demonstration project that<br />
cultures marine micro-algae near Karratha.<br />
• Marine biosecurity funding was boosted,<br />
enabling the Department to better protect the<br />
State’s marine environment from the threat<br />
of invasive marine species entering WA in<br />
the ballast water or on the hulls of the 6,800<br />
ships that visit WA ports annually.<br />
8
SUMMARy <strong>OF</strong> <strong>THE</strong> yEAR � HIgHLIgHTS AT-A-gLANCE 2010/11<br />
• Research by the Department of Fisheries<br />
during 2010/11 has shown that new rules to<br />
protect iconic demersal scalefish species such<br />
as dhufish, pink snapper and baldchin groper<br />
have been successful, with the desired 50 per<br />
cent catch reduction almost being achieved.<br />
• Sea lion pups at the Abrolhos Islands are better<br />
protected under new rules requiring the use of<br />
Sea Lion Exclusion Devices (SLEDs) for western<br />
rock lobster fishers operating in the Abrolhos’<br />
Easter and Pelsaert groups. Mandatory SLEDs<br />
for rock lobster pots were first introduced in<br />
2006 to protect sea lion breeding colonies<br />
between Lancelin and Dongara.<br />
• Deployment of six satellite-linked drifters<br />
between Cape Leeuwin and Cape Naturaliste<br />
will help the Department to learn more about<br />
the important Capes Current, which is believed<br />
to be vital in carrying and dispersing eggs<br />
and larvae of summer-spawning fish, such as<br />
the popular Western Australian dhufish. The<br />
project is funded by the Western Australian<br />
Marine Science Institution.<br />
• A Memorandum of Understanding signed by<br />
Western Australia and China provides access<br />
for the Department of Fisheries to China’s<br />
vast experience in artificial reef technology<br />
while China will benefit from the Department’s<br />
expertise in the policy development,<br />
monitoring and compliance components of<br />
fisheries management.<br />
Satellite-linked drifting buoys are being used to learn more about the Capes Current, which appears vital in dispersing the eggs and larvae<br />
of the WA dhufish (pictured). Photo: Henrique Kwong<br />
9
SUMMARy <strong>OF</strong> <strong>THE</strong> yEAR � S<strong>TO</strong>Ck STATUS AND CATCH RANgES FOR MAjOR COMMERCIAL <strong>FISHERIES</strong><br />
Stock Status and Catch Ranges for<br />
Major Commercial Fisheries<br />
the information in this table is derived from more<br />
detailed data presented in the companion report,<br />
State of the Fisheries and Aquatic Resources.<br />
the fisheries referred to in the table are the<br />
management units that are either fully managed<br />
fisheries or are in the process of having dedicated<br />
management plans developed for them.<br />
Full information on the current management status<br />
and future directions of commercial fisheries,<br />
recreational fisheries and aquaculture industries<br />
is given in the State of the Fisheries and Aquatic<br />
Resources report.<br />
Figure 1. Summary of major commercial fisheries<br />
in regard to an assessment of their<br />
breeding stocks during 2010/11.<br />
6%<br />
94%<br />
Satisfactory<br />
Inadequate<br />
10<br />
Note: The ‘Satisfactory’ category (34 fisheries) includes those<br />
fisheries where the breeding stocks are adequate and three<br />
major commercial fisheries whose breeding stocks are<br />
recovering, while the ‘Inadequate’ category includes two<br />
fisheries where additional actions need to be taken to ensure<br />
the breeding stocks are either adequate or recovering.
table 1. Stock Status and Catch Ranges for Major Commercial Fisheries<br />
fishery<br />
West Coast Bioregion<br />
West coast<br />
rock lobster<br />
Stock<br />
assessment<br />
complete<br />
Breeding<br />
stock<br />
assessment<br />
target catch<br />
(and effort) range in<br />
tonnes (days)<br />
Yes Adequate 5,500 ± 10% catch<br />
limit for season<br />
Roe’s abalone Yes Adequate 101.8 (Quota<br />
management)<br />
(530 – 640 days)<br />
catch (tonnes)<br />
for season reported 1<br />
5,899 (includes Windy<br />
Harbour and Augusta)<br />
91.4<br />
Season<br />
reported 1<br />
catch<br />
(or effort)<br />
level<br />
acceptable<br />
comments on performance<br />
in reported season<br />
2009/10 Yes Total Allowable Commercial Catch (TACC) of 5,500 tonnes<br />
± 10% set for the 2009/10 season to accommodate the<br />
recent series of low puerulus settlements.<br />
2010 Yes Effort range adjusted downward by 15% from previous<br />
range (620 – 750 days) to account for increased<br />
efficiency in the fishery.<br />
Octopus Yes Adequate 50 – 250<br />
(567 days)<br />
174 2010 Yes Fishery in developing phase. Target range to be reviewed<br />
when additional information is available.<br />
Abrolhos Islands Yes Adequate 95 – 1,830 806 2010 Yes Total landings were well within the acceptable range.<br />
and mid-west<br />
There were areas of high scallop abundance but, due to<br />
trawl<br />
some areas of small-size scallop meat, the stock was<br />
not fished to its full potential catch.<br />
Cockburn Sound Yes Recovering NA 56 2009/10 NA The fishery re-opened for the first time in three years,<br />
crab<br />
due to continuing recovery of the breeding stock and<br />
improving recruitment.<br />
Deep sea crab Yes Adequate 154 (Quota 145 2010 Yes Total Allowable Commercial Catch began in 2008 so an<br />
management)<br />
acceptable effort range is yet to be determined.<br />
Estuarine finfish No NA 75 – 220<br />
125 (PH) 2010 Yes Catches of west coast estuarine finfish have been stable<br />
(west coast)<br />
(Peel-Harvey only)<br />
since 2000.<br />
West coast Yes Adequate 60 – 275<br />
101 (whitebait only) 2010 Yes Yearly fluctuations in whitebait catch still match<br />
beach bait<br />
(whitebait only)<br />
environmental variations.<br />
West coast Yes Adequate 0 – 3,000 (Quota 10 2010 NA Continued low catches due to market competition,<br />
purse seine<br />
management)<br />
irregular availability of fish and low fishing effort levels.<br />
West coast<br />
demersal<br />
scalefish<br />
SUMMARy <strong>OF</strong> <strong>THE</strong> yEAR � S<strong>TO</strong>Ck STATUS AND CATCH RANgES FOR MAjOR COMMERCIAL <strong>FISHERIES</strong><br />
Yes Recovering < 449 – 469 (All<br />
Demersal Scalefish)<br />
< 450 (Demersal<br />
Suite)<br />
1 Catch figures supplied for latest year/season available. NA Not assessed.<br />
421<br />
340 – West Coast<br />
Demersal Scalefish<br />
(Interim) Managed Fishery<br />
81 – Other fisheries,<br />
including West Coast<br />
Demersal Gillnet and<br />
Longline (Interim)<br />
Managed Fishery<br />
2010<br />
(WCDSF),<br />
2009/10<br />
(Other)<br />
11<br />
Yes Total catches of demersal scalefish have now been<br />
reduced by at least 50% of those of 2005/06. This level<br />
of reduction is expected to sufficiently decrease fishing<br />
mortality to allow rebuilding of the resource, so the stock<br />
is deemed to be recovering. The next stock assessment<br />
(in 2012/13) will determine whether this expected<br />
recovery has translated into a longer term likelihood<br />
of the resource being at, or rebuilding to, an adequate<br />
level.
fishery<br />
Stock<br />
assessment<br />
complete<br />
Breeding<br />
stock<br />
assessment<br />
target catch<br />
(and effort) range in<br />
tonnes (days)<br />
catch (tonnes)<br />
for season reported 1<br />
Season<br />
reported 1<br />
catch<br />
(or effort)<br />
level<br />
acceptable<br />
comments on performance<br />
in reported season<br />
Gascoyne Coast Bioregion<br />
Shark Bay prawn Yes Adequate 1,501 – 2,330 1,545 2010 Yes King and tiger prawns were within the historical target<br />
range.<br />
Exmouth Gulf Yes Adequate 771 – 1,276 779 2010 Yes The total catch was in the target range but catches of<br />
prawn<br />
king prawns were below their individual target level.<br />
Shark Bay<br />
scallop<br />
Yes Adequate 1,250 – 3,000 1,592 2010 Yes The scallop catch was within the target range.<br />
Shark Bay crabs Yes Adequate Under development 852 2009/10 NA Catch comes from a dedicated trap fishery and byproduct<br />
from prawn trawling. Due to recent increases<br />
in total catches, a more detailed assessment is being<br />
undertaken.<br />
Shark Bay beach<br />
seine and mesh<br />
net<br />
Shark Bay<br />
snapper<br />
SUMMARy <strong>OF</strong> <strong>THE</strong> yEAR � S<strong>TO</strong>Ck STATUS AND CATCH RANgES FOR MAjOR COMMERCIAL <strong>FISHERIES</strong><br />
Yes Adequate 235 – 335 249 2010 Yes Total catch was similar to 2009 while total effort<br />
declined slightly. Catch rates of key species were<br />
generally maintained.<br />
Yes Recovering 277 (Quota<br />
management)<br />
(380 – 540 days)<br />
263<br />
(432 days)<br />
plus 63 recreational catch<br />
2010 Yes At current Total Allowable Commercial Catch levels, the<br />
spawning biomass is projected to recover to the target<br />
level by around 2014. The next assessment is currently<br />
scheduled for 2012.<br />
North Coast Bioregion<br />
Onslow prawn Yes Adequate 60 – 180 29 2010 Yes Tiger prawn landings were within the target catch range<br />
but king and endeavour prawn landings were extremely<br />
low and below the target catch range. The low catch was<br />
associated with low fishing effort.<br />
Nickol Bay prawn Yes Adequate 90 – 300 40 2010 Yes Catch of banana prawns were low but within the<br />
projected catch range and at the lower end of the<br />
species target catch range. King and tiger prawn<br />
landings were very low due to limited targeting and low<br />
abundance.<br />
Broome prawn Yes Adequate 55 – 260 3 2010 NA Very low level of effort this year.<br />
Kimberley prawn Yes Adequate 240 – 500 256 2010 Yes Banana prawn catch was within target and projected<br />
range. Tiger and endeavour prawns were slightly below<br />
target ranges due to low effort.<br />
Kimberley gillnet Yes Adequate 25 – 40<br />
57 2010 No The 2009 and 2010 catches of barramundi were both<br />
and barramundi<br />
(barramundi)<br />
above the catch range, due to increased effort levels.<br />
A more detailed assessment of these stocks may be<br />
required.<br />
1 Catch figures supplied for latest year/season available. NA Not assessed.<br />
12
fishery<br />
Northern<br />
demersal<br />
scalefish<br />
Stock<br />
assessment<br />
complete<br />
Breeding<br />
stock<br />
assessment<br />
target catch<br />
(and effort) range in<br />
tonnes (days)<br />
Yes Adequate Total 600 – 1,000<br />
(goldband < 501)<br />
(red emperor < 201)<br />
catch (tonnes)<br />
for season reported 1<br />
Total 1,116<br />
(goldband 522)<br />
(red emperor 141)<br />
Season<br />
reported 1<br />
catch<br />
(or effort)<br />
level<br />
acceptable<br />
comments on performance<br />
in reported season<br />
2010 Yes Total catch was above the upper limit by ~10%, which is<br />
acceptable. The catches of goldband snapper were ~5%<br />
above the target while red emperor was ~30% below<br />
target. Catch ranges for this fishery need revision. A<br />
stock assessment due in 2012/2013 will inform this<br />
revision.<br />
Pilbara fish trawl Yes Adequate 2,000 – 2,800 1,259 2010 No Reduced catch may partly be due to 20% reduction in<br />
effort in Areas 1 and 2 in 2009 and new net designs<br />
that deal with bycatch issues. Cause is yet to be fully<br />
determined.<br />
Pilbara demersal<br />
trap and line<br />
SUMMARy <strong>OF</strong> <strong>THE</strong> yEAR � S<strong>TO</strong>Ck STATUS AND CATCH RANgES FOR MAjOR COMMERCIAL <strong>FISHERIES</strong><br />
Yes Adequate 400 – 600 (trap)<br />
50 – 115 (line)<br />
Mackerel Yes Adequate 410 (Quota<br />
management)<br />
246 – 410<br />
(all except grey<br />
mackerel)<br />
Northern shark Yes Sandbar<br />
shark:<br />
Inadequate<br />
Blacktip<br />
shark:<br />
Uncertain<br />
< 20<br />
(sandbar)<br />
Pearl oyster Yes Adequate 1,555,000 oysters<br />
(Quota management)<br />
(14,071 – 20,551<br />
dive hours)<br />
Beche-de-mer Yes Adequate Sandfish 20 – 100<br />
Redfish 40 – 150<br />
1 Catch figures supplied for latest year/season available. NA Not assessed.<br />
489 (trap)<br />
117 (line)<br />
2010 Yes The trap catch was within the acceptable range. The<br />
line catch is similar to 2009 however the catch of ruby<br />
snapper has increased for two consecutive years. A<br />
stock assessment will be undertaken in 2011.<br />
284 2010 Yes Catch rates are increasing in the Gascoyne/West Coast<br />
and Pilbara and stable in the Kimberley. As the quota<br />
is accumulated over three zones, a catch range will<br />
continue to be used to assess acceptability.<br />
No catch reported. 2009/10 NA Previous management intervention reduced fishing effort<br />
to below target level, but catches of sandbar sharks in<br />
recent years far exceeded their sustainable annual limit<br />
so the breeding stock remains inadequate. No effort<br />
occurred this year.<br />
394,947 oysters (4,447<br />
dive hours)<br />
Sandfish 35<br />
Redfish 86<br />
2010 Yes Pearl oyster catches are up from the previous year’s<br />
historical low, but still only 25% of Total Allowable<br />
Catch (TAC) due to exceptional abundance and market<br />
uncertainty.<br />
2010 Yes Species-specific indicators introduced for the first time in<br />
this fishery.<br />
13
fishery<br />
South Coast Bioregion<br />
South coast<br />
crustacean<br />
Abalone<br />
(greenlip/<br />
brownlip)<br />
Estuarine finfish<br />
(south coast)<br />
Stock<br />
assessment<br />
complete<br />
Breeding<br />
stock<br />
assessment<br />
target catch<br />
(and effort) range in<br />
tonnes (days)<br />
No NA 50 – 80 (southern<br />
rock lobster)<br />
Yes Adequate 213 (Quota<br />
management) (907 –<br />
1,339 days)<br />
catch (tonnes)<br />
for season reported 1<br />
72.7 (southern rock<br />
lobster and deep sea crab<br />
combined)<br />
205<br />
(1,196 days)<br />
Yes Adequate 200 – 500 223<br />
+ 9 crab<br />
Season<br />
reported 1<br />
catch<br />
(or effort)<br />
level<br />
acceptable<br />
comments on performance<br />
in reported season<br />
2009/10 Yes The management arrangements, including the<br />
acceptable catch range, are currently being reviewed.<br />
2010 Yes No issues.<br />
2010 Yes Stock levels of key species are considered adequate.<br />
WA salmon Yes Adequate 1,200 – 2,800 360 2010 Yes Recent catches continue to be low relative to historic<br />
levels, due to low effort from limited market demand. A<br />
review of the target catch range is to be undertaken.<br />
Australian<br />
herring<br />
Albany/King<br />
George Sound<br />
purse seine<br />
Bremer Bay<br />
purse seine<br />
Esperance purse<br />
seine<br />
Southern and<br />
west coast<br />
demersal gillnet<br />
and longline<br />
SUMMARy <strong>OF</strong> <strong>THE</strong> yEAR � S<strong>TO</strong>Ck STATUS AND CATCH RANgES FOR MAjOR COMMERCIAL <strong>FISHERIES</strong><br />
Yes Uncertain 475 – 1,200 (south<br />
coast only)<br />
Yes Adequate 2,683 (Quota<br />
management)<br />
Yes Adequate 1,500 (Quota<br />
management)<br />
Yes Adequate 1,500 (Quota<br />
management)<br />
Yes Gummy and<br />
whiskery<br />
sharks:<br />
Adequate.<br />
Dusky<br />
sharks are<br />
anticipated<br />
to now be<br />
recovering.<br />
Sandbar<br />
shark:<br />
Inadequate<br />
725 – 1,095 (key<br />
species only)<br />
1 Catch figures supplied for latest year/season available. NA Not assessed.<br />
183 (south coast only) 2010 Yes Commercial catch continues to be low relative to historic<br />
levels, due to poor recruitment and low effort levels<br />
resulting from poor markets. A review of the target catch<br />
range is to be undertaken.<br />
1,796 2009/10 Yes Catches increased more than 30% from 2008/09 levels.<br />
Stock levels are considered adequate and catch levels<br />
are acceptable.<br />
422 2009/10 Yes Decline in effort and catch from 2008/09 but stock<br />
considered to be recovering.<br />
429 2009/10 Yes Stock levels are considered adequate and catch levels<br />
are acceptable. Catches more than double that of<br />
2008/09 but remains well below Total Allowable Catch.<br />
996 (key species only) 2009/10 Yes Previous management limited overall fishing effort to<br />
acceptable levels. Gummy shark catch exceeds their<br />
historical target range due to increasing catch rates;<br />
dusky shark catches are within target range; whiskery<br />
catch slightly below acceptable range due to seasonal<br />
closure and effort reductions; catches of sandbar in the<br />
southern part of their distribution are acceptable.<br />
14
fishery<br />
Northern Inland Bioregion<br />
Lake Argyle<br />
catfish<br />
SUMMARy <strong>OF</strong> <strong>THE</strong> yEAR � S<strong>TO</strong>Ck STATUS AND CATCH RANgES FOR MAjOR COMMERCIAL <strong>FISHERIES</strong><br />
Stock<br />
assessment<br />
complete<br />
Breeding<br />
stock<br />
assessment<br />
target catch<br />
(and effort) range in<br />
tonnes (days)<br />
catch (tonnes)<br />
for season reported 1<br />
Yes Adequate 95 – 155 Less than three licences<br />
operated<br />
1 Catch figures supplied for latest year/season available. NA Not assessed.<br />
Season<br />
reported 1<br />
catch<br />
(or effort)<br />
level<br />
acceptable<br />
comments on performance<br />
in reported season<br />
2010 Yes Catch has declined due to reduced effort.<br />
15
SUMMARy <strong>OF</strong> <strong>THE</strong> yEAR � FINANCIAL OvERvIEw<br />
Financial Overview<br />
the financial overview examines the trends in<br />
financial information from 2006/07 through to<br />
2010/11. the analysis is based on the information<br />
provided in the Department of Fisheries’ audited<br />
statement of comprehensive income and statement<br />
of financial position.<br />
The overview is provided to assist readers in<br />
understanding the financial impact of decisions taken<br />
over that period to address emerging issues in the<br />
fisheries sector. These issues include:<br />
• Significant government funding to increase<br />
compliance and research and compliance activity<br />
relating to recreational fishing, commercial fishing<br />
and marine park compliance.<br />
• Significant government support to increase the<br />
financial sustainability for commercial fisheries<br />
in Exmouth Gulf, Shark Bay and the Abrolhos<br />
Islands through the establishment and financing of<br />
Fisheries Adjustment Schemes.<br />
• Management of the recreational fishing sector<br />
through the introduction of revised management<br />
arrangements including the introduction of a<br />
Recreational Fishing from Boat Licence.<br />
• Significant government funding to invest in new<br />
assets or replace ageing assets to support the<br />
delivery of the Department’s services.<br />
• Increasing levels of employee leave liabilities.<br />
16<br />
The ‘Overview of Financial Flows’ figure below<br />
represents the various types of operating and capital<br />
funds received by the Department during the 2010/11<br />
financial year, excluding any carry-overs and internal<br />
funds brought forward from 2009/10. The major<br />
elements of the Department’s operating expenditure<br />
(i.e. day-to-day activity) and capital expenditure for the<br />
2010/11 year can also be seen next to the ‘Total Cost<br />
of Services’ chart.<br />
Note that $m is used as an abbreviation for $million.
SUMMARy <strong>OF</strong> <strong>THE</strong> yEAR � FINANCIAL OvERvIEw<br />
financial 2010-11 Summary SUMMARY 2010/11<br />
OVERVIEW <strong>OF</strong> FINANCIAL FLOWS<br />
Overview of financial flows<br />
Capital contribution ($5.5m), Holding<br />
account draw-downs and internal funds.<br />
Operating Income ($m)<br />
Service<br />
Appropriations<br />
from State<br />
Government<br />
$33m<br />
Commercial<br />
Fisheries Access/<br />
Application Fees<br />
$20m<br />
<strong>DEPARTMENT</strong><br />
<strong>OF</strong> <strong>FISHERIES</strong><br />
Recreational<br />
Fisheries<br />
$6m<br />
Grants<br />
and Other<br />
Income<br />
$7m<br />
Operating<br />
Expenditure<br />
Employee<br />
Benefit<br />
Expenses<br />
$41m<br />
Capital expenditure $5.3m<br />
Supplies<br />
and Services<br />
$21m<br />
All Other<br />
Expenses<br />
$10m<br />
Operating Expenses ($m)<br />
Total cost of<br />
services $72m<br />
Capital Expenditure ($’000)<br />
Vessels<br />
$827k<br />
Physical<br />
Infrastructure<br />
$1,716k<br />
Information<br />
Systems<br />
$1,010k<br />
Plant and<br />
Equipment<br />
$1,784k<br />
Compliance<br />
and Education<br />
$27m<br />
Research and<br />
Monitoring<br />
$24m<br />
Aquatic<br />
Management<br />
$21m<br />
Total Cost of Services ($m)<br />
Marine<br />
Safety<br />
$4m<br />
17
SUMMARy <strong>OF</strong> <strong>THE</strong> yEAR � FINANCIAL OvERvIEw<br />
financial Performance<br />
Financial performance can be identified by<br />
comparing ‘what’ and ‘where’ the Department<br />
spent against its income sources. The cost to the<br />
Government of the Department over the years can<br />
also be compared against the total cost of services<br />
and outcomes that the Department has delivered.<br />
The following is a summary of the financial<br />
performance and position of the Department for the<br />
year ended 30 June 2011:<br />
• Total income excluding resources received<br />
free of charge decreased by three per cent<br />
($65.7m in 2010/11; $67.5m in 2009/10),<br />
and operating expenses increased by three<br />
per cent ($71.8m in 2010/11; $69.5m in<br />
2009/10). The agency’s net cost of services<br />
has therefore increased by two per cent<br />
($38.8m in 2010/11; $38.05m in 2009/10).<br />
total cost of services<br />
Total cost of services facilitates an assessment of<br />
performance by showing the full cost of resources<br />
consumed in operations. It shows the total cost of<br />
operations to the State prior to recovery of costs<br />
through licence fees, user charges and independent<br />
sources of revenues.<br />
The trend in the Department’s total cost of<br />
services since 2007 is shown in Figure 2a.<br />
The Department’s total cost of services has<br />
increased by 34 per cent ($18m) since 2006/07.<br />
Figure 2a. total cost of services – five-year trend<br />
$ '000 Total Cost of Services (a)<br />
80,000<br />
70,000<br />
60,000<br />
50,000<br />
40,000<br />
30,000<br />
20,000<br />
10,000<br />
0<br />
table 2a.<br />
5 Year Average<br />
53,799<br />
60,400<br />
34%<br />
67,672<br />
69,575<br />
71,891<br />
2006/07 2007/08 2008/09 2009/10 2010/11<br />
YEAR<br />
totAl coSt of ServIceS –<br />
5 yeAr treNd<br />
2006/07<br />
$’000<br />
2007/08<br />
$’000<br />
2008/09<br />
$’000<br />
2009/10<br />
$’000<br />
2010/11<br />
$’000<br />
5-year<br />
change<br />
$’000<br />
Total Cost of Services (a) 53,799 60,400 67,672 69,575 71,891 18,092<br />
(a) Capital user charge removed from 2006/07 total cost of services for comparative purposes.<br />
18
SUMMARy <strong>OF</strong> <strong>THE</strong> yEAR � FINANCIAL OvERvIEw<br />
The cost of services is three per cent more<br />
than last year ($71.8m in 2010/11; $69.5m in<br />
2009/10). This cost includes depreciation and non<br />
cash items consumed in delivering services.<br />
The $18m increase in the Department’s total<br />
cost of services over the last five years ($71.9m<br />
in 2010/11; $53.8m in 2006/07) has been<br />
significantly impacted by major financial movements<br />
illustrated in Figure 2b.<br />
The figure shows the total cost of services in<br />
2006/07 and the major financial movements that<br />
have contributed to the cumulative increase in the<br />
total cost of services ending in 2010/11.<br />
Major policy decisions, an increase on<br />
demand for services, and cost escalations from<br />
Consumer Price Index-related increases and award<br />
adjustments are the largest contributors to the<br />
overall change in total cost of services.<br />
The introduction of the Recreational Fishing<br />
from Boat Licence in 2010 has resulted in<br />
additional activity in the area of recreational fishing.<br />
This has further contributed to the increase in the<br />
total cost of services for 2010/11 under major<br />
financial movement ‘Major policy decisions’ (see<br />
Figure 2b and Table 2b) although recreational<br />
licence fees help recover a proportion of the<br />
increase in costs for the related activities.<br />
See also Figure 2c and Table 2c for the list of<br />
major policy decisions that have impacted on total<br />
cost of services since 2006/07.<br />
Figure 2b. Summary of major financial movements between total cost of services<br />
in 2006/07 and 2010/11<br />
$' 000<br />
70,000<br />
60,000<br />
50,000<br />
40,000<br />
30,000<br />
20,000<br />
10,000<br />
0<br />
table 2b.<br />
53,799<br />
Total cost of<br />
services 2006/07<br />
-3,051<br />
One-off expenditure<br />
decrease from<br />
2006/07<br />
-2,032<br />
Shared services<br />
and other<br />
savings harvests<br />
9,095<br />
Major policy<br />
decisions (a)<br />
3,383<br />
Cost escalation<br />
and award<br />
adjustments (b)<br />
MAJOR FINANCIAL MOVEMENTS<br />
2,200<br />
One-off increase<br />
in employee<br />
long service leave<br />
entitlements (c)<br />
8,497 71,891<br />
Services offset<br />
by revenue and<br />
othercosts<br />
SummAry of mAJor fINANcIAl movemeNtS BetweeN totAl<br />
coSt of ServIceS IN 2006/07 ANd 2010/11<br />
$’000<br />
Major policy decisions (a) 9,095<br />
Cost escalation and award adjustments (b) 3,383<br />
One-off increase in employee long service leave entitlements (c) 2,200<br />
Services offset by revenue and other costs<br />
Less<br />
8,497<br />
One-off expenditure decrease from 2006/07 (3,051)<br />
Shared services and other savings harvests (2,032)<br />
totAl 18,092<br />
(a) See Table 1C for a list of policy decisions implemented over the last five years.<br />
(b) Cost escalations are mainly due to non salary related costs whilst award<br />
adjustments have increased salary costs.<br />
(c) See also notes with respect to Figure 21 ‘Employee Benefits Provision Ratio’.<br />
Total cost<br />
of services<br />
2010/11<br />
19
SUMMARy <strong>OF</strong> <strong>THE</strong> yEAR � FINANCIAL OvERvIEw<br />
Figure 2c. Major activity-based policy decisions – impact on total cost of services<br />
Finfish compliance 23%<br />
Management<br />
arrangements for<br />
recreational fishing 43%<br />
table 2c.<br />
mAJor ActIvIty-BASed PolIcy decISIoNS $’000<br />
Management arrangements for recreational fishing 3,900<br />
Finfish compliance 2,082<br />
West Coast and Gascoyne scalefish research and monitoring 1,330<br />
Compliance resources 742<br />
Ningaloo, Nornalup and Walpole inlets marine parks 658<br />
Aquatic biosecurity 383<br />
totAl 9,095<br />
West Coast and Gascoyne<br />
scalefish research<br />
and monitoring 15%<br />
Compliance<br />
resources 8%<br />
Ningaloo, Nornalup<br />
and Walpole inlets<br />
marine parks 7%<br />
Aquatic biosecurity 4%<br />
20
SUMMARy <strong>OF</strong> <strong>THE</strong> yEAR � FINANCIAL OvERvIEw<br />
Net cost of services<br />
Net cost of services facilitates an assessment of<br />
performance by showing the net cost of resources<br />
consumed in operations. It shows the extent to which<br />
these costs were recovered through licence fees,<br />
user charges and independent sources of revenues,<br />
and the net cost of operations to the State.<br />
The trend in the Department’s net cost of<br />
services since 2007 is shown in Figure 3.<br />
The increase in the Department’s net cost<br />
of services, ($38.8m in 2010/11; $28.3m in<br />
2006/07) is funded from Consolidated Account<br />
service appropriations and has been significantly<br />
impacted by the major financial movements as<br />
described at ‘Total Cost of Services’ (see Figure 2a<br />
and Table 2a).<br />
Figure 3. Net cost of services – five-year trend<br />
$ '000<br />
80,000<br />
70,000<br />
60,000<br />
50,000<br />
40,000<br />
30,000<br />
20,000<br />
10,000<br />
0<br />
table 3.<br />
Revenues Other than Service Appropriations – (LHS)<br />
Total Cost of Services (a) – (LHS)<br />
Net Cost of Services (RHS)<br />
28,336<br />
32,898<br />
38,666 38,058 38,831<br />
2006/07 2007/08 2008/09 2009/10 2010/11<br />
YEAR<br />
5,000<br />
0<br />
21<br />
NET COST<br />
<strong>OF</strong> SERVICES<br />
($'000)<br />
40,000<br />
35,000<br />
30,000<br />
25,000<br />
20,000<br />
15,000<br />
10,000<br />
Net coSt of ServIceS – 5-yeAr treNd<br />
2006/07 2007/08 2008/09 2009/10 2010/11<br />
$’000 $’000 $’000 $’000 $’000<br />
Total Cost of Services (a) – (LHS) 53,799 60,400 67,672 69,575 71,891<br />
Revenues Other than Service Appropriations (LHS) 25,463 27,502 29,006 31,517 33,060<br />
Net Cost of Services (RHS) 28,336 32,898 38,666 38,058 38,831<br />
(a) Capital user charge removed from 2006/07 total cost of services for comparative purposes.
SUMMARy <strong>OF</strong> <strong>THE</strong> yEAR � FINANCIAL OvERvIEw<br />
Income sources – 2010/11<br />
Service appropriations from State Government fund<br />
50 per cent of the Department’s recurrent day-to-day<br />
activity or operational costs as shown in Figure 4.<br />
Figure 4. Income sources – 2010/11<br />
Commercial<br />
Fisheries<br />
30.1%<br />
table 4.<br />
Service<br />
Appropriations from<br />
State Government<br />
49.7%<br />
2010/11 ($65.83 MILLION)<br />
Recreational<br />
Fisheries<br />
9.3%<br />
External Grants and<br />
Contributions<br />
4.5%<br />
Other<br />
6.4%<br />
Other Income (a)<br />
5.6%<br />
INcome SourceS 2010/11<br />
2010/11<br />
$’000<br />
2010/11<br />
%<br />
Service Appropriations from State Government 32,770 49.7%<br />
Commercial Fisheries 19,769 30.1%<br />
Recreational Fisheries 6,123 9.3%<br />
External Grants and Contributions 2,987 4.5%<br />
Interest 491 0.8%<br />
Other Income (a) 3,690 5.6%<br />
totAl 65,830 100%<br />
(a) Resources received free of charge are excluded from Income Sources.<br />
Interest<br />
0.8%<br />
22
SUMMARy <strong>OF</strong> <strong>THE</strong> yEAR � FINANCIAL OvERvIEw<br />
Income sources – five-year trend<br />
Total income excluding resources received free of<br />
charge decreased by three per cent ($65.7m in<br />
2010/11; $67.5m in 2009/10) due mainly to a<br />
reduction in appropriation funding from the State<br />
Government.<br />
Revenues from other sources come from<br />
the commercial fishing industry through access<br />
fees, recreational fishers, external funding for<br />
research and management from the Commonwealth<br />
Government, and ‘Other Income’ (which includes<br />
interest from revenue). The amount of revenue<br />
received from independent sources has increased<br />
by five per cent ($33m in 2010/11; $31.5m in<br />
2009/10).<br />
Figure 5 presents an overview of the total<br />
revenue received over the last five financial years<br />
highlighting that, with the exception of fees paid<br />
by recreational fishers, contributions from other<br />
sources has remained constant in the past five<br />
years.<br />
Figure 6 shows how non appropriation funding<br />
compared to total income received each year since<br />
2006/07.<br />
The increase in revenue from recreational<br />
fishers results from the revised recreational fishing<br />
arrangements introduced in 2010.<br />
Figure 5. Income sources – five-year trend<br />
$' 000<br />
80,000<br />
70,000<br />
60,000<br />
50,000<br />
40,000<br />
30,000<br />
20,000<br />
10,000<br />
table 5.<br />
Service Appropriations from State Government Commercial Fisheries<br />
Recreational Fisheries External Grants and Contributions<br />
Other Income including Interest Revenue<br />
5-Year Total:<br />
$307.7M<br />
0<br />
2006/07 2007/08 2008/09 2009/10 2010/11<br />
YEAR<br />
INcome SourceS – 5-yeAr treNd<br />
2006/07<br />
$’000<br />
2007/08<br />
$’000<br />
2008/09<br />
$’000<br />
2009/10<br />
$’000<br />
2010/11<br />
$’000<br />
Service Appropriations from State Government 29,876 31,812 30,770 36,029 32,676<br />
Commercial Fisheries 18,265 19,289 18,687 15,662 19,769<br />
Recreational Fisheries 2,379 2,680 2,746 4,986 6,123<br />
External Grants and Contributions 2,355 2,601 4,681 6,633 2,987<br />
Other Income including Interest Revenue 2,464 2,932 2,892 4,236 4,181<br />
totAl 55,339 59,314 59,776 67,546 65,736<br />
23
SUMMARy <strong>OF</strong> <strong>THE</strong> yEAR � FINANCIAL OvERvIEw<br />
Figure 6. State Government funding – five-year trend<br />
$' 000<br />
40,000<br />
35,000<br />
30,000<br />
25,000<br />
20,000<br />
15,000<br />
10,000<br />
5,000<br />
0<br />
table 6.<br />
Other Income Sources – (Y axis on LHS of graph)<br />
Service Appropriations from State Government – (Y axis on LHS of graph)<br />
Other Income Sources as a % of State Govt Funding – (Y axis on RHS of graph)<br />
46%<br />
46%<br />
49%<br />
47%<br />
50%<br />
2006/07 2007/08 2008/09 2009/10 2010/11<br />
YEAR<br />
StAte goverNmeNt fuNdINg –<br />
2006/07 2007/08 2008/09 2009/10 2010/11<br />
5-yeAr treNd<br />
$’000 $’000 $’000 $’000 $’000<br />
Service Appropriations from State<br />
Government – (LHS)<br />
29,876 31,812 30,770 36,029 32,676<br />
Other Income Sources – (LHS) 25,463 27,502 29,006 31,517 33,060<br />
Total Annual Funding 55,339 59,314 59,776 67,546 65,736<br />
Other Income Sources as a % of<br />
State Govt Funding – (RHS)<br />
46% 46% 49% 47% 50%<br />
24<br />
50%<br />
49%<br />
48%<br />
47%<br />
46%<br />
45%<br />
44%<br />
43%
SUMMARy <strong>OF</strong> <strong>THE</strong> yEAR � FINANCIAL OvERvIEw<br />
User fees and charges<br />
The amount of revenue received from fees and<br />
charges and other income (excluding grants and<br />
contributions and interest revenue) has increased<br />
by 19 per cent ($29.5m in 2010/11; $24.7m in<br />
2009/10). The categories of user fees and charges<br />
which comprise these non-State Government<br />
funding sources are displayed against comparative<br />
figures for the 2010/11 financial year in Figure 7.<br />
The increase in recreational licence fees is<br />
a result of the full-year impact of the introduction<br />
of a Recreational Fishing from Boat Licence. The<br />
increase in commercial access fees is the result<br />
of the fees returning to a usual level following<br />
adjustments made in the 2009/10 year to offset<br />
impacts of the ‘Global Financial Crisis’, particularly<br />
in the West Coast rock lobster and pearling sectors.<br />
Figure 7. User fees and charges<br />
Application Fees<br />
table 7.<br />
User Fees<br />
and Charges<br />
Other Income<br />
Recreational<br />
Licence Fees<br />
Access Fees<br />
$' 000<br />
2010/11 ($29.51 MILLION)<br />
2010/11<br />
2009/10<br />
0 5,000 10,000 15,000 20,000<br />
uSer feeS ANd chArgeS 2009/10 2010/11<br />
$’000 $’000<br />
Access Fees 14,741 18,466<br />
Application Fees 921 1,303<br />
Recreational Licence Fees 4,986 6,123<br />
Other Income 4,099 3,622<br />
totAl 24,747 29,514<br />
25
SUMMARy <strong>OF</strong> <strong>THE</strong> yEAR � FINANCIAL OvERvIEw<br />
total cost of service<br />
The Department has four services:<br />
• Aquatic Management;<br />
• Compliance and Education;<br />
• Research and Monitoring; and<br />
• Marine Safety.<br />
Figure 8 shows how much was expended on<br />
each service in 2010/11 , against comparative<br />
figures for the 2009/10 financial year.<br />
Figure 8. Services – total cost of service<br />
$' 000<br />
35,000<br />
30,000<br />
25,000<br />
20,000<br />
15,000<br />
10,000<br />
5,000<br />
0<br />
table 8.<br />
2010/11 ($71.89 MILLION)<br />
Aquatic<br />
Management<br />
Compliance and<br />
Education<br />
SERVICE<br />
Research and<br />
Monitoring<br />
ServIceS – totAl coSt of ServIce<br />
2009/10<br />
$’000<br />
2010/11<br />
$’000<br />
Aquatic Management 16,932 20,715<br />
Compliance and Education 28,603 26,704<br />
Research and Monitoring 22,909 24,040<br />
Marine Safety 1,131 432<br />
totAl 69,575 71,891<br />
2010/11<br />
2009/10<br />
Marine Safety<br />
26
SUMMARy <strong>OF</strong> <strong>THE</strong> yEAR � FINANCIAL OvERvIEw<br />
expenditure – five-year trend<br />
Figure 9a presents an overview of the day-to-day<br />
activity (recurrent) expenditure over the last five<br />
years highlighting that expenditure has increased<br />
since 2006/07.<br />
Figure 9a. expenditure – five-year trend<br />
$' 000<br />
80,000<br />
70,000<br />
60,000<br />
50,000<br />
40,000<br />
30,000<br />
20,000<br />
10,000<br />
0<br />
table 9a.<br />
2006/07 2007/08 2008/09 2009/10 2010/11<br />
YEAR<br />
eXPeNdIture - 5-yeAr treNd<br />
2006/07<br />
$’000<br />
2007/08<br />
$’000<br />
2008/09<br />
$’000<br />
2009/10<br />
$’000<br />
2010/11<br />
$’000<br />
Employee Benefit Expenses 29,686 31,578 36,071 38,027 40,516<br />
Supplies and Services 15,271 17,216 17,378 17,750 21,352<br />
Depreciation and Amortisation 2,018 3,211 4,356 3,262 3,790<br />
Finance Costs 89 76 59 140 253<br />
Accommodation Expenses 1,273 1,867 1,996 2,092 2,071<br />
Grants and Subsidies 3,992 3,752 4,172 5,099 3,476<br />
FAS Buy-backs 345 1,491 3,176 2,566 170<br />
Other Expenses 1,125 1,209 464 639 263<br />
eXPeNdIture 53,799 60,400 67,672 69,575 71,891<br />
27
SUMMARy <strong>OF</strong> <strong>THE</strong> yEAR � FINANCIAL OvERvIEw<br />
expenses by type<br />
Figure 9b. expenses by type<br />
Figure 9b shows Departmental operating<br />
expenditure by type against comparative figures for<br />
the 2009/10 and 2010/11 years.<br />
Expense Categories<br />
Fisheries Adjustment<br />
2010/11<br />
2009/10<br />
Accommodation Expenses<br />
Employee Benefit Expenses<br />
table 9b.<br />
Scheme Buy–backs<br />
Finance Costs<br />
Other Expenses<br />
Grants and Subsidies<br />
Depreciation<br />
and Amortisation<br />
Supplies and Services<br />
$' 000<br />
0<br />
5,000<br />
10,000<br />
15,000<br />
20,000<br />
25,000<br />
30,000<br />
35,000<br />
40,000<br />
28<br />
45,000<br />
eXPeNSeS By cAtegory<br />
2006/07<br />
$’000<br />
2007/08<br />
$’000<br />
2008/09<br />
$’000<br />
2009/10<br />
$’000<br />
2010/11<br />
$’000<br />
Employee Benefit Expenses 29,686 31,578 36,071 38,027 40,516<br />
Supplies and Services 15,271 17,216 17,378 17,750 21,352<br />
Depreciation and Amortisation 2,018 3,211 4,356 3,262 3,790<br />
Grants and Subsidies 3,992 3,752 4,172 5,099 3,476<br />
Accommodation Expenses 1,273 1,867 1,996 2,092 2,071<br />
Other Expenses 1,125 1,209 464 639 263<br />
Finance Costs 89 76 59 140 253<br />
FIisheries Adjustment Scheme Buy-backs 345 1,491 3,176 2,566 170<br />
totAl eXPeNdIture 53,799 60,400 67,672 69,575 71,891
SUMMARy <strong>OF</strong> <strong>THE</strong> yEAR � FINANCIAL OvERvIEw<br />
employee benefit expenses – wages and<br />
salaries<br />
Figure 10 presents an overview of the wages<br />
and salaries expenditure over the last five years<br />
highlighting that expenditure has increased by<br />
30 per cent since 2007.<br />
Figure 10. employee benefit expenses – wages and salaries five-year trend<br />
$' 000<br />
35,000<br />
30,000<br />
25,000<br />
20,000<br />
15,000<br />
10,000<br />
5,000<br />
0<br />
table 10.<br />
Wages and Salaries<br />
2006/07 2007/08 2008/09 2009/10 2010/11<br />
emPloyee BeNefIt eXPeNSeS – wAgeS<br />
ANd SAlArIeS 5-yeAr treNd<br />
YEAR<br />
29<br />
2006/07 2007/08 2008/09 2009/10 2010/11<br />
$’000 $’000 $’000 $’000 $’000<br />
Wages and Salaries 22,668 24,784 27,306 29,582 29,609
SUMMARy <strong>OF</strong> <strong>THE</strong> yEAR � FINANCIAL OvERvIEw<br />
employee benefit expenses – annual leave,<br />
long service leave and superannuation<br />
Figure 11 presents an overview of the other<br />
employee benefit expenditure over the last five<br />
years, highlighting that long service leave expense<br />
has increased by two and a half times the amount<br />
in 2009/10.<br />
This increase in long service leave is due to an<br />
actuarial assessment that:<br />
• Employees working for three years are likely<br />
to continue to a point where they earn long<br />
service leave, compared to five years in the<br />
previous assessment.<br />
• Employees who have worked for 16 or more<br />
years in the WA public service are likely to<br />
remain employed in the public service.<br />
• The future cost of leave when paid out or<br />
taken will be higher, due to award adjustments<br />
and inflation factors.<br />
The increase in long service leave expense<br />
resulting from a change in long service leave<br />
recognition criteria should only be a once-off impact<br />
for 2010/11.<br />
Figure 11. employee benefit expenses – annual leave, long service leave<br />
and superannuation<br />
$' 000<br />
3,500<br />
3,000<br />
2,500<br />
2,000<br />
1,500<br />
1,000<br />
500<br />
0<br />
table 11.<br />
Superannuation<br />
Long Service Leave<br />
2006/07 2007/08 2008/09 2009/10 2010/11<br />
YEAR<br />
Annual Leave<br />
Other Employee Related Expenses<br />
emPloyee BeNefIt eXPeNSeS –<br />
2006/07 2007/08 2008/09 2009/10 2010/11<br />
ANNuAl leAve, loNg ServIce leAve<br />
ANd SuPerANNuAtIoN<br />
$’000 $’000 $’000 $’000 $’000<br />
Superannuation 3,244 2,494 2,877 3,028 3,149<br />
Long Service Leave 249 332 1,035 710 2,578<br />
Annual Leave 2,404 2,298 3,035 2,932 2,846<br />
Other Employee-Related Expenses 1,121 1,670 1,818 1,775 2,334<br />
totAl other emPloyee BeNefIt eXPeNSeS 29,686 31,578 36,071 38,027 40,516<br />
30
SUMMARy <strong>OF</strong> <strong>THE</strong> yEAR � FINANCIAL OvERvIEw<br />
Capital expenditure<br />
Figure 12 presents an overview of capital<br />
expenditure over the last five years highlighting that<br />
capital expenditure fell by 39 per cent ($3.45m)<br />
compared to 2009/10. The decreased expenditure<br />
is mainly due to some 2010/11 financial year<br />
expenditure, namely construction of the Denham<br />
building being deferred to 2011/12.<br />
Figure 12. Capital expenditure – five-year trend<br />
$' 000<br />
10,000<br />
9,000<br />
8,000<br />
7,000<br />
6,000<br />
5,000<br />
4,000<br />
3,000<br />
2,000<br />
1,000<br />
0<br />
table 12.<br />
2006/07 2007/08 2008/09 2009/10 2010/11<br />
YEAR<br />
cAPItAl eXPeNdIture – 5-yeAr treNd<br />
2006/07<br />
$’000<br />
2007/08<br />
$’000<br />
2008/09<br />
$’000<br />
2009/10<br />
$’000<br />
2010/11<br />
$’000<br />
Capital Expenditure 4,086 6,287 6,790 8,792 5,337<br />
31
SUMMARy <strong>OF</strong> <strong>THE</strong> yEAR � FINANCIAL OvERvIEw<br />
Capital expenditure by asset class<br />
Figure 13 shows departmental capital expenditure<br />
by asset class over the last five years.<br />
Figure 13. Capital expenditure by asset class<br />
$' 000<br />
4,500<br />
4,000<br />
3,500<br />
3,000<br />
2,500<br />
2,000<br />
1,500<br />
1,000<br />
500<br />
0<br />
table 13.<br />
Information Systems<br />
Plant and Equipment<br />
2006/07 2007/08 2008/09 2009/10 2010/11<br />
YEAR<br />
Physical Infrastructure<br />
Vessels<br />
cAPItAl eXPeNdIture By ASSet clASS<br />
2006/07<br />
$’000<br />
2007/08<br />
$’000<br />
2008/09<br />
$’000<br />
2009/10<br />
$’000<br />
2010/11<br />
$’000<br />
Information Systems 238 291 436 926 1,010<br />
Plant and Equipment 990 885 798 393 1,784<br />
Physical Infrastructure 2,223 4,223 3,782 3,510 1,716<br />
Vessels 635 888 1,774 3,963 827<br />
cAPItAl eXPeNdIture 4,086 6,287 6,790 8,792 5,337<br />
32
SUMMARy <strong>OF</strong> <strong>THE</strong> yEAR � FINANCIAL OvERvIEw<br />
financial Position<br />
The Statement of Financial Position shows what the<br />
Department owns (assets) as well as owes (liabilities).<br />
This is useful in assessing and analysing how good the<br />
Department is at managing its resources.<br />
Financial position – five-year trend<br />
Figure 14 shows the value of the assets and liabilities,<br />
and net assets of the Department over the last five<br />
financial years.<br />
The net assets of the Department is the difference<br />
between total assets and total liabilities and represents<br />
the residual interest in the assets after deducting the<br />
probable call on these resources, represented by liabilities.<br />
Under the Fisheries Adjustment Schemes Act 1987<br />
the Department has the capacity to reduce effort in a<br />
fishery by acquiring commercial fishing authorisations.<br />
The Act allows the Department to borrow money from<br />
the Treasurer to purchase the authorisations. The<br />
fishers remaining in the relevant fisheries are required<br />
to pay additional fees to recover the outlays incurred<br />
by the Department. Under these schemes, outstanding<br />
amounts owing from fishers as at 30 June of the<br />
financial year are recognised as ‘Amounts Receivable’.<br />
In the 2010/11 year significant acquisitions<br />
occurred in the Shark Bay prawn, Shark Bay scallop and<br />
Abrolhos Island trawl fisheries. The borrowings relating<br />
to these schemes and the recognition of associated<br />
amounts receivable has impacted both assets and<br />
liabilities at 30 June 2011.<br />
Figure 14. Financial position – five-year trend<br />
$ '000<br />
120,000<br />
100,000<br />
80,000<br />
60,000<br />
40,000<br />
20,000<br />
0<br />
45,431<br />
Assets<br />
Liabilities<br />
NET ASSETS<br />
63,887<br />
2006/07 2007/08 2008/09 2009/10 2010/11<br />
YEAR<br />
59,915<br />
61,764<br />
61,185<br />
33
SUMMARy <strong>OF</strong> <strong>THE</strong> yEAR � FINANCIAL OvERvIEw<br />
Asset categories<br />
The Department’s assets as at 30 June 2011<br />
are made up of property, plant and equipment<br />
(52 per cent), Fisheries Adjustment Scheme and<br />
trade receivables (35 per cent), cash (five per cent),<br />
and other assets like pre-payments and debtors<br />
(eight per cent). This is shown in Figure 15 against<br />
comparative figures for 2010/11.<br />
Fisheries Adjustment Scheme ‘receivables’<br />
relates to money owed to the Department from<br />
fisheries in Abrolhos Island, Exmouth and Shark<br />
Bay. This debt will be completely recovered in 2019.<br />
See also notes with respect to Figure 14.<br />
Figure 15. Asset categories<br />
As at 30 June 2011 and 30 June 2010<br />
Asset categories<br />
Cash<br />
Other Assets<br />
Receivables<br />
Property, Plant and<br />
Equipment<br />
$ '000<br />
0<br />
table 14.<br />
10,000<br />
20,000<br />
30,000<br />
40,000<br />
50,000<br />
2010/11<br />
2009/10<br />
60,000<br />
ASSet cAtegorIeS<br />
2009/10<br />
$’000<br />
2010/11<br />
$’000<br />
2010/11<br />
%<br />
Property, Plant and Equipment 59,384 59,452 52%<br />
Receivables 4,895 39,990 35%<br />
Other Assets 7,518 8,737 8%<br />
Cash 5,480 5,825 5%<br />
totAl ASSetS 77,277 114,004 100%<br />
70,000<br />
34
SUMMARy <strong>OF</strong> <strong>THE</strong> yEAR � FINANCIAL OvERvIEw<br />
Liability categories<br />
The liabilities of the Department are mainly<br />
employee entitlements (21 per cent) and<br />
borrowings under the Fisheries Adjustment Scheme<br />
(72 per cent). This is shown in Figure 16.<br />
The amount ‘owed’ under Fisheries<br />
Adjustment Scheme will reduce in the out-years with<br />
the final instalments due in 2018/19.<br />
See also notes with respect to Figure 14.<br />
Figure 16. Liability categories<br />
As at 30 June 2011 and 30 June 2010<br />
Liability categories<br />
Other Liabilities<br />
Payables<br />
Employee Benefit<br />
Provisions<br />
Borrowings<br />
$ '000<br />
0<br />
5,000<br />
table 15.<br />
10,000<br />
15,000<br />
20,000<br />
25,000<br />
30,000<br />
2010/11<br />
2009/10<br />
35,000<br />
lIABIlIty cAtegorIeS<br />
2009/10<br />
$’000<br />
2010/11<br />
$’000<br />
2010/11<br />
%<br />
Borrowings 4,027 37,765 72%<br />
Employee Benefit Provisions 8,845 11,274 21%<br />
Payables 1,907 2,607 5%<br />
Other Liabilities 734 1,173 2%<br />
totAl lIABIlItIeS 15,513 52,819 100%<br />
40,000<br />
35
SUMMARy <strong>OF</strong> <strong>THE</strong> yEAR � FINANCIAL OvERvIEw<br />
Bank account composition<br />
Figure 17 shows what accounts make up the<br />
amounts showing as cash assets at 30 June 2011.<br />
Figure 17. Bank account composition<br />
As at 30 June 2011 ($5.82 million)<br />
Fisheries Research<br />
and Development<br />
Corporation Account<br />
24.1% Salaries Suspense<br />
Account<br />
12%<br />
table 16.<br />
Fisheries Research<br />
and Development<br />
Account<br />
59.9%<br />
Other<br />
4%<br />
Fisheries Adjustment<br />
Schemes Trust<br />
Account 4%<br />
BANK AccouNt comPoSItIoN<br />
2010/11<br />
$’000<br />
2010/11<br />
%<br />
Fisheries Research and Development Account 3,486 59.9%<br />
Fisheries Research and Development Corporation Account 1,406 24.1%<br />
Fisheries Adjustment Schemes Trust Account 231 4.0%<br />
Recreational Fishing Account 10 0.2%<br />
AFMA Account 20 0.3%<br />
Salaries Suspense Account 672 11.5%<br />
totAl 5,825 100%<br />
AFMA<br />
Recreational<br />
Fishing<br />
36
SUMMARy <strong>OF</strong> <strong>THE</strong> yEAR � FINANCIAL OvERvIEw<br />
employee benefit provisions ratio<br />
Employee entitlements are what is owed to<br />
employees for annual and long service leave. The<br />
Department has had increasing staffing levels<br />
since 2007 as well as increasing salary levels. The<br />
liability for employee entitlements has increased by<br />
27 per cent in the 2010/11 financial year mainly<br />
due to an actuarial assessment of long service<br />
leave, which resulted in an increase in the provision<br />
and leave expense.<br />
The employee benefit provisions ratio in<br />
Figure 18 is the total employee benefit provisions<br />
divided by equity. As a result of increasing long<br />
service leave, this ratio has also increased by four<br />
percentage points in 2010/11.<br />
The Department has been working in recent<br />
years to reduce its leave liability in accordance<br />
with Government policy and this will continue into<br />
the future.<br />
Figure 18. employee benefit provisions ratio<br />
$' 000<br />
12,000<br />
10,000<br />
8,000<br />
6,000<br />
4,000<br />
2,000<br />
0<br />
table 17.<br />
Employee Benefit Provisions – (LHS)<br />
Employee Benefit Provisions Ratio (%) – (RHS)<br />
2006/07 2007/08 2008/09 2009/10 2010/11<br />
YEAR<br />
emPloyee BeNefIt ProvISIoNS rAtIo<br />
2006/07<br />
$’000<br />
2007/08<br />
$’000<br />
2008/09<br />
$’000<br />
2009/10<br />
$’000<br />
2010/11<br />
$’000<br />
Employee Benefit Provisions – (LHS) 7,390 7,932 8,661 8,845 11,274<br />
Employee Benefit Provisions Ratio (%) – (RHS) 16% 12% 14% 14% 18%<br />
37<br />
20%<br />
18%<br />
16%<br />
14%<br />
12%<br />
10%<br />
8%<br />
6%<br />
4%<br />
2%<br />
0%
SUMMARy <strong>OF</strong> <strong>THE</strong> yEAR � FISH PIES (AND O<strong>THE</strong>R gRAPHS)<br />
Fish Pies (and Other Graphs)<br />
the following is a snapshot of fisheries management and operations carried out by the Department of Fisheries, represented<br />
graphically using pie charts and other graphs.<br />
Values of the State’s major fisheries and aquaculture<br />
Figure 19. Managed Fisheries by Gross<br />
Value Product ($’000) in<br />
2009/10<br />
$224,902<br />
83%<br />
$47,106<br />
17%<br />
Major Managed Commercial Fishery<br />
Minor Managed Commercial Fishery<br />
Figure 20. Major Commercial Fisheries by<br />
Gross Value Product ($’000) in<br />
2009/10<br />
$183,013 $224,902<br />
81% 83%<br />
$47,106 $19,100<br />
17% 9%<br />
West Coast Rock Lobster<br />
Shark Bay Prawn<br />
Abalone Limited Entry<br />
Exmouth Gulf Prawn<br />
Shark Bay Scallop<br />
$9,227<br />
4%<br />
$8,045<br />
4%<br />
$5,517<br />
2%<br />
Figure 21. Minor Commercial Fisheries by<br />
Gross Value Product ($’000) in<br />
2009/10<br />
$4,733<br />
10%<br />
$183,013<br />
70%<br />
Other Minor Fisheries<br />
Joint Authority Southern<br />
Demersal Gillnet and Longline<br />
Northern Demersal Scalefish<br />
Pilbara Trawl<br />
$5,491<br />
12%<br />
$3,617<br />
8%<br />
38
SUMMARy <strong>OF</strong> <strong>THE</strong> yEAR � FISH PIES (AND O<strong>THE</strong>R gRAPHS)<br />
Figure 22. Aquaculture and Pearling by Gross<br />
Value Product ($’000) in 2009/10<br />
$99,000<br />
91%<br />
Pearls<br />
Other Aquaculture<br />
$10,301<br />
9%<br />
Figure 23. Major Commercial Fisheries – Gross Value Product ($) per ton of<br />
catch in 2009/10<br />
Shark Bay Prawn $9<br />
Average GVP ($) per ton of<br />
catch for major commercial<br />
fisheries in 2009/10<br />
Exmouth Gulf Prawn<br />
$10<br />
Shark Bay Scallop<br />
West Coast Rock Lobster<br />
Abalone Limited Entry<br />
$4<br />
$31<br />
$35<br />
$0 $5 $10 $15 $20 $25 $30 $35 $40<br />
39
SUMMARy <strong>OF</strong> <strong>THE</strong> yEAR � FISH PIES (AND O<strong>THE</strong>R gRAPHS)<br />
Summary of compliance and educative contacts within<br />
the fisheries bioregions during the 2010/11 financial year<br />
Figure 24. Number of contacts (in thousands) by the Department of<br />
Fisheries’ Fisheries and Marine Officers in each fisheries<br />
bioregion (shown using bars) and number of patrol hours<br />
(in thousands) recorded (shown using a line)<br />
Contacts (thousands)<br />
90<br />
80<br />
70<br />
60<br />
50<br />
40<br />
30<br />
20<br />
10<br />
0<br />
North<br />
Coast<br />
Compliance Patrol Hours and Contacts 2010/11<br />
Other<br />
Pearling<br />
Recreational<br />
Commercial<br />
Patrol Officer Hours<br />
Northern<br />
Inland<br />
Gascoyne<br />
Coast<br />
West<br />
Coast<br />
Bioregion<br />
South<br />
Coast<br />
Southern<br />
Inland<br />
30<br />
25<br />
20<br />
15<br />
10<br />
5<br />
0<br />
Patrol Hours (thousands)<br />
Key compliance statistics – 2010/11<br />
Figure 25. Number of offences in each bioregion (shown using bars)<br />
and number of patrol hours (in thousands) recorded<br />
(shown using a line)<br />
Number of Offences<br />
3,000<br />
2,500<br />
2,000<br />
1,500<br />
1,000<br />
500<br />
0<br />
North<br />
Coast<br />
Compliance Patrol Hours and Offences 2010/11<br />
Recreational Offences<br />
Commercial Offences<br />
Patrol Officer Hours<br />
Northern<br />
Inland<br />
Gascoyne<br />
Coast<br />
Bioregion<br />
West<br />
Coast<br />
South<br />
Coast<br />
Southern<br />
Inland<br />
40<br />
30<br />
25<br />
20<br />
15<br />
10<br />
5<br />
0<br />
Patrol Hours (thousands)
Number of Offences<br />
Figure 26. Number of offences in each bioregion (shown using bars)<br />
and number of contacts (in thousands) recorded (shown<br />
using a line)<br />
3,000<br />
2,500<br />
2,000<br />
1,500<br />
1,000<br />
50<br />
0<br />
SUMMARy <strong>OF</strong> <strong>THE</strong> yEAR � FISH PIES (AND O<strong>THE</strong>R gRAPHS)<br />
North<br />
Coast<br />
Compliance Contacts and Offences 2010/11<br />
Recreational Offences<br />
Commercial Offences<br />
Total Contacts<br />
Northern<br />
Inland<br />
Gascoyne<br />
Coast<br />
Bioregion<br />
West<br />
Coast<br />
South<br />
Coast<br />
Southern<br />
Inland<br />
90<br />
80<br />
70<br />
60<br />
50<br />
40<br />
30<br />
20<br />
10<br />
0<br />
Total Contacts (thousands)<br />
Figure 27. Patrol hours delivered to each bioregion during 2010/11<br />
financial year<br />
Officer Patrol Hours 2010/11<br />
25,626<br />
Gascoyne Coast<br />
North Coast<br />
Northern Inland<br />
6,930<br />
5,850<br />
2,283<br />
1,444<br />
3,295<br />
South Coast<br />
Southern Inland<br />
West Coast<br />
Note: This chart includes all time spent on compliance-related tasks, e.g. investigations,<br />
prosecution, etc. The hours spent in the West Coast Bioregion includes time<br />
spent on the West Coast Rock Lobster Fishery.<br />
41
SUMMARy <strong>OF</strong> <strong>THE</strong> yEAR � FISH PIES (AND O<strong>THE</strong>R gRAPHS)<br />
Figure 28. Number of contacts across all bioregions<br />
for 2010/11<br />
All Regions Number of Contacts 2010/11<br />
106,031<br />
Commercial<br />
Recreational<br />
Pearling<br />
Other<br />
10<br />
8,101<br />
2,091<br />
Figure 29. Number of recreational contacts by<br />
bioregion<br />
Recreational Contacts by Bioregion 2010/11<br />
70,609<br />
Gascoyne Coast<br />
North Coast<br />
Northern Inland<br />
11,808<br />
12,002<br />
3,142<br />
5,726<br />
2,744<br />
South Coast<br />
Southern Inland<br />
West Coast<br />
42
SUMMARy <strong>OF</strong> <strong>THE</strong> yEAR � FISH PIES (AND O<strong>THE</strong>R gRAPHS)<br />
Figure 30. Number of commercial contacts by<br />
bioregion<br />
Commercial Contacts by Bioregion 2010/11<br />
1,294<br />
Gascoyne Coast<br />
North Coast<br />
Northern Inland<br />
206<br />
169 41<br />
302<br />
79<br />
South Coast<br />
Southern Inland<br />
West Coast<br />
Figure 31. Number of other contacts by bioregion<br />
Other Contacts by Bioregion 2010/11<br />
5,792<br />
Gascoyne Coast<br />
North Coast<br />
Northern Inland<br />
529 460<br />
594<br />
335<br />
401<br />
South Coast<br />
Southern Inland<br />
West Coast<br />
43<br />
Note: Commercial West Coast Rock Lobster Fishery contacts are<br />
included in the West Coast Bioregion. Contacts are classified<br />
according to the specific fishery, which is usually clearly<br />
delineated as being either commercial or recreational.<br />
The ‘Other’ category is used where multiple fisheries are<br />
contacted and it is not possible to accurately classify the<br />
contacts into one specific fishery – typically, the majority<br />
of these contacts are recreational in nature (e.g. personal<br />
contacts in Marine Parks), but contacts made in relation to<br />
fish kills, shark patrols and inspections of commercial fish<br />
wholesale and retail premises, etc. are also included in this<br />
category. This includes contacts made by PV Hamelin and<br />
PV McLaughlin. Contacts made by PV Walcott are included in<br />
North Coast Bioregion.
Key compliance statistics – 2008/09 to 2010/11<br />
table 18.<br />
commercial<br />
mode of compliance breach 2008/09 2009/10 2010/11<br />
Prosecutions 23 41 22<br />
Infringements 104 72 43<br />
Infringements – warnings 242 172 67<br />
table 19.<br />
recreational<br />
SUMMARy <strong>OF</strong> <strong>THE</strong> yEAR � FISH PIES (AND O<strong>THE</strong>R gRAPHS)<br />
mode of compliance breach 2008/09 2009/10 2010/11<br />
Prosecutions 118 266 351<br />
Infringements 414 787 1316<br />
Infringements – warnings 856 1487 1775<br />
Figure 32. Commercial compliance breaches<br />
104<br />
23<br />
Commercial compliance breaches<br />
400 242<br />
Prosecutions<br />
350<br />
Infringements<br />
300<br />
172 Infringements – warnings<br />
250<br />
200<br />
150<br />
100<br />
50<br />
0<br />
72<br />
41<br />
Figure 33. Recreational compliance breaches<br />
2,000<br />
1,800<br />
1,600<br />
1,400<br />
1,200<br />
1,000<br />
800<br />
600<br />
400<br />
200<br />
0<br />
2008/09 2009/10 2010/11<br />
Prosecutions<br />
Infringements<br />
Infringements – warnings<br />
856<br />
414<br />
118<br />
Recreational compliance breaches<br />
1487<br />
787<br />
266<br />
67<br />
43<br />
22<br />
1775<br />
1316<br />
351<br />
2008/09 2009/10 2010/11<br />
44
SUMMARy <strong>OF</strong> <strong>THE</strong> yEAR � FISH PIES (AND O<strong>THE</strong>R gRAPHS)<br />
Key licensing statistics<br />
Figure 34. Recreational licence renewal modes<br />
Number of licences renewed<br />
160,000<br />
140,000<br />
120,000<br />
100,000<br />
80,000<br />
60,000<br />
40,000<br />
20,000<br />
0<br />
table 20.<br />
Online via the Department’s website<br />
Australia Post Outlets<br />
Department of Fisheries Offices<br />
17,468<br />
29,935<br />
13,884<br />
159%<br />
64%<br />
77%<br />
45,269<br />
36%<br />
61,454<br />
49,097 51,758<br />
24,541 22,866<br />
2008/09 2009/10 2010/11<br />
recreational licence renewal modes 2008/09 2009/10 2010/11<br />
Department of Fisheries’ Offices 13,884 24,541 22,866<br />
Australia Post Outlets 29,935 49,097 51,758<br />
On-line via the Department’s website 17,468 45,269 61,454<br />
5%<br />
-7%<br />
45
OvERvIEw <strong>OF</strong> AgENCy<br />
In 2010/11 a combined total of 94 per cent of the major commercial fisheries in WA have breeding stock management that is considered satisfactory. Photo: Eloise Dortch<br />
OvERvIEw <strong>OF</strong> AgENCy<br />
Profile of the Department of Fisheries _____________________________________________________47<br />
Operating Environment – Significant Issues Impacting the Agency _____________________________51<br />
Operational Structure ___________________________________________________________________53<br />
Corporate Executive ____________________________________________________________________55<br />
Performance Management Framework ____________________________________________________60<br />
46
OvERvIEw <strong>OF</strong> AgENCy � PR<strong>OF</strong>ILE <strong>OF</strong> <strong>THE</strong> <strong>DEPARTMENT</strong> <strong>OF</strong> <strong>FISHERIES</strong><br />
Profile of the Department of Fisheries<br />
vision: World-class management of fisheries and<br />
aquatic ecosystems.<br />
mission: to conserve, sustainably develop and<br />
share the use of the State’s aquatic resources and<br />
their ecosystems for the benefit of present and<br />
future generations.<br />
our message to the community: Fish for the future.<br />
The Department of Fisheries manages the marine<br />
and freshwater fisheries and ecosystems within<br />
the limits of the State. By agreement with the<br />
Commonwealth, the Department has unique<br />
management responsibilities within Australian<br />
waters out to 200 nautical miles from the Western<br />
Australian coast. This allows for management on a<br />
spatial scale that is appropriate to the sustainable<br />
management and protection of the State’s fish<br />
resources and their environment.<br />
The principles of Ecologically Sustainable<br />
Development, as contained in the objects of the<br />
Fish Resources Management Act 1994, guide<br />
the Department in its operations. These objects<br />
involve managing human impacts on both target<br />
47<br />
and bycatch fish species and their habitats, and<br />
assessing and limiting any potential indirect<br />
impacts of fishing and aquaculture activities on<br />
the broader ecosystem. It also includes managing<br />
social and economic impacts of fishing and<br />
aquaculture activity.<br />
The Department works in the presentday<br />
context of limited fish and environmental<br />
resources, and a growing human ‘footprint’ on<br />
the aquatic environment. Factors with increasing<br />
impact include a growing population, developing<br />
coastal infrastructure, industrial development,<br />
rapidly advancing ‘fish-finding’ technology and<br />
climate change.<br />
As a result of the Department’s activities,<br />
around 80 per cent of WA’s marine waters are<br />
protected through fishing closures or controls on<br />
fishing methods that can impact directly on marine<br />
habitats (for example, trawling) and are totally<br />
closed to highly-destructive fishing methods (for<br />
example, dredging and explosives). The Department<br />
ensures compliance with fishing rules and controls<br />
through an active community education and<br />
enforcement program.
OvERvIEw <strong>OF</strong> AgENCy � PR<strong>OF</strong>ILE <strong>OF</strong> <strong>THE</strong> <strong>DEPARTMENT</strong> <strong>OF</strong> <strong>FISHERIES</strong><br />
The Department’s services are delivered<br />
in a context of increasing aquatic management<br />
accountability. This includes accountability to the<br />
Commonwealth government through reporting<br />
requirements established under the Environment<br />
Protection and Biodiversity Conservation Act 1999.<br />
The Department values consultation with<br />
stakeholders and works with partners to develop<br />
management practices able to stand up to<br />
domestic, national and international scrutiny.<br />
In this report to the Parliament and<br />
the community, the Department presents its<br />
summary of operations and outcomes during the<br />
2010/11 financial year, based around the State<br />
Government’s Annual Reporting Framework.<br />
Legislation Administered<br />
The Department assists the Minister for Fisheries in<br />
the administration of the following Acts:<br />
• Fish Resources Management Act 1994<br />
• Pearling Act 1990<br />
• Fisheries Adjustment Schemes Act 1987<br />
• Fishing and Related Industries Compensation<br />
(Marine Reserves) Act 1997<br />
• Fishing Industry Promotion Training and<br />
Management Levy Act 1994<br />
The Department is also responsible for the<br />
management of fishing (and related activities) in<br />
marine protected areas established under the<br />
Conservation and Land Management Act 1984, and<br />
48<br />
provides at-sea marine safety compliance services<br />
on behalf of the Department of Transport under the<br />
Western Australian Marine Act 1982.<br />
By arrangement with the Commonwealth,<br />
the Department has management responsibilities<br />
for a number of fisheries undertaken in waters<br />
adjacent to the Western Australian coast out to<br />
200 nautical miles.<br />
The Department also provides fisheries<br />
management and education services in the<br />
territorial waters around both Cocos (Keeling) and<br />
Christmas Islands, on behalf of the Commonwealth<br />
Attorney General’s Department, in accordance<br />
with a Service Delivery Arrangement made under<br />
the Commonwealth’s Fish Resources Management<br />
Act 1994 (WA) (Cocos Keeling Islands) or the Fish<br />
Resources Management Act 1994 (WA) (Christmas<br />
Island).<br />
Fisheries in Western Australia that fall under<br />
State or joint State/Commonwealth jurisdiction<br />
under the Offshore Constitutional Settlement<br />
Agreement are listed below.<br />
Fisheries under Western Australia<br />
State Jurisdiction<br />
Except where specifically noted, fisheries involving the<br />
following species are managed by the Department of<br />
Fisheries, in accordance with State law:<br />
• All bony fish and shark (except to the extent<br />
they are managed under a Joint Authority or by<br />
the Commonwealth).
OvERvIEw <strong>OF</strong> AgENCy � PR<strong>OF</strong>ILE <strong>OF</strong> <strong>THE</strong> <strong>DEPARTMENT</strong> <strong>OF</strong> <strong>FISHERIES</strong><br />
• All aquatic invertebrates.<br />
• All marine algae.<br />
• All seagrasses.<br />
In effect this means all commercial fisheries<br />
listed in the ‘Stock Status and Catch Ranges for<br />
Major Commercial Fisheries’ table detailed later in<br />
this report.<br />
In addition the Department manages<br />
recreational and customary fishing activities, pearling<br />
and aquaculture operations, the fish processing<br />
industry sector, the fishing charter boat and aquatic<br />
eco-tour industries, Fish Habitat Protection Areas and<br />
the Abrolhos Islands.<br />
With the exception of pearling, the above<br />
activities are managed in accordance with the<br />
provisions of the Fish Resources Management Act<br />
1994. The pearling industry is managed under the<br />
Pearling Act 1990.<br />
Operators in commercial fisheries, the<br />
pearling industry, the charter boat and aquatic ecotour<br />
industries and the fish processing sector are<br />
required to be licensed by the Department.<br />
Recreational fishers are required to hold licences<br />
when fishing for western rock lobster, abalone, marron,<br />
inland freshwater species, when fishing from a<br />
powered boat or when fishing with a net.<br />
Aboriginal people fishing in accordance with<br />
continuing Aboriginal tradition and custom are not<br />
required to hold a recreational fishing licence.<br />
49<br />
Fisheries under Western Australia Joint<br />
Authority Jurisdiction<br />
The following fisheries are controlled jointly by the<br />
Western Australian Fisheries Joint Authority (a body<br />
comprising the State and the Commonwealth) and<br />
managed in accordance with the Fish Resources<br />
Management Act 1994:<br />
• the Joint Authority Southern Demersal Gillnet<br />
and Demersal Longline Fishery; and<br />
• the Joint Authority Northern Shark Fishery,<br />
east of Koolan Island.<br />
The activities of fisheries managed through<br />
the Joint Authority are described separately in a<br />
report tabled in the Commonwealth and Western<br />
Australian Parliaments.<br />
Fisheries under Commonwealth Jurisdiction<br />
The following list shows fisheries undertaken<br />
in waters adjacent to Western Australia that are<br />
controlled by the Commonwealth in accordance with<br />
Commonwealth legislation:<br />
• Northern Prawn Fishery.<br />
• Southern and Western Tuna and<br />
Billfish Fishery.<br />
• Western Deepwater Trawl Fishery.<br />
• North-West Slope Deepwater Trawl Fishery.<br />
• Southern Bluefin Tuna Fishery.<br />
• Recreational fishing in the waters of any<br />
Commonwealth Marine Park.
OvERvIEw <strong>OF</strong> AgENCy � PR<strong>OF</strong>ILE <strong>OF</strong> <strong>THE</strong> <strong>DEPARTMENT</strong> <strong>OF</strong> <strong>FISHERIES</strong><br />
Stakeholders<br />
All those that have a stake in Western Australia’s<br />
aquatic environment have a role to play in ensuring<br />
that fish stocks and their habitats are protected, both<br />
now and in the future. Stakeholders are encouraged<br />
to participate in fisheries management and<br />
594,000 people in WA went recreational fishing at least once in<br />
the previous 12-month period. Photo: Ben Carlish<br />
50<br />
consultation, in particular via ‘peak’ representative<br />
bodies, such as the Western Australian Fishing<br />
Industry Council and Recfishwest, which is<br />
considered essential to balance the often-competing<br />
demands on the use of the State’s fish resources<br />
and their habitats.<br />
The Department of Fisheries identifies the<br />
following groups as its stakeholders with an interest<br />
in ensuring ‘fish for the future’:<br />
• The community of Western Australia.<br />
• Commercial fishers.<br />
• Recreational fishers.<br />
• Indigenous communities.<br />
• Charter fishing and aquatic eco-tour operators.<br />
• Fish processors and others involved in the<br />
commercial utilisation of Western Australia’s<br />
aquatic resources.<br />
• Pearlers.<br />
• Aquaculturalists.<br />
• The conservation sector.<br />
• Fisheries volunteers.<br />
• Environmental groups and passive users.<br />
• Businesses and communities directly and<br />
indirectly dependent upon fishing and<br />
aquaculture activities.<br />
• Other state, national and international<br />
government agencies and tertiary institutions.
OvERvIEw <strong>OF</strong> AgENCy � OPERATINg ENvIRONMENT – SIgNIFICANT ISSUES IMPACTINg <strong>THE</strong> AgENCy<br />
Operating environment – Significant<br />
Issues Impacting the Agency<br />
Significant issues impacting on fisheries and<br />
fisheries management during 2010/11 and likely to<br />
be of influence in the future include:<br />
• Record-low puerulus (young lobster) settlement<br />
within the boundaries of the West Coast Rock<br />
Lobster Managed Fishery has led to intensive<br />
management action to cap the total catch in<br />
the fishery at around half the historical catch<br />
levels during the 2010/11 fishing season,<br />
with the aim of leaving more breeding stock<br />
in the water and increasing egg production.<br />
A decision has also been taken to introduce<br />
Individual Transferrable Quota into the fishery<br />
commencing in the 2013/14 fishing season.<br />
• Recreational and commercial fishing are<br />
continuing to put pressure on the sustainability<br />
of iconic fish species such as dhufish, pink<br />
snapper, baldchin groper and blue swimmer<br />
crabs, warranting extended strong management<br />
intervention from the Department.<br />
Baldchin groper above coral. Photo: Shannon Conway<br />
51
OvERvIEw <strong>OF</strong> AgENCy � OPERATINg ENvIRONMENT – SIgNIFICANT ISSUES IMPACTINg <strong>THE</strong> AgENCy<br />
• Obtaining the required knowledge and sound<br />
science to support decision-making and<br />
achieve ecologically sustainable fisheries<br />
management remains a challenge for the<br />
Department. This highlights the need for<br />
effective coordination of the State’s marine<br />
research efforts to ensure that research<br />
activities are being prioritised and funded<br />
according to risk levels and community needs.<br />
• Aquaculture industries have the potential to<br />
significantly increase fish production, as the<br />
demand for high-quality seafood grows while<br />
the harvest from most wild-capture fisheries<br />
worldwide is declining. The Department is<br />
working with the aquaculture sector to identify<br />
suitable sites and species for these industries.<br />
• The level of risk of introduced marine and<br />
freshwater pest diseases, together with<br />
responsibilities under national biosecurity<br />
agreements, present a range of new tasks for the<br />
Department that require careful management.<br />
• Difficult economic conditions, including<br />
increased costs of fuel and the high-value<br />
Australian dollar, are affecting export markets<br />
and having an impact on the profitability<br />
of fishing operations. The Department of<br />
Fisheries and the fishing industry are working<br />
on strategies to improve the economic<br />
sustainability of fishing operations.<br />
52<br />
• A growing Western Australian population<br />
is placing ever-increasing pressure on<br />
recreational fish species and the marine<br />
environment – and on the Department to<br />
deliver effective community education and<br />
compliance. This issue highlights the need for<br />
more cost-effective integrated management<br />
solutions for commercial and recreational<br />
fishing, recreational boating activities and the<br />
expanding marine park network.<br />
• Commonwealth Government proposals<br />
to establish large-scale marine parks in<br />
Commonwealth waters (i.e. outside of three<br />
nautical miles) have the potential to create<br />
uncertainty for a number of the Department’s<br />
stakeholders.
OvERvIEw <strong>OF</strong> AgENCy � OPERATIONAL STRUCTURE<br />
Operational Structure<br />
the Department of Fisheries’ operating structure<br />
consists of a Corporate executive comprising<br />
the Chief executive Officer and the directors<br />
of the Department’s four divisions – Aquatic<br />
Management, Fisheries Research, Regional<br />
Services and Corporate Services.<br />
Process Structure<br />
The Department of Fisheries deals with a variety of<br />
complex issues that impact upon the sustainable<br />
management of the State’s fish resources. To<br />
deal with these issues, the Department supports<br />
a number of integrated processes designed to<br />
facilitate planning, priority setting and project<br />
management across all divisions to our four key<br />
service areas – fisheries management, research<br />
and monitoring, compliance and education, and<br />
marine safety services.<br />
The Department’s staff and volunteers provide<br />
a conduit for public interaction and communication.<br />
Fisheries ambassador Glen Jakovich demonstrating how to best<br />
fillet a fish. Photo: Matthew Terwey<br />
53
OvERvIEw <strong>OF</strong> AgENCy � OPERATIONAL STRUCTURE<br />
Figure 35. Process Structure within the Department<br />
corporate<br />
executive<br />
Set strategic<br />
direction<br />
governing factors<br />
Minister/Government Priority<br />
Aquatic Advisory Committee<br />
Risk Register<br />
Stakeholder Priorities<br />
Strategic Plan<br />
Annual<br />
Internal committees<br />
Proposed deliverables and budgets<br />
management committee<br />
• Set priorities<br />
• Identify project deliverables<br />
• Identify funding/costs<br />
• Monitor expenditure and delivery<br />
Monthly monitoring of<br />
delivery and funding/costs<br />
Project reporting<br />
Peak Body review<br />
Stakeholders<br />
Six-monthly reports<br />
on deliverables<br />
Project/Service<br />
delivery<br />
management committee<br />
• Finalise project deliverables<br />
and funding/costs<br />
• Advise Stakeholders<br />
Project Planning<br />
(Funding/costs, what, when,<br />
how, who)<br />
management committee<br />
Internal<br />
committees<br />
54
OvERvIEw <strong>OF</strong> AgENCy � CORPORATE ExECUTIvE<br />
Corporate executive<br />
the Corporate executive is responsible for<br />
establishing the strategic directions of the<br />
Department. It gives consideration to a range of<br />
information in establishing strategic priorities,<br />
including risk information derived from the<br />
Department’s Risk Register of ecological and<br />
organisational assets, stakeholder priorities and<br />
Government policy. this strategic direction is<br />
reflected in the Department’s Strategic Plan.<br />
management committee<br />
The Management Committee is responsible for<br />
setting the work program of the Department of<br />
Fisheries to ensure optimum delivery against<br />
identified aquatic management priorities within<br />
a five-year planning horizon. Its role includes<br />
taking a strategic and risk-based approach to<br />
establishing priorities; setting clear deliverables<br />
and associated budgets; coordinating departmental<br />
project planning, management, monitoring and<br />
reporting processes; and ensuring accountability for<br />
effective and efficient service delivery across the<br />
Department. The membership of the Management<br />
55<br />
Committee includes the Department’s four<br />
directors, the general manager of the Aquatic<br />
Management division and two external members to<br />
provide independent governance and non-Western<br />
Australian based fisheries expertise.<br />
Internal Audit committee<br />
The Internal Audit Committee (IAC) maintains<br />
and manages the Department’s internal audit<br />
function on behalf of the Chief Executive Officer.<br />
The committee assists the Chief Executive<br />
Officer to manage the process of identifying and<br />
quantifying risks that have the potential to impede<br />
the Department in achieving its goals, and to<br />
guide the development and implementation of risk<br />
mitigation strategies.<br />
Aquatic Advisory committee<br />
The Aquatic Advisory Committee provides<br />
strategic advice on issues relating to the<br />
management of fisheries and aquatic resources<br />
as requested by the Minister or the Department’s<br />
Chief Executive Officer.
OvERvIEw <strong>OF</strong> AgENCy � CORPORATE ExECUTIvE<br />
Public consultation<br />
The Department is committed to continuing<br />
consultation with fisheries stakeholders and<br />
to ensuring efficient and effective participatory<br />
decision-making processes are maintained. It<br />
supports the initiative of the State Government’s<br />
WA Citizenship Strategy 2004–2009 and utilises<br />
the guidelines in the Consulting Citizens: Planning<br />
for Success and Consulting Citizens: Engaging with<br />
Aboriginal Western Australians to plan specific<br />
consultation programs.<br />
the department of fisheries’<br />
operations<br />
The Department operates from its Head Office in<br />
the Perth central business district and in other<br />
metropolitan and regional areas as follows:<br />
• The Fisheries Research Division operates from<br />
the Western Australian Fisheries and Marine<br />
Research Laboratories at Hillarys and the<br />
Pemberton Freshwater Research Centre. The<br />
Department’s Naturaliste Marine Discovery<br />
Centre is located at Hillarys, as is the<br />
Department’s Communications and Education<br />
Branch. The Regional Services Branch also<br />
maintains a compliance presence at Hillarys.<br />
• The Marine Operations Centre and the<br />
Metropolitan Regional Office operate from<br />
premises in Capo D’Orlando Drive in Fremantle.<br />
The Department of Fisheries’ Marine Operations Centre and<br />
Metropolitan Regional office. Photo: Steve Ireland<br />
56<br />
• The Regional Services Division has five<br />
regional offices located at Broome, Carnarvon,<br />
Geraldton, Fremantle and Albany, and 12<br />
district offices located throughout the State.
OvERvIEw <strong>OF</strong> AgENCy � CORPORATE ExECUTIvE<br />
Figure 36. Department Functional Structure Chart as at 30 June 2011<br />
Director<br />
Fisheries Research<br />
Finfish<br />
Stock<br />
Assessment &<br />
Data Analysis<br />
Biodiversity<br />
& Biosecurity<br />
Invertebrates<br />
Internal<br />
Audit<br />
Function<br />
Director<br />
Aquatic Management<br />
Aquatic<br />
Management<br />
Legal & Executive<br />
Services<br />
Aquatic<br />
Environment<br />
Aquaculture<br />
Strategic<br />
Fisheries Policy<br />
Chief Executive Officer<br />
Executive<br />
(including<br />
Ministerial<br />
Liaison)<br />
Director<br />
Regional Services<br />
Communications<br />
and Education<br />
Southern<br />
Region<br />
Metropolitan<br />
Region<br />
Mid-West<br />
Region<br />
Gascoyne<br />
Region<br />
Northern<br />
Region<br />
Compliance<br />
& Regional<br />
Support<br />
Licensing and<br />
Registry Services<br />
Director<br />
Corporate Services<br />
Human<br />
Resources<br />
Financial<br />
Services<br />
Infrastructure<br />
Development<br />
Information<br />
Management<br />
57
OvERvIEw <strong>OF</strong> AgENCy � CORPORATE ExECUTIvE<br />
corporate executive<br />
From left to right Michael Connolly (Director, Corporate Services), Stuart Smith (Cheif Executive Officer), Heather Brayford (Director,<br />
Aquatic Management), Bruno Mezzatesta (Director, Regional Services) and Rick Fletcher (Director, Research). Photo: Stephen Emery<br />
The Corporate Executive of the Department of<br />
Fisheries comprises the Chief Executive Officer,<br />
the Director of Aquatic Management, the Director<br />
of Regional Services, the Director of Fisheries<br />
Research, and the Director of Corporate Services.<br />
Stuart Smith, Bec, Grad. Dip. ec.<br />
Chief Executive Officer*<br />
Stuart Smith joined the Department as Chief<br />
Executive Officer on 3 November 2008. He<br />
previously held senior roles in the Department of<br />
Industry and Resources, including that of Deputy<br />
Director General, State Development and Deputy<br />
Director General, Resources Group. He also acted<br />
as Director General of the Department of Industry<br />
and Resources.<br />
Stuart brings over 20 years of wide-ranging<br />
experience in both the State and Federal public<br />
sector to the role of Chief Executive Officer. He<br />
holds a Bachelor of Economics from the University<br />
of Western Australia and a Graduate Diploma in<br />
Economics from the Australian National University.<br />
* Terms of Appointment: The Chief Executive<br />
Officer is appointed under Part 3 of the Public<br />
Sector Management Act 1994 for five years.<br />
58
OvERvIEw <strong>OF</strong> AgENCy � CORPORATE ExECUTIvE<br />
Heather Brayford BSc, MBA, GAICD<br />
Director, Aquatic Management<br />
Heather Brayford was appointed Director, Aquatic<br />
Management in 2009. This position includes<br />
responsibility for fisheries management programs,<br />
broader environmental management programs,<br />
aquaculture and the provision of legal, legislative<br />
drafting and governance services.<br />
Heather has close to 25 years experience in<br />
fisheries management, having held a number of senior<br />
policy and management positions in the Department.<br />
She has also held the position of Executive Director of<br />
Fisheries in the Northern Territory.<br />
Dr Rick Fletcher, BSc (Hons), PhD<br />
Director, Fisheries Research<br />
Dr Rick Fletcher was appointed as Director, Fisheries<br />
Research in 2006. This position is responsible for<br />
the overall management and strategic direction of<br />
the Department’s research group, which provides<br />
the information that underpins the Department’s<br />
successful natural resource management programs.<br />
Rick has over 25 years experience conducting<br />
and managing research on fisheries and aquaculturerelated<br />
issues across four jurisdictions in Australia<br />
and the South Pacific, including Director of Research<br />
of Fisheries in NSW. His recent research focus<br />
has been in the development of ecosystem-based<br />
management frameworks for marine and coastal<br />
systems, for which he is the leader of a number of<br />
state, national and international initiatives.<br />
59<br />
Bruno Mezzatesta, BBus MBA FCPA<br />
Director, Regional Services<br />
Bruno Mezzatesta is responsible for the<br />
Department’s Regional Services Division including<br />
community education and compliance, licensing and<br />
communications. Prior to this position, Bruno was<br />
the Director of the Department’s Corporate Services<br />
Division. He has more than 25 years experience in<br />
the public sector, including periods with the Office of<br />
the Auditor General and the Department of Treasury<br />
and Finance.<br />
Michael Connolly, BSc, BBus ASA<br />
Director, Corporate Services<br />
Michael was appointed to the position of Director,<br />
Corporate Services in March 2011 and is<br />
responsible for the operations of the Corporate<br />
Services Division, comprising Financial Services and<br />
Infrastructure Development, Human Resources and<br />
Information Management branches. Michael is also<br />
the senior responsible officer for the development<br />
and delivery of a new entitlement management<br />
system which, when completed and implemented,<br />
will modernise the administration and management<br />
of fisheries in Western Australia.<br />
Michael has 28 years experience in the public<br />
sector, including 20 years in various regulatory roles<br />
within the Department of Racing, Gaming and Liquor.
OvERvIEw <strong>OF</strong> AgENCy � PERFORMANCE MANAgEMENT FRAMEwORk<br />
Performance Management Framework<br />
Western Australia’s fisheries and aquatic<br />
ecosystems are an important natural resource<br />
managed by the Department of Fisheries on<br />
behalf of all Western Australians.<br />
the services of the Department of Fisheries, as<br />
described in the 2010/11 Budget Papers, are<br />
aimed at achieving the Government goal of:<br />
ensuring that economic activity is managed in a<br />
socially and environmentally responsible manner<br />
for the long-term benefit of the State.<br />
contribution to government goals<br />
The Department works towards the achievement<br />
of the Government goal and its department-level<br />
outcome of the conservation and sustainable<br />
development of the State’s fish resources through<br />
the provision of four key services:<br />
Service 1 – Fisheries Management<br />
The Department’s Aquatic Management Division<br />
and Licensing and Registry Services Branch is<br />
responsible for management, policy development,<br />
licensing and legislation related to the State’s<br />
commercial and recreational fisheries, pearling,<br />
aquaculture, the charter boat industry, customary<br />
fishing and protection of aquatic ecosystems.<br />
Service 2 – Compliance and education<br />
The Department’s Regional Services Division is<br />
responsible for state-wide fisheries compliance<br />
and community education, in accordance with the<br />
provisions of the Fish Resources Management Act<br />
1994 and the Pearling Act 1990.<br />
60<br />
Service 3 – Research and Monitoring<br />
The Department’s Research Division is responsible for<br />
the provision of timely, quality scientific knowledge and<br />
advice to support the conservation and sustainable use<br />
of the State’s fish resources and aquatic ecosystems.<br />
Service 4 – Marine Safety Service<br />
The Marine Operations Section of the Department<br />
of Fisheries’ Regional Services Division coordinates<br />
the delivery of at-sea marine safety compliance<br />
services by the Department’s Fisheries and Marine<br />
Officers under a service level agreement with the<br />
Department of Transport.
OvERvIEw <strong>OF</strong> AgENCy � PERFORMANCE MANAgEMENT FRAMEwORk<br />
Figure 37. Performance Management Framework<br />
mission<br />
To conserve, sustainably<br />
develop and share<br />
the use of the State’s<br />
aquatic resources and<br />
their ecosystems for the<br />
benefit of present and<br />
future generations.<br />
Service 1 – fisheries management<br />
Service 2 – compliance and education<br />
Service 3 – research and monitoring<br />
Service 4 – marine Safety Service<br />
Key performance indicators<br />
Agency-level<br />
outcome<br />
Conservation<br />
and sustainable<br />
development of<br />
the State’s fish<br />
resources.<br />
government goal:<br />
outcome-Based<br />
Service delivery<br />
61<br />
Ensuring that economic activity<br />
is managed in a socially and<br />
environmentally responsible<br />
manner for the long-term benefit<br />
of the State.
OvERvIEw <strong>OF</strong> AgENCy � PERFORMANCE MANAgEMENT FRAMEwORk<br />
measurement of department-level<br />
outcome and Services<br />
The Department of Fisheries evaluates,<br />
measures and reports on the effectiveness and<br />
efficiency of its service delivery in achieving its<br />
desired department-level outcome through Key<br />
Performance Indicators or ‘KPIs’. KPIs comprise both<br />
Effectiveness and Efficiency Indicators.<br />
Effectiveness Indicators show the extent to<br />
which the Department achieved its departmentlevel<br />
outcome, while Efficiency Indicators show the<br />
relationship between the service delivered and the<br />
resources used in the delivery of that service. A<br />
summary of the Department’s performance against<br />
budget targets is provided in Table 21 below.<br />
62<br />
table 21. Summary of Key Performance Indicators:<br />
Actual Performance Compared to<br />
Budget targets<br />
2010/11 2010/11<br />
target Actual<br />
Outcome: Conservation and sustainable development of the State’s<br />
fish resources.<br />
Key Effectiveness Indicators<br />
The proportion of fish stocks identified<br />
as being at risk or vulnerable through<br />
exploitation.<br />
17% 6%<br />
The proportion of fisheries where acceptable<br />
catches (or effort levels) are achieved.<br />
90% 94%<br />
The percentage of fisheries or fished sectors 65%<br />
where current catch shares are known and<br />
where catch share allocations are in process<br />
or in place.<br />
61%<br />
The gross value of State fisheries production $400m*<br />
(million).<br />
$380m**<br />
The participation rate in recreational fishing.<br />
Key Efficiency Indicators<br />
Service 1 – Fisheries Management<br />
33% 32%<br />
Average cost per hour for management<br />
(excluding grants and fisheries adjustments).<br />
Service 2 – Compliance and education<br />
$109 $152<br />
Average cost per hour for compliance<br />
and education.<br />
Service 3 – Research and Monitoring<br />
$134 $186<br />
Average cost per hour for research<br />
and monitoring.<br />
Service 4 – Marine Safety Service<br />
$116 $126<br />
Average cost per hour for marine safety<br />
service.<br />
$116 $134<br />
Notes:<br />
* See Key Performance Indicator 2.1 (contribution to the State’s<br />
gross value of output).<br />
** This is derived from the Australian Bureau of Agricultural and<br />
Resource Economics (ABARE) figures for the year 2009/10.
OvERvIEw <strong>OF</strong> AgENCy � PERFORMANCE MANAgEMENT FRAMEwORk<br />
Further information on the efficiency indicators<br />
can be found in the ‘Statement of Performance<br />
Indicators’ section of this Annual Report.<br />
financial Performance<br />
The table below describes the Department of<br />
Fisheries’ performance against the targets that<br />
formed part of the 2009/10 State Budget papers<br />
and reflected in the resources agreement signed<br />
by the Chief Executive Officer of the Department<br />
of Fisheries, the Minister for Fisheries and the<br />
Treasurer.<br />
table 22. Financial targets: Actual Performance<br />
Compared to Budget targets<br />
Total cost of services<br />
(expense limit) (sourced from<br />
Income Statement).<br />
Net cost of services (sourced<br />
from Income Statement).<br />
Total equity (sourced from<br />
Balance Sheet).<br />
Net increase/(decrease) in<br />
cash held (sourced from Cash<br />
Flow Statement).<br />
Approved full-time equivalent<br />
(FTE) staff level<br />
2009/10<br />
target<br />
$’000<br />
2009/10<br />
Actual<br />
$’000<br />
Variance<br />
$’000<br />
62,736 71,891 (9,155)<br />
30,663 38,831 (8,168)<br />
73,894 61,185 12,709<br />
1,059 345 714<br />
No. No. No.<br />
409 416 (7)<br />
63<br />
contribution to other government goals<br />
The Department of Fisheries contributes to the<br />
achievement of the Government’s other stated goals<br />
as follows.<br />
State Building – Major Projects<br />
In 2010/11 the Department’s work towards this<br />
goal included:<br />
• A new Marine Operations Centre at Denham<br />
is under construction. This new centre will<br />
facilitate the delivery of the Department’s<br />
services, including fisheries and marine<br />
protected area management, in the Shark<br />
Bay World Heritage Area. The centre will also<br />
accommodate staff from the Department of<br />
Environment and Conservation. In addition, the<br />
Shark Bay Volunteer Sea Rescue Group will be<br />
accommodated in the new Denham centre.<br />
Financial and economic Responsibility<br />
In 2010/11 the Department’s work towards this<br />
goal included:<br />
• Progressing the implementation of reviews of<br />
fisheries legislation, in particular those dealing<br />
with the Department’s fee setting capacity and<br />
the regulatory requirements of the aquaculture<br />
sector.<br />
• Facilitating and encouraging more efficient use<br />
of the Department’s marine patrol vessels<br />
by other government agencies with research,
OvERvIEw <strong>OF</strong> AgENCy � PERFORMANCE MANAgEMENT FRAMEwORk<br />
management and compliance responsibilities<br />
in the marine environment, such as the<br />
Department of Transport and the Department<br />
of Environment and Conservation.<br />
• The appointment of a Chief Financial Officer to<br />
provide strategic oversight of the Department’s<br />
financial operations.<br />
Outcomes-Based Service Delivery<br />
In 2010/11 the Department’s work towards this<br />
goal included:<br />
• Collaborating with other government agencies<br />
and research and educational institutions that<br />
have management responsibilities or research<br />
programs at the Abrolhos Islands and other<br />
marine protected areas for the delivery of<br />
natural resource management outcomes in the<br />
marine environment.<br />
64<br />
Stronger Focus on the Regions<br />
In 2010/11 the Department’s work towards this<br />
goal included:<br />
• Most of the State’s significant fisheries are<br />
regionally-based and contribute strongly to the<br />
economy, employment opportunities, lifestyle<br />
and culture of regional Western Australia.<br />
As a result, the Department of Fisheries has<br />
regional offices in the Kimberley, Gascoyne,<br />
Mid-West, Peel and Great Southern and also<br />
maintains district offices from Kununurra<br />
south to Esperance.<br />
• About 45 per cent of the Department’s staff<br />
are located in regional areas and about 75<br />
per cent of the departmental expenditure<br />
relates to fisheries and aquatic management<br />
programs of importance to regional<br />
communities.<br />
The Department of Fisheries works together with other government institutions that have responsibilities at the Abrolhos Islands.
AgENCy PERFORMANCE<br />
Staff in the Regional Services Division are widely dispersed around the coastal areas of WA and are the Department’s primary public interface.<br />
AgENCy PERFORMANCE<br />
Agency Performance – Overview __________________________________________________________66<br />
Service 1 – Fisheries Management _______________________________________________________67<br />
Service 2 – Compliance and Education ____________________________________________________73<br />
Service 3 – Research and Monitoring _____________________________________________________90<br />
Service 4 – Marine Safety Service _____________________________________________________ 100<br />
Corporate Services ___________________________________________________________________ 101<br />
65
AgENCy PERFORMANCE � AgENCy PERFORMANCE – OvERvIEw<br />
Agency Performance – Overview<br />
the Department of Fisheries is responsible<br />
for the sustainable management of fisheries,<br />
aquaculture and the aquatic environment. the<br />
Department takes a strategic and risk-based<br />
approach to fisheries management, setting clear<br />
project budgets and coordinating activity across<br />
the Department’s Aquatic Management, Research,<br />
Regional Services and Corporate Services<br />
Divisions to deliver the following services:<br />
Service 1 – Fisheries Management<br />
Service 2 – Compliance and education<br />
Service 3 – Research and Monitoring<br />
Service 4 – Marine Safety<br />
The Department organises its resources to<br />
ensure optimum delivery against identified aquatic<br />
management priorities within a five-year planning<br />
horizon.<br />
In order to provide a clear idea in practical<br />
terms of how the Department of Fisheries provides<br />
these services, the divisions and branches<br />
who provide a particular service are described<br />
below under the service heading, along with the<br />
achievements (for 2010/11) and initiatives (for<br />
2011/12) relating to the particular service.<br />
The Department’s Corporate Services<br />
Division provides human resources, financial and<br />
management support to enable the Department to<br />
deliver its planned services effectively.<br />
66
AgENCy PERFORMANCE � SERvICE 1 – <strong>FISHERIES</strong> MANAgEMENT<br />
Service 1 – Fisheries Management<br />
the Department’s Aquatic Management Division,<br />
in conjunction with the Licensing and Registry<br />
Services Branch, has overall responsibility for<br />
fisheries management service.<br />
Through collaboration with the Research<br />
and Regional Services divisions, the Aquatic<br />
Management Division develops, implements and<br />
reviews management strategies for fisheries<br />
resources of importance to Western Australia’s<br />
commercial, recreational and indigenous fishing<br />
sectors. It is also responsible for the management<br />
of the pearling industry, land and marine-based<br />
aquaculture and the protection of the marine and<br />
aquatic environments.<br />
In addition, the Aquatic Management<br />
Division also maintains an expert capability in<br />
legislative drafting, legal services and overarching<br />
governance, including risk management, audit and<br />
annual reporting.<br />
As a regulator, the Department of<br />
Fisheries has introduced an integrated fisheries<br />
management and operational approach that aims<br />
to take into account the needs of all major fishing<br />
groups in the community and the effect of other<br />
human activities on the State’s ecosystems. The<br />
basis of this approach lies in the division of our<br />
State into four marine biogeographical regions –<br />
the North Coast, the Gascoyne Coast, the West<br />
Coast and the South Coast.<br />
These regions haven’t randomly been chosen<br />
– they reflect the variation of temperatures in our<br />
coastal waters, caused by the influence of the<br />
Leeuwin Current (see the map on page 68). This<br />
warm, tropical current flows south from Indonesia<br />
and down WA’s coast past Cape Leeuwin and<br />
then eastwards along the south coast into the<br />
Great Australian Bight and is strongest during the<br />
winter months. Each region comes with its own<br />
environment, fish species and set of rules.<br />
67
AgENCy PERFORMANCE � SERvICE 1 – <strong>FISHERIES</strong> MANAgEMENT<br />
Gascoyne<br />
Coast<br />
North Coast<br />
(Pilbara/Kimberley)<br />
Southern<br />
Freshwater<br />
Northern<br />
Freshwater<br />
Sea surface temperature image of Western Australia (courtesy,<br />
Landgate) superimposed with fisheries bioregions.<br />
The Department provides its fisheries<br />
management service through the allocation of<br />
resources across the following branches.<br />
Aquatic management Branch<br />
68<br />
The Aquatic Management Branch undertakes the<br />
key wild-stock fishery management functions of<br />
the Department of Fisheries. These functions are<br />
delivered through two bioregional management<br />
groups – the Northern Bioregions group and the<br />
South-West Bioregions group – and the West Coast<br />
Rock Lobster group.<br />
The two bioregional groups are responsible<br />
for the integrated management of all ‘extractive’<br />
(recreational, commercial and customary<br />
indigenous) fishing activities within their bioregions.<br />
This branch is supported by the Strategic<br />
Fisheries Policy Group, which is responsible<br />
for broader issues of policy development and<br />
implementation for wild-stock fisheries, as well as<br />
administrative matters relating to ‘whole-of-state’<br />
fishery issues.<br />
The activities of the Integrated Fisheries<br />
Allocation Advisory Committee (IFAAC), which is<br />
responsible for providing advice to the Minister<br />
for Fisheries on fish resource allocations between<br />
commercial, recreational and customary users,<br />
are also supported through the Strategic Fisheries<br />
Policy Group.
AgENCy PERFORMANCE � SERvICE 1 – <strong>FISHERIES</strong> MANAgEMENT<br />
Aquaculture Branch<br />
The Aquaculture Branch is responsible for the<br />
management and regulation of Western Australia’s<br />
aquaculture industry, which is small by global<br />
standards but considered to have capacity for<br />
substantial growth in the future. Commerciallyproduced<br />
species include barramundi, mussels,<br />
abalone, western rock oyster, silver perch, trout,<br />
pearl oysters, yellowtail kingfish, mulloway, marron,<br />
yabbies, ornamental species, artemia (brine shrimp<br />
used in fish hatchery diets) and algae (for the<br />
production of beta carotene, biofuels and biolipids).<br />
The Department’s management arrangements<br />
are designed to ensure the aquaculture industry is<br />
both economically and environmentally sustainable.<br />
Aquatic environment Branch<br />
The Aquatic Environment Branch is responsible for<br />
leading the development of environmental policy<br />
frameworks and procedures to protect fish and their<br />
habitats throughout Western Australia, including<br />
biodiversity protection and aquatic biosecurity. In<br />
addition, the Aquatic Environment Branch is also<br />
responsible for the development, management and<br />
sharing of spatial data gathered by the Department<br />
to inform its management decisions and those<br />
across government relating to the State’s aquatic<br />
environment.<br />
The Aquatic Environment Branch provides<br />
advice for environmental impact assessments and<br />
69<br />
proposed exemptions and contributes to State,<br />
Commonwealth and regional marine planning<br />
initiatives, including the declaration and ongoing<br />
management of Fish Habitat Protection Areas and<br />
the delivery of Western Australian aquatic natural<br />
resource management activities resulting from the<br />
Commonwealth Government’s ‘Caring for Country’<br />
program. It is also responsible for freshwater fish<br />
protection and management.<br />
In performing its biosecurity functions, the<br />
Aquatic Environment Branch collaborates with other<br />
state, interstate and national departments.<br />
legal and executive Services Branch<br />
The Legal and Executive Services Branch is<br />
responsible for the oversight and development of<br />
the Department of Fisheries’ legislative framework.<br />
It also assists the Corporate Executive and officers<br />
of the Department in the provision of legal and<br />
strategic policy advice, legal interpretation and<br />
litigation including matters coming before the State<br />
Administrative Tribunal.<br />
The Legal and Executive Services Branch<br />
works closely with all areas of the Department in<br />
the delivery of legislative priorities and policy advice<br />
on ‘whole-of-government’ issues. In addition, it<br />
coordinates the Department’s annual reporting and<br />
regulatory ‘gate-keeping’ requirements.<br />
Legislation gazetted by the Department during<br />
the 2010/11 financial year is shown in Appendix 3.
AgENCy PERFORMANCE � SERvICE 1 – <strong>FISHERIES</strong> MANAgEMENT<br />
licensing and registry Services Branch<br />
The Licensing and Registry Services Branch is<br />
responsible for the provision of licensing services<br />
for commercial fishing, recreational fishing, pearling<br />
and aquaculture. It manages the Fisheries Licensing<br />
and Management System (FLAMS) and the online<br />
renewal and payment facility and maintains<br />
a register of authorisations, exemptions and<br />
aquaculture leases, pursuant to Part 12 of the Fish<br />
Resources Management Act 1994.<br />
The register is available to the public on<br />
application to the Department of Fisheries’<br />
Registrar and the payment of appropriate fees in<br />
accordance with section 125 of the Fish Resources<br />
Management Act 1994 (FRMA).<br />
Appendix 4 of this Annual Report provides a<br />
summary of information recorded on the register<br />
during 2010/11 including authorisations, aquaculture<br />
leases, security notations and exemptions.<br />
Service 1 – Fisheries Management<br />
– Major Achievements in 2010/11<br />
• The first stage in the transition to Individual<br />
Transferable Quota catch management in the<br />
West Coast Rock Lobster Managed Fishery<br />
was carried out, including the allocation<br />
of individual catch limits and introduction<br />
of a revised regulatory and administrative<br />
framework for quota management.<br />
70<br />
• A new funding model was implemented for the<br />
commercial fishing sector. Under the new model,<br />
commercial fishers are required to pay a flat<br />
fee of 5.75 per cent of the Gross Value Product<br />
(GVP) of the fishery in which they operate.<br />
• The Fisheries Licensing and Management<br />
System (FLAMS) was modified and enhanced<br />
to incorporate ongoing changes to a variety<br />
of managed fishery plans including the West<br />
Coast Rock Lobster Management Plan.<br />
• Fisheries Adjustment Schemes were<br />
established and completed for the Shark<br />
Bay Prawn Fishery, Shark Bay Scallop Fishery<br />
and the Abrolhos Islands and Mid-west Trawl<br />
Fishery. The total value of these schemes was<br />
approximately $34 million.<br />
• An Access Rights Working Group report to<br />
the Minister was completed on improving<br />
commercial fishing access rights.
AgENCy PERFORMANCE � SERvICE 1 – <strong>FISHERIES</strong> MANAgEMENT<br />
• Requirements relating to the use of Sea<br />
Lion Exclusion Devices (SLEDs) on pots<br />
by commercial rock lobster fishers were<br />
expanded to include specified waters at the<br />
Abrolhos Islands.<br />
• The Department of Fisheries and industry have<br />
completed the requirements for the anticipated<br />
Marine Stewardship Council re-certification of<br />
the commercial western rock lobster fishery<br />
for a further five-year period, when its current<br />
certification expires in November 2011.<br />
• The Gascoyne Demersal Scalefish Managed<br />
Fishery was established, providing an<br />
integrated sustainable demersal scalefish<br />
management framework for the waters of the<br />
southern Gascoyne.<br />
• The Indian Ocean Territories Aquaculture<br />
Development Plan was completed.<br />
• Contributions were made to concurrent<br />
State and Commonwealth marine planning<br />
processes in the south-west and north-west<br />
of WA and to the Kimberley Science and<br />
Conservation Strategy.<br />
• Development of a new strategic plan and<br />
management plan for the Abrolhos Islands<br />
Reserve and associated Fish and Fish Habitat<br />
Protection Area was commenced and a<br />
wastewater monitoring program implemented<br />
for the islands.<br />
• The Fish Resources Management Amendment<br />
(Fees) Bill 2010 and the Fish Resources<br />
Management Amendment (Fees) Bill (No.2)<br />
2010 were passed by the Parliament.<br />
• The Fish Resources Management Amendment<br />
Bill 2011 was introduced to the Parliament.<br />
Service 1 – Fisheries Management<br />
– Major Initiatives for 2011/12<br />
• A major state-wide review of recreational<br />
fishing management arrangements will be<br />
undertaken, with the aim of simplifying<br />
management and moving recreational fishing<br />
to a resource-based framework.<br />
• A state-wide review of charter management<br />
arrangements will be undertaken, focusing<br />
on the licensing structure that underpins the<br />
management of this industry.<br />
71<br />
• A trial program to determine the effectiveness<br />
of artificial reefs at improving the quality of<br />
recreational fishing experiences will be carried<br />
out in the south-west of the State.<br />
• The Licensing and Registry Services Unit<br />
will make a significant contribution to the<br />
development of the business and functional<br />
requirements that will lead to the introduction<br />
of the new Entitlement Management System<br />
for commercial fishers, which will include<br />
entitlement trading online.
AgENCy PERFORMANCE � SERvICE 1 – <strong>FISHERIES</strong> MANAgEMENT<br />
• The second phase of implementing a full<br />
quota catch management system for the West<br />
Coast Rock Lobster Managed Fishery will<br />
be operational for the season commencing<br />
November 2011 and preparations for<br />
introducing a new management plan from<br />
2013 made.<br />
• The Department and the Western Australian<br />
Fishing Industry Council will work together<br />
to introduce changes to commercial rock<br />
lobster licensing, which will enable those with<br />
a financial stake in the fishery to have their<br />
investment more clearly recognised.<br />
• A new management plan will be finalised and<br />
implemented for the commercial mackerel<br />
fishery.<br />
• Model Management and Environmental<br />
Monitoring Plans (MEMP) will be developed<br />
for small-scale aquaculture operators and a<br />
guidance note written for the preparation of a<br />
MEMP for larger-scale operators.<br />
• Aquatic biosecurity policies, standards and<br />
procedures will be completed and promoted<br />
for both marine and freshwater environments.<br />
• Assessments will be carried out of the<br />
cumulative impact (direct and indirect) of<br />
coastal and offshore development proposals<br />
on the fisheries sector.<br />
72<br />
• Translocation policies and procedures will<br />
be completed and made assessable to<br />
clients and the public using the Department’s<br />
corporate website.<br />
• A number of initiatives will be progressed<br />
involving the Abrolhos Islands including the<br />
Abrolhos Islands Management Plan, a new<br />
body corporate lease, and the development of<br />
a new tourism plan and aquaculture policies.<br />
• Spatial interpretation and analysis will be<br />
completed to support pre and post incident<br />
monitoring for potential oil spill responses.<br />
• New legislation to replace the Fish Resources<br />
Management Act 1994 and the Pearling Act<br />
1990 will be progressed.
AgENCy PERFORMANCE � SERvICE 2 – COMPLIANCE AND EDUCATION<br />
Service 2 – Compliance and education<br />
the Regional Services Division has overall<br />
responsibility for delivery of the Department of<br />
Fisheries’ compliance and education services. the<br />
division develops and implements compliance,<br />
communications and education strategies to<br />
ensure fishing behavior is consistent with the<br />
Department’s ‘fish for the future’ objective.<br />
Staff in the Regional Services Division are widely<br />
dispersed around the coastal areas of the State<br />
and located in five regional offices, 12 district<br />
offices, the Department’s Perth head office and the<br />
Western Australian Fisheries and Marine Research<br />
Laboratories at Hillarys, and are the Department’s<br />
primary public interface.<br />
The Department provides its compliance<br />
and education service through the allocation of<br />
resources across the following branches.<br />
regional Services Branch<br />
The Department’s Regional Services Branch is<br />
responsible for the delivery of fisheries enforcement<br />
in recreational and commercial fisheries, the<br />
pearling and aquaculture industries, and in Fish<br />
73<br />
Habitat Protection Areas and marine parks. It also<br />
provides some education services, along with<br />
marine safety services, on behalf of the Department<br />
of Transport.<br />
To maximise efficiency and effectiveness of<br />
compliance and at-sea servicing requirements in<br />
marine parks and reserves, the Regional Services<br />
Branch is also actively involved in joint operational<br />
planning and cross-authorisation training with the<br />
Department of Environment and Conservation.<br />
A wide range of compliance tools are used<br />
by the Regional Services Branch to ensure<br />
that the fishing industry and public comply with<br />
fisheries legislation. These tools include land<br />
and sea patrols, aerial surveillance, covert<br />
operations, mobile patrols and educational<br />
activities. Compliance strategies are developed and<br />
resources allocated to fisheries and associated<br />
areas of highest risk through a comprehensive risk<br />
assessment process.<br />
The Regional Services Branch has five regional<br />
offices – Gascoyne, Metropolitan, Mid-West, North<br />
and South – which each control a number of district<br />
offices. These regional operational areas are
AgENCy PERFORMANCE � SERvICE 2 – COMPLIANCE AND EDUCATION<br />
supported by the Regional Services Branch Perthbased<br />
Central Support Services and Strategic Policy<br />
sections.<br />
communications and<br />
education Branch<br />
The Communications and Education Branch aims<br />
to build the knowledge, values and attitudes that<br />
are necessary to reinforce sustainable community<br />
behavior in the aquatic environment. It achieves<br />
this by keeping the Western Australian community<br />
informed about developments in marine science,<br />
fisheries management and compliance, and<br />
engaging the community and Department of<br />
Fisheries’ volunteers in marine education, research,<br />
policy and planning processes.<br />
The Communications and Education Branch<br />
is comprised of five areas – communications,<br />
media liaison, education and volunteers, the<br />
Naturaliste Marine Discovery Centre, and Trade and<br />
International Relations.<br />
Work commenced in the latter part of the<br />
2010/11 financial year to combine the education<br />
and volunteer team with the Naturaliste Marine<br />
Discovery Centre to form a community and education<br />
unit. The development of this unit recognises the<br />
growing importance of involving the community in the<br />
Department’s management efforts.<br />
74<br />
Service 2 – Compliance and education<br />
– Major Achievements for 2010/11<br />
State-wide<br />
• A quota catch monitoring system and associated<br />
compliance program was implemented for the<br />
West Coast Rock Lobster Managed Fishery.<br />
• Twenty-three new trainee Fisheries and Marine<br />
Officers were recruited.<br />
• The Department of Fisheries’ state-wide<br />
schools education program won the Science<br />
Outreach Initiative prize at the 2010 Western<br />
Australian Science Awards.<br />
• The Perth Beachcombers Education Kit was<br />
recognized as a finalist in the Environmental<br />
Education and Communication Category of the<br />
.<br />
• The successful development, completion<br />
and launch of the Primary School phase of a<br />
new interactive curriculum-linked web-based<br />
education tool called Marine WATERs (Western<br />
Australian Teacher Education Resources).<br />
• A range of over 150 technical, educational<br />
and promotional print and e-media titles were<br />
published, including departmental websites,<br />
Western Fisheries magazine, research and<br />
management reports, log books, recreational<br />
fishing guides, species identification guides,<br />
posters, stickers, signage, display banners and
AgENCy PERFORMANCE � SERvICE 2 – COMPLIANCE AND EDUCATION<br />
other material to support the Department’s<br />
strategic goals and operations.<br />
• An overseas trade mission to Korea and China<br />
was managed for the Department’s Chief<br />
Executive Officer and six delegates.<br />
• The WA Fish eNews email newsletter was<br />
produced and published every week for the<br />
Western Australian fishing industry.<br />
• Over 4,000 school students and more than<br />
10,000 members of the general public visited<br />
the Naturaliste Marine Discovery Centre.<br />
• There was continued collaboration with<br />
government and non-government agencies<br />
that enhance the delivery of fisheries and<br />
sustainable natural resource management<br />
education programs across the State.<br />
Northern Region<br />
• Mobile patrols of recreational fishing activity<br />
were successfully implemented at Broome and<br />
Kununurra.<br />
• A new Community Education Officer was<br />
appointed to the Northern Bioregion.<br />
• A recreational compliance and education<br />
campaign was carried out at Port Hedland.<br />
• A Western Australian Work Safety Award was<br />
won for the safety upgrades to the Broome<br />
Tropical Aquaculture Park.<br />
Gascoyne Region<br />
• An educational tour of the Gascoyne Region<br />
was carried out, which included schools<br />
at Denham, Useless Loop, Carnarvon and<br />
Exmouth and a number of community events.<br />
75<br />
• A new rigid inflatable boat, FD44 was delivered<br />
to the Carnarvon District Office, increasing the<br />
ability to carry out compliance services across<br />
both commercial and recreational fisheries.<br />
• A new mobile recreational fisheries patrol<br />
successfully delivered compliance and<br />
educational services across the region from<br />
Onslow to Kalbarri.<br />
Mid-West Region<br />
• A significant increase was made in the number<br />
of education and compliance contacts with<br />
land-based recreational fishers, including<br />
in the Jurien Bay Marine Park, through the<br />
introduction of the mobile patrol service.<br />
• Targeted recreational demersal fishing<br />
compliance operations were carried out during<br />
the Easter and April school holiday period.<br />
• Public recreation infrastructure was installed<br />
at Turtle Bay (East Wallabi Island in the<br />
Houtman Abrolhos) in collaboration with the<br />
Northern Agricultural Catchment Council.<br />
• A new aquatic guide of the Houtman Abrolhos<br />
Islands was produced.
AgENCy PERFORMANCE � SERvICE 2 – COMPLIANCE AND EDUCATION<br />
Metropolitan Region<br />
• The Lancelin District Office was re-established<br />
to provide compliance services focusing on<br />
West Coast Rock Lobster Managed Fishery<br />
quota management and west coast demersal<br />
scalefish.<br />
• Mobile patrols operating from Hillarys,<br />
Fremantle and Mandurah were established,<br />
providing additional compliance services in<br />
recreational fisheries within the Metropolitan<br />
Region and in other key areas around the<br />
State when required.<br />
• The Rockingham Office was provided with two<br />
four-wheel-drive quad bikes to improve access<br />
to recreational fishers on local beaches from<br />
Safety Bay to Mandurah. This equipment<br />
upgrade has led to a massive increase in<br />
efficiency in the number of contacts and<br />
inspections in support of new initiatives in<br />
west coast demersal scalefish management.<br />
• Five major joint operations were carried out<br />
with the WA Police (Peel Region) targeting<br />
fishing and drink-driving non-compliance.<br />
These operations resulted in 391 vehicles<br />
being checked and 41 infringements, eight<br />
infringement warnings and 11 prosecution<br />
briefs being issued for fisheries-related<br />
offences.<br />
Southern Region<br />
• A recreational fishing mobile patrol was<br />
established in the Southern Region.<br />
76<br />
• A collaborative interpretive education program<br />
was carried out in conjunction with the<br />
Department of Environment and Conservation<br />
for Walpole-Nornalup Marine Park.<br />
Service 2 – Compliance and education<br />
– Major Initiatives for 2011/12<br />
State-wide<br />
• The secondary school phase of the Marine<br />
WATERs online education resource will be<br />
developed, supported by a further $150,000<br />
sponsorship from Woodside Energy, extending<br />
the resource to Years 7 – 10.<br />
• The new corporate website and an innovative<br />
electronic guide to Western Australian<br />
recreational fishing rules, providing bag and<br />
size limits that can be accessed using thirdgeneration<br />
(3G) mobile phones, will be launched.<br />
• Planning and development of the new Intranet<br />
will commence to provide a single, easily<br />
accessed source of information for staff,<br />
integrated into the Department’s systems and<br />
processes.<br />
• Volunteering and the use of volunteers will be<br />
reviewed across the Department of Fisheries.
AgENCy PERFORMANCE � SERvICE 2 – COMPLIANCE AND EDUCATION<br />
• A community education officer will be<br />
appointed to the Pilbara/Gascoyne regions in<br />
a fly-in/fly-out role.<br />
• The interactive equipment, such as touch<br />
screens and displays, in the Department’s<br />
Naturaliste Marine Discovery Centre will be<br />
upgraded and enhanced in order to provide<br />
a better educational experience through<br />
partnerships with similar educational centres<br />
such as Scitech and the WA Museum.<br />
Northern Region<br />
• The planning and development of compliance<br />
and education programs for services<br />
for marine parks in the Kimberley will<br />
be progressed with the Department of<br />
Environment and Conservation.<br />
• Industry consultation will be conducted for<br />
amendments to the Northern Demersal<br />
Scalefish Fishery Management Plan as the<br />
result of services for marine parks in the<br />
Kimberley.<br />
• Formal management arrangements will be<br />
progressed for commercial mud crab fishing in<br />
the Kimberley.<br />
• The development and implementation of<br />
management and compliance service delivery<br />
arrangements will continue for the Indian<br />
Ocean Territories.<br />
• Assistance will be provided for the<br />
development of a barramundi restocking<br />
program for Lake Kununurra.<br />
77<br />
Gascoyne Region<br />
• The Denham Fisheries Office – a multi-agency<br />
building incorporating the Department of<br />
Environment and Conservation and the Volunteer<br />
Marine Safety program – will be completed.<br />
• Stage two of the Gascoyne Demersal Scale<br />
Fish Management Plan will be introduced and<br />
implemented.<br />
• A new rigid inflatable boat will be delivered<br />
to the Denham district, increasing the ability<br />
to carry out compliance services across both<br />
commercial and recreational fisheries.<br />
Mid-West Region<br />
• An industry education program will be provided<br />
to support the ‘year-two’ changes of the<br />
introduction of a quota catch management<br />
system in the West Coast Rock Lobster<br />
Managed Fishery.<br />
• A number of capital works projects relating to<br />
the Abrolhos Islands will be undertaken including<br />
the installation of at least 10 new ‘courtesy’<br />
vessel moorings at safe anchoring areas and key<br />
dive sites; a major upgrade of aerodromes; the<br />
installation of additional dive trail markers at key<br />
dive sites and marine archeological sites; and<br />
the construction of a medium-sized patrol vessel<br />
to service the islands.
AgENCy PERFORMANCE � SERvICE 2 – COMPLIANCE AND EDUCATION<br />
Metropolitan Region<br />
• The Lancelin Office will be provided with two<br />
four-wheel-drive quad bikes to improve access<br />
to recreational fishers on local beaches<br />
between Two Rocks and Wedge Island.<br />
• Assessment and planning for the purchase<br />
of a new mobile education trailer will be<br />
conducted as part of enhancing the community<br />
education program in the Perth metropolitan<br />
area and the wider regional areas.<br />
Southern Region<br />
• New management arrangements will be<br />
finalised for the South Coast Crustacean<br />
Fishery.<br />
• A catch record card for recreational fishers<br />
who use Busselton Jetty will be implemented<br />
and promoted for data collection purposes to<br />
aid fisheries management.<br />
• At-sea compliance capabilities will be<br />
increased with delivery of new patrol vessels<br />
in Albany and Busselton.<br />
78
AgENCy PERFORMANCE � CASE STUDy 1<br />
CASE STUDy 1 rock lobster in focus – the transition to quota management<br />
and the low recruitment of young lobsters<br />
The lower levels of ‘recruitment’<br />
of young lobsters into the western<br />
rock lobster fishery became<br />
evident in the 2010/11 season.<br />
The start of the 2010/11 western rock lobster<br />
fishing season heralded the start of a significant<br />
process of change for the West Coast Rock Lobster<br />
Managed Fishery, as it began the transition from<br />
management by input controls towards a full Total<br />
Allowable Commercial Catch (TACC)/Individual<br />
Transferable Quota (ITQ) output management<br />
system. This process will involve substantial change<br />
to the management arrangements for the fishery<br />
and, as such, is being implemented over a number<br />
of years.<br />
The implementation of a TACC/ITQ catch<br />
management system will bring a range of benefits<br />
to licence holders and operators in the fishery,<br />
allowing them greater flexibility in determining<br />
how and when they fish. This will provide greater<br />
scope to respond to, among other things, seasonal<br />
fluctuations in the price of lobsters and changes in<br />
the cost of fishing. The increased flexibility should<br />
provide licensees and operators with an improved<br />
ability to increase their profitability.<br />
From a fishery management perspective,<br />
moving to a TACC framework will provide for much<br />
more direct control over the catch of the fishery.<br />
With input controls used in the past, the catch<br />
taken by the fishery varied with the levels of lobster<br />
abundance (or catchability) and the values set for<br />
79<br />
input controls (such as the number of pots that<br />
could be used by a fisher, the length of the season<br />
or the number of fishing days per week).<br />
However, in recent years, when targeting<br />
particular catch ‘outcomes’ (such as the 5,500<br />
tonne catch target for 2009/10), the use of input<br />
controls has required regular review and adjustment<br />
of factors such as pot usage, season length or<br />
fishing days. This level of ‘micro-management’ has<br />
been difficult for both the rock lobster industry and<br />
Government, as it has required frequent changes<br />
to the input controls to deliver the desired catch<br />
outcome. Moving to a TACC will give certainty about<br />
the catch outcome without the need for frequent<br />
changes to input controls.<br />
The first year of the move towards a TACC/ITQ<br />
framework has required the implementation of catch<br />
limits on licences, with the level of the limit varying<br />
in accordance with the number of units of (pot)<br />
entitlement on the licence and the zone to which the<br />
licence related. Thus, for those licensees in Zone B<br />
and Zone C, the limit was 81 kg and 75 kg per unit<br />
respectively. For Zone A the limit was split into two<br />
parts, according to which part of the season the<br />
fishing was being carried out in. For the period prior<br />
to 15 March the limit was set at 36 kg, and for the<br />
period 15 March to 31 August it was set at 51 kg.
AgENCy PERFORMANCE � CASE STUDy 1<br />
The move to weight-based output controls<br />
also involved significant changes in the compliance<br />
framework for the fishery, with the compliance<br />
focus moving away from the quantity of gear used<br />
and days fished to the quantity of lobsters landed.<br />
This involved the implementation of a weighing<br />
and documentation process to record the weights<br />
of catches delivered by fishers and to track the<br />
consignments of lobsters.<br />
Overall, implementation of the first phase of<br />
the TACC/ITQ management went well, with only minor<br />
teething issues. Perhaps the major complaint was<br />
that the system, as implemented in the 2010/11<br />
season, did not provide the range of benefits (such<br />
as within-season transfers) that could be expected<br />
with a fully-developed TACC/ITQ system.<br />
Given that the 2010/11 implementation<br />
was the first stage of the move to full TACC/<br />
ITQ management, it was not expected that the<br />
full benefits would be realised in that season.<br />
Nevertheless, when difficulties were experienced<br />
during January in supplying lobsters into the Chinese<br />
market, the flexibility for at least coastal fishery<br />
operators to adapt to changing market circumstances<br />
by simply delaying their fishing activities was<br />
regarded as a welcome feature of the new system.<br />
The need to impose catch limits through<br />
explicit catch controls in the 2010/11 season,<br />
and catch targets in 2009/10 and 2008/09,<br />
arose from declines in the recruitment of young<br />
lobsters into the main stocks, as evidenced by<br />
80<br />
marked reductions in puerulus 1 settlement levels in<br />
2007/08, 2008/09 and 2009/10.<br />
In order to ‘flatten out’ the overall western<br />
rock lobster catch so that reasonable catches could<br />
still be taken during the years when the fishery<br />
was undergoing lower levels of recruitment, catch<br />
targets in the years preceding the entry of these low<br />
recruitment years into the main stocks were set at<br />
lower levels. This ensured that reasonable catches<br />
could be taken in the low recruitment years while<br />
still maintaining adequate breeding stock levels.<br />
The lower levels of recruitment to the fishery<br />
become evident during the 2010/11 season, with<br />
noticeable drops in the relative abundance of<br />
smaller lobsters. However, during 2010/11 there<br />
were signs that puerulus settlement was improving,<br />
although settlement levels were still below the longterm<br />
average (see Figure 38 overleaf).<br />
Studies of the likely cause of the period<br />
of low recruitment of young lobsters into the<br />
stocks strongly suggest that a combination of<br />
environmental factors was the primary cause. The<br />
studies point towards oceanographic conditions<br />
being unfavourable both for the survival of larvae<br />
1 Puerulus are the final stage of the long (around nine-month)<br />
larval phase of rock lobsters. Artificial seaweed collectors are<br />
placed at various sites along the south and mid-west coasts of<br />
WA and used to capture some of these puerulus larvae as they<br />
return to ‘settle’ and grow into adult rock lobsters. The number<br />
of puerulus captured is used as an index of the strength of<br />
recruitment to the western rock lobster stock.
AgENCy PERFORMANCE � CASE STUDy 1<br />
during the nine-month larval period and for the<br />
return to the WA coast of those that survived.<br />
The shift back towards more favourable<br />
oceanographic conditions, in particular with the end<br />
of the strong La Niña weather period as well as the<br />
return of a more normal Indian Ocean Dipole pattern<br />
of sea surface temperatures, provides a basis for<br />
some optimism for a return to normal puerulus<br />
(a) Rat Island − Preliminary May<br />
(b)<br />
Average settlement per collector<br />
20<br />
15<br />
10<br />
5<br />
0<br />
Settlement date (new moon)<br />
Recent years<br />
Long Term Average<br />
2007/08 2008/09 2009/10 2010/11 2011/12<br />
MAY<br />
JUL<br />
SEP<br />
NOV<br />
JAN−08<br />
MAR<br />
MAY<br />
JUL<br />
SEP<br />
NOV<br />
JAN−09<br />
MAR<br />
MAY<br />
JUL<br />
SEP<br />
NOV<br />
JAN−10<br />
MAR<br />
MAY<br />
JUL<br />
SEP<br />
NOV<br />
JAN−11<br />
MAR<br />
MAY<br />
JUL<br />
SEP<br />
NOV<br />
JAN−12<br />
MAR<br />
Average settlement per collector<br />
20<br />
15<br />
10<br />
5<br />
0<br />
Seven Mile Beach − Preliminary May<br />
2007/08 2008/09 2009/10 2010/11 2011/12<br />
MAY<br />
JUL<br />
SEP<br />
NOV<br />
JAN−08<br />
MAR<br />
MAY<br />
JUL<br />
SEP<br />
NOV<br />
JAN−09<br />
MAR<br />
MAY<br />
JUL<br />
SEP<br />
NOV<br />
JAN−10<br />
MAR<br />
MAY<br />
JUL<br />
SEP<br />
NOV<br />
JAN−11<br />
MAR<br />
MAY<br />
JUL<br />
SEP<br />
NOV<br />
JAN−12<br />
MAR<br />
Settlement date (new moon)<br />
Recent years<br />
Long Term Average<br />
81<br />
settlement levels. However, even if puerulus<br />
settlement returns to more normal levels during<br />
2011/12, it will be three to four years before the<br />
first wave of any improved recruitment enters the<br />
fishery. On that basis, conservative catch levels will<br />
continue to be necessary for the West Coast Rock<br />
Lobster Managed Fishery for the next few years.<br />
Figure 38. the graphs nearby show the average monthly settlement of rock lobsters that reach the puerulus<br />
stage from May 2007 to March 2012 and the actual settlement until May 2011 at (a) Rat Island<br />
(Abrolhos Islands) and (b) Seven Mile Beach puerulus collectors.
AgENCy PERFORMANCE � CASE STUDy 1<br />
Marine Stewardship Council certification of<br />
the western rock lobster fishery<br />
In March 2000 an industry-led initiative resulted<br />
in the West Coast Rock Lobster Managed Fishery<br />
becoming the first fishery in the world to be certified<br />
by the Marine Stewardship Council (www.msc.org) as<br />
a sustainable and well-managed fishery.<br />
The Marine Stewardship Council certification<br />
process is considered to be the most rigorous<br />
and comprehensive independent fisheries<br />
assessment in the world and the West Coast<br />
Rock Lobster industry has demonstrated strong<br />
leadership in its willingness to embrace this<br />
stringent and transparent process. The industry<br />
has completed its requirements for the anticipated<br />
Marine Stewardship Council re-certification of the<br />
commercial western rock lobster fishery for a further<br />
five-year period when its current certification expires<br />
in November 2011.<br />
More than 300 fisheries are currently engaged<br />
in the Marine Stewardship Council program (106<br />
are certified), which together record annual catches<br />
of more than seven million tons of seafood, i.e. 12<br />
per cent of the landings for human consumption.<br />
Worldwide, over 10,000 seafood products, worth<br />
over AUD$2 billion/year at retail, bear the blue<br />
Marine Stewardship Council eco-label.<br />
82<br />
The Marine Stewardship Council process<br />
provides a rigorous independent expert review under<br />
three broad principles:<br />
• Stock assessment and harvest strategy (e.g.<br />
are the levels of breeding stock and the fishing<br />
effort/exploitation sustainable in the long<br />
term?)<br />
• The impact of the fishery on the wider ecology<br />
(e.g. what is the impact of large scale removal<br />
of lobsters, of pots on the seabed [including<br />
corals], on bycatch species [e.g. octopus and<br />
finfish] and endangered species [e.g. sea<br />
lions, turtles, whales]?)<br />
• Management and consultation arrangements<br />
(e.g. how robust and flexible is the<br />
management framework; are the decisionmaking<br />
processes effective, transparent<br />
and inclusive; how are stakeholders – such<br />
as commercial and recreational fishers and<br />
conservation non-governmental organisations<br />
– consulted during the development<br />
and implementation of management<br />
arrangements?)<br />
The latest Marine Steward Council reports on<br />
the western rock lobster fishery can be found at:<br />
http://www.msc.org/track-a-fishery/certified/southatlantic-indian-ocean/western-australia-rock-lobster
AgENCy PERFORMANCE � CASE STUDy 2<br />
CASE STUDy 2 recreational fisheries management in focus<br />
Licence fees from the<br />
‘Recreational Fishing from<br />
Boat Licence’ produced<br />
around $25 million to be spent<br />
directly on recreational fishing<br />
management initiatives.<br />
RFBL fees help ensure ‘fish for the future’<br />
On 1 March 2011, the Department’s ‘Recreational<br />
Fishing from Boat Licence’ passed its first<br />
anniversary – and has provided a major boost<br />
for the future sustainability of some of Western<br />
Australia’s best-known demersal and nearshore<br />
species through its introduction.<br />
In the 12-months since it was introduced,<br />
almost 115,000 ‘RFBLs’ were issued to<br />
recreational fishers who use powered boats. The<br />
successful take-up of the new licence means<br />
that the Department of Fisheries has been<br />
able to create by far the biggest database of<br />
recreational fishers ever compiled in WA, providing<br />
its research scientists with vital information to aid<br />
the management of fish stocks along the State’s<br />
coastline.<br />
In addition, the licence fees have generated<br />
around $2.5 million in revenue that has been<br />
placed in a recreational fishing account to be<br />
spent directly on recreational fishing management<br />
initiatives. During 2010/11, the Department had<br />
extensive discussions with recreational fishing<br />
representative body Recfishwest in considering how<br />
the revenue should be spent.<br />
The revenue from the RFBL has so far been<br />
used to improve compliance with recreational<br />
fishing rules by increasing patrols of Fisheries and<br />
To help research, some 3,000 boat fishers have volunteered to<br />
track their own catches and share this information every month<br />
for a year. Photo: Ashley Malone<br />
Marine Officers, increase support for Recfishwest’s<br />
role as the peak body representing recreational<br />
fishers, explore the potential of artificial reefs,<br />
83
AgENCy PERFORMANCE � CASE STUDy 2<br />
develop the Lake Kununurra barramundi broodstock<br />
collection and deliver recreational fishing guides<br />
and information to a broad official network of tackle<br />
shops and other retail outlets. In the future, RFBL<br />
monies will continue to be spent on research,<br />
management and compliance as well as particular<br />
targeted projects such as artificial reefs and<br />
restocking programs.<br />
The RFBL has also enabled the creation of a<br />
comprehensive database of recreational boat fishers<br />
and where they live in WA, providing a platform for<br />
highly detailed surveying to be carried out on how<br />
much time is spent fishing and what is caught by a<br />
huge range of fishers. This will enable a much more<br />
accurate estimation of what recreational fishers<br />
catch in total over the State than could be achieved<br />
simply with regional boat ramp ‘creel surveys’<br />
previously used mainly by the Department.<br />
Owing to sustainability concerns about<br />
fishing for key demersal species, such as dhufish,<br />
pink snapper and baldchin groper, in the West<br />
Coast Bioregion (from Kalbarri to Augusta), the<br />
Department of Fisheries has needed to concentrate<br />
its catch and effort monitoring program in this area<br />
in the last five years.<br />
With the information from the database, the<br />
Department will now be able to readily contact<br />
fishers in the other three bioregions and compile<br />
a more accurate picture of what is happening with<br />
recreational fishing catches and the amount of<br />
84<br />
time spent fishing. This will lead to better and more<br />
informed management decisions being made.<br />
Some field work, similar to past creel surveys,<br />
is still being carried out to estimate the size and<br />
weight of different fish species being caught, but<br />
the primary estimates of catch and effort will come<br />
through a log book program that is being run using<br />
the RFBL database.<br />
In late 2010 the Department contacted<br />
a random sample of recreational fishers using<br />
the database and, in cooperation with partners<br />
Recfishwest, Edith Cowan University and Murdoch<br />
University, signed-up 3,000 boat fishers from<br />
around the State who volunteered to track their own<br />
catches and share this information every month for<br />
a year.<br />
For the log book survey, 2,000 fishers have<br />
been randomly selected from the wider Perth<br />
metropolitan area and 1,000 fishers have been<br />
similarly selected from regional areas of the<br />
State. In addition, in 2011, between 5,000 and<br />
10,000 fishers will be surveyed at boat ramps by<br />
researchers at the end of their fishing trip, and<br />
catch information will also be gathered from a<br />
similar number of fishers who come into contact<br />
with the Department’s Fisheries and Marine Officers<br />
during this period.<br />
The survey work will provide an estimate of the<br />
overall recreational boat fishing catch and effort in<br />
WA in 2012.
AgENCy PERFORMANCE � CASE STUDy 2<br />
Management strategies succeed in boosting<br />
Cockburn Sound crab numbers<br />
Crab fishers benefited during the 2010/11 summer<br />
from continuing improvement in blue swimmer<br />
crab stocks in Cockburn Sound, off the Perth<br />
metropolitan coast.<br />
Stocks of blue swimmer crabs are recovering<br />
well after a three-year total freeze on crab fishing<br />
was lifted in the 2009/10 summer and replaced<br />
by a limited three-and-a-half-month fishing season.<br />
The fishery’s continuing recovery enabled Fisheries<br />
Minister Norman Moore to extend the 2010/11<br />
recreational season to four-and-a-half months,<br />
allowing crabbers to enjoy the pastime over Easter.<br />
The duration of the commercial crab fishing<br />
season in Cockburn Sound remained the same as<br />
in the previous year (December 15 – March 31),<br />
but the minimum size of blue swimmer crabs that<br />
commercial fishers were allowed to catch was<br />
reduced to 135 mm carapace width from 140 mm.<br />
The Department will continue to monitor crab<br />
stocks in Cockburn Sound as a priority for the<br />
foreseeable future.<br />
Recreational fishing rules – available on a<br />
special flyer – ‘Crabbing for blue swimmer crabs in<br />
the West Coast Region’ – include a minimum size<br />
limit of 127 mm carapace width, a bag limit of 10<br />
crabs per fisher per day, and a boat limit of 20<br />
crabs.<br />
The recreational Cockburn Sound crab fishery was extended to<br />
four-and-a-half months during 2010/11, as stocks recovered<br />
well after a three-year total freeze on crab fishing, which was<br />
lifted in 2009/10.<br />
85
AgENCy PERFORMANCE � CASE STUDy 2<br />
Hi-tech tagging helps manage Cockburn<br />
Sound snapper stocks<br />
Department of Fisheries research carried out in<br />
Cockburn Sound during 2010/11 has used high<br />
technology acoustic tags to track the movements of<br />
pink snapper to and from the area. Cockburn Sound<br />
is the only significant spawning area for pink snapper<br />
in the West Coast Bioregion – the stretch of coast<br />
running from east of Augusta to the Zuytdorp Cliffs,<br />
north of Kalbarri.<br />
Every year, some time between August<br />
and December, thousands of adult pink snapper<br />
congregate in Cockburn Sound to release their eggs<br />
and sperm, as part of what are known as ‘spawning<br />
aggregations’. As a result, there is an annual seasonal<br />
Fisheries researcher with a pink snapper (Inset: pink snapper<br />
with tags near dorsal fin).<br />
86<br />
closure to pink snapper fishing in the area (extended<br />
as part of a package of management changes in<br />
2005), which runs from October 1 to December 15 to<br />
protect these spawning fish.<br />
Fish that join the spawning aggregation in<br />
Cockburn Sound reach sexual maturity when they<br />
are about six years old and 600 mm in length.<br />
These fish are much larger relative to those from<br />
other areas in the West Coast Bioregion – which<br />
means they can produce relatively larger numbers of<br />
eggs – and are thus very important for pink snapper<br />
stocks in the entire bioregion.<br />
The Department of Fisheries has been<br />
conducting surveys since 2001 to estimate<br />
the spawning biomass of snapper that form<br />
the aggregations in Cockburn Sound each year.<br />
Preliminary estimates suggest the biomass was<br />
declining prior to the management changes in 2005,<br />
but has subsequently increased as the result of<br />
factors such as changing the timing and extending<br />
the length of the closure from six to ten weeks, and<br />
adjusting the daily bag limit so that a maximum of<br />
one fish over 70 cm in length could be taken.<br />
Other factors that have helped to increase<br />
the spawning biomass include an influx of mature<br />
pink snapper into the Cockburn Sound spawning<br />
population from the strong stock recruitment that<br />
occurred in 1999.
AgENCy PERFORMANCE � CASE STUDy 2<br />
Send Us Your Skeletons helps<br />
fisheries science<br />
Fishers who participated in the ‘Send Us Your<br />
Skeletons’ initiative provided the Department’s<br />
research division with fish skeletons of a number of<br />
demersal fish (thosse that live on or near the sea<br />
bottom) and nearshore fish species, along with the<br />
particulars of their catch, including when and where<br />
the fish were caught.<br />
Researchers needed the filleted fish skeletons<br />
– with head and guts intact – to support research<br />
into key finfish species from the West Coast<br />
Bioregion (north of Kalbarri to east of Augusta),<br />
such as Western Australian dhufish, pink snapper<br />
and Australian herring.<br />
Analysing data collected from fish frames<br />
is one of the best ways that fisheries scientists<br />
can assess the health of fish stocks, which is<br />
used to help manage WA’s prized fish stocks more<br />
effectively and ensure there are ‘fish for the future’.<br />
Important information that is collected from fish<br />
skeletons includes the length, sex and reproductive<br />
stage, and age of the fish.<br />
Recreational fishers were encouraged to drop<br />
off their fish skeletons at Department of Fisheries’<br />
regional offices and participating tackle stores.<br />
The recreational fishing industry provided great<br />
support for ‘Send Us Your Skeletons’ by providing<br />
a number of incentives for skeleton donation.<br />
Those fishers who gave their fish frames to the<br />
Fisheries researcher Josh Brown and volunteer Laurie Birchall<br />
demonstrate how to remove fillets from a fish and donate its<br />
skeleton. Photo: Matthew Terwey<br />
Department went into a prize draw for a number<br />
of prizes donated by industry, including a weeklong<br />
charter fishing trip to the Montebello Islands,<br />
courtesy of Montebello Island Charters.<br />
87
CASE STUDy 3<br />
AgENCy PERFORMANCE � CASE STUDy 3<br />
Trochus shell after commercial<br />
polishing.<br />
Aboriginal community commercial fishing:<br />
the western Australian trochus fishery<br />
The Bardi Jawi and Mayala Native Title holders 1<br />
of One Arm Point are the only people permitted to<br />
commercially harvest trochus shell in the waters<br />
of Western Australia. Trochus shell has been<br />
commercially harvested by the Bardi Jawi and Mayala<br />
people in the waters around the Dampier Peninsula<br />
and Buccaneer Archipelago since at least the 1960s.<br />
It is a small fishery based on a single target<br />
species of trochus shell (Trochus niloticus) being<br />
collected by hand, with between two to 15 tonnes<br />
exported annually over the past decade. The fishing<br />
grounds are located in the remote Kimberley region<br />
of Western Australia and include the Native Title area<br />
waters of the Bardi Jawi and Mayala people.<br />
The Trochus Fishery is managed under an<br />
Instrument of Exemption (see Appendix 4 of this<br />
report for details of types of exemptions), permitting<br />
community-nominated community members from<br />
One Arm Point to take trochus for a commercial<br />
purpose in the Bardi Jawi and Mayala Native Title<br />
areas. The collectors use boats (mostly four to fivemetre<br />
long dinghies) to access the outer reefs from<br />
which they hand-pick trochus from exposed reef<br />
tops during low tides.<br />
1 Ardyaloon Incorporated is the commercial arm of the Ardyaloon Aboriginal<br />
Community Council, located at One Arm Point, representing the Bardi Jawi<br />
and Mayala Native Title holders.<br />
Between two to 15 tonnes of trochus shell are exported<br />
annually after being collected by hand by the Bardi Jawi and<br />
Mayala People.<br />
88<br />
In 2007, representatives from the One Arm<br />
Point Aboriginal community and the Department of<br />
Fisheries agreed to a revised set of co-management<br />
arrangements for the Trochus Fishery including:<br />
• a maximum size limit of 100 mm<br />
(basal shell diameter);<br />
• minimum size limit of 75 mm<br />
(basal shell diameter);
AgENCy PERFORMANCE � CASE STUDy 3<br />
• two area closures; and<br />
• an annual quota (15 tonnes).<br />
Under the co-management arrangements all<br />
trochus is picked from exposed reef (no diving<br />
is permitted) and all shell is sold through one<br />
central point.<br />
The Trochus Fishery’s low impact collection<br />
methods result in minimal impact on reef habitat<br />
and the wider ecosystem generally, and there is no<br />
bycatch in the fishery.<br />
The co-management approach provides the<br />
One Arm Point Aboriginal Community with a sense<br />
of ownership and responsibility in managing the<br />
stocks to ensure they are sustainable. There is<br />
a strong customary marine tenure aspect to the<br />
fishery that enhances the sense of ownership of<br />
the Community.<br />
All trochus is picked from exposed reef by the Bardi Jawi and Mayala people and all shell is sold through one central point.<br />
89
AgENCy PERFORMANCE � SERvICE 3 – RESEARCH AND MONI<strong>TO</strong>RINg<br />
Service 3 – Research and Monitoring<br />
the Research Division is responsible for the<br />
delivery of the Department of Fisheries’ research<br />
and monitoring service. the primary role of<br />
the Research Division is to provide timely and<br />
quality scientific knowledge and objective advice<br />
to support the management, conservation and<br />
sustainable use of the State’s aquatic resources.<br />
Ongoing research, monitoring and assessment<br />
programs are focused on supporting the<br />
management of the State’s major fish stocks<br />
and the marine ecosystems that underpin these<br />
resources. these activities also contribute to the<br />
Department of Fisheries meeting its statutory<br />
responsibilities.<br />
The Research Division’s 130-plus staff members,<br />
of which over 45 are professionally-qualified<br />
research scientists, work within four expertisebased<br />
branches (Invertebrate Fisheries, Finfish<br />
Fisheries, Biodiversity and Biosecurity, and Stock<br />
Assessment and Data Analysis), with monitoring<br />
and assessment research projects frequently<br />
conducted by multi-disciplinary teams, increasingly<br />
in cooperation with external research partners.<br />
90<br />
The major research activities undertaken by<br />
the Research Division are:<br />
• Provision of objective expert scientific advice<br />
to assist the Department of Fisheries to<br />
implement a comprehensive holistic approach<br />
to management of the State’s aquatic natural<br />
resources (i.e. Ecosystem-Based Fisheries<br />
Management).<br />
• Annual reporting on the status of the key<br />
fish stocks, fisheries and their associated<br />
ecosystems in the State of the Fisheries and<br />
Aquatic Resources report.<br />
• Maintenance of long-term monitoring<br />
programs and databases to enable the<br />
scientific assessment of fish stocks and their<br />
associated ecosystems.<br />
• Development of new assessment and governance<br />
techniques to assist in aquatic management<br />
within an integrated, ecosystem-based framework.<br />
• Generating an understanding of the threats<br />
to biosecurity and biodiversity specifically<br />
associated with aquaculture activities and to the<br />
marine and freshwater environments in general.
AgENCy PERFORMANCE � SERvICE 3 – RESEARCH AND MONI<strong>TO</strong>RINg<br />
• Undertaking monitoring and research activities<br />
aimed at limiting the potential introduction and<br />
impact of marine pest species.<br />
• Investigation of the effects of fishing on<br />
stocks, habitats, bycatch species, protected<br />
species and the ecosystem in general.<br />
• Undertaking research and development<br />
activities to assist with the expansion of the<br />
State’s aquaculture industry.<br />
Significant scientific advice and contributions<br />
are also provided by the Research Division to assist<br />
the Department of Fisheries in:<br />
• Negotiating management or governance<br />
arrangements with Commonwealth agencies<br />
(such as the Department of Sustainability,<br />
Environment, Water, Populations and Communities<br />
(SEWPaC); the Department of Agriculture,<br />
Fisheries and Forestry (DAFF); and the Australian<br />
Fisheries Management Authority (AFMA)).<br />
• Providing advice to support the development of<br />
national and international strategies.<br />
• Providing advice on risks and impacts of<br />
marine and coastal developments including<br />
those associated with the resources sector.<br />
• Information to support Wildlife Trade Operation<br />
accreditation by State fisheries to obtain<br />
export approvals under the Commonwealth’s<br />
Environment Protection and Biodiversity<br />
Conservation Act 1999.<br />
The individual branches of the Research<br />
Division and their work are described below.<br />
Invertebrate fisheries<br />
91<br />
The Invertebrate Fisheries Branch undertakes<br />
research to assess and monitor the crustacean<br />
and mollusc stocks that support the State’s major<br />
fisheries, which include rock lobsters, prawns, pearl<br />
oysters, scallops, abalone and crabs.<br />
A focus of research in recent years has been<br />
the development of estimates of pre-recruitment<br />
abundance to make catch predictions and then<br />
using these predictions in the management of the<br />
fisheries through management ‘decision rules’.<br />
The Invertebrate Fisheries Branch also assists<br />
the Biodiversity and Biosecurity Branch to undertake<br />
research on broader ecosystem-related issues<br />
associated with these fisheries, such as bycatch<br />
and community structure, including a number of<br />
collaborative projects with universities, the Western<br />
Australian Museum and the Commonwealth Scientific<br />
and Industrial Research Organisation (CSIRO).<br />
The Invertebrate Fisheries Branch is<br />
also responsible for staffing and programming<br />
the Department’s major research vessel, the<br />
RV Naturaliste. This vessel undertakes a range<br />
of research activities throughout the year,<br />
encompassing trawling, fish trapping, rock lobster<br />
fishing, longlining, biodiversity studies and<br />
environmental monitoring.
AgENCy PERFORMANCE � SERvICE 3 – RESEARCH AND MONI<strong>TO</strong>RINg<br />
finfish fisheries<br />
The Finfish Fisheries Branch undertakes research<br />
to assess and monitor the State’s diverse finfish<br />
resources. The branch monitors indicator species<br />
for finfish resources in all the biogeographical<br />
regions that Western Australia has been practically<br />
divided into by the Department of Fisheries.<br />
Some of the species monitored include<br />
Western Australian dhufish, temperate snapper<br />
and baldchin groper, which are indicator species<br />
for the health of the west coast demersal scalefish<br />
resource. Other indicator species monitored and<br />
assessed include tropical shallow-water and deepwater<br />
snappers, sharks, nearshore species such<br />
as Australian herring and estuarine species such<br />
as cobbler.<br />
These species are harvested by commercial<br />
fishers (supplying local and overseas markets),<br />
the recreational fishing sector (involving around<br />
600,000 fishers) and the managed recreational<br />
charter fishing sector. Much of this research work<br />
also relates to the species and stocks that are the<br />
focus of the Department of Fisheries’ Integrated<br />
Fisheries Management strategy.<br />
The Finfish Fisheries Branch also supports<br />
a significant number of collaborative research<br />
projects at local universities and other research<br />
groups (Australian Institute of Marine Science,<br />
CSIRO) many of which involve postgraduate<br />
research students.<br />
Biodiversity and Biosecurity<br />
The Biodiversity and Biosecurity Branch has statewide<br />
responsibilities for the provision of scientific<br />
advice relating to the conservation of fish and<br />
invertebrates and protection of the environment.<br />
This includes responsibility for issues such as:<br />
• Health of benthic habitats including faunal<br />
(coral) and floral (seagrass) components.<br />
• Biosecurity issues.<br />
• Provision of fish pathology services.<br />
• Freshwater research (e.g. native fish<br />
conservation).<br />
92<br />
• Production of trout and native fish species at<br />
the Pemberton hatchery and the Shenton Park<br />
research facility.<br />
• Management of the Department’s marine<br />
aquarium facilities.<br />
The work of the Biodiversity and Biosecurity<br />
Branch is carried out in collaboration with the<br />
Department’s Aquatic Management Division, the<br />
Department of Environment and Conservation,<br />
various universities, the Australian Institute of<br />
Marine Science, natural resource management<br />
groups, and port and harbour authorities.<br />
Stock Assessment and data Analysis<br />
The Stock Assessment and Data Analysis Branch<br />
provides support for the Research Division and<br />
the Aquatic Management Division in the fields of
AgENCy PERFORMANCE � SERvICE 3 – RESEARCH AND MONI<strong>TO</strong>RINg<br />
statistical design and analysis, population dynamics<br />
and stock assessment, data management, monitoring<br />
of fishery catch and effort, library services, and<br />
recreational fishing and community surveys.<br />
In addition, the data collected during routine<br />
monitoring of commercial and recreational fisheries<br />
undergoes preliminary analysis and assessment by<br />
the Stock Assessment and Data Analysis Branch.<br />
The branch maintains the Department of<br />
Fisheries’ extensive commercial fisheries and<br />
charter boat databases and undertakes leadingedge<br />
research into the development of fisheries<br />
stock assessment models and sustainability<br />
reporting techniques. In addition, it carries out<br />
major recreational fishing and community and<br />
stakeholder attitude surveys – the results of<br />
which are added to the comprehensive fisheries<br />
databases maintained by the Research Division.<br />
This group works in close collaboration<br />
with the other Research Division branches and<br />
is primarily responsible for assessing the status<br />
of most fish stocks in Western Australia. It is<br />
through these assessments that the success of the<br />
Department’s fisheries management arrangements<br />
is effectively monitored.<br />
Service 3 – Research and Monitoring<br />
– Major Achievements for 2010/11<br />
In addition to the ongoing monitoring and<br />
assessment functions (which are all documented<br />
in the 2010/11 Research, Monitoring, Assessment<br />
and Development Plan), in 2010/11, the Research<br />
Division achieved the following successes:<br />
Invertebrates<br />
• The improved stock assessment model for<br />
western rock lobster was reviewed by a team<br />
of international experts and used to examine<br />
management scenarios for this fishery.<br />
• A Fisheries Research and Development<br />
Corporation (FRDC) research project on<br />
oceanographic modeling of the larval phase<br />
of the western rock lobster fishery was<br />
completed in collaboration with the CSIRO<br />
to identify important larval source areas that<br />
result in successful puerulus settlement.<br />
• An independent survey on the status of<br />
western rock lobster stocks in the ‘Big Bank’<br />
region (to the north of the Abrolhos Islands<br />
zone of the limited entry western rock lobster<br />
fishery) to evaluate the effects of the closed<br />
area showed a significant improvement in<br />
abundance.<br />
• An FRDC joint project with the CSIRO<br />
was initiated to assess the management<br />
implications of climate change effects on the<br />
fisheries in Western Australia.<br />
• An assessment of the spawning stock<br />
and recruitment of blue swimmer crabs in<br />
Cockburn Sound showed that stocks are<br />
recovering well and a management decision-<br />
93
AgENCy PERFORMANCE � SERvICE 3 – RESEARCH AND MONI<strong>TO</strong>RINg<br />
rule framework was used to extend the level of<br />
fishing.<br />
• A Seafood Cooperative Research Centre (CRC)<br />
bio-economic modeling project was initiated to<br />
further examine the maximum economic yield<br />
for the western rock lobster fishery.<br />
• A Seafood CRC-funded greenlip abalone<br />
enhancement study was initiated to determine<br />
the growth and survival of abalone released in<br />
the wild fishery.<br />
• A workshop on the ‘marine heatwave’ that<br />
took place over the summer of 2010/11 was<br />
undertaken to assess the effect of the record<br />
water temperatures off the mid- and lower<br />
west coast of WA on the marine life.<br />
• External reviews of research on stock status of<br />
blue swimmer crab stocks in Cockburn Sound,<br />
Peel-Harvey and Shark Bay, as well as scallop<br />
stocks in Shark Bay, were carried out.<br />
Biodiversity and Biosecurity<br />
• A baseline survey of coral habitats at the<br />
Abrolhos Islands was finished.<br />
• Monitoring for introduced marine pests in<br />
Western Australia’s three highest risk ports<br />
and Christmas Island was finished.<br />
• A review of the marron recreational fishery<br />
was undertaken to ensure its sustainability in<br />
the future.<br />
• A Natural Resource Management-funded<br />
fish ladder was constructed at Pemberton<br />
Freshwater Research Centre for native fish<br />
breeding.<br />
• Two species of native fish (pygmy perch and<br />
western minnows) were successfully bred in<br />
captivity.<br />
94<br />
• Commercial production of brine shrimp at Hutt<br />
Lagoon, Port Gregory was achieved as a result<br />
of a collaboration with Cognis Australia and<br />
FRDC. This success led to the project winning<br />
the 2010 Premier’s Award for ‘Developing the<br />
WA Economy’.<br />
• A bioregional bycatch (including threatened,<br />
endangered and protected species) risk<br />
assessment was written and published for the<br />
Gascoyne Coast, West Coast and South Coast<br />
Bioregions.<br />
Stock Assessment and Data Analysis<br />
• A fully-integrated approach to state-wide<br />
surveys of recreational boat-based fishing,<br />
using the Recreational Fishing from Boat<br />
License, was developed and implemented.<br />
• Assessment of recreational catches of the<br />
West Coast demersal scalefish catch showed<br />
that management regulations had achieved<br />
the desired 50 per cent reduction.<br />
• An FRDC project, in collaboration with Murdoch<br />
University, was finished on ecosystem health
AgENCy PERFORMANCE � SERvICE 3 – RESEARCH AND MONI<strong>TO</strong>RINg<br />
indicators relevant to the monitoring and<br />
management of Western Australian fisheries.<br />
• Qualitative assessment approaches to<br />
Ecosystem-Based Fisheries Management were<br />
completed for recreational fishing on the west<br />
coast and deep-water lobster ecosystems off<br />
Jurien Bay.<br />
Finfish<br />
• Potential methods for surveying juvenile dhufish<br />
were reviewed, involving intrastate and interstate<br />
scientific experts, leading to the development of a<br />
workplan to trial survey methods.<br />
• The first assessment was commenced of<br />
the status and connectivity of the important<br />
nearshore species, Australian herring and<br />
tailor, with support from Natural Resource<br />
Management funding.<br />
• The status and risk of all finfish resources in<br />
the State was reported and made available<br />
online to help prioritisation of monitoring and<br />
assessment resources.<br />
• An assessment was completed of the status<br />
of indicator species for the Gascoyne demersal<br />
scalefish resource (temperate (pink) snapper,<br />
goldband snapper and spangled emperor).<br />
• Led a delegation to China that resulted in the<br />
signing of a Memorandum of Understanding<br />
between the Department of Fisheries and<br />
the China Society of Fisheries to promote the<br />
exchange of scientific expertise and develop<br />
joint-projects to support fisheries research,<br />
monitoring, assessment and management<br />
Service 3 – Research and Monitoring<br />
– Major Initiatives for 2010/11<br />
95<br />
Invertebrates<br />
• An FRDC-funded project will be completed on<br />
increasing our understanding of the causes of<br />
the low puerulus settlement in the western rock<br />
lobster fishery, using a larval oceanographic<br />
model and a statistical assessment of biological<br />
and environmental data.<br />
• Development will be finalised for a new spatial<br />
stock assessment model for the western rock<br />
lobster fishery and a sensitivity assessment of<br />
the parameters used in the model undertaken.<br />
• A catch prediction model for the Perth<br />
recreational abalone fishery will be used to<br />
assist in the management of the new Total<br />
Allowable Recreational Catch.<br />
Biodiversity and Biosecurity<br />
• Delimiting surveys will be carried out for<br />
introduced marine pest species identified by<br />
monitoring projects carried out in ports.<br />
• Ongoing monitoring will be conducted for<br />
introduced marine pest species at high risk<br />
locations.
AgENCy PERFORMANCE � SERvICE 3 – RESEARCH AND MONI<strong>TO</strong>RINg<br />
• An FRDC project on the investigation of<br />
Chlamydiales-like organisms in pearl oysters<br />
will be finalised.<br />
• An FRDC-funded project to investigate viral<br />
inclusions in Australian prawns will be started.<br />
• Fresh water bodies and species for<br />
rehabilitation, restocking and feral eradication<br />
will be prioritised, based upon data from our<br />
2010 survey.<br />
• Restocking of native fish will commence in<br />
priority water bodies.<br />
• The community education display at the<br />
Pemberton Freshwater Research Centre will be<br />
completed and the hatchery re-opened to tours<br />
by the general public.<br />
Stock Assessment and Data Analysis<br />
• Assist development and integration of the<br />
Department’s new entitlement management<br />
system to ensure integrity of historical and<br />
future time series of catch and effort data for<br />
the state’s commercial fisheries.<br />
• Data collection for the survey of state-wide<br />
boat-based fishing will conclude, and detailed<br />
analyses will begin.<br />
• Build capacity in stock assessment to<br />
improve ability to meet the needs of fisheries<br />
management.<br />
Finfish<br />
• An NRM-funded project to determine<br />
connectivity and status of key indicator<br />
species in the nearshore waters of the West<br />
Coast Bioregion will be finalised.<br />
96<br />
• Cooperative FRDC-funded projects will be<br />
completed that examine the relative efficiency<br />
of gear and resource availability in the tropical<br />
demersal fisheries and the stock structure<br />
of blue and king threadfin species across<br />
northern Australia.<br />
• Reports will be finalised and released on<br />
the stock status of the Gascoyne demersal<br />
scalefish resource.<br />
• An NRM-funded project on the monitoring of<br />
juvenile dhufish, including identifying options for<br />
future monitoring programs will be finalised.<br />
• Northern and southern finfish monitoring<br />
and assessment plans will be finalised<br />
and implemented to support departmental<br />
planning processes.<br />
• The commencement of an FRDC-funded project<br />
led by researchers at the CSIRO and aimed at<br />
collecting and identifying larval dhufish in the<br />
West Coast Bioregion will be supported.<br />
• An FRDC-funded project to examine the<br />
movements and linkages of key shark species<br />
among the bioregions will begin.
AgENCy PERFORMANCE � CASE STUDy 4<br />
CASE STUDy 4 research and monitoring in focus – Scientists join forces to<br />
investigate marine heatwave and climate variability<br />
During the marine heatwave<br />
whale sharks were seen off<br />
Mandurah and as far south as<br />
Albany. Photo: Matt Pember<br />
An unprecedented ‘marine heatwave’ experienced<br />
along the Western Australian coastline during the<br />
2010/11 summer appears to have some major<br />
implications for fish and invertebrate species,<br />
including western rock lobster, living along the<br />
State’s continental shelf.<br />
In May 2011, marine experts from around the<br />
State, hosted by the Department of Fisheries and<br />
the CSIRO, joined together in a workshop to review<br />
the physical and biological aspects of the heatwave.<br />
The Department of Fisheries had already started<br />
investigating the phenomenon.<br />
The aim of the forum was to share information<br />
collected by marine scientists and other stakeholders,<br />
Figure 39. the size and movement of the marine heatwave from November 2010 through to March 2011.<br />
97<br />
including commercial and recreational fishers, to<br />
ensure the causes and effects of the heatwave were<br />
fully understood and properly interpreted.<br />
Since the final quarter of 2010, aboveaverage<br />
water temperatures were recorded off the<br />
WA coastline. Over a period of several months,<br />
an extensive patch of very warm water moved<br />
southwards, driven by a stronger-than-usual Leeuwin<br />
Current. This current plays a major role in controlling<br />
the marine life and climate of Western Australia.<br />
In February 2011, sea surface temperatures<br />
were more than three degrees Celcius above average<br />
for this time of year over a large area extending from<br />
Ningaloo to the Abrolhos and more than 200 km<br />
November December January February March
AgENCy PERFORMANCE � CASE STUDy 4<br />
Signs of the times: Some of the more dramatic results of the marine heatwave that occured during the summer of 2010/11.<br />
coral bleaching at Barrow Shoals near<br />
Dampier. Photo: Department of Environment<br />
and Conservation<br />
dead Pink Snapper in Shark Bay.<br />
Photo: Department of Fisheries<br />
reef Bannerfish seen at the Busselton<br />
Underwater Observatory.<br />
Photo: Anna Micha<br />
Exmouth<br />
Shark Bay<br />
Rottnest<br />
offshore, while an area extending from Exmouth to<br />
the Capes and 500 km offshore was more than two<br />
degrees Celcius warmer.<br />
Western<br />
Australia<br />
Busselton<br />
Dampier<br />
Albany<br />
Broome<br />
Esperance<br />
Black marlin as far south as Busselton.<br />
Photo: Jeni Gates, Bluewater Tackle, Exmouth<br />
whale sharks seen off Mandurah and as far<br />
south as Albany.<br />
Photo: Jason Stone<br />
dead sunfish on beaches near Albany.<br />
Photo: Kim Smith, Department of Fisheries<br />
98<br />
In some cases, sea temperatures were the<br />
warmest ever recorded for these regions, appearing<br />
to be influenced by a stronger-than-usual Leeuwin
AgENCy PERFORMANCE � CASE STUDy 4<br />
Current over summer, associated with the very<br />
strong La Niña weather event. During the heatwave,<br />
there were a number of fish kills along the mid-west<br />
coast and in the Abrolhos, Kalbarri and Leeman<br />
areas, which appear to have been caused by low<br />
oxygen levels brought on by high water temperatures<br />
and hot, still weather. Western rock lobster and<br />
abalone deaths were also reported in areas of<br />
warmer water associated with calm conditions.<br />
Climatic variability has a strong influence on<br />
many biological processes off the west coast of<br />
WA. Recruitment of juvenile rock lobster into adult<br />
stocks is affected by climatic factors including<br />
water temperatures and the strength of the Leeuwin<br />
Current (which strengthens during La Niña events,<br />
but weakens during El Niño events).<br />
Whilst high recruitment of western rock<br />
lobster is influenced by a strong Leeuwin Current<br />
and the associated higher water temperatures,<br />
there is evidence that increases in water<br />
temperature can result in a decrease in the size of<br />
rock lobsters at maturity.<br />
During March 2011, the Department<br />
of Fisheries announced its researchers were<br />
combining with the CSIRO in a three-year project<br />
to closely examine the effects of climate change<br />
on Western Australia’s marine environment.<br />
The $450,000 project, funded by the Australian<br />
Government’s Fisheries and Research Development<br />
Corporation, the Department of Fisheries (WA) and<br />
the CSIRO, utilises oceanographic modeling and an<br />
99<br />
understanding of environmental effects on fisheries<br />
using case studies.<br />
In WA this project will be used to assess the<br />
vulnerability to climate change of fish stocks such<br />
as western rock lobster, blue swimmer crab, tailor<br />
and dhufish.<br />
Climate change affects life cycles of fish<br />
stocks by altering seasonal cycles and long-term<br />
trends of the physical environment. Any long-term<br />
changes in the abundance of fish stocks as the<br />
result of climate change may require an adjustment<br />
in fishing effort or catch quota, in order that the fish<br />
stocks remain sustainable.<br />
Figure 39 on page 97 features a graduated<br />
temperature scale indicating the average sea<br />
surface temperatures recorded over that month.<br />
The darkest blue/purple shade indicates water<br />
of normal temperature (ie. what you would<br />
usually expect to see). The yellow and orange<br />
areas indicate water of much higher than usual<br />
temperature (2.5 to 3.5 degrees above normal).<br />
Figure 39 also shows the movement of the<br />
body of water from well off the north-west coast<br />
(about 400 km offshore) in November 2010 through<br />
to a significant intensification in January 2011,<br />
where it is seen to be directly hugging the Gascoyne<br />
coastline. By February it has enlarged and extends<br />
from Ningaloo to south of Mandurah. By March<br />
the coverage was still extensive but the very high<br />
temperatures had fallen.
AgENCy PERFORMANCE � SERvICE 4 - MARINE SAFETy SERvICE<br />
During 2010/11, the Department<br />
of Fisheries took part in a joint<br />
marine safety exercise with the<br />
Department of Transport, Police<br />
Air Wing, Peel Water Police and<br />
Sea Rescue to practice winding<br />
people on and off vessels.<br />
Above: a man being winched off a<br />
vessel. Right: the exercise<br />
viewed from a Department of<br />
Fisheries vessel.<br />
Service 4 – Marine Safety Service<br />
the marine safety compliance service is delivered<br />
by Fisheries and Marine Officers within the<br />
Department’s Regional Services Branch on behalf<br />
of the Department of transport.<br />
These services are primarily provided within the<br />
Metropolitan Region (Lancelin to Mandurah) and<br />
include both at-sea and boat ramp checks to ensure<br />
Masters and persons in charge of vessels are<br />
complying with relevant marine safety legislation.<br />
Most of these services are targeted at recreational<br />
boat users but some commercial inspections also<br />
occur when the situation permits.<br />
As many of these services are delivered in<br />
conjunction with a fisheries compliance service,<br />
they are delivered effectively and efficiently in line<br />
with government policy.<br />
The Department of Fisheries is working closely<br />
with the Department of Transport on policy matters,<br />
such as the introduction of marine safety single<br />
national jurisdiction under the Commonwealth by<br />
2013, that may affect clients and our own maritime<br />
operations.<br />
100
AgENCy PERFORMANCE � CORPORATE SERvICES<br />
Corporate Services<br />
corporate Services division<br />
the Department’s Corporate Service Division,<br />
in partnership with the Department of treasury<br />
and Finance – Office of Shared Services (DtFSS),<br />
provides corporate services necessary to support<br />
the Department in the delivery of its Fisheries<br />
Management, Compliance and education,<br />
Research and Monitoring and Marine Safety<br />
services.<br />
Shared Corporate Services<br />
The DTFSS delivers corporate services such as<br />
financial and human resources across the public<br />
sector from a single location, using a common<br />
system. The Department of Fisheries’ personnel<br />
functions were transferred in October 2009. This<br />
complements the existing finance and payroll<br />
modules previously adopted.<br />
101<br />
Customer Service Management<br />
The Department of Fisheries’ Customer Service<br />
Feedback Management System was established<br />
to ensure that complaints are heard and dealt<br />
with fairly and quickly. The system also records<br />
complimentary feedback and suggestions for the<br />
improvement of service.<br />
The management and staff of the Department<br />
respect the right of members of the community to<br />
complain about the standard of service provided by<br />
the Department. The Department’s commitment to<br />
fair, equitable and timely resolution of complaints,<br />
and recognition of both positive and negative<br />
feedback at all levels of the organisation, are<br />
described in its Feedback Management Policy (see<br />
below) and related documents.<br />
Our Policy<br />
The Department will deal with complaints effectively<br />
and promptly without prejudice or bias. At all times<br />
we will be honest and fair in our dealings with<br />
customers.<br />
The Department’s Customer Service Charter<br />
provides procedures for the effective management
AgENCy PERFORMANCE � CORPORATE SERvICES<br />
and resolution of feedback and complaints by<br />
members of the public. It outlines the Department’s<br />
Feedback Management Policy and meets the criteria<br />
for effective complaints handling laid down by the<br />
Australian Standard (AS ISO 10002-2004).<br />
The Feedback Management System enables<br />
the Department to manage and respond to<br />
complaints, compliments and suggestions in a<br />
timely and equitable manner.<br />
Maintenance of the Customer Service Charter<br />
and the Feedback Management System is now the<br />
responsibility of the Customer Relations Manager.<br />
In addition to the Feedback Management<br />
System, the Department also relies on regular<br />
client surveys for feedback on customer service<br />
performance. This data is gathered in a number<br />
of ways, including questionnaires distributed by<br />
Fisheries Volunteers to recreational fishers, the<br />
commercial fishing fleet log book system and an<br />
annual community attitudes survey.<br />
The Feedback Management System<br />
This specialised software package was developed<br />
to enable staff to record and assign a response<br />
time to feedback from customers, whether it is a<br />
complaint, a compliment or a suggestion provided to<br />
the Department by clients in person or by telephone,<br />
letter, facsimile and email. The Customer Relations<br />
Manager manages the system and Feedback Liaison<br />
Officers are assigned to each area and regional office<br />
to oversee the day-to-day running of the system.<br />
102<br />
To encourage support and understanding of<br />
the new system, the Department produced a suite<br />
of brochures that outline the feedback process<br />
to clients and the public. A Policy for Customer<br />
Feedback, Guidelines for Staff; the Customer Service<br />
Charter – Our Commitment to You; and Feedback for<br />
the Future brochures are available from Departmental<br />
offices and on the Department’s website.<br />
The Department received 23 feedback<br />
items through the Feedback Management System<br />
during 2010/11 – 19 complaint items and four<br />
complimentary items.<br />
The majority of the complaints related to<br />
difficulty in accessing the Department’s recreational<br />
fishing online licensing system. The matter was<br />
investigated, the problems were identified and the<br />
online licensing system has now been modified.<br />
To meet the requirements of the Customer<br />
Service Charter, the Feedback Management System<br />
is continually being reviewed by the Customer<br />
Relations Manager to improve the system and<br />
ensure the best possible customer service.<br />
Outlook for 2011/12<br />
The amended Feedback Management System will<br />
be continually monitored during 2011/12 to assess<br />
its effectiveness.
AgENCy PERFORMANCE � CORPORATE SERvICES<br />
Human Resource Management<br />
Throughout 2010/11, the Human Resources Branch<br />
has focused operational resources on facilitating<br />
the delivery of human resources/payroll services in<br />
collaboration with the Department of Treasury and<br />
Finance Shared Services.<br />
Annual Staffing Level<br />
The annual staffing level for the year was 419<br />
employees as at 30 June 2011.<br />
table 23. Department of Fisheries staffing levels for<br />
2010/11<br />
September 10 December 10 March 11 June 11<br />
Actual FTE 385 382 398 419<br />
The staffing levels outlined above are a<br />
snapshot of the number of full time equivalent (FTE)<br />
staff paid on the last pay day in each quarter of<br />
2010/11.<br />
The number of FTEs has fluctuated throughout<br />
the year as a result of variations to the number of<br />
externally-funded positions, receipt of additional<br />
funding for new projects and as a result of positions<br />
being vacant and/or incumbents on unpaid leave<br />
during various reporting periods.<br />
Finance and Administration<br />
The Finance and Administration Branch worked<br />
hard during 2010/11 to ensure ongoing strategic<br />
financial management was provided to meet the<br />
requirements of the Department of Fisheries, the<br />
103<br />
Department of Treasury and the Office of the Auditor<br />
General. This involved a major review and cleansing<br />
of financial data within the shared services<br />
environment.<br />
The Department’s finance and administration<br />
function was strengthened during the year with<br />
the appointment of a new Chief Financial Officer.<br />
In previous years, this statutory position has been<br />
held by the Director of Corporate Services.<br />
Consistent with State Government policy,<br />
the Department finished the year ahead of its<br />
financial targets for the implementation of corporate<br />
purchasing cards. This initiative continues to add<br />
efficiencies and savings in the procurement and<br />
payments processes for both the Department and<br />
for suppliers.<br />
Information Management<br />
The Information Management Branch is responsible<br />
for the management and delivery of information<br />
services to meet internal Department requirements.<br />
The branch is made up of three separate areas:<br />
• Corporate Information – responsible for the<br />
management of corporate documents and<br />
other information, including compliance with<br />
the Department’s statutory obligations under<br />
the State Records Act 2000 and Freedom of<br />
Information Act 1992.<br />
• Information Systems Operations – responsible<br />
for the management of IT infrastructure
AgENCy PERFORMANCE � CORPORATE SERvICES<br />
(including computers, servers and network<br />
equipment), communications and data services<br />
(fixed and mobile data and mobile telephones),<br />
the corporate operating environment (including<br />
desktop and server software) and Information<br />
Technology helpdesk services.<br />
• Application Development – responsible for<br />
the management and support of corporate<br />
applications including eBrief, SeaStar and the<br />
Rock Lobster Quota Management System.<br />
This section also manages new application<br />
development.<br />
Major Achievements for 2010/11<br />
• A review of progress against the initiatives<br />
contained in the Strategic Human Resource<br />
Management Plan (Plan for Our People) that<br />
aligns people strategies and initiatives with<br />
the strategic goals of the Department.<br />
• The implementation of the Public Sector Reform<br />
Program that has introduced new Commissioner’s<br />
Instructions covering disciplinary procedures,<br />
employment and filling a public sector vacancy.<br />
• The review and improvement of the<br />
Department’s performance management tool,<br />
the Individual Performance and Development<br />
(IPAD) form and supporting information for<br />
managers and employees. The roll-out of<br />
these improvements included awareness<br />
sessions and management coaching both in<br />
the metropolitan area and regional centres.<br />
104<br />
• Commenced the development of a multi-period<br />
and multi-scenario financial analysis tool to<br />
enable the regular review of the Department’s<br />
strategic financial position.<br />
• The development of a Rock Lobster Quota<br />
Management System, including an interactive<br />
voice response system.<br />
• The roll-out began of a new corporate<br />
operating environment for both servers and<br />
personal computers.<br />
• A virtual computer environment was further<br />
consolidated, reducing the Department’s<br />
impact on the environment.<br />
• Significant contributions were made to the<br />
‘whole-of-government’ Server and Data<br />
Storage Devices Common Use Agreement.<br />
• The Department’s record keeping plan was<br />
updated in line with State Records Office<br />
requirements.<br />
Major initiatives for 2011/12<br />
• Enhancing organisational development<br />
initiatives and programs.<br />
• Assisting Corporate Executive with a review of<br />
the organisational structure and classification<br />
framework for the Department.<br />
• Implementation of a Suicide Prevention<br />
Strategy that aims to engage employees<br />
in mental health discussions and develop<br />
programs to improve coping resilience and
AgENCy PERFORMANCE � CORPORATE SERvICES<br />
reduce the risks of suicide for staff and their<br />
loved ones.<br />
• Implementation of an induction and training<br />
program for supervisors and managers.<br />
• Development and implementation of a human<br />
resources metrics and reporting model that<br />
will improve workforce analysis and risk<br />
management.<br />
• Continuation of the Department’s Wellness<br />
Program to strengthen employee engagement<br />
in health and wellbeing initiatives.<br />
• The follow-up Work Safe accreditation<br />
assessment is scheduled to be undertaken.<br />
• The development of a new strategic plan<br />
to guide the Department’s investment in<br />
information services over the coming years.<br />
• The development of a business classification<br />
scheme and retention and disposal schedule<br />
to support the effective management of<br />
corporate information.<br />
• Further work will be carried out on the<br />
deployment of an electronic document records<br />
management system.<br />
• Significant changes to a range of core<br />
corporate tools, including service desk,<br />
records management system and other<br />
support and management tools.<br />
105<br />
• Implementation of the Interactive Voice<br />
Response system for the Rock Lobster Quota<br />
Management System.<br />
• Significant changes to the Department’s<br />
infrastructure to support the deployment of the<br />
Entitlement Management System.
DISCLOSURES AND LEgAL COMPLIANCE<br />
As a result of moving to the shared services environment, the Department of Fisheries has adopted ‘whole of government’ depreciation rates as determined by the Department<br />
of Treasury. Under these rates, the estimated useful life for a vessel is five to six years. Photo: Steve Ireland<br />
DISCLOSURES AND LEgAL COMPLIANCE<br />
Independent Audit Opinion on Financial Statements and Key Performance Indicators __________ 107<br />
Certification of financial statements for the year ended 30 June 2011 _______________________ 108<br />
Other Financial Disclosures ____________________________________________________________ 137<br />
Detailed Key Performance Indicators ___________________________________________________ 140<br />
Other Legal Requirements _____________________________________________________________ 156<br />
Government Policy Requirements _______________________________________________________ 162<br />
106
DISCLOSURES AND LEgAL COMPLIANCE � INDEPENDENT AUDIT OPINION ON FINANCIAL STATEMENTS AND kEy PERFORMANCE INDICA<strong>TO</strong>RS<br />
Independent Audit Opinion on Financial<br />
Statements and Key Performance Indicators<br />
107
DISCLOSURES AND LEgAL COMPLIANCE � CERTIFICATION <strong>OF</strong> FINANCIAL STATEMENTS FOR <strong>THE</strong> yEAR ENDED 30 jUNE 2011<br />
Certification of financial statements<br />
for the year ended 30 June 2011<br />
The accompanying financial statements of the Department of Fisheries have been prepared in<br />
compliance with the provisions of the Financial Management Act 2006 from proper accounts<br />
and records to present fairly the financial transactions for the financial year.<br />
At the date of signing, we are not aware of any circumstances which would render any<br />
particulars included in the financial statements misleading or inaccurate.<br />
THU LANG VO<br />
CHIeF FINANCe <strong>OF</strong>FICeR<br />
Date: 22 August 2011<br />
STUART SMITH<br />
CHIeF eXeCUtIVe <strong>OF</strong>FICeR<br />
Date: 22 August 2011<br />
108
DISCLOSURES AND LEgAL COMPLIANCE � FINANCIAL STATEMENTS<br />
dePArtmeNt of fISherIeS StAtemeNt of comPreheNSIve INcome<br />
for the yeAr eNded 30 JuNe 2011<br />
coSt of ServIceS Note 2011 2010<br />
$’000 $’000<br />
expenses<br />
Employee benefits expense 6 40,516 38,027<br />
Supplies and services 7 21,352 17,750<br />
Depreciation and amortisation expense 8 3,790 3,262<br />
Finance costs 9 253 140<br />
Accommodation expenses 10 2,071 2,092<br />
Grants and subsidies 11 3,476 5,099<br />
Fisheries Adjustment Scheme buy-backs 12 170 2,566<br />
Other expenses 13 263 639<br />
total cost of services 71,891 69,575<br />
Income<br />
Revenue<br />
User charges and fees 14 29,558 24,673<br />
Grants and contributions 15 2,987 6,633<br />
Interest revenue 16 491 102<br />
total revenue 33,036 31,408<br />
Gains<br />
Gain on disposal of non-current assets 17 24 109<br />
total gains 24 109<br />
total income other than income from State government 33,060 31,517<br />
Net coSt of ServIceS (38,831) (38,058)<br />
INcome from StAte goverNmeNt 18<br />
Service appropriations 32,676 36,029<br />
Resources received free of charge 499 1,272<br />
Royalties for Regions Fund 94 –<br />
total income from State government 33,269 37,301<br />
defIcIt for the PerIod (5,562) (757)<br />
other comPreheNSIve INcome<br />
Changes in asset revaluation surplus 29 (527) (2,794)<br />
Total other comprehensive income (527) (2,794)<br />
totAl comPreheNSIve INcome for the PerIod (6,089) (3,551)<br />
refer to the ‘Schedule of Income and expenses by Service’.<br />
the Statement of comprehensive Income should be read in conjunction with the accompanying notes.<br />
dePArtmeNt of fISherIeS StAtemeNt of fINANcIAl PoSItIoN AS At 30 JuNe 2011<br />
109<br />
Note 2011 2010<br />
$’000 $’000<br />
ASSetS<br />
current Assets<br />
Cash and cash equivalents 29 3,516 3,486<br />
Restricted cash and cash equivalents 19 1,637 1,437<br />
Receivables 20 5,128 1,559<br />
Amounts receivable for services 21 2,226 2,226<br />
Other current assets 22 162 109<br />
total current Assets 12,669 8,817<br />
Non-current Assets<br />
Restricted cash and cash equivalents 19 672 557<br />
Receivables 20 34,862 3,336<br />
Amounts receivable for services 21 6,349 5,183<br />
Property, plant and equipment 23 59,452 59,384<br />
total Non-current Assets 101,335 68,460<br />
totAl ASSetS 114,004 77,277<br />
lIABIlItIeS<br />
current liabilities<br />
Payables 25 2,607 1,907<br />
Borrowings 26 2,903 562<br />
Provisions 27 9,151 6,863<br />
Other current liabilities 28 1,173 734<br />
total current liabilities 15,834 10,066<br />
Non-current liabilities<br />
Borrowings 26 34,862 3,465<br />
Provisions 27 2,123 1,982<br />
total Non-current liabilities 36,985 5,447<br />
totAl lIABIlItIeS 52,819 15,513<br />
Net ASSetS 61,185 61,764<br />
eQuIty<br />
Contributed equity 29 50,076 44,566<br />
Reserves 29 13,514 14,041<br />
Accumulated surplus/(deficit) 29 (2,405) 3,157<br />
totAl eQuIty 61,185 61,764<br />
refer to the ‘Schedule of Assets and liabilities by Service’.<br />
the Statement of financial Position should be read in conjunction with the accompanying notes.
DISCLOSURES AND LEgAL COMPLIANCE � FINANCIAL STATEMENTS<br />
dePArtmeNt of fISherIeS StAtemeNt of chANgeS IN eQuIty<br />
for the yeAr eNded 30 JuNe 2011<br />
Note contributed<br />
equity<br />
reserves<br />
Accumulated<br />
Surplus/<br />
(deficit)<br />
total equity<br />
$’000 $’000 $’000 $’000<br />
Balance at 1 July 2009 29 39,166 16,835 3,914 59,915<br />
Changes in accounting policy or<br />
correction of prior period errors<br />
– – – –<br />
restated balance at 1 July 2009 39,166 16,835 3,914 59,915<br />
Total comprehensive income for<br />
the year<br />
Transactions with owners in their<br />
capacity as owners:<br />
– (2,794) (757) (3,551)<br />
Capital appropriations 5,400 – – 5,400<br />
Total 5,400 – – 5,400<br />
Balance at 30 June 2010 44,566 14,041 3,157 61,764<br />
Balance at 1 July 2010 44,566 14,041 3,157 61,764<br />
Total comprehensive income for<br />
the year<br />
Transactions with owners in their<br />
capacity as owners:<br />
– (527) (5,562) (6,089)<br />
Capital appropriations 5,510 – – 5,510<br />
Total 5,510 – – 5,510<br />
Balance at 30 June 2011 50,076 13,514 (2,405) 61,185<br />
the Statement of changes in equity should be read in conjunction with the accompanying notes.<br />
dePArtmeNt of fISherIeS StAtemeNt of cASh flowS for the yeAr eNded 30 JuNe 2011<br />
110<br />
Note 2011 2010<br />
$’000 $’000<br />
cASh flowS from StAte goverNmeNt<br />
Service appropriation 29,284 32,637<br />
Capital contributions 5,510 5,400<br />
Holding account drawdowns 2,226 4,003<br />
Royalties for Regions Fund 94 –<br />
Net cash provided by State government 37,114 42,040<br />
Utilised as follows:<br />
cASh flowS from oPerAtINg ActIvItIeS<br />
Payments<br />
Employee benefits (37,683) (36,967)<br />
Supplies and services (15,122) (17,245)<br />
Finance costs (253) (127)<br />
Accommodation (2,071) (2,092)<br />
Grants and subsidies (3,476) (5,099)<br />
GST payments on purchases (6,522) (3,466)<br />
Fisheries Adjustment Scheme buy-backs (170) (2,566)<br />
Other payments (5,498) (1,321)<br />
receipts<br />
User charges and fees 28,689 25,036<br />
Grants and contributions 2,987 6,633<br />
Interest received 413 102<br />
GST receipts on sales 547 984<br />
GST receipts from taxation authority 5,786 2,533<br />
Net cash used in operating activities 30 (32,373) (33,595)<br />
cASh flowS from INveStINg ActIvItIeS<br />
Payments<br />
Purchases of non-current physical assets (4,414) (7,652)<br />
receipts<br />
Proceeds from the sale of non-current physical assets 17 36 1,021<br />
Net cash used in investing activities (4,378) (6,631)<br />
cASh flowS from fINANcINg ActIvItIeS<br />
Payments<br />
Payments to industry (34,300) (4,100)<br />
Repayment of borrowings (562) (674)<br />
receipts<br />
Proceeds from industry 544 447<br />
Proceeds from borrowings 34,300 4,100<br />
Net cash used in financing activities (18) (227)<br />
Net increase/(decrease) in cash and cash equivalents 345 1,587<br />
Cash and cash equivalents at the beginning of period 5,480 3,893<br />
cash and cash equivalents at the end of period 30 5,825 5,480<br />
the Statement of cash flows should be read in conjunction with the accompanying notes.
dePArtmeNt of fISherIeS Schedule of INcome ANd eXPeNSeS By ServIce for the yeAr eNded 30 JuNe 2011<br />
coSt of ServIceS<br />
DISCLOSURES AND LEgAL COMPLIANCE � FINANCIAL STATEMENTS<br />
AQuAtIc mANAgemeNt<br />
comPlIANce ANd<br />
educAtIoN<br />
reSeArch ANd<br />
moNItorINg<br />
mArINe SAfety totAl<br />
2011 2010 2011 2010 2011 2010 2011 2010 2011 2010<br />
$’000 $’000 $’000 $’000 $’000 $’000 $’000 $’000 $’000 $’000<br />
expenses<br />
Employee benefits expense 12,569 8,618 14,849 16,528 12,781 12,106 317 775 40,516 38,027<br />
Supplies and services 4,637 2,135 8,412 9,296 8,198 6,037 105 282 21,352 17,750<br />
Depreciation and amortisation 38 33 2,729 1,468 1,023 1,761 – – 3,790 3,262<br />
Finance costs 253 140 – – – – – – 253 140<br />
Accommodation expenses 1,056 241 705 1,096 300 691 10 64 2,071 2,092<br />
Grants and subsidies 1,969 3,016 – 8 1,507 2,075 – – 3,476 5,099<br />
FAS buybacks 170 2,566 – – – – – – 170 2,566<br />
Other expenses 23 183 9 207 231 239 – 10 263 639<br />
total cost of services 20,715 16,932 26,704 28,603 24,040 22,909 432 1,131 71,891 69,575<br />
Income<br />
User charges and fees 6,830 4,979 11,139 11,261 11,537 8,315 52 118 29,558 24,673<br />
Grants and contributions 44 232 – 9 2,943 6,392 – – 2,987 6,633<br />
Interest revenue 104 18 168 36 218 48 1 – 491 102<br />
Gain on disposal of non-current assets – – 24 109 – – – – 24 109<br />
total income other than income from State government 6,978 5,229 11,331 11,415 14,698 14,755 53 118 33,060 31,517<br />
Net coSt of ServIceS 13,737 11,703 15,373 17,188 9,342 8,154 379 1,013 38,831 38,058<br />
INcome from StAte goverNmeNt<br />
Service appropriation 11,989 11,209 13,031 16,353 7,313 7,486 343 980 32,676 36,029<br />
Resources received free of charge 144 – 185 – 167 – 3 – 499 –<br />
Royalties for Regions Fund 2 310 90 523 2 419 – 21 94 1,272<br />
total income from State government 12,135 11,519 13,306 16,876 7,482 7,905 346 1,001 33,269 37,301<br />
deficit for the period (1,602) (184) (2,067) (312) (1,860) (249) (33) (12) (5,562) (757)<br />
the Schedule of Income and expenses by Service should be read in conjunction with the accompanying notes.<br />
111
DISCLOSURES AND LEgAL COMPLIANCE � FINANCIAL STATEMENTS<br />
dePArtmeNt of fISherIeS Schedule of ASSetS ANd lIABIlItIeS By ServIce for the yeAr eNded 30 JuNe 2011<br />
AQuAtIc mANAgemeNt<br />
comPlIANce ANd<br />
educAtIoN<br />
reSeArch ANd<br />
moNItorINg<br />
mArINe SAfety totAl<br />
2011 2010 2011 2010 2011 2010 2011 2010 2011 2010<br />
$’000 $’000 $’000 $’000 $’000 $’000 $’000 $’000 $’000 $’000<br />
Assets<br />
Current assets<br />
Cash and cash equivalents 800 796 1,401 1,379 1,186 1,191 129 120 3,516 3,486<br />
Restricted cash and cash equivalents 373 329 652 568 552 491 60 49 1,637 1,437<br />
Receivables 3,310 601 938 491 794 424 86 43 5,128 1,559<br />
Amounts receivable for services 506 508 887 881 751 760 82 77 2,226 2,226<br />
Other current assets 29 25 80 43 49 37 4 4 162 109<br />
total current Assets<br />
Non-current assets<br />
5,018 2,259 3,958 3,362 3,332 2,903 361 293 12,669 8,817<br />
Restricted cash and cash equivalents 152 128 268 220 227 190 25 19 672 557<br />
Receivables 34,862 3,336 – – – – – – 34,862 3,336<br />
Amounts receivable for services 1,444 1,185 2,530 2,050 2,142 1,770 233 178 6,349 5,183<br />
Property, plant and equipment 921 213 34,323 35,383 24,059 23,756 149 32 59,452 59,384<br />
total Non-current Assets 37,379 4,862 37,121 37,653 26,428 25,716 407 229 101,335 68,460<br />
total Assets 42,397 7,121 41,079 41,015 29,760 28,619 768 522 114,004 77,277<br />
liabilities<br />
Current liabilities<br />
Payables 645 434 937 754 963 653 62 66 2,607 1,907<br />
Borrowings 2,774 317 129 245 – – – – 2,903 562<br />
Provisions 2,357 1,568 3,588 2,715 3,122 2,344 84 236 9,151 6,863<br />
Other current liabilities 289 168 511 290 359 251 14 25 1,173 734<br />
total current liabilities 6,065 2,487 5,165 4,004 4,444 3,248 160 327 15,834 10,066<br />
Non-current liabilities<br />
Borrowings 34,862 3,336 – 129 – – – – 34,862 3,465<br />
Provisions 479 453 894 784 734 677 16 68 2,123 1,982<br />
total Non-current liabilities 35,341 3,789 894 913 734 677 16 68 36,985 5,447<br />
total liabilities 41,406 6,276 6,059 4,917 5,178 3,925 176 395 52,819 15,513<br />
Net ASSetS 991 845 35,020 36,098 24,582 24,694 592 127 61,185 61,764<br />
the Schedule of Assets and liabilities by Service should be read in conjunction with the accompanying notes.<br />
112
DISCLOSURES AND LEgAL COMPLIANCE � FINANCIAL STATEMENTS<br />
dePArtmeNt of fISherIeS SummAry of coNSolIdAted AccouNt APProPrIAtIoNS ANd INcome eStImAteS for the yeAr eNded 30 JuNe 2011<br />
Item delIvery of ServIceS<br />
113<br />
2011 2011 2011 2010<br />
eStImAte ActuAl vArIANce ActuAl ActuAl vArIANce<br />
$’000 $’000 $’000 $’000 $’000 $’000<br />
44 Net amount appropriated to deliver services 30,363 32,412 (2,049) 32,412 35,780 (3,368)<br />
Section 25 transfer of service appropriation<br />
Amount authorised by other statutes<br />
– Salaries and Allowances Act 1975 258 264 (6) 264 249 15<br />
Total appropriations provided to deliver services 30,621 32,676 (2,055) 32,676 36,029 (3,353)<br />
cAPItAl<br />
134 Capital appropriations 5,510 5,510 – 5,510 5,400 110<br />
grANd totAl 36,131 38,186 (2,055) 38,186 41,429 (3,243)<br />
details of expenses by Service<br />
Fisheries Management 15,697 20,715 (5,018) 20,715 16,932 3,783<br />
Compliance and Education 25,609 26,704 (1,095) 26,704 28,603 (1,899)<br />
Research and Monitoring 19,872 24,040 (4,168) 24,040 22,909 1,131<br />
Marine Safety Service 1,558 432 1,126 432 1,131 (699)<br />
total cost of Services 62,736 71,891 (9,155) 71,891 69,575 2,316<br />
Less Total Income (30,621) (33,060) 2,439 (33,060) (31,517) (1,543)<br />
Net cost of Services 32,115 38,831 (6,716) 38,831 38,058 773<br />
Adjustments (1,494) (6,155) 4,661 (6,155) (2,029) (4,126)<br />
total appropriations provided to deliver services 30,621 32,676 (2,055) 32,676 36,029 (3,353)<br />
Capital Expenditure<br />
Purchase of non-current physical assets 8,011 4,414 3,597 4,414 8,792 (4,378)<br />
Adjustments for other funding sources (2,501) 1,096 (3,597) 1,096 (3,392) 4,488<br />
capital Appropriations 5,510 5,510 – 5,510 5,400 110<br />
Adjustments comprise movements in cash balances and other accrual items such as receivables, payables and superannuation.<br />
Note 34 ’ explanatory statement’ provides details of any significant variations between estimates and actual results for 2011 and between the actual results for 2010 and 2011.
DISCLOSURES AND LEgAL COMPLIANCE � NOTES <strong>TO</strong> <strong>THE</strong> FINANCIAL STATEMENTS<br />
dePArtmeNt of fISherIeS INdeX of NoteS to the fINANcIAl StAtemeNtS for the yeAr eNded 30 JuNe 2011<br />
Subject Policy Note disclosure Note title of Policy Note<br />
General 1<br />
AUSTRALIAN EQUIVALENTS <strong>TO</strong> INTERNATIONAL<br />
FINANCIAL <strong>REPORT</strong>ING STANDARDS<br />
General 2 SUMMARY <strong>OF</strong> SIGNIFICANT ACCOUNTING POLICIES<br />
General 2(a) General Statements<br />
General 2(b) Basis of Preparation<br />
General 2(c) Reporting Entity<br />
General 2(d) 29 Contributed Equity<br />
Income 2(e) Income<br />
Expense 2(f) 9 Borrowing costs (finance costs)<br />
Assets 2(g) 23 Property, Plant and Equipment and Infrastructure<br />
Assets 2(h) Intangible Assets<br />
Assets 2(i) 24 Impairment of Assets<br />
Assets 2(j)<br />
Non-current (or disposal groups) classified as held for<br />
sale<br />
Liabilities 2(k) 10, 26 Leases and borrowings<br />
Liabilities 2(l) 35 Financial Instruments<br />
Assets 2(m) 19, 30 Cash and Cash Equivalents<br />
Liabilities 2(n) 28 Accrued Salaries<br />
Assets 2(o) 21 Amounts Receivable for Services (Holding Account)<br />
Assets 2(p) 20 Receivables<br />
Liabilities 2(q) 25 Payables<br />
Liabilities 2(r) 26 Borrowings<br />
Liabilities 2(s)(i) 27 Provisions - Employee Benefits<br />
Liabilities 2(s)(ii) 13, 27 Provisions - Other<br />
Expense 2(t) 6 Superannuation Expense<br />
Expense 2(u) 18<br />
Resources Received Free of Charge or For Nominal<br />
Consideration<br />
General 2(v) Comparative Figures<br />
General 2(w) Cost Recovery - Major Commercial Fisheries<br />
General 3<br />
JUDGEMENTS MADE BY MANAGEMENT IN APPLYING<br />
ACCOUNTING POLICIES<br />
General 4 KEY SOURCES <strong>OF</strong> ESTIMATION UNCERTAINTY<br />
General 5<br />
DISCLOSURE <strong>OF</strong> CHANGES IN ACCOUNTING POLICY AND<br />
ESTIMATES<br />
Expense 2(s)(i) 6 EMPLOYEE BENEFITS EXPENSE<br />
Expense 7 SUPPLIES AND SERVICES<br />
Expense 2(g) 8 DEPRECIATION AND AMORTISATION EXPENSE<br />
Expense 2(f) 9 FINANCE COSTS<br />
Expense 2(k) 10 ACCOMMODATION EXPENSES<br />
Expense 11 GRANTS & SUBSIDIES<br />
Expense 12 <strong>FISHERIES</strong> ADJUSTMENT SCHEME BUYBACKS<br />
Expense 13 O<strong>THE</strong>R EXPENSES<br />
Subject Policy Note disclosure Note title of Policy Note<br />
Expense 17<br />
NET GAIN / (LOSS) ON DISPOSAL <strong>OF</strong> NON-CURRENT<br />
ASSETS<br />
Revenue 2(e) 14 USER CHARGES AND FEES<br />
Revenue 2(e) 15 GRANTS AND CONTRIBUTIONS<br />
Revenue 2(e) 16 INTEREST REVENUE<br />
Revenue 2(d), (o) 18 INCOME FROM STATE GOVERNMENT<br />
Revenue 2(u) 18 RESOURCES RECEIVED FREE <strong>OF</strong> CHARGE<br />
Assets 2(m) 19 RESTRICTED CASH AND CASH EQUIVALENTS<br />
Assets 2(p) 20 RECEIVABLES<br />
Assets 2(o) 21 AMOUNTS RECEIVABLE FOR SERVICES<br />
Assets 22 O<strong>THE</strong>R ASSETS<br />
Assets 2(g) 23 PROPERTY, PLANT AND EQUIPMENT<br />
Assets 2(h) 24 IMPAIRMENT <strong>OF</strong> ASSETS<br />
Liabilities 2(q) 25 PAYABLES<br />
Liabilities 2(r) 26 BORROWINGS<br />
Liabilities 2(s)(ii) 27 PROVISIONS<br />
Liabilities 2(s)(i) 28 O<strong>THE</strong>R LIABILITIES<br />
Equity 29 ACCUMULATED SURPLUS<br />
Equity 2(d) 29 CONTRIBUTED EQUITY<br />
Equity 29 RESERVES<br />
Cash Flow 30 NOTES <strong>TO</strong> <strong>THE</strong> CASH FLOW STATEMENT<br />
General 31 COMMITMENTS FOR EXPENDITURE<br />
General 32 CONTINGENT LIABILITIES AND CONTINGENT ASSETS<br />
General 33 EVENTS OCCURING AFTER <strong>THE</strong> BALANCE SHEET DATE<br />
General 34 EXPLANA<strong>TO</strong>RY STATEMENT<br />
General 2(l) 35 FINANCIAL INSTRUMENTS<br />
General 36 REMUNERATION <strong>OF</strong> SENIOR <strong>OF</strong>FICERS<br />
General 37 REMUNERATION <strong>OF</strong> AUDI<strong>TO</strong>R<br />
General 38 RELATED BODIES<br />
General 39 AFFILIATED BODIES<br />
General 40 SUPPLEMENTARY FINANCIAL INFORMATION<br />
General 41 JOINTLY CONTROLLED ASSETS<br />
External 42 <strong>FISHERIES</strong> RESEARCH AND DEVELOPMENT ACCOUNT<br />
External 43 AFMA ACCOUNT<br />
External 44 RECREATIONAL FISHING ACCOUNT<br />
External 45<br />
<strong>FISHERIES</strong> RESEARCH AND DEVELOPMENT<br />
CORPORATION ACCOUNT<br />
External 46 <strong>FISHERIES</strong> ADJUSTMENT SCHEMES TRUST ACCOUNT<br />
External 47 <strong>FISHERIES</strong> PRIVATE MONEYS TRUST ACCOUNT<br />
External 48 FISH FARM BOND DEPOSITS TRUST ACCOUNT<br />
External 49 CHRISTMAS ISLAND AND COCOS (KEELING) ISLANDS<br />
this index does not form part of the financial statements<br />
114
DISCLOSURES AND LEgAL COMPLIANCE � NOTES <strong>TO</strong> <strong>THE</strong> FINANCIAL STATEMENTS<br />
dePArtmeNt of fISherIeS NoteS to the fINANcIAl StAtemeNtS<br />
for the yeAr eNded 30 JuNe 2011<br />
1 AuStrAlIAN AccouNtINg StANdArdS<br />
general<br />
The Department’s financial statements for the year ended 30 June 2011 have been prepared<br />
in accordance with Australian Accounting Standards. The term ‘Australian Accounting<br />
Standards’ refers to Standards and Interpretations issued by the Australian Accounting<br />
Standard Board (AASB).<br />
The Department has adopted any applicable, new and revised Australian Accounting Standards<br />
from their operative dates.<br />
early adoption of standards<br />
The Department cannot early adopt an Australian Accounting Standard unless specifically<br />
permitted by Treasurer’s Instruction 1101 Application of Australian Accounting Standards<br />
and Other Pronouncements. No Australian Accounting Standards that have been issued<br />
or amended but not operative have been early adopted by the Department for the annual<br />
reporting period ended 30 June 2011.<br />
2 SummAry of SIgNIfIcANt AccouNtINg PolIcIeS<br />
(a) general Statement<br />
The financial statements constitute general purpose financial statements that have<br />
been prepared in accordance with the Australian Accounting Standards, the Framework,<br />
Statements of Accounting Concepts and other authoritative pronouncements of the<br />
Australian Accounting Standards Board as applied by the Treasurer’s Instructions. Several<br />
of these are modified by the Treasurer’s Instructions to vary application, disclosure, format<br />
and wording.<br />
The Financial Management Act and the Treasurer’s Instructions are legislative provisions<br />
governing the preparation of financial statements and take precedence over Australian<br />
Accounting Standards, the Framework, Statements of Accounting Concepts and other<br />
authoritative pronouncements of the Australian Accounting Standards Board.<br />
Where modification is required and has a material or significant financial effect upon<br />
the reported results, details of that modification and the resulting financial effect are<br />
disclosed in the notes to the financial statements.<br />
(b) Basis of Preparation<br />
The financial statements have been prepared on the accrual basis of accounting using the<br />
historical cost convention, except for land, buildings and infrastructure, which have been<br />
measured at fair value.<br />
The accounting policies adopted in the preparation of the financial statements have been<br />
consistently applied throughout all periods presented unless otherwise stated.<br />
The financial statements are presented in Australian dollars and all values are rounded to<br />
the nearest thousand dollars ($’000).<br />
115<br />
Note 4 ‘Judgements made by management in applying accounting policies’ discloses<br />
judgements that have been made in the process of applying the Department’s accounting<br />
policies resulting in the most significant effect on amounts recognised in the financial<br />
statements.<br />
Note 5 ‘Key sources of estimation uncertainty’ discloses key assumptions made<br />
concerning the future, and other key sources of estimation uncertainty at the end of<br />
the reporting period, that have a significant risk of causing a material adjustment to the<br />
carrying amounts of assets and liabilities within the next financial year.<br />
(c) reporting entity<br />
The reporting entity is the Department which has no ‘related bodies’.<br />
Mission<br />
The Department’s mission is “To conserve, sustainably develop and share the use of<br />
the State’s aquatic resources and their ecosystems for the benefit of present and future<br />
generations.”<br />
The Department is funded from revenue collected under the authority of Fish Resources<br />
Management Act 1994, Pearling Act 1990 and from Parliamentary appropriations. The<br />
Department has legislative authority to retain revenues it collects in the respective Trust<br />
Accounts administered by the Department.<br />
Services<br />
The budget is framed in terms of services, consequently financial reporting for the year is<br />
also analysed in terms of services.<br />
Information about the Department’s services is set out in the Schedule of Expenses and<br />
Revenue by Service and the Schedule of Assets and Liabilities by Service.<br />
The services of the Department detailed below closely align with the functional<br />
organisational structure of:<br />
• Fisheries Management;<br />
• Compliance and Education;<br />
• Research and Monitoring; and<br />
• Marine Safety Service.<br />
A description of each service is as follows:<br />
Fisheries Management<br />
In accordance with Government Policy, the management of the state’s fish and aquatic<br />
resources is undertaken within an integrated fisheries management framework – a shift<br />
from the management of individual sectors (e.g. the commercial fishing sector) to the<br />
holistic management of the aquatic ecosystem. Management, often in association with<br />
other related Government agencies, includes the development of policy and procedural<br />
frameworks (legislation and management plans), licensing, consultation with stakeholders<br />
and the community.<br />
Compliance and Education<br />
Without the support of the community and stakeholders, the Department is unable to<br />
effectively manage the aquatic environment. To encourage this support, the Department<br />
must raise community awareness and understanding of the issues and of the need to
DISCLOSURES AND LEgAL COMPLIANCE � NOTES <strong>TO</strong> <strong>THE</strong> FINANCIAL STATEMENTS<br />
adhere to the rules governing activities in this environment. There also needs to be<br />
enforcement of the rules through penalties for non-compliance. The Department plans<br />
and implements education and communications programs to raise levels of awareness<br />
and understanding of fishery management objective. It also plans and instigates<br />
investigations and enforcement strategies.<br />
Research and Monitoring<br />
The aquatic environment is subject to ongoing change – both natural and man made.<br />
In order to ensure that management arrangements continue to adapt to environmental<br />
changes (e.g. climate change impacts) and community expectations, research and<br />
monitoring is required, including innovative science (eg impacts of expected climate<br />
change, social, and economic research) and the ongoing monitoring of fish stocks.<br />
Marine Safety Service<br />
One of the recommendations of the Machinery of Government Taskforce in 2000 was<br />
to increase the efficiency of the delivery of government services. The delivery of marine<br />
safety in the metropolitan area was identified as being one of those services that could<br />
be delivered more efficiently if it was done by the Department of Fisheries on behalf of the<br />
Department of Transport. The Department of Fisheries has been delivering this service<br />
– which includes checks by Fisheries and Marine Officers of recreational boats to ensure<br />
compliance with the safety requirements – since this time.<br />
(d) contributed equity<br />
AASB Interpretation 1038 ‘Contributions by Owners Made to Wholly-Owned Public<br />
Sector Entities’ requires transfers in the nature of equity contributions to be designated<br />
by the Government (the owner) as contributions by owners (at the time of, or prior to<br />
transfer) before such transfers can be recognised as equity contributions in the financial<br />
statements. Capital contributions (appropriations) have been designated as contributions<br />
by owners according to Treasurer’s Instruction 955 ‘Contribution by Owners made to<br />
Wholly Owned Public Sector Entities’ and have been credited directly to Contributed Equity.<br />
The transfers of net assets to/from other agencies, other than as a result of a restructure<br />
of administrative arrangements, are designated as contributions by owners where the<br />
transfers are non-discretionary and non-reciprocal. See note 29 ‘Contributed Equity’.<br />
(e) Income<br />
Revenue recognition<br />
Revenue is measured at the fair value of consideration received or receivable. Revenue is<br />
recognised for the major business activities as follows:<br />
Sale of goods<br />
Revenue is recognised from the sale of goods and disposal of other assets when the<br />
significant risks and rewards of ownership control transfer to the purchaser and can be<br />
measured reliably.<br />
Provision of services<br />
Revenue is recognised upon delivery of the service to the client or by reference to the<br />
stage of completion of the transaction. Fees paid for access to managed fisheries are<br />
levied on a seasonal, not financial year, basis and may be paid in instalments. The<br />
revenue for access fees is recognised at the time of receipt.<br />
Interest<br />
Revenue is recognised as the interest accrues.<br />
116<br />
Service Appropriations<br />
Service Appropriations are recognised as revenues in the period in which the Department<br />
gains control of the appropriated funds. The Department gains control of appropriated<br />
funds at the time those funds are deposited into the Department’s bank account or<br />
credited to the ‘Amounts receivable for services’ (holding account) held at the Department<br />
of Treasury. See note 18 ‘Income from State Government’ for further detail.<br />
Net Appropriation Determination<br />
The Treasurer may make a determination providing for prescribed receipts to be retained<br />
for services under the control of the Department. In accordance with the determination<br />
specified in the 2010/11 Budget Statements, the Department retained $5.594 million in<br />
2010/11 ($3.517 million in 2009-10) from GST receipts on sales and input credits.<br />
Grants, donations, gifts and other non-reciprocal contributions<br />
Revenue is recognised at fair value when the Department obtains control over the assets<br />
comprising the contributions, usually when cash is received.<br />
Other non-reciprocal contributions that are not contributions by owners are recognised<br />
at their fair value. Contributions of services are only recognised when a fair value can be<br />
reliably determined and the services would be purchased if not donated.<br />
Where contributions recognised as revenues during the reporting period were obtained<br />
on the condition that they be expended in a particular manner or used over a particular<br />
period, and those conditions were undischarged as at the balance sheet date, the nature<br />
of, and amounts pertaining to, those undischarged conditions are disclosed in the notes.<br />
Where contributions have been recognised as income during the reporting period that<br />
were provided specifically for the provision of goods and services over a future reporting<br />
period, the nature, amounts and the periods to which they relate are disclosed.<br />
Where contributions have been recognised as income in a previous reporting period that were<br />
obtained in respect of the current reporting period, the nature and amounts are disclosed.<br />
Gains<br />
Gains may be realised or unrealised and are usually recognised on a net basis. These<br />
include gains arising on the disposal of non-current assets and some revaluations of<br />
non-current assets.<br />
(f) Borrowing costs<br />
Borrowing costs are expensed when incurred.<br />
(g) Property, Plant and equipment and Infrastructure<br />
Capitalisation/Expensing of assets<br />
Items of property, plant and equipment and infrastructure costing $5,000 or more are<br />
recognised as assets and the cost of utilising assets is expensed (depreciated) over their<br />
useful lives. Items of property, plant and equipment and infrastructure costing less than<br />
$5,000 are immediately expensed direct to the Statement of Comprehensive Income<br />
(other than where they form part of a group of similar items which are significant in total).<br />
Initial recognition and measurement<br />
All items of property, plant and equipment and infrastructure are initially recognised at cost.
DISCLOSURES AND LEgAL COMPLIANCE � NOTES <strong>TO</strong> <strong>THE</strong> FINANCIAL STATEMENTS<br />
For items of property, plant and equipment and infrastructure acquired at no cost or for<br />
nominal consideration, the cost is their fair value at the date of acquisition.<br />
Subsequent measurement<br />
Subsequent to initial recognition as an asset, the revaluation model is used for the<br />
measurement of land, buildings and infrastructure and the cost model for all other<br />
property, plant and equipment. Land, buildings and infrastructure are carried at fair<br />
value less accumulated depreciation (buildings and infrastructure only) and accumulated<br />
impairment losses. All other items of property, plant and equipment are carried at<br />
historical cost less accumulated depreciation and accumulated impairment losses.<br />
Where market-based evidence is available, the fair value of land and buildings is<br />
determined on the basis of current market buying values determined by reference to<br />
recent market transactions. When buildings are revalued by reference to recent market<br />
transactions, the accumulated depreciation is eliminated against the gross carrying<br />
amount of the asset and the net amount restated to the revalued amount.<br />
In the absence of market-based evidence, the fair value of land and buildings is<br />
determined on the basis of existing use. This normally applies where buildings are<br />
specialised or where land use is restricted. Fair value for existing use assets is<br />
determined by reference to the cost of replacing the remaining future economic benefits<br />
embodied in the asset, ie. the depreciated replacement cost. Where the fair value of<br />
buildings is dependent on using the depreciated replacement cost basis, the gross<br />
carrying amount and the accumulated depreciation are restated proportionately.<br />
Independent valuations of land and buildings are provided annually by the Western<br />
Australian Land Information Authority (Valuation Services) and recognised annually to<br />
ensure that the carrying amount does not differ materially from the asset’s fair value at<br />
the end of the reporting period.<br />
Fair value of major boating assets has been determined on the basis of current market<br />
buying values determined by reference to recent market transactions. Where no market<br />
based evidence is available, due to the specialised nature of some of these assets, fair<br />
value has been determined by reference to the depreciated replacement cost (existing<br />
use basis). Independent valuations are obtained every 3 to 5 years.<br />
When major boating assets are revalued, the accumulated depreciation is eliminated<br />
against the gross carrying amount of the asset and the net amount restated to the<br />
revalued amount.<br />
The most significant assumptions in estimating fair value are made in assessing whether<br />
to apply the existing use basis to assets and in determining estimated useful life.<br />
Professional judgment by the valuer is required where the evidence does not provide a<br />
clear distinction between market type assets and existing use assets.<br />
Refer to note 23 ‘Property, plant and Equipment’ for further information on revaluations.<br />
Derecognition<br />
Upon disposal or derecognition of an item of property, plant and equipment and<br />
infrastructure, any revaluation reserve relating to that asset is retained in the asset<br />
revaluation surplus.<br />
Asset Revaluation Surplus<br />
The asset revaluation surplus is used to record increments and decrements on<br />
the revaluation of non-current assets as described in Note 23 “Property, Plant and<br />
Equipment”.<br />
117<br />
Depreciation<br />
All non-current assets having a limited useful life are systematically depreciated over their<br />
estimated useful lives in a manner that reflects the consumption of their future economic<br />
benefits.<br />
Land is not depreciated. Depreciation on other assets is calculated using the straight<br />
line method, using rates which are reviewed annually. As a result of moving to the shared<br />
services environment, the Department has adopted the whole of government depreciation<br />
rates as determined by the Department of Treasury. Estimated useful lives for each class<br />
of depreciable asset are:<br />
Asset category life (years)<br />
Buildings 40<br />
Vessels 5-6<br />
Communication equipment 5<br />
Computer equipment 3<br />
Furniture and fittings 10<br />
Infrastructure 30<br />
Motor vehicles 5<br />
Office equipment 5<br />
Other equipment 5-10<br />
Plant and equipment 5-20<br />
Works of Art controlled by the Department are classified as property, plant and<br />
equipment. They are anticipated to have very long and indefinite useful lives. Their service<br />
potential has not, in any material sense, been consumed during the reporting period and<br />
so no depreciation has been recognised.<br />
Land is not depreciated.<br />
(h) Intangible Assets<br />
Capitalisation/Expensing of assets<br />
Acquisitions of intangible assets costing $5,000 or more and internally generated<br />
intangible assets costing $50,000 or more are capitalised. The cost of utilising the<br />
assets is expensed (amortised) over their useful life. Costs incurred below these<br />
thresholds are immediately expensed directly to the Statement of Comprehensive Income.<br />
All acquired and internally developed intangible assets are initially recognised at cost. For<br />
assets acquired at no cost or for nominal cost, the cost is their fair value at the date of<br />
acquisition.<br />
The cost model is applied for subsequent measurement requiring the asset to be carried<br />
at cost less any accumulated amortisation and accumulated impairment losses.<br />
Amortisation for intangible assets with finite useful lives is calculated for the period of the<br />
expected benefit (estimated useful life) on the straight line basis using rates which are<br />
reviewed annually. All intangible assets controlled by the Department have a finite useful life<br />
and zero residual value. The expected useful lives for each class of intangible asset are:
DISCLOSURES AND LEgAL COMPLIANCE � NOTES <strong>TO</strong> <strong>THE</strong> FINANCIAL STATEMENTS<br />
Licences up to 10 years<br />
Development Costs 3 to 5 years<br />
Software(a) 3 to 5 years<br />
Web site costs 3 to 5 years<br />
(a) Software that is not integral to the operation of any related hardware.<br />
Licences<br />
Licences have a finite useful life and are carried at cost less accumulated amortisation<br />
and accumulated impairment losses.<br />
Research and Development<br />
Research costs are expensed as incurred. Development costs incurred for an individual<br />
project are carried forward when the future recoverability can reasonably be regarded as<br />
assured and the total project costs are likely to exceed $50,000. Other development<br />
costs are expensed as incurred.<br />
Computer Software<br />
Software that is an integral part of the related hardware is treated as property, plant and<br />
equipment. Software that is not an integral part of the related hardware is treated as an<br />
intangible asset. Software costing less than $5,000 is expensed in the year of acquisition.<br />
Website costs<br />
Website costs are charged as expenses when they are incurred unless they relate to the<br />
acquisition or development of an asset when they may be capitalised and amortised.<br />
Generally, costs in relation to feasibility studies during the planning phase of a web site,<br />
and ongoing costs of maintenance during the operating phase are expensed. Costs<br />
incurred in building or enhancing a website, to the extent that they represent probable<br />
future economic benefits that can be reliably measured, are capitalised.<br />
(i) Impairment of Assets<br />
Property, plant, equipment and infrastructure are tested for any indication of impairment<br />
at the end of each reporting period. Where there is an indication of impairment, the<br />
recoverable amount is estimated. Where the recoverable amount is less than the carrying<br />
amount, the asset is considered impaired and is written down to the recoverable amount<br />
and an impairment loss is recognised. As the Department is a not-for-profit entity, unless<br />
an asset has been identified as a surplus asset, the recoverable amount is the higher of<br />
an asset’s fair value less costs to sell and depreciated replacement cost.<br />
The risk of impairment is generally limited to circumstances where an asset’s depreciation<br />
is materially understated, where the replacement cost is falling or where there is a<br />
significant change in useful life. Each relevant class of assets is reviewed annually to<br />
verify that the accumulated depreciation/amortisation reflects the level of consumption or<br />
expiration of asset’s future economic benefits and to evaluate any impairment risk from<br />
falling replacement costs.<br />
The recoverable amount of assets identified as surplus assets is the higher of fair value<br />
less costs to sell and the present value of future cash flows expected to be derived<br />
from the asset. Surplus assets carried at fair value have no risk of material impairment<br />
where fair value is determined by reference to market-based evidence. Where fair value<br />
is determined by reference to depreciated replacement cost, surplus assets are at risk of<br />
impairment and the recoverable amount is measured. Surplus assets at cost are tested<br />
for indications of impairment at the end of each reporting period.<br />
(j) Non-current assets (or disposal groups) classified as held for sale<br />
The department does not have any assets classified as held for sale.<br />
118<br />
(k) leases<br />
Finance lease rights and obligations are initially recognised at the commencement of the<br />
lease term as assets and liabilities equal in amount to the fair value of the leased item or,<br />
if lower, the present value of the minimum lease payments, determined at the inception if<br />
the lease. The assets are disclosed as plant, equipment and vehicles under lease, and are<br />
depreciated over the period during which the Department is expected to benefit from their<br />
use. Minimum lease payments are apportioned between the finance charge and the reduction<br />
of the outstanding lease liability, according to the interest rate implicit in the lease.<br />
The Department holds operating leases for its head office and a number of branch office<br />
buildings. Lease payments are expensed on a straight line basis over the lease term as<br />
this represents the pattern of benefits derived from the leased properties.<br />
(l) financial Instruments<br />
In addition to cash, the Department has two categories of financial instrument:<br />
• Loans and receivables; and<br />
• Financial liabilities measured at amortised cost.<br />
These have been disaggregated into the following classes:<br />
Financial Assets<br />
• Cash and cash equivalents<br />
• Restricted cash and cash equivalents<br />
• Receivables<br />
• Amounts receivable for services<br />
Financial Liabilities<br />
• Payables<br />
• WATC borrowings<br />
• Finance lease liabilities<br />
Initial recognition and measurement of financial instruments is at fair value that normally<br />
equates to the transaction cost or the face value. Subsequent measurement is at<br />
amortised cost using the effective interest method.<br />
The fair value of short-term receivables and payables is the transaction cost or the face<br />
value because there is no interest rate applicable and subsequent measurement is not<br />
required as the effect of discounting is not material.<br />
(m) cash and cash equivalents<br />
For the purpose of the Statement of Cash Flows, cash and cash equivalent (and restricted<br />
cash and cash equivalent) assets comprise cash on hand and short-term deposits with<br />
original maturities of three months or less that are readily convertible to a known amount<br />
of cash and which are subject to insignificant risk of changes in value.<br />
(n) Accrued Salaries<br />
Accrued salaries (refer note 29 ‘Other liabilities’) represent the amount due to staff but<br />
unpaid at the end of the financial year, as the pay date for the last pay period for that<br />
financial year does not coincide with the end of the financial year. Accrued salaries are<br />
settled within a fortnight of the financial year end. The Department considers the carrying<br />
amount of accrued salaries to be equivalent to its net fair value.
DISCLOSURES AND LEgAL COMPLIANCE � NOTES <strong>TO</strong> <strong>THE</strong> FINANCIAL STATEMENTS<br />
The accrued salaries suspense account (see note 20 ‘Restricted cash and cash<br />
equivalents’) consists of amounts paid annually into a suspense account over a period of<br />
10 financial years to largely meet the additional cash outflow in each eleventh year when<br />
27 pay days occur instead of the normal 26. No interest is received on this account.<br />
(o) Amounts receivable for Services (holding Account)<br />
The Department receives appropriation funding on an accrual basis that recognises the<br />
full annual cash and non-cash cost of services. The appropriations are paid partly in cash<br />
and partly as an asset (Holding Account receivable) that is accessible on the emergence<br />
of the cash funding requirement to cover leave entitlements and asset replacement.<br />
See also note 18 ‘Income from State Government’ and note 21 ‘Amounts receivable for<br />
services’.<br />
(p) receivables<br />
Receivables are recognised and carried at original invoice amount less an allowance for<br />
uncollectible amounts (impairment). The collectability of receivables is reviewed on an<br />
ongoing basis and any receivables identified as uncollectible are written-off against the<br />
allowance account. The allowance for uncollectible amounts (doubtful debts) is raised<br />
when there is objective evidence that the Department will not be able to collect the debts.<br />
The carrying amount is equivalent to fair value as it is due for settlement within 30 days.<br />
See also note 3(l) ‘Financial Instruments and note 20 ‘Receivables’.<br />
(q) Payables<br />
Payables are recognised at the amounts payable when the Department becomes obliged<br />
to make future payments as a result of a purchase of assets or services. The carrying<br />
amount is equivalent to fair value, as they are generally settled within 30 days. See also<br />
note 35 ‘Financial Instruments and note 25 ‘Payables’.<br />
(r) Borrowings<br />
All loans payable are initially recognised at cost, being the fair value of the net proceeds<br />
received. Subsequent measurement is at amortised cost using the effective interest rate<br />
method.<br />
(s) Provisions<br />
Provisions are liabilities of uncertain timing and amount and are recognised where there<br />
is a present legal or constructive obligation as a result of a past event and when the<br />
outflow of resources embodying economic benefits is probable and a reliable estimate<br />
can be made of the amount of the obligation. Provisions are reviewed at the end of each<br />
reporting period. See also note 27 ‘Provisions’<br />
(i) Provisions – employee Benefits<br />
Annual Leave<br />
The liability for annual leave expected to be settled within 12 months after the reporting<br />
period is recognised and measured at the undiscounted amounts expected to be paid<br />
when the liabilities are settled.<br />
Annual leave expected to be settled more than 12 months after the reporting period<br />
is measured at the present value of amounts expected to be paid when the liabilities<br />
are settled using the remuneration rate expected to apply at the time of settlement.<br />
Leave liabilities are in respect of services provided by employees up to the end of the<br />
reporting period.<br />
119<br />
When assessing expected future payments consideration is given to expected future wage<br />
and salary levels including non-salary components such as employer superannuation<br />
contributions. The expected future payments are discounted using market yields at the<br />
end of the reporting period on national government bonds with terms to maturity that<br />
match, as closely as possible, the estimated future cash outflows.<br />
The provision for annual leave is classified as a current liability as the Department does<br />
not have an unconditional right to the defer settlement of the liability for at least 12<br />
months after reporting period.<br />
Long Service Leave<br />
A liability for long service leave is recognised after an employee has completed three years<br />
of service based on remuneration rates current as at the end of the reporting period.<br />
An actuarial assessment of long service leave undertaken by PriceWaterhouseCoopers<br />
Actuaries at 30 June 2011 determined that the liability measured using the short hand<br />
method was not materially different from the liability measured using the present value of<br />
expected future payments. An assessment will be undertaken every three years.<br />
Unconditional long service leave provisions are classified as current liabilities as the<br />
Department does not have an unconditional right to defer settlement of the liability for at<br />
least 12 months after the reporting date. Conditional long service leave provisions are<br />
classified as non-current liabilities until the employee has completed the required years of<br />
service.<br />
Sick Leave<br />
Liabilities for sick leave are recognised when it is probable that sick leave paid in the<br />
future will be greater than the entitlement that will accrue in the future.<br />
Past history indicates that on average, sick leave taken each reporting period is less than<br />
the entitlement accrued. This is expected to continue in future periods. Accordingly, it is<br />
unlikely that existing accumulated entitlements will be used by employees and no liability<br />
for unused sick leave entitlements is recognised. As sick leave is non-vesting, an expense<br />
is recognised in the Statement of Comprehensive Income for this leave as it is taken.<br />
Deferred and Purchased Leave<br />
Deferred leave relates to Public Service employees who have entered into an agreement<br />
to self-fund an additional twelve months leave in the fifth year of the agreement. The<br />
provision recognises the value of salary set aside for employees to be used in the fifth<br />
year. This liability is measured on the same basis as annual leave. Deferred leave is<br />
reported as a non-current provision until the fifth year.<br />
Purchased Leave<br />
Purchased leave relates to Public Service employees who have entered into an agreement<br />
to self-fund up to an additional ten weeks leave per calendar year. The provision<br />
recognises the value of salary set aside for employees and is measured at the nominal<br />
amounts expected to be paid when the liabilities are settled. This liability is measured on<br />
the same basis as annual leave.<br />
Superannuation<br />
The Government Employees Superannuation Board (GESB) administers public sector<br />
superannuation arrangements in Western Australia in accordance with legislative<br />
requirements.
DISCLOSURES AND LEgAL COMPLIANCE � NOTES <strong>TO</strong> <strong>THE</strong> FINANCIAL STATEMENTS<br />
Eligible employees may contribute to the Pension Scheme, a defined benefit pension<br />
scheme now closed to new members or the Gold State Superannuation Scheme (GSS), a<br />
defined benefit lump sum scheme also closed to new members since 1995.<br />
The GSS is a defined benefit scheme for the purposes of employees and whole-ofgovernment<br />
reporting. However, it is a defined contribution plan for agency purposes<br />
because the concurrent contributions (defined contributions) made by the Department to<br />
GESB extinguishes the agency’s obligations to the related superannuation liability.<br />
The Department has no liabilities under the Pension Scheme or the GSS. The liabilities for<br />
the unfunded Pension Scheme and the unfunded GSS transfer benefits due to members<br />
who transferred from the Pension Scheme, are assumed by the Treasurer. All other GSS<br />
obligations are funded by concurrent contributions made by the Department to the GESB.<br />
The concurrently funded part of the GSS is a defined contribution scheme as these<br />
contributions extinguish all liabilities in respect of the concurrently funded GSS obligations.<br />
Employees commencing employment prior to 16 April 2007 who were not members of<br />
either the Pension Scheme or the GSS became non-contributory members of the West<br />
State Superannuation Scheme (WSS). Employees commencing employment on or after<br />
16 April 2007 became members of the GESB Super Scheme (GESBS). Both of these<br />
schemes are accumulation schemes. The Department makes concurrent contributions<br />
to GESB on behalf of employees in compliance with the Commonwealth Government’s<br />
Superannuation Guarantee (Administration) Act 1992. These contributions extinguish the<br />
liability for superannuation charges in respect of the WSS and GESBS.<br />
The GESB makes all benefit payments in respect of the Pension Scheme and GSS, and is<br />
recouped from the Treasurer for the employer’s share. See also note 2(u) ‘Superannuation<br />
expense’.<br />
(ii) Provisions – other<br />
Employment On-Costs<br />
Employment on-costs, including workers’ compensation insurance, are not employee<br />
benefits and are recognised separately as liabilities and expenses when the employment<br />
to which they relate has occurred. Employment on-costs are included as part of ‘Other<br />
expenses’ and are not included as part of the Department’s ‘Employee benefits expense’.<br />
The related liability is included in ‘Employment on-costs’ provision. See notes 13 ‘Other<br />
Expenses’ and 27 ‘Provisions’.<br />
(t) Superannuation expense<br />
The superannuation expense in the Statement of Comprehensive Income comprises<br />
of employer contributions paid to the GSS (concurrent contributions), the WSS and the<br />
GESBS. The employer contribution paid to the GESB in respect of the GSS is paid back<br />
into the Consolidated Account by the GESB.<br />
(u) resources received free of charge or for Nominal cost<br />
Resources received free of charge or for nominal cost that can be reliably measured are<br />
recognised as income at fair value. Where the resource received represents a service that<br />
the Department would otherwise pay for, a corresponding expense is recognised. Receipts<br />
of assets are recognised in the Statement of Financial Position.<br />
Where assets or services are received from another State Government agency, these<br />
are separately disclosed under Income from State Government in the Statement of<br />
Comprehensive Income.<br />
120<br />
(v) comparative figures<br />
Comparative figures are, where appropriate, reclassified to be comparable with the figures<br />
presented in the current financial year.<br />
(w) Access fees - major commercial fisheries<br />
The Department and the commercial fishing industry entered into an agreement in 1995<br />
that provided for the Department to recover the costs associated with the management of<br />
major commercial fisheries. The costs were recovered through the annual fee charged for<br />
access to the fishery concerned.<br />
Effective 1 July 2010 the use of cost recovery as the mechanism for setting access fees<br />
was discontinued. Access fees are now levied as a percentage of the gross value of<br />
production of each fishery.<br />
3 JudgemeNtS mAde By mANAgemeNt IN APPlyINg AccouNtINg PolIcIeS<br />
The preparation of financial statements requires management to make judgements about the<br />
application of accounting policies that have a significant effect on the amounts recognised in<br />
the financial statements. The Department evaluates these judgements regularly.<br />
finance lease commitment:<br />
The Department has a commercial lease on a patrol vessel and has determined that it retains<br />
all the significant risks and rewards of ownership of the property. Accordingly, the lease has<br />
been classified as a finance lease.<br />
4 Key SourceS of eStImAtIoN uNcertAINty<br />
The Department makes key estimates and assumptions concerning the future. These<br />
estimates and assumptions are based on historical experience and various other factors that<br />
have a significant risk of causing a material adjustment to the carrying amount of assets and<br />
liabilities within the next financial year. These include:<br />
• Estimating the useful life and residual values of key assets;<br />
• Estimating depreciated replacement cost; and<br />
• Estimating future salary rates, salary inflation, expected future payments, retention<br />
rates and discount rates for long service leave.<br />
Changes in these estimations and assumptions may impact on the carrying amount of the<br />
long service provision.<br />
5 dIScloSure of chANgeS IN AccouNtINg PolIcy ANd eStImAteS<br />
Initial application of an Australian Accounting Standard:<br />
The Department has applied the following Australian Accounting Standards effective for annual<br />
reporting periods beginning on or after 1 July 2010 that impacted on the Department:<br />
AASB 2009-12 Amendments to Australian Accounting Standards [AASBs 5, 8, 108,<br />
110,112, 119, 133, 137, 139, 1023 & 1031 and Interpretations 2, 4, 16,<br />
1039 7 1052].
DISCLOSURES AND LEgAL COMPLIANCE � NOTES <strong>TO</strong> <strong>THE</strong> FINANCIAL STATEMENTS<br />
This Standard introduces a number of terminology changes. There is no<br />
financial impact resulting from the application of this revised Standard.<br />
AASB 2010-5 Amendments to Australian Accounting Standards [AASBs 1, 3, 4, 5, 101,<br />
107, 112, 118, 119, 121, 132, 133, 134, 137, 139, 140, 1023, &1038<br />
and Interpretations 112, 115, 127, 132 & 1042].<br />
This Standard introduces a number of terminology changes as well as presentation changes to the<br />
Notes to the Financial Statements. There is no financial impact resulting from the application of this<br />
revised Standard.<br />
future impact of Australian Accounting Standards not yet operative<br />
The Department cannot early adopt an Australian Accounting Standard or Australian Accounting<br />
Interpretation unless specifically permitted by TI 1101 ‘Application of Australian Accounting<br />
Standards and Other Pronouncements’. Consequently, the Department has not applied early the<br />
following Australian Accounting Standards and Australian Accounting Interpretations that have<br />
been issued and which may impact the Department. Where applicable, the Department plans to<br />
apply these Standards and Interpretations from their application date, 1 Jan 2013:<br />
AASB 2009-11 Amendments to Australian Accounting Standards arising from AASB 9 [AASB<br />
1, 3, 4, 5, 7, 101, 102, 108, 112, 118, 121, 127, 128, 131, 132, 136,<br />
139, 1023 & 1038 and Interpretations 10 & 12].<br />
The amendment to AASB 7 requires modification to the disclosure of<br />
categories of financial assets. The Department does not expect any financial<br />
impact when the Standard is first applied. The disclosure of categories of<br />
financial assets in the notes will change.<br />
AASB 9 This Standard supersedes AASB 139 Financial Instruments: Recognition and<br />
Measurement, introducing a number of changes to accounting treatments.<br />
The Standard was re-issued on 6 Dec 2010 and the Department is currently<br />
determining the impact of the Standard for agencies.<br />
AASB 2010-5 Amendments to Australian Accounting Standards – Disclosures on Transfers<br />
of Financial Assets [AASB 1 & AASB 7].<br />
This Standard makes amendments to Australian Accounting Standards,<br />
introducing additional presentation and disclosure requirements for financial<br />
Assets.<br />
121<br />
6 emPloyee BeNefItS eXPeNSe 2011 2010<br />
$’000 $’000<br />
Wages and salaries (a) 35,033 33,224<br />
Superannuation - defined contribution plans (b) 3,149 3,028<br />
Other related expenses (c) 2,334 1,775<br />
40,516 38,027<br />
(a) Includes leave entitlements including superannuation<br />
contribution component.<br />
(b) Defined contribution plans include West State, Gold State and<br />
GESB Super Scheme (contributions paid).<br />
(c) Includes the value of the fringe benefit to the employee plus<br />
the fringe benefits tax component.<br />
Employment on-costs such as workers’ compensation insurance are<br />
included at note 13 ‘Other expenses’. The employment on costs<br />
liability is included at note 27 ‘Provisions’.<br />
7 SuPPlIeS ANd ServIceS 2011 2010<br />
$’000 $’000<br />
Communications 1,044 859<br />
Freight and mail 361 284<br />
Property 745 935<br />
Contractors and consultants 6,087 4,826<br />
Consumables 3,309 2,373<br />
Minor equipment acquisitions 399 467<br />
Repairs and maintenance 2,481 2,060<br />
Travel 1,865 1,535<br />
Electricity and water 500 410<br />
Advertising 112 151<br />
Other 4,449 3,850<br />
21,352 17,750
DISCLOSURES AND LEgAL COMPLIANCE � NOTES <strong>TO</strong> <strong>THE</strong> FINANCIAL STATEMENTS<br />
8 dePrecIAtIoN ANd AmortISAtIoN eXPeNSe 2011 2010<br />
$’000 $’000<br />
Depreciation<br />
Buildings 970 1,007<br />
Marine vessels 1,398 892<br />
Communications 35 76<br />
Computing hardware 106 101<br />
Furniture, fixtures and fittings 47 63<br />
Office equipment 54 56<br />
Plant and machinery 139 153<br />
Motor vehicles 264 139<br />
Other equipment 79 75<br />
Infrastructure – maritime 82 83<br />
Computing software 176 177<br />
Total depreciation 3,350 2,822<br />
Amortisation<br />
Leased patrol vessel 440 440<br />
Total Amortisation 440 440<br />
Total Depreciation and Amortisation 3,790 3,262<br />
9 fINANce coStS 2011 2010<br />
$’000 $’000<br />
Finance lease and charges 253 140<br />
10 AccommodAtIoN eXPeNSeS 2011 2010<br />
$’000 $’000<br />
Lease rentals 2,071 2,092<br />
2,071 2,092<br />
11 grANtS & SuBSIdIeS 2011 2010<br />
$’000 $’000<br />
Recurrent<br />
Grants to key stakeholder groups 1,840 1,743<br />
Contributions to Fisheries Research and Development Corporation 948 1,710<br />
Research grants 559 1,492<br />
Other 129 154<br />
3,476 5,099<br />
12 fISherIeS AdJuStmeNt Scheme BuyBAcKS 2011 2010<br />
$’000 $’000<br />
Fisheries Adjustment Scheme buy-backs 170 2,566<br />
122<br />
13 other eXPeNSeS 2011 2010<br />
$’000 $’000<br />
Employment on-costs (see note 6 ‘Employee benefits expense’) (a) (19) 5<br />
Other expenses 282 634<br />
263 639<br />
(a) Includes workers’ compensation insurance on-costs. The oncosts<br />
liability associated with the recognition of annual and<br />
long service leave liability is included at Note 27 ‘Provisions’.<br />
Superannuation contributions accrued as part of the provision<br />
for leave are employee benefits and are not included in<br />
employment on-costs.<br />
14 uSer chArgeS ANd feeS 2011 2010<br />
$’000 $’000<br />
Access fees 18,466 11,241<br />
Development of Better Interests fees – 3,500<br />
Application fees 1,303 921<br />
Recreational licence fees 6,123 4,986<br />
Fees for service 68 35<br />
Other 3,598 3,990<br />
29,558 24,673<br />
The Department and the commercial fishing industry entered into<br />
an agreement in 1995 that provided for the Department to recover<br />
the costs associated with the management of major commercial<br />
fisheries. The costs were recovered through the annual fee<br />
charged for access to the fishery concerned.<br />
Effective 1 July 2010 the use of cost recovery and a contribution<br />
to the Development and Better Interests Fund as the mechanism<br />
for setting access fees was discontinued. Access fees are<br />
now levied as a percentage of the gross value of production of<br />
each fishery with no Development and Better Interests Fund<br />
contribution.<br />
15 grANtS ANd coNtrIButIoNS 2011 2010<br />
$’000 $’000<br />
Fisheries Research and Development Corporation 1,297 1,497<br />
Other 1,690 5,136<br />
2,987 6,633<br />
16 INtereSt reveNue 2011 2010<br />
$’000 $’000<br />
Fisheries Research and Development Account 458 69<br />
Fisheries Research and Development Corporation Account 33 33<br />
491 102
DISCLOSURES AND LEgAL COMPLIANCE � NOTES <strong>TO</strong> <strong>THE</strong> FINANCIAL STATEMENTS<br />
17 Net gAIN / (loSS) oN dISPoSAl of NoN-curreNt ASSetS 2011 2010<br />
Costs of Disposal of Non-current Assets<br />
$’000 $’000<br />
Carrying amount of property, plant and equipment disposed of<br />
during the year<br />
129 912<br />
Selling costs of property, plant and equipment disposed of during<br />
the year<br />
Proceeds from disposal of non-current assets<br />
– –<br />
Proceeds from disposal of property, plant and equipment 153 1,021<br />
Net Gain/(loss) 24 109<br />
gain on disposal of Non-current Assets<br />
Property plant & equipment 24 109<br />
Net Gain/( loss) 24 109<br />
18 INcome from StAte goverNmeNt 2011 2010<br />
$’000 $’000<br />
Appropriation received during the year :<br />
Service appropriations (a) 32,676 36,029<br />
32,676 36,029<br />
(a) Service appropriations are accrual amounts, reflecting the net<br />
cost of services delivered. The appropriation revenue comprises<br />
a cash component and a receivable (asset). The receivable<br />
(holding account) comprises the depreciation expense for the<br />
year and any agreed increase in leave liability during the year.<br />
resources received free of charge 2011 2010<br />
$’000 $’000<br />
Administration expenses 499 1,272<br />
Resources received free of charge has been determined on the<br />
basis of the following estimates<br />
provided by agencies:<br />
Department of Justice 321 315<br />
Western Australian Land Information Authority (a) 3 776<br />
Department of Treasury and Finance 175 181<br />
499 1,272<br />
Where assets or services have been received free of charge or for<br />
nominal cost, the Department recognises revenues (except where the<br />
contributions of assets or services are in the nature of contributions<br />
by owners in which case the Department shall make a direct<br />
adjustment to equity) equivalent to the fair value of the assets and/<br />
or the fair value of those services that can be reliably determined<br />
and which would have been purchased if not donated,and those fair<br />
values shall be recognised as assets or expenses, as applicable.<br />
(a) The significant decrease in the resources received free of<br />
charge is the result of minimum usage of Western Australian<br />
Land Information Authority’s digital data after completion of the<br />
Corporate Map Viewer implementation in 2009/10.<br />
123<br />
royalties for regions fund<br />
Regional Community Services Account 94 –<br />
19 reStrIcted cASh ANd cASh eQuIvAleNtS 2011 2010<br />
$’000 $’000<br />
current<br />
Fisheries Research and Development Corporation Account (a) 1,406 1,011<br />
Fisheries Adjustment Schemes Trust Account (b) 231 426<br />
1,637 1,437<br />
Non-current<br />
Salaries suspense account (c) 672 557<br />
2,309 1,994<br />
(a) Monies held in the Fisheries Research and Development<br />
Corporation Account are not available for operations of the<br />
Department as they relate to specific research projects.<br />
(b) Monies held in the Fisheries Adjustment Schemes Trust<br />
Account are only available for use as prescribed by the<br />
Fisheries Adjustment Scheme Act 1987.<br />
(c) Amount held in suspense account is only to be used for the<br />
purpose of meeting the 27th pay in a financial year that occurs<br />
every 11 years. This amount will next be drawn in 2015/16.<br />
20 receIvABleS 2011 2010<br />
$’000 $’000<br />
current<br />
Receivables 2,018 1,104<br />
Less: Allowance for impairment of receivables (4) (1)<br />
GST Receivable 340 139<br />
2,354 1,242<br />
Other Debtors 2,774 317<br />
5,128 1,559<br />
Non-current<br />
Other Debtors 34,862 3,336<br />
34,862 3,336
DISCLOSURES AND LEgAL COMPLIANCE � NOTES <strong>TO</strong> <strong>THE</strong> FINANCIAL STATEMENTS<br />
Reconciliation of changes in the allowance for impairment of<br />
receivables<br />
Balance at start of year 1 4<br />
Doubtful Debts Expense recognised in the income statement 3 –<br />
Amounts written off during the period – 3<br />
Amounts recovered off during the period – –<br />
4 1<br />
The ‘Other Debtors’ relates to an advance made to industry. The<br />
Department does not hold any collateral as security or other credit<br />
enhancements relating to receivables.<br />
See also Note 2(p) “Receivables” and Note 35 ‘Financial<br />
Instruments’ .<br />
21 AmouNtS receIvABle for ServIceS 2011 2010<br />
$’000 $’000<br />
Current 2,226 2,226<br />
Non Current 6,349 5,183<br />
8,575 7,409<br />
This item represents the non-cash component of service<br />
appropriations.<br />
It is restricted in that it can only be used for asset replacement or<br />
payment of leave liability.<br />
See note 2(o) ‘Amounts Receivable for Services (Holding<br />
Account)’.<br />
22 other ASSetS 2011 2010<br />
$’000 $’000<br />
Pre-payments<br />
Licences and rentals 48 72<br />
Lease patrol vessel 4 8<br />
Accrued Income<br />
Accrued Interest 110 29<br />
162 109<br />
23 ProPerty, PlANt ANd eQuIPmeNt 2011 2010<br />
$’000 $’000<br />
LAND<br />
Land at fair value (i) 9,424 9,335<br />
9,424 9,335<br />
BUILDINGS<br />
At fair value (i) 33,314 34,900<br />
Accumulated depreciation – –<br />
33,314 34,900<br />
124<br />
MARINE VESSELS<br />
At fair value (ii) 14,563 9,956<br />
Accumulated depreciation (5,492) (4,096)<br />
9,071 5,860<br />
COMMUNICATION EQUIPMENT<br />
At cost (ii) 575 558<br />
Accumulated depreciation (541) (507)<br />
34 51<br />
COMPUTER HARDWARE<br />
At cost (ii) 1,449 1,356<br />
Accumulated depreciation (1,285) (1,179)<br />
164 177<br />
COMPUTER S<strong>OF</strong>TWARE<br />
Computer software – cost 879 879<br />
Computer software – cost accumulated amortisation (541) (365)<br />
338 514<br />
FURNITURE AND FITTINGS<br />
At cost (ii) 1,021 1,022<br />
Accumulated depreciation (933) (887)<br />
88 135<br />
<strong>OF</strong>FICE EQUIPMENT<br />
At cost (ii) 458 405<br />
Accumulated depreciation (348) (301)<br />
110 104<br />
PLANT AND MACHINERY<br />
At cost (ii) 2,214 1,936<br />
Accumulated depreciation (1,423) (1,285)<br />
791 651<br />
MO<strong>TO</strong>R VEHICLES<br />
At cost (ii) 1,897 1,292<br />
Accumulated depreciation (620) (439)<br />
1,277 853<br />
WORKS <strong>OF</strong> ART<br />
At cost (ii) 97 97<br />
97 97<br />
O<strong>THE</strong>R EQUIPMENT<br />
At cost (ii) 532 465<br />
Accumulated depreciation (244) (165)<br />
288 300<br />
INFRASTRUCTURE - MARITIME<br />
At cost (ii) 2,513 2,513<br />
Accumulated depreciation (1,293) (1,211)<br />
1,220 1,302<br />
LEASED PATROL VESSEL<br />
At capitalised cost 1,650 1,650<br />
Accumulated amortisation (1,357) (917)<br />
293 733
DISCLOSURES AND LEgAL COMPLIANCE � NOTES <strong>TO</strong> <strong>THE</strong> FINANCIAL STATEMENTS<br />
CAPITAL WORKS IN PROGRESS<br />
Buildings (ii) (iii) 1,720 4<br />
Maritime (ii) 508 4,338<br />
Computer software (ii) 715 30<br />
2,943 4,372<br />
Total Property, Plant and Equipment 59,452 59,384<br />
(i) Land and buildings were revalued as at 1 July 2010 by the<br />
Western Australian Land Information Authority (Valuation<br />
Services). The valuations were performed during the year<br />
ended 30 June 2011 and recognised at 30 June 2011. In<br />
undertaking the revaluation, fair value was detemined by<br />
reference to market values for land: $6,094,900 and buildings:<br />
$910,000. For the remaining balance, fair value of land and<br />
buildings was determined by reference to current use of land<br />
and depreciated replacement value of improvements. See note<br />
2(g) ‘ Property, Plant and Equipment and Infrastructure’.<br />
(ii) Marine vessels were revalued by the Maritime Engineers Pty<br />
Ltd during the year ended 30 June 2008 and recognised at 30<br />
June 2008 at market value based on Asset Protection Criteria.<br />
125
Reconciliation<br />
Reconciliations of the carrying amounts of property, plant, equipment and vehicles at the beginning and end of the current financial year are set out below:<br />
2011<br />
carrying amount at<br />
revaluation<br />
deprecn. carrying amount at<br />
start of year Additions disposal transfers from wIP<br />
for the year<br />
for the year<br />
end of year<br />
$’000 $’000 $’000 $’000 $’000 $’000 $’000<br />
Land 9,335 – – – 89 – 9,424<br />
Buildings 34,900 – – – (616) (970) 33,314<br />
Marine vessels 5,860 4,614 (5) – – (1,398) 9,071<br />
Communication equipment 51 18 – – – (35) 34<br />
Computer hardware 177 93 – – – (106) 164<br />
Computer software 514 – – – – (176) 338<br />
Furniture, fixtures and fittings 135 – – – – (47) 88<br />
Office equipment 104 61 (1) – – (54) 110<br />
Plant and machinery 651 278 – – (138) 791<br />
Vehicles 853 810 (122) – – (264) 1,277<br />
Works of art 97 – – – – – 97<br />
Other equipment 300 67 – – – (79) 288<br />
Infrastructure – maritime 1,302 – – – – (82) 1,220<br />
Leased patrol vessel 733 – – – – (440) 293<br />
Work in progress – – – – – – –<br />
Computer software 30 715 – (30) – – 715<br />
Buildings 4 1,716 – – – – 1,720<br />
Maritime 4,338 657 – (4,487) – – 508<br />
59,384 9,029 (128) (4,517) (527) (3,789) 59,452<br />
2010<br />
DISCLOSURES AND LEgAL COMPLIANCE � NOTES <strong>TO</strong> <strong>THE</strong> FINANCIAL STATEMENTS<br />
carrying amount at<br />
revaluation<br />
deprecn. carrying amount at<br />
start of year Additions disposal transfers from wIP<br />
for the year<br />
for the year<br />
end of year<br />
$’000 $’000 $’000 $’000 $’000 $’000 $’000<br />
Land 9,105 974 – – (744) – 9,335<br />
Buildings 27,130 10,826 – – (2,049) (1,007) 34,900<br />
Marine vessels 7,139 252 (639) – – (892) 5,860<br />
Communication equipment 144 – (16) – – (77) 51<br />
Computer hardware 249 31 (2) – – (101) 177<br />
Computer software 690 – – – – (176) 514<br />
Furniture, fixtures and fittings 198 – – – – (63) 135<br />
Office equipment 139 21 – – – (56) 104<br />
Plant and machinery 951 53 (199) – – (154) 651<br />
Vehicles 788 409 (205) – – (139) 853<br />
Works of art 97 – – – – – 97<br />
Other equipment 354 21 – – – (75) 300<br />
Infrastructure – maritime 1,389 – (5) – – (82) 1,302<br />
Leased patrol vessel 1,173 – – – – (440) 733<br />
Work in progress<br />
Computer software 30 – – – – 30<br />
Buildings 8,726 2,104 – (10,826) – – 4<br />
Maritime 672 3,666 – – – – 4,338<br />
58,974 18,357 (1,066) (10,826) (2,793) (3,262) 59,384<br />
126
DISCLOSURES AND LEgAL COMPLIANCE � NOTES <strong>TO</strong> <strong>THE</strong> FINANCIAL STATEMENTS<br />
24 ImPAIrmeNt of ASSetS<br />
There were no indications of impairment of property, plant and<br />
equipment and infrastructure at 30 June 2011.<br />
The Department held no goodwill or intangible assets with an<br />
indefinite useful life during the reporting period and at reporting<br />
date there were no intangible assets not yet available for use.<br />
25 PAyABleS 2011 2010<br />
$’000 $’000<br />
current<br />
Trade payables 2,607 1,907<br />
2,607 1,907<br />
See also note 2(q) ‘Payables’ and note 35 ‘Financial Instruments’.<br />
26 BorrowINgS 2011 2010<br />
$’000 $’000<br />
current<br />
Finance Lease Liability(a) 129 245<br />
Borrowings from Western Australian Treasury Corporation 2,774 317<br />
2,903 562<br />
Non current<br />
Finance Lease Liability(a) – 129<br />
Borrowings from Western Australian Treasury Corporation 34,862 3,336<br />
34,862 3,465<br />
(a) Lease liabilities are effectively secured as the rights to the<br />
leased assets revert to the lessor in the event of default.<br />
The carrying amounts of non-current assets pledged as security are:<br />
Leased Patrol Vessel 293 733<br />
293 733<br />
27 ProvISIoNS 2011 2010<br />
$’000 $’000<br />
current<br />
Employee benefits provision<br />
Purchased leave 7 –<br />
Annual leave (a) 4,322 3,763<br />
Long service leave (b) 4,782 3,049<br />
9,111 6,812<br />
Other provisions<br />
Employment oncosts (c) 40 51<br />
9,151 6,863<br />
Non current 2011 2010<br />
Employee benefits provision $’000 $’000<br />
Purchased and deferred leave 12 (9)<br />
127<br />
Long service leave (b) 2,102 1,975<br />
2,114 1,966<br />
Other provisions<br />
Employment oncosts (c) 9 16<br />
2,123 1,982<br />
totAl ProvISIoNS 11,274 8,845<br />
(a) Annual leave liabilities have been classified as current as there<br />
is no unconditional right to defer settlement for at least 12<br />
months after reporting date. Assessments indicate that actual<br />
settlement of the liabilities will occur as follows:<br />
(b) Long service leave liabilities have been classified as current<br />
where there is no unconditional right to defer settlement for at<br />
least 12 months after reporting date. Assessments indicate<br />
that actual settlement of the liabilities will occur as follows:<br />
(c) The settlement of annual and long service leave gives rise<br />
to the payment of employment on-costs, including workers’<br />
compensation insurance. The provision is the present value<br />
of expected future payments. The associated expense, apart<br />
from the unwinding of the discount (finance cost), is included in<br />
Note 13 ‘Other Expenses’.<br />
Movements in other provisions<br />
Movements in each class of provisions during the financial<br />
year, other than employee benefits are set out below:<br />
4,322 3,763<br />
1,875 3,790<br />
5,009 1,234<br />
6,884 5,024<br />
employment on cost provision<br />
Carrying amount at start of year 67 72<br />
Additional provisions recognised (18) 5<br />
Payments/other sacrifices of economic benefit – (10)<br />
Carrying amount at the end of year 49 67<br />
The superannuation oncosts are included in the annual and long<br />
service leave provisions.
28 other lIABIlItIeS 2011 2010<br />
$’000 $’000<br />
current<br />
Accrued salaries 841 451<br />
Superannuation accrued 44 47<br />
FBT Accrued 59 48<br />
Other 194 178<br />
Infringement Notice collections payable 35 9<br />
1,173 734<br />
29 eQuIty<br />
Equity represents the residual interest in the net assets of the<br />
Department. The Government holds the equity interest in the<br />
Department on behalf of the community. The asset revaluation<br />
reserve represents that portion of equity resulting from the<br />
revaluation of non-current assets.<br />
AccumulAted SurPluS 2011 2010<br />
$’000 $’000<br />
Balance at the start of the year 3,157 3,914<br />
Adjustment for prior year error – –<br />
3,157 3,914<br />
Results for the year<br />
Deficit as per Statement of Comprenhensive Income (5,562) (757)<br />
Balance at the end of the year (2,405) 3,157<br />
coNtrIButed eQuIty<br />
Balance at the start of the year 44,566 39,166<br />
Contributions by owners (a) – –<br />
Capital contribution (a) 5,510 5,400<br />
Total contributions by owners 50,076 44,566<br />
(a) Capital Contributions (appropriations) and non-discretionary<br />
(non-reciprocal) transfers of assets in Treasurer’s Instruction<br />
955 ‘Contributions by Owners Made to Wholly Owned Public<br />
Sector Entities’ from other State government agencies have<br />
been designated as contributions by owners and are credited<br />
directly to equity.<br />
reServeS<br />
DISCLOSURES AND LEgAL COMPLIANCE � NOTES <strong>TO</strong> <strong>THE</strong> FINANCIAL STATEMENTS<br />
Asset revaluation Surplus<br />
Balance at the start of the year 14,041 16,835<br />
Net revaluation increments/(decrements):<br />
Land 89 (744)<br />
Buildings (616) (2,050)<br />
Balance at the end of the year (a) 13,514 14,041<br />
Total equity 61,185 61,764<br />
(a) The asset revaluation surplus is used to record increments<br />
and decrements on the revaluation of non-current assets, as<br />
described in accounting policy note 2(g)<br />
30 NoteS to the cASh flow StAtemeNt<br />
(a) reconciliation of cash<br />
Cash at the end of the financial year as shown in the Cash Flow<br />
Statement is reconciled to the related items in the Balance Sheet<br />
as follows:<br />
128<br />
Cash and cash equivalents 3,494 3,464<br />
Cash advances 22 22<br />
Restricted cash and cash equivalents (refer note 19) 2,309 1,994<br />
(b) reconciliation of net cost of services to net cash flows used<br />
in operating activities<br />
5,825 5,480<br />
Net cash used in operating activities<br />
Non Cash Items<br />
(32,373) (33,595)<br />
Depreciation and amortisation expense (3,790) (3,262)<br />
Doubtful Debt expense (3) 3<br />
Resources received free of charge (499) (1,272)<br />
Profit/(Loss) on disposal of assets 24 109<br />
Other<br />
Increase/(Decrease) in Assets<br />
19 (139)<br />
Accounts receivable - General 914 (361)<br />
Pre-payments (28) 58<br />
Accrued Income<br />
(Increase)/Decrease in Liabilities<br />
81 –<br />
Accrued salaries (390) (122)<br />
Superannuation Accrued 3 26<br />
FBT Accrued (11) 41<br />
Other Liabilities (16) 165<br />
Liability for employee entitlements (2,429) (184)<br />
Infringement notice Collections payable (26) (7)<br />
Accounts payable - General<br />
Increase/(Decrease) in GST<br />
(460) 534<br />
Net GST (receipts) / payments 189 51<br />
Change in GST in receivables/payables (36) (103)<br />
Net cost of services (38,831) (38,058)
DISCLOSURES AND LEgAL COMPLIANCE � NOTES <strong>TO</strong> <strong>THE</strong> FINANCIAL STATEMENTS<br />
31 commItmeNtS for eXPeNdIture 2011 2010<br />
(a) capital expenditure commitments $’000 $’000<br />
Capital expenditure commitments, being contracted capital<br />
expenditure additional to the amounts reported in the financial<br />
statements, are payable as follows:<br />
Within one year 9,184 4,931<br />
Later than one year and not later than five years – –<br />
Later than five years – –<br />
9,184 4,931<br />
The capital commitments include amounts for:<br />
Buildings 3,418 689<br />
(b) operating lease commitments<br />
Commitments in relation to non-cancellable leases for<br />
accommodation and motor vehicles contracted for at the<br />
reporting date but not recognised in the financial statements<br />
are payable as follows:<br />
Within one year 3,159 3,100<br />
Later than one year and not later than five years 8,712 2,263<br />
Later than five years 16,546 13,625<br />
28,417 18,988<br />
Representing:<br />
Cancellable operating leases – –<br />
Non-cancellable operating leases 28,417 18,988<br />
28,417 18,988<br />
(c) finance lease commitments<br />
Minimum lease payments commitments in relation to finance<br />
leases are payable as follows:<br />
Within one year 133 266<br />
Later than one year and not later than five years – 133<br />
Later than five years – –<br />
Minimum lease payments 133 399<br />
Less future finance charges (4) (25)<br />
Present value of finance lease liabilities 129 374<br />
The present value of finance leases payables is as follows:<br />
Within one year 133 245<br />
Later than one year and not later than five years – 129<br />
Later than five years – –<br />
Present value of finance lease liabilities 133 374<br />
Included in the financial statements as:<br />
Current (note 26) 129 245<br />
Non-current (note 26) – 129<br />
129 374<br />
The operating lease commitments are calculated and forecast based on the information<br />
available at the reporting date and do not take into consideration any impacts of future<br />
changes arising from market conditions or rental reviews.<br />
These leasing arrangements do not have escalation clauses other than in the event of<br />
payment default. There are no restrictions imposed by these leasing arrangements on other<br />
financing transactions.<br />
The commitments, where applicable, are inclusive of GST.<br />
32 coNtINgeNt lIABIlItIeS ANd coNtINgeNt ASSetS<br />
In addition to the liabilities included in the financial statements, the Department has the<br />
following contingent liabilities.<br />
129<br />
Contaminated Sites<br />
Under the Contaminated Sites Act 2003, the Department is required to report known<br />
and suspected contaminated sites to the Department of Environment and Conservation<br />
(DEC). In accordance with the Act, DEC classifies these sites on the basis of the risk to<br />
human health, the environment and environmental values. Where sites are classified as<br />
‘contaminated - remediation required’ or ‘possibly contaminated – investigation required’,<br />
the Department may have a liability in respect of investigation or remediation expenses.<br />
The Department has reported a suspected contaminated site at the Albany Aquaculture<br />
Park to DEC. This has been classified by DEC as requiring further investigation.<br />
In June 2011 the Department received a report from Environmental Resources Australia<br />
Pty Limited that included findings from a recent site assessment. The report advised that<br />
the assessments indicate that there are currently no identified potential risks to human<br />
health or the environment related to previous activities and as such the site appears<br />
suitable for ongoing commercial/industrial use.<br />
The Department is unable to assess the likely outcome of the classification process<br />
until the contamination sites auditor completes an assessment and, accordingly, it is<br />
not practicable to estimate the potential financial effect or to identify the uncertainties<br />
relating to the amount or timing of any outflows.<br />
Whilst there is no possibility of reimbursement of any future expenses that may be<br />
incurred in the remediation of these sites, the Department may apply for funding from the<br />
Contaminated Sites Management Account to undertake further investigative work or to<br />
meet remediation costs that my be required.<br />
Litigation<br />
The Department has pending litigation that may affect the financial position.<br />
The maximum financial effect is $65,000.
DISCLOSURES AND LEgAL COMPLIANCE � NOTES <strong>TO</strong> <strong>THE</strong> FINANCIAL STATEMENTS<br />
33 eveNtS occurINg After the BAlANce Sheet dAte<br />
There were no events occurring after the balance date that require disclosure or adjustment<br />
to the financial statements.<br />
2011 2011<br />
Actual estimate variance<br />
$’000 $’000 $’000<br />
34 eXPlANAtory StAtemeNt<br />
Significant variations between estimates and actual<br />
results for income and expense as presented in the<br />
financial statement titled ‘Summary of Consolidated<br />
Account Appropriations and Income Estimates’ are<br />
shown below. Significant variations are considered to<br />
be those greater than 10 per cent.<br />
(a) Significant variances between estimate and actual for services delivered in 2011<br />
Services<br />
Aquatic Management 20,715 15,697 5,018<br />
The variance between the budget and the actual<br />
expenditure is due to additional employee-related<br />
costs resulted from a reduction in the minimum<br />
service period required to recognise long service<br />
leave liability. In addition significant non-salary<br />
related costs were incurred in transitioning the<br />
West Coast Rock Lobster fishery to quota and the<br />
start-up costs associated with implementing a<br />
biosecurity (marine pests) program.<br />
Research and Monitoring 24,040 19,872 4,168<br />
The variance between the budget and the actual<br />
expenditure is due to additional employee-related<br />
costs resulted from a reduction in the minimum<br />
service period required to recognise long service<br />
leave liability. In addition significant non-salary<br />
related costs were incurred for recreational<br />
surveys.<br />
Marine Safety Service 432 1,558 (1,126)<br />
The 2010/11 Actual has reduced compared to<br />
the 2010/11 Budget as the reduced service<br />
delivery in this area in 2010/11 has resulted in a<br />
reduction in the non-salary related expenses.<br />
(b) Significant variances in actual costs of services delivered between actuals for 2010<br />
and 2011<br />
130<br />
Services<br />
Aquatic Management 20,715 16,932 3,783<br />
The variance between the budget and the actual<br />
expenditure is due to additional employee-related<br />
costs resulted from a reduction in the minimum<br />
service period required to recognise long service<br />
leave liability. In addition significant non-salary<br />
related costs were incurred in transitioning the<br />
West Coast Rock Lobster fishery to quota and the<br />
start up costs associated with implementing a<br />
biosecurity (marine pests) program. This impacts<br />
salaries, supplies and services.<br />
Marine Safety Service 432 1,131 ( 699)<br />
This reduction is the result of reduced level of<br />
activity in this service.<br />
(c) Significant variances between estimate and actual for 2011 - capital expenditure<br />
2011 2010<br />
$’000 $’000<br />
Capital Expenditure 4,414 8,011 (3,597)<br />
The decreased expenditure results from some<br />
2010/11 financial year expenditure, namely<br />
construction of the Denham building, being<br />
deferred to 2011/12.<br />
Supplementary funding Approved during 2010/11 $’000<br />
Recurrent<br />
Funding for Aquatic Biosecurity 2,400<br />
2010 Voluntary Severance Scheme – Return of<br />
50 per cent savings (414)<br />
1,986
DISCLOSURES AND LEgAL COMPLIANCE � NOTES <strong>TO</strong> <strong>THE</strong> FINANCIAL STATEMENTS<br />
35 fINANcIAl INStrumeNtS<br />
(a) financial risk management objectives and Policies<br />
Financial instruments held by the Department are cash and cash equivalents, borrowings,<br />
finance leases, and receivables and payables. All of the Department’s cash is held in the<br />
public account. The Department has limited exposure to financial risks. The Department’s<br />
overall risk management program focuses on managing the risks identified below.<br />
Credit Risk<br />
Credit risk arises when there is the possibility of the Department’s receivables<br />
defaulting on their contractual obligations resulting in financial loss to the Department.<br />
The maximum exposure to credit risk at the end of the reporting period in relation<br />
to each class of recognised financial assets is the gross carrying amount of those<br />
assets inclusive of any provisions for impairment, as shown in the table at Note 35(c)<br />
‘Financial Instruments Disclosures’ and Note 20 ‘Receivables’.<br />
Credit risk associated with the Department’s financial assets is minimal because<br />
the main receivable is the amount receivable for services (holding account). For<br />
receivables other than government, the Department trades only with recognised,<br />
creditworthy third parties. The Department has policies in place to ensure that sales<br />
of products and services are made to customers with an appropriate credit history. In<br />
addition, receivable balances are monitored on an ongoing basis with the result that<br />
the Department’s exposure to bad debts is minimal. At the end of the reporting period<br />
there were no significant concentrations of credit risk.<br />
Allowance for impairment of financial assets is calculated based on objective evidence<br />
such as observable data indicating changes in client credit ratings. For financial assets<br />
that are either past due or impaired, refer to Note 36(c) Financial Instruments Disclosures.<br />
Liquidity Risk<br />
Liquidity risk arises when the Department is unable to meet its financial obligations<br />
as they fall due. The Department is exposed to liquidity risk through its trading in the<br />
normal course of business. The Department has appropriate procedures to manage<br />
cash flows including drawdowns of appropriations by monitoring forecast cash flows to<br />
ensure that sufficient funds are available to meet its commitments.<br />
Market Risk<br />
Market risk is the risk that changes in market prices such as foreign exchange rates<br />
and interest rates will affect the Department’s income or the value of its holdings of<br />
financial instruments. The Department is not exposed to interest rate risk because<br />
cash and cash equivalents and restricted cash are non-interest bearing and the<br />
Department does not trade in foreign currency and has no borrowings other than from<br />
the Western Australian Treasury Corporation and finance leases (fixed interest rate).<br />
(b) categories of financial Instruments<br />
In addition to cash, the carrying amounts of each<br />
of the following categories of the financial assets<br />
and financial liabilities at the balance sheet date<br />
are as follows:<br />
131<br />
financial Assets and liabilities 2011 2010<br />
$’000 $’000<br />
financial Assets<br />
Cash and cash equivalents 3,516 3,486<br />
Restricted cash and cash equivalents 2,309 1,994<br />
Receivables(a) 48,225 12,165<br />
total financial Assets 54,050 17,645<br />
financial liabilities<br />
Financial liabilities measured at amortised cost 40,372 5,934<br />
total financial liabilities 40,372 5,934<br />
(a) The amount of receivables excludes GST recoverable<br />
from the A<strong>TO</strong> (statutory receivable).<br />
(c) financial Instrument disclosures<br />
Credit Risk, and Interest Rate Risk Exposures<br />
The following table discloses the Department’s maximum exposure to liquidity and<br />
interest rate risks as at the balance date.<br />
The Department’s maximum exposure to credit risk at the balance sheet date is the<br />
carrying amount of the financial assets on the following table. The table is based on<br />
information provided to senior management of the Department. The Fixed Interest Rate<br />
contractual maturity amounts are representative of the undiscounted amounts at the<br />
balance sheet date. No adjustment for discounting has been made as it is considered<br />
immaterial.<br />
The Department does not hold any collateral as security or other credit enhancements<br />
relating to the financial assets it holds.<br />
The Department does not hold any financial assets that had to have their terms<br />
renegotiated that would have otherwise resulted being past due or impaired.
DISCLOSURES AND LEgAL COMPLIANCE � NOTES <strong>TO</strong> <strong>THE</strong> FINANCIAL STATEMENTS<br />
Interest rate exposures and ageing analysis of financial assets (a)<br />
Interest rate<br />
exposure<br />
Past due but not impaired<br />
weighted<br />
Average effective<br />
Interest rate<br />
carrying<br />
Amount<br />
variable<br />
interest<br />
rate<br />
Non-<br />
Interest<br />
Bearing<br />
up to 3<br />
months<br />
3-12<br />
months<br />
1-2 years 2-3 years 3-4 years<br />
more than<br />
4-5years<br />
5 years<br />
Impaired<br />
financial<br />
Assets<br />
% $’000 $’000 $’000 $’000 $’000 $’000 $’000 $’000 $’000 $’000 $’000<br />
financial Assets<br />
2011<br />
Cash Assets 5.03% 3,516 3,516 – – – – – – – – –<br />
Restricted cash assets 5.03% 2,309 1,406 903 – – – – – – – –<br />
Receivables(a) 0.00% 1,944 – – 1,763 66 119 – – – – –<br />
Loans and Advances 0.00% 37,636 – 37,636 – 2,772 3,102 3,295 3,500 3,718 21,247 –<br />
Amounts Receivable for Services 0.00% 8,575 – 8,575 – – – – – – – –<br />
2010<br />
53,980 4,922 47,114 1,763 2,838 3,221 3,295 3,500 3,718 21,247 –<br />
Cash Assets 4.03% 3,486 3,486 – – – – – – – – –<br />
Restricted cash assets 4.03% 1,994 1,011 983 – – – – – – – –<br />
Receivables(a) 0.00% 1,103 – 1,103 912 72 119 – – – – –<br />
Loans and Advances 0.00% 3,653 – 3,653 – – – – – – – –<br />
Amounts Receivable for Services 0.00% 7,409 – 7,409 – – – – – – – –<br />
17,645 4,497 13,148 912 72 119 – – – – –<br />
(a) The amount of receivables excludes the GST recoverable from the A<strong>TO</strong> (statutory receivable)<br />
Liquidity risk<br />
The following table details the contractual maturity analysis for financial liabilities. The contractual maturity amounts are representative of the undiscounted amounts at the balance sheet<br />
date. The table includes both interest and principal cash flows. An adjustment has been made where material.<br />
Interest rate exposure and maturity analysis of financial liabilities<br />
Interest rate exposure maturity dates<br />
weighted<br />
Average<br />
effective<br />
Interest<br />
rate<br />
carrying Amount<br />
fixed<br />
interest<br />
rate<br />
variable<br />
interest<br />
rate<br />
Non-<br />
Interest<br />
Bearing<br />
Adjustment<br />
for<br />
discounting<br />
total<br />
Nominal<br />
Amount<br />
up to 3<br />
months<br />
3 -12<br />
months<br />
132<br />
1-2 years 2-3 years 3-4 years 4-5years more than<br />
5 years<br />
% $’000 $’000 $’000 $’000 $’000 $’000 $’000 $’000 $’000 $’000 $’000 $’000 $’000<br />
financial liabilities<br />
2011<br />
Payables 0.00% 2,607 – – – – – – – – – – – –<br />
WATC borrowings 6.17% 37,636 – – – – – – 2,772 3,102 3,295 3,500 3,718 21,247<br />
Finance lease liabilities 7.66% 129 – – – – – 64 65 – – – –<br />
2010<br />
40,372 – – – – – 64 2,837 3,102 3,295 3,500 3,718 21,247<br />
Payables 0.00% 1,907 – – – – – – – – – – – –<br />
WATC borrowings 6.12% 3,653 – – – – – – 317 336 356 378 401 1,865<br />
Finance lease liabilities 7.66% 374 – – – – – 60 185 129 – – – –<br />
5,934 – – – – – 60 502 465 356 378 401 1,865<br />
The amounts disclosed are the contractual undiscounted cash flows of each class of financial liabilities.
DISCLOSURES AND LEgAL COMPLIANCE � NOTES <strong>TO</strong> <strong>THE</strong> FINANCIAL STATEMENTS<br />
Interest rate sensitivity analysis<br />
The following table represents a summary of the interest rate sensitivity of the Department’s<br />
financial assets as at the end of the reporting period on the surplus for the period and<br />
equity for a one per cent change in interest rates. It is assumed that the change in interest<br />
rate is held constant throughout the reporting period.<br />
The one per cent change in interest rates has no impact on the financial liabilities, and<br />
hence the profit and equity, as payables do not attract interests and interest payable on the<br />
financial lease is based on fixed interest rate.<br />
-1% change +1% change<br />
carrying Amount Profit equity Profit equity<br />
$’000 $’000 $’000 $’000 $’000<br />
2011<br />
financial Assets<br />
Cash Assets 4,922 (49) (49) 49 49<br />
-1% change +1% change<br />
carrying Amount Profit equity Profit equity<br />
$’000 $’000 $’000 $’000 $’000<br />
2010<br />
financial Assets<br />
Cash Assets 4,497 (45) (45) 45 45<br />
fair values<br />
All financial assets and liabilities recognised in the Statement of Financial Position, whether<br />
they are carried at cost or fair value, are recognised at amounts that represent a reasonable<br />
approximation of fair value unless otherwise stated in the applicable notes.<br />
36 remuNerAtIoN of SeNIor offIcerS<br />
remuneration<br />
The number of senior officers, whose total of fees, salaries,<br />
superannuation and other benefits received or due and receivable,<br />
for the financial year, fall within the following bands are:<br />
2011 2010<br />
< $110,000 1 1<br />
$120,001 - 130,000 – 1<br />
$140,001 - 150,000 1 1<br />
$150,001 - 160,000 – 1<br />
$160,001 - 170,000 1 –<br />
$170,001 - 180,000 1 1<br />
$190,001 - 200,000 1 –<br />
$270,001 - 280,000 – 1<br />
$290,001 - 300,000 1 –<br />
Total remuneration of senior officers 1,016 878<br />
The remuneration includes the superannuation expense incurred<br />
by the Department in respect of senior officers. No senior officers<br />
are members of the Pension Scheme.<br />
133<br />
37 remuNerAtIoN of AudItor 2011 2010<br />
Remuneration to the Auditor General for the financial year is as<br />
follows:<br />
$’000 $’000<br />
Auditing the accounts, financial statements and performance<br />
indicators<br />
The expense is included in notes 7 and 25.<br />
128 150<br />
38 relAted BodIeS<br />
The Department has no related bodies as defined in the Financial Management Act 2006 and<br />
Treasurer’s Instruction 951.<br />
39 AffIlIAted BodIeS<br />
The Department has no related bodies as defined in the Financial Management Act 2006 and<br />
Treasurer’s Instruction 951.<br />
40 SuPPlemeNtAry fINANcIAl INformAtIoN<br />
write-offs<br />
During the financial year, debts due to the State were written off<br />
under the authority of:<br />
The Accountable Officer 29 4<br />
29 4<br />
During the financial year these assets were written off the<br />
Department’s asset register under the authority of:<br />
The Accountable Officer 3 38<br />
Less: Recovered by Insurance (2) –<br />
1 38<br />
The Minister – 214<br />
Less: Recovered by Insurance – 286<br />
– (72)<br />
Act of grace Payments<br />
During the financial year, one act of grace payment was made<br />
under the authority of:<br />
The Minister 29 27<br />
29 27
DISCLOSURES AND LEgAL COMPLIANCE � NOTES <strong>TO</strong> <strong>THE</strong> FINANCIAL STATEMENTS<br />
41 JoINtly coNtrolled ASSetS<br />
The following represents the Department’s 50 per cent ownership interest in the Marine<br />
Operations Centre with Department of Transport. The jointly controlled assets are included<br />
in the financial statements.<br />
2011 2010<br />
Non current assets $’000 $’000<br />
Property, plant, equipment, vehicles and vessels 3,076 3,139<br />
Infrastructure 156 167<br />
3,232 3,306<br />
dePArtmeNt of fISherIeS SPecIAl PurPoSe AccouNt StAtemeNt of receIPtS ANd<br />
PAymeNtS for the PerIod 1 July 2010 to 30 JuNe 2011<br />
42 fISherIeS reSeArch ANd develoPmeNt AccouNt<br />
2010 2011<br />
$’000 $’000 $’000<br />
1,068 opening balance - 1 July 3,396<br />
receipts<br />
30,035 Contribution from Consolidated Account 27,567<br />
15,752 Fisheries Access Fees 18,466<br />
3,500 Development and Better Interests –<br />
921 Application Fees 1,303<br />
65 Interest 380<br />
5,136 Grants 1,690<br />
8,636 Other Sundry Revenue 8,878 58,284<br />
65,113 61,680<br />
Payments<br />
61,604 Contribution to Fisheries WA operations 58,138<br />
113 Contribution to Salaries Suspense 115 58,253<br />
61,717 58,253<br />
3,396 Balance 30 June held by treasury 3,427<br />
The Fisheries Research and Development Account, which was established under the<br />
Fisheries Act 1905 (repealed), was continued under the Fish Resources Management Act<br />
1994 (FRMA 1994). The purpose of the Account is to hold funds in accordance with section<br />
238 of the FRMA 1994 which may be used and applied by the Minister in such manner and<br />
in such proportion as the Minister thinks fit for all or any of the purposes prescribed by<br />
section 238(5) of the FRMA 1994 and section 37(3), 41 and 55(4) and (5) of the Pearling<br />
Act 1990. All revenue and expenditure relating to commercial fishing, fish and fish habitat<br />
protection, pearling and aquaculture services is transacted through this account.<br />
43 AfmA AccouNt<br />
2010 2011<br />
$’000 $’000 $’000<br />
12 opening balance – 1 July 20<br />
receipts<br />
21 Funds received from AFMA – –<br />
33 20<br />
Payments<br />
13 Expenditure on AFMA-related activities – –<br />
13 –<br />
20 Balance 30 June held by treasury 20<br />
The AFMA Account is established under the FRMA 1994. The Account is used for<br />
transactions relating to the services provided by Department of Fisheries to the Australian<br />
Fisheries Management Authority. The purpose of the Account is to hold funds in accordance<br />
with section 241 of the FRMA 1994 which may be applied by the Minister for all or any of<br />
the purposed prescribed by section 241(4) of the FRMA 1994.<br />
44 recreAtIoNAl fIShINg AccouNt<br />
2010 2011<br />
$’000 $’000 $’000<br />
10 opening balance - 1 July 10<br />
receipts<br />
10,992 Contribution from Consolidated Account 9,453<br />
4,985 Recreational Fishing Licences 6,123 15,576<br />
15,987 15,586<br />
Payments<br />
15,977 Expenditure on recreational fishing related activities 15,576<br />
15,977 15,576<br />
10 Balance 30 June held by treasury 10<br />
134
DISCLOSURES AND LEgAL COMPLIANCE � NOTES <strong>TO</strong> <strong>THE</strong> FINANCIAL STATEMENTS<br />
45 fISherIeS reSeArch ANd develoPmeNt corPorAtIoN AccouNt<br />
2010 2011<br />
$’000 $’000<br />
645 opening balance - 1 July 1,010<br />
1,497<br />
receipts<br />
Contributions from Fisheries Research and<br />
Development Corporation<br />
1,297<br />
33 Interest 33<br />
296 Other 270 1,600<br />
2,471 2,610<br />
Payments<br />
1,461 Expenditure on Fisheries WA research-related activities 1,204<br />
1,461<br />
1,010 Balance 30 June held by treasury 1,406<br />
The purpose of this Account is to hold funds in accordance with section 242 of the FRMA<br />
1994 which may be applied by the Minister for all or any of the purposes prescribed by<br />
section 242(4) of the FRMA 1994. Approval has been granted by the Treasurer to overdraw<br />
this Account to a limit of $300K.<br />
46 fISherIeS AdJuStmeNt SchemeS truSt AccouNt<br />
2010 2011<br />
$’000 $’000 $’000<br />
1,692 opening balance - 1 July 426<br />
receipts<br />
1,013 Specific State contributions to fisheries adjustment 34,921<br />
2,705 35,347<br />
Payments<br />
3 Administration<br />
2,276 Unit buy back State Scheme 35,116<br />
2,279 35,116<br />
426 Balance 30 June held by treasury 231<br />
The purpose of this account is to hold funds in accordance with section 5 of the Fisheries<br />
Adjustment Scheme Act 1987 which shall be applied by the Minister for the purposes<br />
prescribed by section 6 of that Act.<br />
47 fISherIeS PrIvAte moNeyS truSt AccouNt<br />
2010 2011<br />
$’000 $’000 $’000<br />
60 opening balance - 1 July 66<br />
receipts<br />
8 Proceeds from the sale of seized fish –<br />
68 66<br />
Payments<br />
– Monies transferred 7<br />
2 Monies repaid – 7<br />
66 Balance 30 June held by treasury 59<br />
The purpose of this account is to hold moneys seized and proceeds from the sale of seized<br />
fish pursuant to the Fisheries Act 1905 pending prosecution action. The Fisheries Act 1905<br />
has been repealed and replaced by the FRMA 1994.<br />
48 fISh fArm BoNd dePoSItS truSt AccouNt<br />
2010 2011<br />
$’000 $’000<br />
105 opening balance - 1 July 109<br />
receipts<br />
4 Interests 5<br />
109 Balance 30 June held by treasury 114<br />
The purpose of this account is to hold fish farm bond deposits lodged by licensees, as<br />
security and guarantee for the due and punctual performance of the licensees Fish Farm<br />
licence conditions.<br />
135
DISCLOSURES AND LEgAL COMPLIANCE � NOTES <strong>TO</strong> <strong>THE</strong> FINANCIAL STATEMENTS<br />
dePArtmeNt of fISherIeS dIScloSure of fINANcIAl trANSActIoNS<br />
INdIAN oceAN terrItorIeS for the PerIod 1 July 2010 to 30 JuNe 2011<br />
49 chrIStmAS ISlANd ANd cocoS (KeelINg) ISlANdS<br />
2010 2011<br />
$’000 $’000 $’000<br />
91 opening Balance 1 July (147)<br />
Income<br />
Application fees and Recreational Boat Licences 2<br />
478 Commonwealth Funding 989 991<br />
569 844<br />
expenditure<br />
272 Salaries 326<br />
65 Travel and accommodation 98<br />
80 Administration 37<br />
299 Oncosts 358 819<br />
716 819<br />
(147) Balance 30 June 25<br />
In October 2001, the Department of Fisheries entered into a Service Delivery Agreement<br />
(SDA) with the Commonwealth. The SDA provides for the delivery of a range of services by<br />
the Department of Fisheries in the Indian Ocean Territories including the management of<br />
commercial fishing, recreational fishing, aquaculture, fish health and community education<br />
and awareness programs. The Department provides these services on behalf of the<br />
Commonwealth Attorney General’s Department, formerly on behalf of Department of Transport<br />
and Regional Services under the Fish Resources Management Act (1994) (WA) (CI) (CKI).<br />
136
DISCLOSURES AND LEgAL COMPLIANCE � O<strong>THE</strong>R FINANCIAL DISCLOSURES<br />
Other Financial Disclosures<br />
capital works Program<br />
A new Marine Operations Centre at Denham is<br />
under construction and is due to open in 2012.<br />
This new centre will facilitate the delivery of the<br />
Department’s services, including fisheries and<br />
marine protected area management, in the Shark<br />
Bay World Heritage Area. It will also accommodate<br />
staff from the Department of Environment and<br />
Conservation and the Shark Bay Volunteer Sea<br />
Rescue Group.<br />
The capital program for 2010/11 has funded<br />
the continuing upgrade of departmental vessels<br />
of various sizes to support the Department’s<br />
compliance and education services, and research<br />
and monitoring program.<br />
Where actual spending is under planned<br />
expenditure, adjustments are made to future outyears<br />
in the capital program.<br />
The table below details key areas of<br />
infrastructure that assists the Department of<br />
Fisheries to deliver planned services.<br />
table 24. Capital Works Program 2010/11<br />
137<br />
Project Description<br />
Planned<br />
Expenditure<br />
Actual<br />
Expenditure<br />
$’000 $’000<br />
Information Systems 2,971 1,010<br />
Plant and Equipment 1,718 1,784<br />
Physical Infrastructure 5,134 1,716<br />
Vessels 3,531 827<br />
<strong>TO</strong>TAL: Capital Works Program 13,354 5,337<br />
Vessels<br />
Major vessel replacements completed for the year<br />
included the 20-metre offshore patrol vessel PV<br />
Houtman based in Geraldton ($3,361,860), the<br />
11.3-metre rigid inflatable boat PV Armatus based in<br />
Mandurah ($471,677), the 8.5 metre rigid inflatable<br />
boat FD 44 based in Exmouth ($271,069) and the<br />
7.5 metre research vessel Snipe II based at Hillarys<br />
($153,000).<br />
The 23-metre research vessel RV Naturaliste<br />
based in Fremantle was re-powered as part of<br />
its major refit ($145,000). Routine outboard<br />
replacements were completed on small patrol<br />
vessels based in Denham and Karratha and
DISCLOSURES AND LEgAL COMPLIANCE � O<strong>THE</strong>R FINANCIAL DISCLOSURES<br />
the PV Walcott tender vessel ($73,608 total).<br />
Replacement dinghies were completed for<br />
Kununurra ($23,000), Special Operations Unit<br />
($20,000) and Broome ($23,000).<br />
All replacements were for the Department’s<br />
existing fleet in keeping with the rationalisation of<br />
the State’s vessel assets.<br />
Regional Services operational equipment<br />
Operational equipment was procured to support<br />
fisheries compliance and education activities in<br />
all regions ($179,910). Major items included allterrain<br />
vehicles at Denham and Lancelin, computer<br />
equipment for training, and surveillance and<br />
photographic equipment.<br />
Pricing policy for services provided<br />
The Department of Fisheries operates in an<br />
environment where a significant proportion of<br />
operating revenue is received from sources other<br />
than the Consolidated Account.<br />
The non Consolidated Account sources of<br />
revenue include regulatory fees and charges related<br />
to commercial fishing, aquaculture and recreational<br />
fishing. These fees are set in accordance with<br />
government policy.<br />
The basis for setting of these regulatory fees<br />
is determined by the nature of the transaction.<br />
It can be set at full cost recovery (registry<br />
transactions), partial cost recovery (recreational<br />
138<br />
license fees) and in the case of commercial access<br />
to fish resources and water, at an amount to reflect<br />
an appropriate payment to the community for that<br />
access.<br />
As the Department has developed significant<br />
specialist service delivery capacity it is often<br />
requested to support activities of other State and<br />
Commonwealth agencies. These services are<br />
provided on a full cost recovery basis.<br />
Where the Department charges for goods and<br />
services rendered on a full or partial cost recovery<br />
basis, these fees and charges were determined in<br />
accordance with Costing and Pricing Government<br />
Services: Guidelines for Use by Agencies in the<br />
Western Australian Public Sector published by the<br />
Department of Treasury and Finance.<br />
Regulations specifying commercial fisheries<br />
access and other fees charged by the Department<br />
are published in the Government Gazette – see<br />
Appendix 3.<br />
Details of the fees for the various categories<br />
of aquaculture licences can be found on the<br />
Department of Fisheries’ website at: http://www.<br />
fish.wa.gov.au/docs/pub/Licencing/AquaFees.<br />
php?0307<br />
A new fee system for the commercial fishing<br />
and aquaculture sector in Western Australia has<br />
been introduced, following extensive consultation.<br />
The new system is designed to improve fairness<br />
and planning for the commercial sector and takes
DISCLOSURES AND LEgAL COMPLIANCE � O<strong>THE</strong>R FINANCIAL DISCLOSURES<br />
effect in each fishery in the first licensing period<br />
after 1 July 2010. Further information can be found<br />
on the Department of Fisheries website at: http://<br />
www.fish.wa.gov.au/sec/com/lic/index.php?0205<br />
139
DISCLOSURES AND LEgAL COMPLIANCE � DETAILED kEy PERFORMANCE INDICA<strong>TO</strong>RS<br />
Detailed Key Performance Indicators<br />
certification of Performance<br />
Indicators for the year ended<br />
30 June 2011<br />
Treasurer’s Instruction 905<br />
Financial Management Act 2006<br />
I hereby certify that the performance indicators<br />
are based on proper records, are relevant and<br />
appropriate for assisting users to assess the<br />
Department of Fisheries performance, and fairly<br />
represent the performance of the Department of<br />
Fisheries for the financial year ended 30 June 2011.<br />
Stuart Smith<br />
Accountable Authority<br />
August 2011<br />
Performance Indicators 2010/11 for<br />
the year ended 30 June 2011<br />
140<br />
Outcome<br />
The desired outcome of the Department of Fisheries<br />
is the conservation and sustainable development of<br />
the State’s fish resources.<br />
The effectiveness of the Department in<br />
achieving this outcome is determined by its<br />
performance against the following mix of resource<br />
sustainability, economic and social benefit measures.<br />
Objective 1 – Sustainable<br />
Fisheries Management<br />
1.1 the proportion of fish stocks identified<br />
as being at risk or vulnerable<br />
through exploitation<br />
Annual stock assessments of the fisheries that<br />
are subject to management are undertaken<br />
by the Department’s Research Division. These<br />
assessments, together with trends in catch and<br />
fishing activity, have been used to determine the
DISCLOSURES AND LEgAL COMPLIANCE � DETAILED kEy PERFORMANCE INDICA<strong>TO</strong>RS<br />
sustainability status of the State’s most significant<br />
commercial fisheries (full details of which are in<br />
the companion State of the Fisheries and Aquatic<br />
Resources Report 2010/11).<br />
Performance is measured as the proportion<br />
of fisheries (which have sufficient data) for which<br />
the breeding stocks of each of the major target or<br />
indicator species are being maintained at levels<br />
that ensure catches could be sustained at desirable<br />
levels, given effort levels and normal environmental<br />
conditions; or they are recovering from a depleted<br />
state at an appropriate rate following management<br />
intervention. The Department’s 2010/11 Budget<br />
Papers state that the target for the proportion<br />
of fisheries with appropriate breeding stock<br />
management is 83 per cent.<br />
For the 2010/11 performance review, 38<br />
fisheries have been utilised, which is the same as<br />
in 2009/10.<br />
For the 38 fisheries reviewed, the ‘Stock<br />
Status and Catch Ranges for Major Commercial<br />
Fisheries ‘ section of the Annual Report records<br />
that breeding stock assessments are available<br />
for the major species taken in 36 (94 per cent)<br />
of these fisheries. For the other two fisheries,<br />
insufficient data were available on the target<br />
species to make a critical assessment. In situations<br />
where unmonitored stocks have the potential to<br />
become overfished, they are given priority for new<br />
research and/or management.<br />
141<br />
Within the group of 36 assessed fisheries,<br />
30 involve stocks that were considered to have<br />
adequate breeding stock levels (83 per cent of<br />
fisheries). Four additional fisheries have breeding<br />
stocks considered to be recovering at acceptable<br />
rates (West Coast Demersal Scalefish Fishery,<br />
Shark Bay Snapper Fishery, Southern Shark Fishery,<br />
Cockburn Sound Crab Fishery).<br />
The management arrangements introduced<br />
for the West Coast Demersal Scalefish Fishery<br />
over the past two years to reduce the total level of<br />
fishing mortality and catch on these stocks across<br />
all sectors by 50 per cent look to be achieving the<br />
desired outcomes. The catches have been reduced<br />
by 50 per cent, so an initial level of stock recovery<br />
is considered to have been initiated.<br />
Ongoing success for the stock is dependent<br />
on maintenance of these reduced catches, which<br />
is best measured by an examination of the total<br />
level of fishing mortality. Monitoring of the status<br />
of the indicator species and the catches taken by<br />
all sectors is currently underway. The status of the<br />
key stocks for this fishery will be fully reviewed in<br />
2012/13 to determine if the initial positive signs<br />
that management has been successful are likely<br />
to be ongoing. Similarly, the status of the Shark<br />
Bay snapper component of the Gascoyne Demersal<br />
Scalefish Fishery will be re-assessed in 2012/13.<br />
For the Southern Shark Fishery, only one of the<br />
four target species (sandbar shark) has a breeding
DISCLOSURES AND LEgAL COMPLIANCE � DETAILED kEy PERFORMANCE INDICA<strong>TO</strong>RS<br />
stock that will likely remain below acceptable levels<br />
for some time due to previous fishing activities<br />
(i.e. not from current fishing impacts). Following<br />
a detailed review of catch and effort data for the<br />
Southern Shark Fishery, a re-assessment of the<br />
stocks has revealed that previous management<br />
interventions can now be seen to have had a<br />
positive impact on the sustainability of dusky shark<br />
and whiskery shark.<br />
The Cockburn Sound Crab Fishery opened<br />
for the first time in three years due to continuing<br />
recovery of the breeding stock and improving<br />
recruitment. It was opened under precautionary<br />
management arrangements (restricted effort) to<br />
allow further recovery.<br />
In conclusion, a combined total of 94 per cent<br />
of fisheries have breeding stock management that<br />
is considered satisfactory (Figure 1), which is above<br />
the target level.<br />
For the two remaining fisheries, in the<br />
Northern Shark Fishery the sandbar shark stock<br />
continues to be depleted, while the South Coast<br />
Herring Fishery continues to have an uncertain<br />
status. Note that the sandbar shark stock is shared<br />
between the northern and southern shark fisheries,<br />
with catches in the north currently at zero due<br />
to uncertainty for the industry regarding ongoing<br />
viability of operating in this region.<br />
Research is continuing on the stocks of<br />
herring in the south-west region to determine<br />
whether the recent low catch levels are a result<br />
of changes to environmental conditions or a<br />
reduction in the breeding stock leading to lowered<br />
recruitment, reduced fishing effort, or some<br />
combination of the above.<br />
PERCENTAGE<br />
100<br />
80<br />
60<br />
40<br />
20<br />
0<br />
86 82 82<br />
1995/96<br />
1996/97<br />
1997/98<br />
87<br />
1998/99<br />
77 74<br />
1999/00<br />
2000/01<br />
92 93 91 88 88<br />
2001/02<br />
2002/03<br />
2003/04<br />
YEAR<br />
2004/05<br />
2005/06<br />
79 77<br />
2006/07<br />
2007/08<br />
86 89<br />
2008/09<br />
2009/10<br />
142<br />
KPI Figure 1. the proportion (%) of commercial<br />
fisheries where breeding stocks of the<br />
major target species are both assessed<br />
and either adequate or recovering<br />
adequately to levels to ensure catches<br />
can be sustained at maximum levels<br />
within the range expected under typical<br />
environmental conditions.<br />
94<br />
2010/11
DISCLOSURES AND LEgAL COMPLIANCE � DETAILED kEy PERFORMANCE INDICA<strong>TO</strong>RS<br />
1.2 the proportion of commercial fisheries<br />
where acceptable catches (or effort levels)<br />
are achieved<br />
A target catch or effort range has been determined<br />
for each of the major commercial fisheries (see<br />
the ‘Stock Status and Catch Ranges for Major<br />
Commercial Fisheries’ section of the Annual Report)<br />
by the Department’s Research Division. This<br />
indicator provides an assessment of the success of<br />
the Department’s management plans and regulatory<br />
activities in keeping fish catches at appropriate<br />
levels (including those in a recovery phase). The<br />
Department’s 2010/11 Budget Papers state that<br />
the target is 90 per cent.<br />
For most of the fisheries in WA, each<br />
management plan seeks to directly control the<br />
amount of fishing effort applied to stocks, with the<br />
level of catch taken providing an indication of the<br />
effectiveness of the plan. Where the plan is operating<br />
effectively, the catch by the fishery should fall within<br />
a projected range. The extent of this range reflects<br />
the degree to which normal environmental variations<br />
affect the recruitment of juveniles to the stock<br />
which cannot be ‘controlled’ by the management<br />
plan. An additional consideration is that market<br />
conditions, fleet rationalisation or other factors may<br />
result in ongoing changes to the amount of effort<br />
expended in a fishery, which will in turn influence<br />
the appropriateness of acceptable catch ranges for<br />
certain fisheries.<br />
143<br />
For quota-managed fisheries, the measure<br />
of success for the management arrangements is<br />
firstly that the majority of the Total Allowable Catch<br />
(TAC) is achieved, but additionally that it has been<br />
possible to take this catch using an acceptable<br />
amount of fishing effort. If an unusually large<br />
expenditure of effort is needed to take the TAC, or<br />
the industry fails to achieve the TAC by a significant<br />
margin, this may indicate that the abundance of<br />
the stock is significantly lower than anticipated.<br />
For these reasons, an appropriate range of fishing<br />
effort to take the TAC has also been incorporated<br />
for assessing the performance of quota-managed<br />
fisheries (see the ‘Stock Status and Catch Ranges<br />
for Major Commercial Fisheries‘ section of the<br />
Annual Report).<br />
Comparisons between the actual catches (or<br />
effort) with the target ranges have been undertaken<br />
for 33 of the 38 fisheries referred to in the ‘Stock<br />
Status and Catch Ranges for Major Commercial<br />
Fisheries’ section – three more than in the previous<br />
year. The fisheries for which there are target ranges<br />
account for most of the commercial value of WA’s<br />
landed catch. For the mackerel and deep-sea<br />
crab fisheries, effort ranges are not yet available<br />
so catch ranges will continue to be used. This<br />
approach will also be used for the State’s pilchard<br />
(purse seine) fisheries as it may not be possible<br />
to determine meaningful effort ranges; the three<br />
south coast purse seine fisheries are now included
DISCLOSURES AND LEgAL COMPLIANCE � DETAILED kEy PERFORMANCE INDICA<strong>TO</strong>RS<br />
in this year’s comparisons because there has been<br />
increasing consistency in achieving significant<br />
catches.<br />
In the case of the Cockburn Sound Crab<br />
Fishery, the recent period of breeding stock recovery<br />
has led to a stock level adequate to allow some<br />
fishing to resume but it is too early for target ranges<br />
of catch and effort to be developed. Similarly the<br />
recent significant expansions in the Shark Bay Crab<br />
Fishery catch are not thought to pose a risk to the<br />
breeding stock but do indicate that a target catch<br />
range needs to be developed to ensure this remains<br />
the case. Finally, some fisheries had negligible<br />
fishing activity for economic reasons and were<br />
therefore not assessed.<br />
Of the 33 fisheries where ‘target ranges’<br />
were available and a material level of fishing<br />
was undertaken in 2009/10, 10 were catchquota<br />
managed [through a TAC allocated through<br />
Individually Transferable Quotas (ITQ)] with 23<br />
subject to effort control management.<br />
All of the ITQ-managed fisheries operated<br />
within their target effort/catch ranges or were<br />
acceptably below the effort range (Roe’s abalone,<br />
pearl oysters). In the 23 effort-controlled fisheries,<br />
21 produced catches that were within (16) or<br />
acceptably below (five) their target catch ranges.<br />
The two fisheries identified where the catch levels<br />
were considered to be unacceptably lower (one)<br />
or higher (one) than the target range were the<br />
144<br />
Pilbara Trawl Fishery and the Kimberley Gillnet and<br />
Barramundi Fishery respectively.<br />
Recent catches have been declining in the<br />
Pilbara Trawl Fishery and there are some questions<br />
whether this is due to reduced gear efficiencies<br />
following the introduction of protected species<br />
bycatch reduction devices. In the Kimberley<br />
Gillnet and Barramundi Fishery there has been a<br />
considerable increase in barramundi catch in recent<br />
years and it has yet to be determined whether this<br />
is sustainable.<br />
In summary, 31 (94 per cent) of the 33<br />
fisheries assessed were considered to have met<br />
their performance criteria, or were affected by<br />
factors outside the purview of the management<br />
plan/arrangements (Figure 2), which is above the<br />
target level.
DISCLOSURES AND LEgAL COMPLIANCE � DETAILED kEy PERFORMANCE INDICA<strong>TO</strong>RS<br />
PERCENTAGE<br />
100<br />
90<br />
80<br />
70<br />
60<br />
50<br />
40<br />
30<br />
20<br />
10<br />
0<br />
92 92 96<br />
1995/96<br />
1996/97<br />
87 91 89 91 89<br />
1997/98<br />
1998/99<br />
1999/00<br />
2000/01<br />
2001/02<br />
2002/03<br />
2003/04<br />
81 79 80 80<br />
2004/05<br />
YEAR<br />
96 96 93 94<br />
2005/06<br />
2006/07<br />
2007/08<br />
2008/09<br />
2009/10<br />
2010/11<br />
KPI Figure 2. the proportion (%) of commercial<br />
Figure 2<br />
fisheries where the catch or effort<br />
reported is acceptable relevant to the<br />
target management range being applied.<br />
1.3 the percentage of fisheries or fished sectors<br />
where current catch shares are known and<br />
where catch share allocations are in process<br />
or in place<br />
The primary object of the Fish Resources<br />
Management Act 1994 is ‘to conserve, develop<br />
and share the fish resources of the State for the<br />
benefit of present and future generations’. This<br />
indicator has been developed to allow reporting<br />
145<br />
on the ‘sharing’ of fish resources in Western<br />
Australia. In the context of this indicator, ‘sharing’<br />
means to allocate the fish resources of the State,<br />
within sustainability limits, on an equitable basis to<br />
various sectoral user groups.<br />
Previously, WA’s fish resources were shared<br />
mainly on an implicit basis, with no explicit<br />
setting of catch shares within an overall total<br />
allowable catch or corresponding total allowable<br />
effort. The Department is now implementing an<br />
Integrated Fisheries Management (IFM) approach<br />
where the aggregate effects of all fishing sectors<br />
are taken into account. This involves the use<br />
of a framework in which decisions on optimum<br />
resource use (i.e. allocation and re-allocation of<br />
fish resources) are determined and implemented<br />
within a total sustainable catch for each fishery or<br />
fished stock.<br />
IFM is being progressively phased in and it is<br />
likely to take some 10 years to bring the majority<br />
of the State’s shared fisheries under this new<br />
framework.<br />
The indicator is presented in two parts:<br />
• The percentage of fisheries or fished stocks<br />
for which current estimates of catch shares<br />
are available.<br />
• The percentage of those fisheries or fished<br />
stocks for which catch sharing allocations are<br />
in progress or in place.
DISCLOSURES AND LEgAL COMPLIANCE � DETAILED kEy PERFORMANCE INDICA<strong>TO</strong>RS<br />
The 65 per cent target in the Department’s<br />
2010/11 Budget Papers relates to the percentage<br />
of fisheries or fished stocks for which current<br />
estimates of catch shares are available. The<br />
2010/11 Budget Papers do not provide a target for<br />
the percentage of those fisheries or fished stocks<br />
for which catch sharing allocations are in progress<br />
or in place, but the Department has a target of 25<br />
per cent of catch sharing allocations in progress or<br />
in place by 2015.<br />
‘Fisheries or fished stocks’ can either be a<br />
managed fishery for a particular species (e.g. western<br />
rock lobster) or a spatially managed area of fishing<br />
activity encompassing a number of species (e.g. west<br />
coast estuaries). A ‘current estimate’ (of catch) is<br />
defined as being within the past five years (i.e. since<br />
2004/05). Finally, a ‘sharing allocation’ is defined as<br />
a percentage of a total allowable catch or effort.<br />
For the purposes of this indicator, 23 fisheries or<br />
stocks have been identified as having both a ‘material’<br />
commercial and recreational catch share. This is one<br />
more than last year, reflecting the re-opening of the<br />
Cockburn Sound Crab Fishery. Over time, the indicator<br />
may need to expand to include reference to fisheries<br />
or stocks for which there are other ‘material’ sectoral<br />
shares (e.g. customary fishing).<br />
The most recent catch share data used for<br />
the first part of the indicator will be reported in the<br />
Department’s State of the Fisheries and Aquatic<br />
Resources Report 2010/11. These shares are<br />
146<br />
currently based on commercial catch data and from<br />
the results of recreational surveys undertaken by<br />
the Department’s Research Division within the last<br />
five years.<br />
The Department has made no assessment<br />
of whether these current shares are optimal or<br />
equitable with regard to community benefit and it<br />
acknowledges that this indicator does not include<br />
shares allocated implicitly or otherwise to the<br />
conservation sector (via ‘no-take’ areas) or to other<br />
sectors (e.g. Indigenous).<br />
On this basis, the share of catch attributable<br />
to the commercial sector and the recreational<br />
sector for 2010/11 has been estimated for 14 of<br />
the 23 fisheries (61 per cent) (Figure 3).<br />
The second part of the indicator only relates to<br />
those fisheries expected to have both ongoing and<br />
significant commercial and recreational sectors into<br />
the future. For these fisheries, the IFM initiative will<br />
generate explicit allocations and/or re-allocations<br />
to specific sectors using a formal and structured<br />
allocation process. This process has already been<br />
completed for western rock lobster and metropolitan<br />
abalone fisheries, is currently underway for the<br />
West Coast Demersal Scalefish Fishery and the IFM<br />
process for the Gascoyne region has now also been<br />
initiated. The proportion of fisheries or fished stocks<br />
with formal share allocations should increase over<br />
time and we are on track to meet the 2015 target<br />
level of 25 per cent.
DISCLOSURES AND LEgAL COMPLIANCE � DETAILED kEy PERFORMANCE INDICA<strong>TO</strong>RS<br />
PERCENTAGE<br />
100%<br />
80%<br />
60%<br />
40%<br />
20%<br />
0%<br />
55%<br />
2001/02<br />
68%<br />
2002/03<br />
77%<br />
2003/04<br />
2004/05<br />
86% 86%<br />
2005/06<br />
Percentage of fisheries where<br />
catch share is known<br />
Percentage of fisheries where<br />
catch share allocation is in progress<br />
60%<br />
2006/07<br />
YEAR<br />
53%<br />
2007/08<br />
59%<br />
2008/09<br />
2009/10<br />
64% 61%<br />
2010/11<br />
KPI Figure 3. the proportion (%) of fisheries or<br />
fished stocks where estimates of catch<br />
shares are known and the proportion<br />
(%) of fisheries or fished stocks<br />
where catch sharing allocations are in<br />
progress or in place.<br />
Objective 2 – Maximise the economic Benefit<br />
to the State<br />
2.1 the contribution to the State’s gross value<br />
of output<br />
The Department seeks to manage the State’s<br />
fisheries in an economically, socially and<br />
environmentally sustainable manner. This<br />
performance indicator deals with the economic<br />
component of the ‘triple bottom line’ approach.<br />
147<br />
Sustainably managed commercial fisheries provide<br />
benefits to the State as a result of significant<br />
local sales and export earnings from fish and<br />
fish products. Commercial fisheries that are not<br />
managed sustainably will suffer a reduced value of<br />
production as less fish products will be available to<br />
the catching and marketing sectors.<br />
The value, at first point of sale, of the<br />
production from WA’s commercial and pearling/<br />
aquaculture sectors is published by the Australian<br />
Bureau of Agricultural and Resource Economics and<br />
Sciences (ABARES) annually, based on data supplied<br />
by industry to the Department’s Research Division.<br />
Information for the years 2007/08 to 2009/10 in<br />
broad groupings is provided in Table 1. The target is<br />
for production and value to be stable or increasing.<br />
The overall tonnage of commercially-caught<br />
crustaceans in 2009/10 was down compared<br />
to 2008/09, mainly reflecting the drop in lobster<br />
catch. The decline in production value was again<br />
exacerbated by the markets and the exchange rate<br />
affecting the value of the lobster, prawn and crab<br />
catches. Some improvements in lobster price helped<br />
to ameliorate the effects of the poor exchange rate.<br />
The production and value of the molluscan<br />
fisheries in 2009/10 were substantially lower than<br />
obtained in 2008/09. This was primarily due to low<br />
catches of scallops, especially in the Shark Bay<br />
scallop fishery, along with the effects of the poor<br />
exchange rate.
DISCLOSURES AND LEgAL COMPLIANCE � DETAILED kEy PERFORMANCE INDICA<strong>TO</strong>RS<br />
The finfish sector is comprised of a large<br />
number of fisheries and stocks. The annual<br />
production and value in 2009/10 decreased<br />
marginally from that in 2008/09, with a value of<br />
$31 million.<br />
The value of pearl production rose<br />
significantly in 2009/10 and is likely to be a result<br />
of improved marketing returns to the industry,<br />
despite a continuing unfavourable global economic<br />
climate. The production level and value of nonpearl<br />
aquaculture for 2009/10 were essentially<br />
unchanged from the previous year.<br />
In summary, due to the combination of a drop<br />
in the overall tonnage of production in 2009/10<br />
and the lower global economic status of some<br />
commodities, the total value of WA fisheries was<br />
lower at $367 million compared to $394 million<br />
in 2008/09. The WA commercial fishing sector<br />
continues to be affected by a combination of<br />
significant external influences on market values<br />
and from the impacts of natural fluctuations in the<br />
abundances of key species.<br />
148<br />
KPI table 1. Western Australian fisheries production<br />
– years 2007/08 to 2009/10<br />
2007/08(e) 2008/09 (e) 2009/10 (f)<br />
tonnes $ m tonnes $ m tonnes $ m<br />
Crustaceans 12,615 250 11,074 224 9,999 219<br />
Molluscs 5,520 41 3,918 37 3,055 21<br />
Fish 10,153 34 10,159 32 9,944 31<br />
Other (a) n/a n/a 160 0.5 171 0.5<br />
Pearling (b, c) n/a 113 n/a 90 n/a 99<br />
Aquaculture (d) 1,013 10 1,017 10 1,107 10<br />
<strong>TO</strong>TAL PRODUCTION 29,301 448 26,328 394 24,276 380<br />
Footnotes:<br />
(a) Miscellaneous invertebrates, e.g. beche-de-mer and sea<br />
urchins, previously reported under molluscs.<br />
(b) Pearl oyster products other than pearls are included under<br />
molluscs.<br />
(c) Method of estimating the value of pearl production has been<br />
updated.<br />
(d) Excludes hatchery production and algae production for beta<br />
carotene.<br />
(e) Figures have not been adjusted to account for late production<br />
returns and validation of databases, so may differ slightly from<br />
values published elsewhere.<br />
(f) Figures current as at end of financial year.<br />
n/a Not applicable.<br />
Tonnage values are calculated from the Catch and Effort<br />
Statistics (CAES) data supplied by fishers on a monthly/trip<br />
basis, or quota returns supplied on a daily basis. The market<br />
values (except pearls) are obtained from surveys of the main<br />
seafood purchasers/processors.<br />
Sources: Australian Bureau of Agricultural and Resource<br />
Economics and Sciences (ABARES); Department of<br />
Fisheries, Western Australia.
DISCLOSURES AND LEgAL COMPLIANCE � DETAILED kEy PERFORMANCE INDICA<strong>TO</strong>RS<br />
Objective 3 – Maximise the Social Benefit to<br />
the State<br />
The Department seeks to manage the State’s<br />
fisheries in an economically, social and<br />
environmentally sustainable manner. This<br />
performance indicator deals with the social<br />
component of the ‘triple bottom line’ approach.<br />
Sustainably managed fisheries and aquatic<br />
environments provide benefits to the State by<br />
providing a range of recreational opportunities and<br />
experiences to the community from snorkelling and<br />
just looking at fish in their natural environment to<br />
‘catching a feed’ for the family.<br />
Information for performance indicators 3.1 to<br />
3.3 was derived from a survey to assess the level of<br />
success of the Department of Fisheries’ activities and<br />
functions within the Western Australian community.<br />
The objectives of the survey were to:<br />
• Assess the level of recall and awareness of<br />
the Department of Fisheries’ information and<br />
promotional activities.<br />
• Assess the understanding and support of the<br />
community for the Department of Fisheries’<br />
management strategies across all four<br />
programs (Commercial Fisheries, Recreational<br />
Fisheries, Pearling and Aquaculture, and Fish<br />
and Fish Habitat Protection).<br />
• Examine key aspects of community fishing and<br />
marine habitat appreciation.<br />
149<br />
The survey was conducted by telephone during<br />
June 2011. The telephone numbers were randomly<br />
selected from the white pages. Respondents were<br />
males and females older than 17 years residing<br />
in Western Australia. The total sample of 702<br />
interviews comprised:<br />
• 509 from Major Cities.<br />
• 84 from Inner Regional.<br />
• 109 from Outer Regional/Remote/Very<br />
Remote/Migratory.<br />
Roy Morgan Research conducted the fieldwork<br />
to collect data from the community. The<br />
Stock Assessment and Data Analysis Branch<br />
of the Western Australian Fisheries and Marine<br />
Research Laboratories performed the analyses of<br />
the survey data.<br />
3.1 the participation rate in recreational fisheries<br />
The Department’s 2010/11 Budget Papers<br />
provide for a participation rate in recreational<br />
fisheries of 33 per cent.<br />
The number of people in Western Australia<br />
who went recreational fishing at least once in the<br />
previous 12-month period was 594,000. This was<br />
estimated as 32 per cent of the State’s population<br />
older than four years of age (using Australian<br />
Bureau of Statistics population estimates from<br />
the 2006 census). This compares with an actual<br />
participation rate of 32 per cent in 2009/10 and 33<br />
per cent in 2008/09 (Figure 4).
DISCLOSURES AND LEgAL COMPLIANCE � DETAILED kEy PERFORMANCE INDICA<strong>TO</strong>RS<br />
The improved response rates (calculated as<br />
percentage of contacts that resulted in a completed<br />
interview) of about 20 per cent achieved since<br />
2007/08 has provided a less biased estimate of<br />
the participation rate than for some earlier years.<br />
KPI Figure 4. Participation rate in recreational<br />
fisheries 2001/2002 – 2010/2011<br />
PERCENTAGE<br />
50<br />
40<br />
30<br />
20<br />
10<br />
0<br />
2001/2002<br />
34<br />
2002/2003<br />
35<br />
2003/2004<br />
31 31<br />
2004/2005<br />
2005/2006<br />
46<br />
2006/2007<br />
YEAR<br />
26<br />
2007/2008<br />
31<br />
2008/2009<br />
33<br />
2009/2010<br />
32<br />
2010/2011<br />
days fished<br />
The median number of days fished by recreational<br />
fishers in the last twelve months was five days<br />
(Figure 5). The median number of days fished was<br />
six in 2009/10 and seven in 2008/09.<br />
32<br />
KPI Figure 5. Median number of days fished<br />
by recreational fishers<br />
2001/02 – 2010/11<br />
DAYS FISHED<br />
12<br />
10<br />
8<br />
6<br />
4<br />
2<br />
0<br />
2001/2002<br />
6<br />
2002/2003<br />
7<br />
2003/2004<br />
6<br />
2004/2005<br />
3<br />
2005/2006<br />
10<br />
2006/2007<br />
YEAR<br />
7 7 7<br />
2007/2008<br />
2008/2009<br />
2009/2010<br />
6<br />
2010/2011<br />
5<br />
150<br />
The number of days fished by recreational<br />
fishers in the last twelve months ranges from one<br />
to 180 days. The mean number of days fishing was<br />
13 days. Most (52 per cent) recreational fishers<br />
in Western Australia fished between one and five<br />
days with the median number of days in 2010/11<br />
reducing to 5 (Figure 5). However, some fished for<br />
considerably more days giving a skewed frequency<br />
distribution (Figure 6).
DISCLOSURES AND LEgAL COMPLIANCE � DETAILED kEy PERFORMANCE INDICA<strong>TO</strong>RS<br />
KPI Figure 6. Distribution for number of days fished<br />
by recreational fishers<br />
PERCENTAGE<br />
60<br />
50<br />
40<br />
30<br />
20<br />
10<br />
0<br />
1 to 5<br />
52<br />
6 to 10<br />
13<br />
11 to 15<br />
9<br />
16 to 20<br />
8<br />
21 to 25<br />
5<br />
26 to 30<br />
NUMBER <strong>OF</strong> DAYS<br />
3 2 2<br />
31 to 35<br />
36 to 40<br />
41 to 50<br />
The Perth Metropolitan area from Yanchep<br />
to Mandurah was most popular for recreational<br />
fishing with 36 per cent of effort. Other areas that<br />
people fished were West Coast other than the<br />
Perth Metropolitan area (28 per cent), South Coast<br />
– Marine (18 per cent), South Coast – Freshwater<br />
(seven per cent), Gascoyne (five per cent), Pilbara/<br />
Kimberley – Marine (five per cent), and Pilbara/<br />
Kimberley – Freshwater (one per cent).<br />
3.2 Satisfaction index for persons participating in<br />
recreational fishing.<br />
This performance indicator measures the<br />
effectiveness of the Department’s recreational<br />
fisheries management strategies, by seeking to<br />
gauge the level of awareness in the community<br />
3<br />
> 50<br />
4<br />
151<br />
about recreational fishing rules and the need for<br />
management – including measures such as closed<br />
seasons, bag limits, size limits, licence fees – to<br />
ensure that there are ‘fish for the future’.<br />
An overall satisfaction scoring model or index<br />
has been developed to measure and track the<br />
satisfaction of recreational fishers.<br />
The satisfaction index is a combination<br />
of knowledge of management measures and<br />
confidence.<br />
Management = the level of the person’s<br />
awareness of rules and<br />
regulations.<br />
Confidence = the level of the person’s<br />
satisfaction with the number,<br />
size and variety of fish<br />
caught on their last trip and<br />
satisfaction with the overall<br />
fishing trip.<br />
The above criteria were rated by each<br />
respondent on a scale of one to four, and then<br />
amalgamated to provide the satisfaction index.<br />
The satisfaction index for recreational fishing<br />
was 78.0 per cent with a 95 per cent confidence<br />
interval between 76.2 per cent and 79.7 per cent<br />
(Figure 7). The satisfaction index is marginally<br />
lower than the value of 81.6 per cent for 2009/10<br />
which is consistent with the long-term trend for the<br />
satisfaction index to be around 80 per cent.
DISCLOSURES AND LEgAL COMPLIANCE � DETAILED kEy PERFORMANCE INDICA<strong>TO</strong>RS<br />
KPI Figure 7. Satisfaction index for persons<br />
participating in recreational fishing<br />
2001/02 – 2010/11<br />
PERCENTAGE<br />
100<br />
90<br />
80<br />
70<br />
60<br />
50<br />
40<br />
30<br />
20<br />
10<br />
0<br />
2001/2002<br />
76<br />
2002/2003<br />
79<br />
2003/2004<br />
81<br />
2004/2005<br />
75<br />
2005/2006<br />
77<br />
2006/2007<br />
YEAR<br />
81<br />
2007/2008<br />
79<br />
2008/2009<br />
77<br />
2009/2010<br />
82<br />
2010/2011<br />
3.3 Satisfaction rating of the broader community<br />
and stakeholders as to their perceptions<br />
of the extent to which the department of<br />
fisheries is achieving sustainable fisheries<br />
management objectives.<br />
The Department of Fisheries was given a<br />
satisfaction rate of 80.7 per cent by the Western<br />
Australian public across its four service areas<br />
of commercial fishing, recreational fishing, fish<br />
and fish habitat protection, and aquaculture and<br />
pearling. The 95 per cent confidence interval for<br />
the satisfaction rate given by the community was<br />
77.9 per cent to 83.4 per cent. Only respondents<br />
that were aware the Department of Fisheries was<br />
78<br />
152<br />
responsible for a service area were asked to rate<br />
the Department’s performance for that service area.<br />
The satisfaction rating for this financial year is<br />
slightly higher than the rate of 74.8 per cent estimated<br />
for 2009/10 (Figure 8). The satisfaction ratings by the<br />
community for the Department continues to remain<br />
between about 75 and 85 per cent.<br />
Every second year an additional survey<br />
is conducted to measure the satisfaction of<br />
Department of Fisheries by its main stakeholders.<br />
The 2010/11 survey comprised 152 interviews<br />
with representatives from commercial fisheries,<br />
recreational fisheries, fish and fish habitat<br />
protection, and aquaculture and pearling. The<br />
Department of Fisheries was given an overall<br />
satisfaction rating of 67.4 per cent by these<br />
stakeholder groups (Figure 8). This satisfaction rate<br />
is not different than the value of 65.1 per cent from<br />
the 2008 stakeholder survey (Baharthah, 2009).<br />
The longer-term trend is for this index to lie between<br />
65 and 75 per cent.
DISCLOSURES AND LEgAL COMPLIANCE � DETAILED kEy PERFORMANCE INDICA<strong>TO</strong>RS<br />
KPI Figure 8. Satisfaction rating of the broader<br />
community and the Department’s<br />
stakeholders 2001/02 – 2010/11<br />
PERCENTAGE<br />
100<br />
90<br />
80<br />
70<br />
60<br />
50<br />
40<br />
30<br />
20<br />
10<br />
0<br />
81<br />
2001/2002<br />
2002/2003<br />
83 84 84<br />
68<br />
2003/2004<br />
2004/2005<br />
74<br />
66<br />
2005/2006<br />
82<br />
2006/2007<br />
YEAR<br />
72<br />
79<br />
2007/2008<br />
81<br />
2008/2009<br />
65<br />
Community<br />
Stakeholders<br />
81<br />
75<br />
2009/2010<br />
2010/2011<br />
efficiency Indicators<br />
The Department’s efficiency indicators have been<br />
calculated by dividing the total service cost in<br />
a functional area by the hours delivered in that<br />
functional area.<br />
The measures enable analysis of variance in<br />
costs from year-to-year and provide a benchmark for<br />
comparison against like service delivery.<br />
The reported hourly cost includes a<br />
component to cover fixed indirect costs.<br />
In calculating the efficiency indicator targets,<br />
it is assumed that the Department will operate at<br />
full capacity (i.e. all positions occupied) for the full<br />
year. This is not normally the case and consequently<br />
67<br />
153<br />
the target cost per hour is normally less than the<br />
actual cost. This fact is demonstrated in the closer<br />
alignment between the actual results from one year<br />
to the next.<br />
Explanations for those variances greater than<br />
10 per cent have been included within each service.<br />
Outcome: Conservation and sustainable<br />
development of the State’s fish resources<br />
Service 1: fisheries management<br />
Service Description: Fisheries management includes<br />
licensing, the development of policy and procedural<br />
frameworks for the management of the State’s<br />
fisheries, aquaculture and the aquatic environment<br />
including legislation and management plans,<br />
consultation with fishing industry stakeholders and<br />
the community.<br />
Efficiency in Service 1 is described as the<br />
average cost per hour for services delivered<br />
excluding payments for grants and fisheries<br />
adjustment schemes.<br />
KPI table 2. Service 1<br />
Service 1 Fisheries Actual Target Actual Variance Variance<br />
Management<br />
Average cost<br />
2009/10 2010/11 2010/11 Actual Target<br />
per hour of<br />
management<br />
(excluding grants<br />
and fisheries<br />
adjustments)<br />
$117 $109 $152 $35 $43
DISCLOSURES AND LEgAL COMPLIANCE � DETAILED kEy PERFORMANCE INDICA<strong>TO</strong>RS<br />
explanation of Significant Variances<br />
The budget hourly rate is set on the basis that full<br />
staffing levels are maintained during the year. As<br />
vacancies will invariably occur, the budget amount<br />
will in most cases be less than the actuals in any<br />
year. The 2010/11 actual hourly rate has been<br />
impacted by additional employee-related costs that<br />
resulted from a reduction in the minimum service<br />
period required to recognise long service leave<br />
liability. In addition, significant non salary-related<br />
costs were incurred in transitioning the West Coast<br />
Rock Lobster Fishery to quota and the start-up<br />
costs associated with implementing a biosecurity<br />
(marine pests) program.<br />
Service 2: compliance and education<br />
Service Description: Through the compliance and<br />
education service the Department raises community<br />
awareness and understanding of fisheries and<br />
aquatic management issues and the need to adhere<br />
to the rules governing these activities. This service<br />
enforces fishing rules and also plans and instigates<br />
investigations and enforcement strategies.<br />
Efficiency in Service 2 is described as the<br />
average cost per hour for services delivered as<br />
outlined in the following table.<br />
KPI table 3. Service 2<br />
Service 2<br />
Compliance<br />
and Education<br />
Average cost<br />
per hour of<br />
compliance<br />
and education.<br />
Actual<br />
2009/10<br />
Target<br />
2010/11<br />
Actual<br />
2010/11<br />
Variance<br />
Actual<br />
154<br />
Variance<br />
Target<br />
$164 $134 $186 $22 $52<br />
explanation of Significant Variances<br />
The budget hourly rate is set on the basis<br />
year. As vacancies will invariably occur, the budget<br />
amount will in most cases be less than the actuals<br />
in any year. The 2010/11 actual hourly rate has<br />
been significantly impacted by reduced number of<br />
hours delivered and additional employee-related<br />
costs that resulted from a reduction in the minimum<br />
service period required to recognise long service<br />
leave liability. In addition a significant increase in<br />
depreciation expense has impacted on this service<br />
in 2010/11.<br />
Service 3: research and monitoring<br />
Service Description: The research and monitoring<br />
service provides scientific knowledge for the<br />
sustainable management of the State’s fisheries<br />
and aquatic resources and the associated<br />
environment.<br />
Efficiency in Service 3 is described as the<br />
average cost per hour for services delivered as<br />
outlined in the following table.
DISCLOSURES AND LEgAL COMPLIANCE � DETAILED kEy PERFORMANCE INDICA<strong>TO</strong>RS<br />
KPI table 4. Service 3<br />
Service 3<br />
Research and<br />
Monitoring<br />
Average cost<br />
per hour of<br />
research and<br />
monitoring<br />
Actual<br />
2009/10<br />
Target<br />
2010/11<br />
Actual<br />
2010/11<br />
Variance<br />
Actual<br />
Variance<br />
Target<br />
$118 $116 $126 $8 $10<br />
explanation of Significant Variances<br />
The budget hourly rate is set on the basis that full<br />
staffing levels are maintained during the year. As<br />
vacancies will invariably occur, the budget amount<br />
will in most cases be less than the actuals in any<br />
year. The 2010/11 actual hourly rate has been<br />
impacted by additional employee-related costs that<br />
resulted from a reduction in the minimum service<br />
period required to recognise long service leave<br />
liability. In addition significant non salary-related<br />
costs were incurred for recreational surveys.<br />
Service 4: marine Safety<br />
Service Description: The marine safety service is<br />
delivered on behalf of the Department of Transport.<br />
This service includes checks by Fisheries and<br />
Marine Officers of recreational boats to ensure<br />
compliance with the safety requirements.<br />
Efficiency in Service 4 is described as the<br />
average cost per hour for services delivered as<br />
outlined in the following table.<br />
KPI table 5. Service 4<br />
Service 4<br />
Marine Safety<br />
Average cost<br />
per hour for<br />
delivery of<br />
marine safety<br />
services<br />
Actual Target Actual Variance<br />
2009/10 2010/11 2010/11 Actual<br />
155<br />
Variance<br />
Target<br />
$143 $116 $134 ($11) $18<br />
explanation of Significant Variances<br />
The budget hourly rate is set on the basis that full<br />
staffing levels are maintained during the year. As<br />
vacancies will invariably occur, the budget amount will<br />
in most cases be less than the actuals in any year.<br />
The 2010/11 actual hourly rate when compared to<br />
budget hourly rate has been impacted by additional<br />
employee-related costs that resulted from a reduction<br />
in the minimum service period required to recognise<br />
long service leave liability and a significant reduction<br />
in the level of services delivered. The 2010/11<br />
actual has reduced compared to the 2009/2010<br />
actual, as the reduced service delivery in this area<br />
in 2010/11 has resulted in a reduction in the non<br />
salary-related expenses.
DISCLOSURES AND LEgAL COMPLIANCE � O<strong>THE</strong>R LEgAL REqUIREMENTS<br />
Other Legal Requirements<br />
Advertising<br />
In compliance with section 175ZE of the Electoral<br />
Act 1907, the Department of Fisheries is required to<br />
report on expenditure incurred during the financial year<br />
in relation to advertising agencies, market research<br />
organisations, polling organisations, direct mail<br />
organisations and media advertising organisations.<br />
The details of the report are as follows:<br />
Expenditure with advertising agency – Adcorp $86,092.61<br />
Expenditure with market research agencies $0.00<br />
Expenditure with polling agencies $0.00<br />
Expenditure with direct mail agencies $0.00<br />
Expenditure with media advertising agencies –<br />
Media Decisions<br />
$181.82<br />
<strong>TO</strong>TAL EXPENDITURE $86,274.43<br />
disability Access and Inclusion Plan<br />
Through its Disability Access and Inclusion Plan, the<br />
Department of Fisheries is committed to delivering<br />
services for people with disabilities. The Disability<br />
Access and Inclusion Plan ensures equal access<br />
to the Department’s services that include fisheries<br />
management, compliance and education, research<br />
and monitoring, and marine safety.<br />
156<br />
The Disability Access and Inclusion Plan<br />
ensures that people with disabilities:<br />
• Have the same opportunities as other people<br />
to access the services of, and any events<br />
organised by, the Department of Fisheries.<br />
• Have the same opportunities as other people<br />
to access the buildings and other facilities of<br />
the Department.<br />
• Receive information from the Department in a<br />
format that will allow ready access to it.<br />
• Receive the same level and quality of service<br />
from the Department.<br />
• Have the same opportunities as other people<br />
to make complaints to the Department.<br />
• Have the same opportunities as other people<br />
to participate in any public consultation by the<br />
Department.<br />
The Disability Access and Inclusion Plan<br />
identifies six outcomes for the Department of<br />
Fisheries to achieve:
DISCLOSURES AND LEgAL COMPLIANCE � O<strong>THE</strong>R LEgAL REqUIREMENTS<br />
outcome 1<br />
The Department is committed to ensuring<br />
all events are planned using the Accessible<br />
Events Checklist, which is available on the<br />
Department’s Intranet.<br />
The Department has developed standard<br />
wording for all information bulletins and event<br />
invitations, to enable attendees to indicate the<br />
nature of any access requirements they have.<br />
outcome 2<br />
The Department has undergone ongoing audits<br />
to identify any access barriers to its premises.<br />
outcome 3<br />
The new redevelopment of the Department’<br />
of Fisheries main website will ensure<br />
compliance with the WA Government’s<br />
Website Governance Framework including its<br />
accessibility and recordkeeping requirements<br />
(including W3C, WCAG, and the Records<br />
Keeping Act). The Department continues to be<br />
committed to improving community awareness<br />
of departmental information by making it<br />
available in alternative forms.<br />
outcome 4<br />
The Department is committed to improving<br />
staff awareness of disability and access<br />
issues with the aim of providing improved<br />
service delivery.<br />
outcome 5<br />
157<br />
The Department is committed to ensuring that<br />
current complaints, policies and procedures<br />
are accessible to people with disabilities.<br />
outcome 6<br />
The Department monitors the progress of<br />
its Disability Access and Inclusion Plan.<br />
The Department will continue to progress<br />
improvements in its delivery of services and,<br />
in particular, to the special needs of those with<br />
a disability.<br />
The Department also supports the<br />
fishing workshops for the disabled operated<br />
by the Fishers with Disabilities Association<br />
Incorporated and provides a grant to assist<br />
the association meet its administration and<br />
insurance costs.<br />
In addition to initiating the fishing<br />
workshops program for Fishers with Disabilities<br />
several years ago through its volunteer<br />
program, the Department of Fisheries<br />
contributes several members of staff to the<br />
board of the association. The Department<br />
allows these board members to attend board<br />
meetings and conduct association-related<br />
business during working hours while employed
DISCLOSURES AND LEgAL COMPLIANCE � O<strong>THE</strong>R LEgAL REqUIREMENTS<br />
by the Department. The Department has<br />
also similarly supported employees who have<br />
volunteered to assist in conducting fishing<br />
workshops operated by the association.<br />
human resources management<br />
Standards and ethical codes<br />
The Department of Fisheries’ Human Resource<br />
Management policies are written to support the<br />
achievement of its human resources strategy and<br />
to comply with the Human Resource Management<br />
Standards for Western Australia’s public sector.<br />
All human resource policies, including the<br />
Conduct and Behaviour Guide, are available to staff<br />
via the Department’s Intranet. The Department<br />
continues to have very low numbers of claims<br />
relating to breaches of standards and ethical codes.<br />
The Conduct and Behaviour Guide has<br />
been reviewed and discussed at visits by human<br />
resources staff to all regional centres. Completion<br />
rates for the online training course continue to<br />
improve.<br />
For 2010/11 the Department reported the<br />
following compliance issues:<br />
Compliance issues Reported for 2010/11<br />
Public Sector Standards<br />
in Human Resource<br />
Management Breach Claims<br />
Non-compliance with the WA<br />
Code of Ethics<br />
Allegations of Misconduct<br />
under the Disciplinary<br />
provisions of the Public<br />
Sector Management Act<br />
1994<br />
158<br />
One claim against the Recruitment,<br />
Selection and Appointment Standard<br />
was received in 2010/11 but is not<br />
yet resolved.<br />
No reports of non-compliance with<br />
the Code of Ethics were submitted.<br />
Two cases were reported within the<br />
2010/11 year, but no breaches of<br />
discipline were found.<br />
No cases remain to be carried<br />
forward to 2011/12.<br />
compliance with relevant written laws<br />
enabling Legislation<br />
The Department of Fisheries is established under<br />
Section 35 of the Public Sector Management Act 1994.<br />
Legislation Administered<br />
The Department of Fisheries assists the Minister in<br />
the administration of legislation under five State Acts<br />
of Parliament (see the ‘Profile of the Department of<br />
Fisheries’ section of this Annual Report).<br />
The Department also manages the majority<br />
of fishing adjacent to Western Australia in the<br />
Australian Fishing Zone under the provisions of<br />
Part 5 of the Fisheries Management Act 1991 of the<br />
Commonwealth and Part 3 of the Fish Resources<br />
Management Act 1994.
DISCLOSURES AND LEgAL COMPLIANCE � O<strong>THE</strong>R LEgAL REqUIREMENTS<br />
Legislation Affecting Department Outcomes<br />
In the performance of its functions, the Department<br />
of Fisheries complies with the following relevant<br />
written laws:<br />
• Animal Welfare Act 2002<br />
• Auditor General Act 2006<br />
• Conservation and Land Management Act 1984<br />
• Corruption and Crime Commission Act 2003<br />
• Credit Act 1984<br />
• Disability Services Act 1993<br />
• Electronic Transactions Act 2003<br />
• Environmental Protection Act 1986<br />
• Environment Protection and Biodiversity<br />
Conservation Act 1999<br />
• Equal Opportunity Act 1984<br />
• Financial Management Act 2006<br />
• Firearms Act 1973<br />
• Freedom of Information Act 1992<br />
• Government Employees’ Housing Act 1964<br />
• Government Financial Responsibility Act 2000<br />
• Industrial Relations Act 1979<br />
• Minimum Conditions of Employment Act 1993<br />
• New Tax System (Goods and Services Tax) Act<br />
1999<br />
• Occupational Safety and Health Act 1984<br />
• Occupiers Liability Act 1985<br />
• Public and Bank Holidays Act 1972<br />
• Public Interest Disclosures Act 2003<br />
• Public Sector Management Act 1994<br />
• Salaries and Allowances Act 1975<br />
• Spent Convictions Act 1988<br />
• State Administrative Tribunal Act 2004<br />
• State Records Act 2000<br />
• State Superannuation Act 2000<br />
• State Supply Commission Act 1991<br />
• State Trading Concerns Act 1916<br />
• Trade Practices Act 1974<br />
• Volunteers and Food and Other Donors<br />
(Protection from Liability) Act 2002<br />
• Western Australian Marine Act 1982<br />
• Wildlife Conservation Act 1950<br />
159<br />
• Working with Children (Criminal Record<br />
Checking) Act 2004.<br />
Numerous other State and Federal laws also<br />
affect the Department’s activities. These are listed<br />
in Appendix 3.
DISCLOSURES AND LEgAL COMPLIANCE � O<strong>THE</strong>R LEgAL REqUIREMENTS<br />
reporting on record Keeping Plans<br />
(State Records Act 2000, Section 61 and State<br />
Records Commission Standards, Standard 2,<br />
Principle 6)<br />
The Department of Fisheries is committed<br />
to the development and implementation of good<br />
record keeping practices and meeting our legislative<br />
requirements of the State Records Act 2000 and the<br />
State Records Commission Standard 2, Principle 6.<br />
In accordance with section 28 of the State<br />
Records Act 2000 and the expiry of the 2008<br />
Recordkeeping Plan, the Department was required<br />
to review and submit its amended Recordkeeping<br />
Plan in 2011. The plan was formally submitted to<br />
the State Records Commission for approval and<br />
approved in April 2011. The approved recordkeeping<br />
plan, with actions and deliverables, will help the<br />
Department to achieve its recordkeeping goals and<br />
is effective until April 2016.<br />
The Department’s functional Retention and<br />
Disposal schedule requires amendment and<br />
submission to the State Records Commission for<br />
approval during financial year 2011/12.<br />
The Department is currently operating in a<br />
paper-based environment that has been recently<br />
reviewed. As a consequence of this review, it was<br />
decided that the effectiveness and efficiency of the<br />
Department’s record keeping system needed to<br />
be overhauled. The Corporate Information section<br />
is making progress to develop, and will ultimately<br />
160<br />
implement, an Electronic Document and Records<br />
Management System (EDRMS), inclusive of a<br />
Business Classification scheme. The creation and<br />
appointment of the position of Chief Information<br />
Officer to support this initiative should see an<br />
EDRMS delivered in the 2012/13 financial year.<br />
Following a review of the Department’s record<br />
keeping training program, a new program was<br />
developed in 2010/11. The new program covers<br />
essential information specific to the Authority’s<br />
Record Keeping Plan, records management policies,<br />
business processes and information management<br />
initiatives. Approximately 90 per cent of current<br />
staff have completed and passed the online Record<br />
Keeping Awareness Training Course.<br />
As part of their induction, new staff members<br />
are required to complete the training within two<br />
weeks of commencing at the Department of<br />
Fisheries. In addition, new staff members are<br />
provided with one-on-one training by Corporate<br />
Information staff that includes an introduction to the<br />
record keeping practices at the Department.<br />
Public Interest disclosures<br />
(Public Interest Disclosures Act 2003, S23 (1) (f))<br />
The Public Interest Disclosure Act 2003 came<br />
into effect on 1 July 2003, requiring the Department<br />
of Fisheries to:<br />
• Facilitate the disclosure of public interest<br />
information.
DISCLOSURES AND LEgAL COMPLIANCE � O<strong>THE</strong>R LEgAL REqUIREMENTS<br />
• Provide protection for those who make<br />
disclosures.<br />
• Provide protection for those who are the<br />
subject of a disclosure.<br />
In accordance with the Act, the Department<br />
has duly appointed Public Interest Disclosure<br />
Officers and has published internal policies and<br />
procedures related to its obligations.<br />
Nil public interest disclosures were received<br />
during 2010/11.<br />
161
DISCLOSURES AND LEgAL COMPLIANCE � gOvERNMENT POLICy REqUIREMENTS<br />
Government Policy Requirements<br />
Substantive equality<br />
Since 2006 the principles of Substantive Equality<br />
have been adopted by the Department of Fisheries<br />
through the development of an Aboriginal Fishing<br />
Strategy and the adoption of a Customary Fishing<br />
Policy.<br />
The Department has also met its Substantive<br />
Equality responsibilities with the production of<br />
recreational fishing information written in the<br />
Vietnamese language. An example includes<br />
Crabbing for Blue Swimmer Crab Stocks in the<br />
West Coast Region that is currently posted on the<br />
Department’s website.<br />
The Department has identified that the next<br />
stage of the priority service area will be a Needs<br />
and Impact Assessment regarding the licensing of<br />
aquatic charter activities of Aboriginal and minority<br />
ethnic groups. A preliminary scoping document was<br />
developed during 2009/10 outlining the background<br />
to current management arrangements for Aboriginal<br />
fishing tour operators. The Needs and Impact<br />
Assessment work will be undertaken as part of the<br />
162<br />
overall review of the aquatic charter industry that is<br />
due to be completed by the end of 2011.<br />
Public Sector compliance and<br />
ethical codes<br />
The Department of Fisheries’ Human Resource<br />
Management (HRM) policies are written to support<br />
the achievement of its HR strategy and to comply<br />
with the HRM standards for WA’s public sector. All<br />
HR policies, including the Conduct and Behaviour<br />
Guide, are available to staff via the Department’s<br />
Intranet. The Department continues to have very<br />
low numbers of claims relating to breaches of<br />
standards and ethical codes.<br />
The Conduct and Behaviour Guide has been<br />
promoted and discussed at visits by HR staff to all<br />
regional centres and completion rates for the online<br />
training course continue to improve.
DISCLOSURES AND LEgAL COMPLIANCE � gOvERNMENT POLICy REqUIREMENTS<br />
For 2010/11 the Department reports the<br />
following compliance issues:<br />
compliance issues reported for 2010/11<br />
Public Sector Standards in<br />
Human Resource Management<br />
Breach Claims<br />
Non-compliance with the WA<br />
Code of Ethics<br />
Allegations of Misconduct<br />
under the Disciplinary<br />
provisions of the Public Sector<br />
Management Act 1994<br />
One claim against the Recruitment,<br />
Selection and Appointment Standard<br />
was received in 2010/11.<br />
No reports of non-compliance with<br />
the Code of Ethics were submitted<br />
Two cases were reported and<br />
finalised within the 2010/11 year<br />
however no breaches of discipline<br />
were found.<br />
occupational Safety and health and<br />
Injury management<br />
The Department of Fisheries is committed to<br />
ensuring the health, safety and welfare of all its<br />
employees and others who may be affected by<br />
its operational activities. The Department aims<br />
to engage in ‘best practice’ safety and health<br />
management practices, including education, training,<br />
reporting and accountability. The Occupational Safety<br />
and Health (OSH) Committee meets bi-monthly and<br />
comprises regional and metropolitan representatives.<br />
Safety and Health issues can be raised with these<br />
representatives through the Department’s Hazard<br />
Accident Incident Report (HAIR) process.<br />
To ensure employees are kept informed about<br />
OSH matters, the Intranet is regularly updated and<br />
the OSH bulletin is distributed to all staff following<br />
each OSH committee meeting.<br />
163<br />
Several achievements in the area of<br />
Occupational Safety and Health in 2010/11 are<br />
worthy of note including:<br />
• Pia Carter, a Fisheries Management Officer<br />
based in the Northern Region, was nominated<br />
and won a Work Safety Award in the category<br />
of ‘Best individual contribution to safety and<br />
health (a) No Formal OSH Responsibilities’ for<br />
her work in improving safe work practices at<br />
the Broome Aquaculture Park.<br />
• Corporate Health Expos were held in Perth,<br />
Hillarys and Broome. Participants were<br />
provided with a broad range of health and<br />
wellness information and were able to<br />
participate in some basic health checks and<br />
fitness assessments. More Expos are planned<br />
for regional offices in 2011/12.<br />
• Establishment of a Suicide Prevention and<br />
Awareness working group that will lead<br />
implementation of a Suicide Prevention<br />
Strategy in support of the Government Plan for<br />
2009 – 2013.
DISCLOSURES AND LEgAL COMPLIANCE � gOvERNMENT POLICy REqUIREMENTS<br />
table 25. Occupational Safety and Health and Injury Management Performance against Key Indicators<br />
measure<br />
Actual results<br />
2009/10 2010/11*<br />
results Against target<br />
target comments<br />
Number of fatalities Zero Zero Zero Target achieved<br />
Lost time injury/disease (LTI/D)<br />
incidence rate<br />
1 1.2 Zero or 10%<br />
reduction on previous<br />
year<br />
Lost time injury severity rate 25 40 Zero or 10%<br />
improvement on<br />
previous year<br />
Percentage of injured workers<br />
returned to work within 28<br />
weeks<br />
Percentage of managers<br />
trained in occupational safety,<br />
health and injury management<br />
responsibilities<br />
75% 60% Actual percentage<br />
results to be reported<br />
20% 32% Greater than or equal<br />
to 50%<br />
The Department had five lost time injuries for the year<br />
which increased the incidence rate slightly above the<br />
target.<br />
164<br />
Two of the five lost time injuries had lost time exceeding<br />
60 days. The stress claim and hearing claim both have<br />
complex injury management factors.<br />
Outside of the two severe claims (above) lost time was<br />
minimal for the remaining injured workers. However, the<br />
percentage presents as being higher due to the small<br />
number of lost time injuries (five) in total.<br />
Additional supervisory OSH training has been delivered<br />
through 2010/11 however the bulk of the supervisor/<br />
manager training has been scheduled to take place in<br />
2011/12. As such, the Department is on track to meet<br />
this target in 2011/12.<br />
* Actual results for 2010/11 are based on calculations of 419 FTE and five lost time injuries. Two of those injuries resulted in lost time<br />
exceeding 60 days with workers not returning to work within 28 weeks.<br />
ministerial directives<br />
No Ministerial directives were received during the<br />
financial year.<br />
governance disclosures<br />
Contracts with Senior Officers<br />
At the date of reporting, other than normal contracts<br />
of employment of service, no senior officers, or firms<br />
which senior officers are members, or entities which<br />
senior officers have substantial interests, had any<br />
interests in existing or proposed contracts with the<br />
Department of Fisheries and senior officers.
APPENDICES<br />
Twenty-three new trainee Fisheries and Marine Officers were recruited during 2010/11, strengthening the Department’s compliance and educational services.<br />
APPENDICES<br />
Advisory Committees _________________________________________________________________ 166<br />
Major Publications Produced by the Department of Fisheries during 2010/11 ________________ 167<br />
Legislative Amendments and New Legislation ____________________________________________ 170<br />
State Register of Authorisations, Exemptions and Aquaculture Leases _______________________ 179<br />
165
APPENDICES � ADvISORy COMMITTEES<br />
APPeNDIX 1<br />
Advisory Committees<br />
Aquatic Advisory committee<br />
Chair: Mr Robert Fisher AM<br />
Non-Statutory management Advisory committees<br />
(Section 41 and 42, Fish Resources Management Act 1994)<br />
• Integrated Fisheries Allocation Advisory Committee<br />
• Abrolhos Islands Management Advisory Committee<br />
voluntary fisheries Adjustment Scheme<br />
committee of management<br />
(Section 11, Fisheries Adjustment Schemes Act 1987)<br />
• South West Coast Salmon and Related Fisheries<br />
Voluntary<br />
• Adjustment Scheme Committee of Management<br />
• West Australian Trawl and Related Fisheries<br />
Voluntary Fisheries Adjustment Scheme Committee<br />
of Management<br />
• West Coast Demersal Gillnet and Longline Fishery<br />
Voluntary Fisheries Adjustment Scheme Committee<br />
of Management<br />
• Wetline and Related Fisheries Voluntary Fisheries<br />
Adjustment Scheme of Management<br />
166
APPENDICES � MAjOR PUbLICATIONS PRODUCED by <strong>THE</strong> <strong>DEPARTMENT</strong> <strong>OF</strong> <strong>FISHERIES</strong> DURINg 2010/11<br />
APPeNDIX 2<br />
Major Publications Produced by the<br />
Department of Fisheries during 2010/11<br />
Websites<br />
There are currently eight websites coordinated, designed<br />
and maintained by the Department of Fisheries that<br />
form the backbone of its communications – visually and<br />
textually. The eight web sites are:<br />
department of fisheries (corporate website)<br />
www.fish.wa.gov.au<br />
www.youtube.com/user/fisherieswa<br />
Naturaliste marine discovery centre<br />
www.nmdc.com.au<br />
marinewAters (western Australian teacher education<br />
resources) (An initiative of the Department of Fisheries<br />
and Woodside Energy)<br />
marinewaters.fish.wa.gov.au<br />
www.facebook.com/marinewaters<br />
the Perth Beachcombers education Kit (Designed to<br />
help users discover and understand Western Australia’s<br />
coastal and marine environments, it contains activities,<br />
worksheets and other related resources useful for<br />
parents, children, community groups, educators and<br />
anyone interested in beachcombing).<br />
www.fish.wa.gov.au/beachcombers-kit<br />
Seafood western Australia.net<br />
www.seafoodwesternaustralia.net<br />
167<br />
the national fisheries website for ecological<br />
Sustainable development (Sponsored by the Fisheries<br />
Research and Development Corporation)<br />
www.fisheries-esd.com<br />
freshwater fish distribution in western Australia<br />
freshwater.fish.wa.gov.au<br />
‘Sharing the fish’ conference<br />
www.fishallocation.com<br />
The Department of Fisheries’ websites form a key<br />
element in its communication. The main departmental<br />
corporate website experienced over two million page views<br />
(one user loading a page of the website) in 2010/11, with<br />
3.92 pages viewed on average by each user, who spent<br />
an average of over three minutes on the site. 675 GB of<br />
information was downloaded from the site during the year.<br />
Over 60 per cent of the page views were made during<br />
business hours (9am-5pm), over 33 per cent of visitors<br />
were classified as returning visitors to the site and<br />
95 per cent were made without using the site’s<br />
search function.
APPENDICES � MAjOR PUbLICATIONS PRODUCED by <strong>THE</strong> <strong>DEPARTMENT</strong> <strong>OF</strong> <strong>FISHERIES</strong> DURINg 2010/11<br />
During 2010/11, 29,839 people accessed the main<br />
corporate website using their mobile phones. There were<br />
18,419 visits for the first six months of 2011 versus<br />
5,513 for the first six months of 2010 – showing a 334<br />
per cent increase in visits from mobile devices.<br />
Publications<br />
The Department publishes a suite of publications, in<br />
both print and e-media format, which are produced/<br />
reviewed on an annual basis. These include:<br />
Annual report to Parliament<br />
www.fish.wa.gov.au/docs/ar/index.php?0706<br />
‘State of the fisheries and Aquatic resources’ annual<br />
report<br />
www.fish.wa.gov.au/docs/sof/index.php?0706<br />
recreational fishing guides<br />
www.fish.wa.gov.au/sec/about/pubs/index.php?0706<br />
Species Identification guides<br />
www.fish.wa.gov.au/sec/about/pubs/index.php?0706<br />
licensed recreational fisheries Brochures (rock<br />
lobster, abalone, marron, net fishing, recreational fishing<br />
from boat)<br />
www.fish.wa.gov.au/sec/about/pubs/index.php?0706<br />
fisheries fact Sheets<br />
www.fish.wa.gov.au/docs/pub/FactSheets/index.<br />
php?0706<br />
In addition, the Department also publishes a range of<br />
management and research documents each year – these<br />
are listed below for 2010/11.<br />
fisheries occasional Publications<br />
No. 80 North coast fish identification field guide<br />
(September 2010).<br />
No. 81 Western rock lobster international stock<br />
assessment and modelling workshop report<br />
(August 2010).<br />
168<br />
No. 82 ASFB 2009 Workshop – Biodiversity of aquatic<br />
ecosystems – What to measure and monitor<br />
for fisheries and ecosystem management.<br />
FRDC Project No. 2008/353 (October 2010).<br />
No. 83 Gascoyne Demersal Scalefish Managed<br />
Fishery. An operator’s guide to the<br />
management arrangements 1 November 2010<br />
– 31 August 2011 (October 2010).<br />
No. 84 Catch monitoring system guide for fishers and<br />
registered receivers (November 2010).<br />
No. 85 Resource Assessment Framework for finfish<br />
resources in Western Australia (January 2011).<br />
No. 86 Recreational fishing – fish identification<br />
southern guide (March 2011).<br />
No. 87 Recreational fishing - fish identification<br />
northern guide (March 2011).<br />
No. 88 Research and Development Plan 2010 –<br />
2011 (January 2011).<br />
No. 89 Western rock lobster ecology – The state<br />
of knowledge. Marine Stewardship Council<br />
– Principle 2: Maintenance of ecosystem.<br />
December 2010 – draft (April 2011).<br />
No. 90 West Coast Rock Lobster Managed Fishery<br />
E-Log (electronic log).
APPENDICES � MAjOR PUbLICATIONS PRODUCED by <strong>THE</strong> <strong>DEPARTMENT</strong> <strong>OF</strong> <strong>FISHERIES</strong> DURINg 2010/11<br />
No. 91 A report of the Effects of Fishing Advisory<br />
Group meeting (2 - 3 November 2010) and<br />
the Western Rock Lobster Ecological Effects<br />
of Fishing Research Plan revised and updated<br />
by the Effects of Fishing Advisory Group (2 - 3<br />
November 2010) – draft (February 2011).<br />
No. 92 Fishing location guide (March 2011)<br />
No. 93 Impact of the proposed Kimberley LNG<br />
Precinct on customary fishing in the vicinity of<br />
James Price Point (April 2011).<br />
No. 94 Proceedings of the workshop on reallocation<br />
mechanisms, February 2011 (February 2011).<br />
No. 95 Western Rock Lobster Environmental<br />
Management Strategy 2010 – 2015 (April 2011).<br />
No. 96 Governance of the western rock lobster fishery<br />
and Marine Stewardship Council - Principle 3:<br />
Effective Management (April 2011).<br />
fisheries management Papers<br />
No. 247 Integrated Fisheries Management Resource<br />
Report – West Coast Demersal Scalefish<br />
Resource (July 2010).<br />
No. 248 Developing mechanisms for the transfer and/<br />
or adjustment of rock lobster shares between<br />
sectors in Western Australia and South<br />
Australia (May 2011).<br />
fisheries research reports<br />
No. 208 Review of the exploitation of marine resources<br />
of the Australian Indian Ocean Territories: the<br />
implications of biogeographic isolation for<br />
tropical island fisheries.<br />
No. 209 Evaluating source-sink relationships of<br />
the western rock lobster fishery using<br />
oceanographic modelling.<br />
No. 210 Protecting inshore and demersal finfish –<br />
identification of critical habitats for juvenile<br />
dhufish.<br />
169<br />
No. 211 Evaluation of the recreational marron fishery<br />
against environmental change and human<br />
interaction.<br />
No. 212 Ranked risk assessment for bycatch<br />
in multiple fisheries: a bioregional risk<br />
assessment method.<br />
No. 213 Fisheries-dependent indicators of climate<br />
change in Western Australia<br />
No. 214 Human capacity building for introduced marine<br />
pest monitoring in Western Australia.<br />
No. 215 Development of an ecosystem approach to<br />
the monitoring and management of Western<br />
Australian fisheries. FRDC Report – Project<br />
2005/063.<br />
No. 216 Quantifying recreational fishing catch and<br />
effort: a pilot study of shore-based fishers in<br />
the Perth Metropolitan area.<br />
No. 217 Draft stock assessment for the West Coast<br />
Rock Lobster Fishery<br />
No. 218 Assessing possible environmental causes<br />
behind the reduced colonisation of western<br />
rock lobster puerulus collectors by a wide<br />
suite of species.
APPENDICES � LEgISLATIvE AMENDMENTS AND NEw LEgISLATION<br />
APPeNDIX 3<br />
Legislative Amendments<br />
and New Legislation<br />
1. fish resources management Act 1994<br />
Fish Resources Management Amendment Act<br />
2009. No. 37 of 2009<br />
Proclamation<br />
The Governor signed this proclamation on 27 July<br />
2010. Published on 30 July 2010 in Government<br />
Gazette Number 144 on page 3493.<br />
2. fisheries Adjustment Schemes Act 1987<br />
Shark Bay Prawn Managed Fishery Voluntary<br />
Fisheries Adjustment Scheme Notice 2010<br />
The purpose of this gazettal was to establish this<br />
fisheries adjustment scheme. Published on 12<br />
November 2010 in Government Gazette Number<br />
213 on pages 5669-5670.<br />
Abrolhos Islands and Mid West Trawl Managed<br />
Fishery Voluntary Fisheries Adjustment Scheme<br />
Amendment Notice 2010. The purpose of this<br />
gazettal was to vary the existing scheme to allow<br />
additional licences to be offered to the scheme.<br />
Published on 24 December 2010 in Government<br />
Gazette Number 246 on page 6831.<br />
Shark Bay Scallop Managed Fishery Voluntary<br />
170<br />
Fisheries Adjustment Scheme Notice 2010.<br />
The purpose of this gazettal was to establish<br />
a Voluntary Fisheries Adjustment Scheme for<br />
the Shark Bay Scallop Fishery. Published on 24<br />
December 2010 in Government Gazette Number<br />
246 on pages 6831-6832.<br />
Wetline and Related Fisheries Voluntary Fisheries<br />
Adjustment Scheme Variation Notice 2011. The<br />
purpose of this gazettal was to approve an<br />
extension to the scheme. Published on 24 March<br />
2011 in Government Gazette Number 47 on<br />
page 1091.<br />
3. regulations<br />
Fish Resources Management Amendment<br />
Regulations (No. 3) 2010. Amendment<br />
regulations to prescribe a nationally agreed list<br />
of high risk species as noxious fish. Published<br />
on 23 July 2010 in Government Gazette Number<br />
141 on page 3402-3406.<br />
Fish Resources Management Amendment<br />
Regulations (No. 6) 2010. Amendment regulations<br />
to amend the fee payable for the grant or renewal<br />
of a West Coast Rock Lobster Managed Fishery
APPENDICES � LEgISLATIvE AMENDMENTS AND NEw LEgISLATION<br />
authorisation, increase the escape gap size and<br />
revoke regulations 33 and 34. Published on 27<br />
August 2010 in Government Gazette Number<br />
165 on page 4106-4111.<br />
Fish Resources Management Amendment<br />
Regulations (No. 7) 2010. Amendment regulations<br />
to amend the fee payable for the grant or renewal<br />
of a Kimberley Gillnet and Barramundi Managed<br />
Fishery authorisation and a South West Trawl<br />
Managed Fishery authorisation. Published on 10<br />
September 2010 in Government Gazette Number<br />
172 on page 4347.<br />
Fish Resources Management Amendment<br />
Regulations (No. 8) 2010. Amendment regulations<br />
to reduce the 2010 Perth Metropolitan Roe’s<br />
Abalone Recreational Fishery season to five<br />
(previously six) one-hour sessions held on<br />
consecutive Sundays commencing 7 November<br />
2010. Published on 8 October 2010 in<br />
Government Gazette Number 187 on page 5134-<br />
5135.<br />
Fish Resources Management Amendment<br />
Regulations (No. 9) 2010. Amendment regulations<br />
to amend the fee payable for the grant or renewal<br />
of a managed fishery licence in a number of<br />
managed fisheries. Published on 2 December<br />
2010 in Government Gazette Number 227 on<br />
pages 6031-6034.<br />
Fish Resources Management Amendment<br />
Regulations 2011. Amendment regulations to<br />
remove regulation 64(5A) relating to the provision<br />
of weekly processor’s returns for rock lobster.<br />
Published on 1 March 2011 in Government<br />
Gazette Number 28 on page 667.<br />
171<br />
Fish Resources Management Amendment<br />
Regulations (No. 2) 2011. Amendment<br />
regulations relating to the use of release<br />
weights, boat limits, leasing Aquatic Tour<br />
Operator Licences and the use of fishing gear<br />
on charter boats. Published on 1 March 2011 in<br />
Government Gazette Number 28 on pages 668-<br />
673.<br />
Fish Resources Management Amendment<br />
Regulations (No. 3) 2011. Amendment regulations<br />
to require that all rock lobster pots used in the<br />
Abrolhos Islands (Easter Group and Pelsaert<br />
Group) be fitted with sea lion exclusion devices.<br />
Published on 1 March 2011 in Government<br />
Gazette Number 28 on pages 673-675.<br />
Fish Resources Management Amendment<br />
Regulations (No. 4) 2011. Amendment regulations<br />
to remove the minimum commercial size limits<br />
for various species; correct the scientific name<br />
of northwest snapper; and remove pink snapper<br />
from the table for special risk finfish in regulation<br />
14. Published on 29 March 2011 in Government<br />
Gazette Number 51 on pages 1151-1153.<br />
Fish Resources Management Amendment<br />
Regulations (No. 5) 2011. Amendment<br />
regulations to increase of fees. Published on 6<br />
May 2011 in Government Gazette Number 74 on<br />
pages 1609-1612.<br />
4. management Plans<br />
West Coast Rock Lobster Management Plan<br />
Amendment (No. 9) 2010. Management plan<br />
amendment to replace the Rock Lobster<br />
Industry Advisory Committee with the Western<br />
Australian Fishing Industry Council Inc. as the
APPENDICES � LEgISLATIvE AMENDMENTS AND NEw LEgISLATION<br />
body to be consulted before the plan is amended<br />
or revoked. Published on 6 July 2010 in<br />
Government Gazette Number 133 on page 3227.<br />
Shark Bay Crab Fishery (Interim) Management<br />
Plan Amendment 2010. Management plan<br />
amendment to extend the expiry date of the<br />
interim plan until 31 August 2011. Published on<br />
17 August 2010 in Government Gazette Number<br />
161 on pages 4050-4051.<br />
West Coast Rock Lobster Management Plan<br />
Amendment (No. 10) 2010. Management plan<br />
amendment relating to:<br />
• Introduce individual catch limits for each<br />
licence in the fishery based on the number<br />
of units held on the licence and consistent<br />
with the approved Total Allowable Commercial<br />
Catch (TACC) for each zone of the fishery.<br />
• Provide that the quantity of gear able to<br />
be used in the fishery and the catch limit<br />
should be fixed, based on the current unit<br />
entitlement on a licence (the number of units<br />
after temporary transfers to and from the<br />
licence) as at a specified date prior to the<br />
start of the season in each zone (Zone B,<br />
Zone C and Abrolhos Islands Area).<br />
• Provide the opportunity for industry to be able<br />
to soak a number of pots at the Abrolhos<br />
Islands before the start of the season which<br />
is representative of the quantity of gear they<br />
are able to fish once the season opens.<br />
• Remove the restriction on Zone A licence<br />
holders operating in inshore waters which<br />
are less than 20 fathoms in depth (the “20<br />
fathom line”).<br />
172<br />
• Align the season start date for Zones B and C<br />
at 15 November.<br />
• Extend the season in all zones by two months<br />
to 31 August.<br />
• Adjust the capacity of the fishery such that<br />
the unit value in all zones is 0.5 pots per unit<br />
all season.<br />
• Prohibit fishing on Saturdays and Sundays,<br />
but permits fishing on Fridays where this is<br />
currently prohibited.<br />
• Include penalties and a defence in respect to<br />
exceeding catch limits.<br />
Published on 10 September 2010 in Government<br />
Gazette Number 172 on pages 4358-4362.<br />
West Coast Estuarine Fishery (Interim)<br />
Management Plan Amendment 2010.<br />
Management plan amendment to extend the<br />
expiry date for the plan until 7 November 2011,<br />
to allow sustainable operation of the fishery<br />
while consultation with stakeholders on future<br />
management is undertaken. It also implements<br />
the fee in accordance with the arrangements<br />
for commercial fisheries access fees in WA.<br />
Published on 3 November 2010 in Government<br />
Gazette Number 204 on page 5523.<br />
West Coast Rock Lobster Management Plan<br />
Amendment (No. 11) 2010. Management plan<br />
amendment to implement a quota system for the<br />
fishery from the commencement of the 2010-<br />
11 season. Published on 5 November 2010<br />
in Government Gazette Number 208 on pages<br />
5589-5601.
APPENDICES � LEgISLATIvE AMENDMENTS AND NEw LEgISLATION<br />
West Coast Demersal Scalefish (Interim)<br />
Management Plan Amendment 2010.<br />
Management plan amendment to introduce new<br />
fees that will be payable on renewal of a permit<br />
for the 2011 fishing season. Published on 3<br />
December 2010 in Government Gazette Number<br />
229 on pages 6064-6065.<br />
Mackerel Fishery (Interim) Management Plan<br />
Amendment 2010. Management plan amendment<br />
to introduce new fees that will be payable on<br />
renewal of a permit for the 2011 fishing season.<br />
Published on 3 December 2010 in Government<br />
Gazette Number 229 on page 6065.<br />
West Coast Deep Sea Crustacean Fishery<br />
(Interim) Management Plan Amendment 2010.<br />
Management plan amendment to introduce new<br />
fees that will be payable on renewal of a permit<br />
for the 2011 fishing season. Published on 3<br />
December 2010 in Government Gazette Number<br />
229 on pages 6065-6066.<br />
Cockburn Sound Crab Fishery Management Plan<br />
Amendment 2010. Management plan amendment<br />
to amend clause 16 regarding minimum size.<br />
Published on 10 December 2010 in Government<br />
Gazette Number 234 on page 6287.<br />
West Coast Rock Lobster Management<br />
Plan Amendment 2011. Management plan<br />
amendment to implement rules for rock lobster<br />
fishing at the Abrolhos Islands. Published on 11<br />
March 2011 in Government Gazette Number 35<br />
on pages 822-833.<br />
West Coast Demersal Gillnet and Demersal<br />
Longline Fishery (Interim) Management<br />
Plan Amendment 2011. Management plan<br />
173<br />
amendment to allow for the operations of the<br />
west coast fishery to continue, and provide<br />
sufficient time to undertake the work required to<br />
transition the west coast fishery to fully managed<br />
status. Published on 1 April 2011 in Government<br />
Gazette Number 52 on page 1191.<br />
Joint Authority Southern Demersal Gillnet And<br />
Demersal Longline Managed Fishery Management<br />
Plan Amendment 2011. Management<br />
plan amendment to bring the fee setting<br />
arrangements for the fishery in line with the<br />
State’s other managed fisheries. Published on 6<br />
May 2011 in Government Gazette Number 74 on<br />
page 1625.<br />
Pilbara Fish Trawl Fishery (Interim) Management<br />
Plan Amendment 2011. Management plan<br />
amendment to extend the life of the plan for<br />
two years until 30 June 2013. Published on 10<br />
May 2011 in Government Gazette Number 76 on<br />
page 1670.<br />
West Coast Rock Lobster Management Plan<br />
Amendment (No. 2) 2011. Management plan<br />
amendment to:<br />
• remove the current closure to fishing on<br />
Saturdays and Sundays effective from 25<br />
June 2011 until the end of the current<br />
season; and<br />
• correct an administrative error that relates to<br />
the boundaries of the area that is closed for<br />
research purposes described in Schedule 12<br />
of the Plan.<br />
Published on 17 June 2011 in Government<br />
Gazette Number 97 on pages 2181-2182.
APPENDICES � LEgISLATIvE AMENDMENTS AND NEw LEgISLATION<br />
5. New management Plans<br />
Gascoyne Demersal Scalefish Management Plan<br />
2010.New management plan for the fishery. This<br />
plan came into operation on 1 November 2010.<br />
Published on 22 October 2010 in Government<br />
Gazette Number 194 on pages 5271 to 5282.<br />
6. orders<br />
Prohibition On Recreational Fishing For Crabs<br />
(Cockburn Sound) Amendment Order 2010.This<br />
order extends the recreational crabbing season in<br />
Cockburn Sound by one-month and increases the<br />
opportunity for recreational fishers to participate<br />
in crabbing activities during the Easter period.<br />
Published on 10 December 2010 in Government<br />
Gazette Number 234 on page 6287.<br />
7. Amendments to existing orders<br />
Prohibition On Commercial Fishing (South-West<br />
Coast Beach Bait Net) Order 2010<br />
Order No. 3 of 2010<br />
This order prohibits beach bait net fishing<br />
between Tim’s Thicket and Black Point, and<br />
permit beach bait net fishing between Tim’s<br />
Thicket and Port Geographe to authorised Fishing<br />
Boat Licence holders only. Published on 13 July<br />
2010 in Government Gazette Number 136 on<br />
page 3295-3297.<br />
Prohibition On Fishing For Rock Lobster Order (No.<br />
6) 2010. This order removes the duplication of<br />
existing legislation that provides for the ‘season’<br />
for the fishery by ensuring that the dates for<br />
prohibition on fishing are contained in the West<br />
Coast Rock Lobster Management Plan only, and<br />
repealing Notice 389 which also referred to<br />
174<br />
dates when fishing is prohibited. Published on 10<br />
September 2010 in Government Gazette Number<br />
172 on page 4362.<br />
Northern Demersal Scalefish Fishery Management<br />
Plan 2000.Determination Of The Capacity Of Area<br />
2 Of The Northern Demersal Scalefsih Managed<br />
Fishery For The 2011 Licensing Period. This<br />
determination provides that the capacity of Area<br />
2 of the fishery shall be limited to 985.6 fishing<br />
days for the period commencing 1 January 2011<br />
and ending on 31 December 2011. Published<br />
on 7 December 2010 in Government Gazette<br />
Number 231 on page 6101.<br />
8. revoked orders<br />
Shark Bay Snapper Management Plan Revocation<br />
2010-11-25. This order revokes the Shark Bay<br />
Snapper Management Plan 1994. Published on<br />
22 October 2010 in Government Gazette Number<br />
194 on page 5269.<br />
9. Notices<br />
Joint Authority Southern Demersal Gillnet and<br />
Demersal Longline Managed Fishery Management<br />
Plan 1992. Closure of an area within the fishery.<br />
Notice No. 1 of 2010. This notice prohibits<br />
fishing by the use of a demersal gillnet or<br />
demersal longline at any time during the period<br />
commencing on 16 August 2010 and ending on<br />
15 October 2010. Published on 9 July 2010 in<br />
Government Gazette Number 134 on page 3249.<br />
West Coast Demersal Gillnet And Demersal<br />
Longline (Interim) Managed Fishery Management<br />
Plan 1997.Closure of an area within the fishery.<br />
Notice No. 1 of 2010. This notice prohibits fishing<br />
by the use of a demersal gillnet or demersal
APPENDICES � LEgISLATIvE AMENDMENTS AND NEw LEgISLATION<br />
longline at any time during the period commencing<br />
on 16 August 2010 and ending on 15 October<br />
2010. Published on 9 July 2010 in Government<br />
Gazette Number 134 on page 3249-50.<br />
Kimberley Prawn Managed Fishery Management<br />
Plan 1993. Areas closed to fishing for prawns.<br />
Notice No. 3 of 2010. This notice prohibits fishing<br />
for prawns in Kimberley Prawn Managed Fishery<br />
during certain times and dates. Published on 23<br />
July 2010 in Government Gazette Number 141<br />
on page 3408-3409.<br />
Broome Prawn Managed Fishery Management<br />
Plan 1999. Areas closed to fishing for prawns.<br />
Notice No. 2 of 2010. This notice prohibits fishing<br />
for prawns during certain times and dates.<br />
Published on 10 August 2010 in Government<br />
Gazette Number 154 on page 3749.<br />
Fish Resources Management Regulations 1995.<br />
Approved Directions. This notice approves the<br />
documents listed in Schedule 1 as approved<br />
directions for the installation, use and testing<br />
of approved automatic location communicators.<br />
Published on 20 August 2010 in Government<br />
Gazette Number 163 on page 4078.<br />
Determination Under Clause 9 Of The Shark Bay<br />
Scallop Management Plan 1994. To give notice<br />
that a new determination (Determination No. 2<br />
of 2010) has been made of dates, times and<br />
areas that fishing is prohibited in the Shark<br />
Bay Scallop Managed Fishery over the period<br />
commencing from the date of gazettal of this<br />
notice and ending on 1 June 2011. Published<br />
on 10 September 2010 in Government Gazette<br />
Number 172 on page 4363.<br />
175<br />
Determination No. 2 Of 2010 Shark Bay Scallop<br />
Managed Fishery Management Plan 1994. This<br />
determination cancels Determination No. 1 of<br />
2010 dated 5 March 2010, and prohibits fishing<br />
for scallop in all of the waters of the Shark<br />
Bay Scallop Managed Fishery from the date of<br />
gazettal of this notice until 0800 hours on 1<br />
June 2011. Published on per notice above on 10<br />
September 2010 in Government Gazette Number<br />
172 on page 4363.<br />
Determination of the Capacity of the Mackerel<br />
Interim Managed Fishery For The 2011 Permit<br />
Period. Determination of the quantity of mackerel<br />
that may be taken during the 2011 permit year.<br />
Published on 22 October 2010 in Government<br />
Gazette Number 192 on page 5233.<br />
Shark Bay Line Fishing (Amendment And<br />
Revocation Of Orders) Order 2010, Order No. 2<br />
Of 2010. Amendments and revocations as a<br />
result of the commencement of the Gascoyne<br />
Demersal Scalefish Management Plan and to<br />
delete obsolete references to “Oyster Fishing<br />
Licences” that were repealed in 2007. Published<br />
on 22 October 2010 in Government Gazette<br />
Number 194 on page 5270.<br />
Determination Of The Capacity Of The Pilbara Trap<br />
Managed Fishery For The 2011 Licensing Period.<br />
Determination of the capacity of the Pilbara Trap<br />
Managed Fishery being 5456 trap days for the<br />
period commencing 1 January 2011 and ending<br />
31 December 2011. Published on 19 November<br />
2010 in Government Gazette Number 216 on<br />
page 5758.
APPENDICES � LEgISLATIvE AMENDMENTS AND NEw LEgISLATION<br />
Abalone Management Plan 1992<br />
Determination. A determination in regard to the<br />
maximum quantity of abalone that may be taken<br />
from the relevant areas of the Abalone Managed<br />
Fishery during the licensing period commencing<br />
on 1 April 2011. Published on 22 February 2011<br />
in Government Gazette Number 24 on page 624.<br />
Shark Bay Scallop Management Plan 1994<br />
Closure of areas within the fishery. The dates,<br />
times and areas that fishing is prohibited.<br />
Published on 25 February 2011 in Government<br />
Gazette Number 27 on page 660.<br />
Shark Bay Prawn Management Plan 1993<br />
Closure of areas within the fishery. The dates,<br />
times and areas that fishing is prohibited.<br />
Published on 25 February 2011 in Government<br />
Gazette Number 27 on page 660.<br />
Shark Bay Scallop Management Plan 1994<br />
Closure of areas within the fishery. The dates,<br />
times and areas that fishing is prohibited.<br />
Published on 25 March 2011 in Government<br />
Gazette Number 48 on page 1097.<br />
South Coast Purse Seine Managed Fishery<br />
Approved receivers of small pelagic fish. Approve<br />
receivers of small pelagic fish. Published on 1<br />
April 2011 in Government Gazette Number 52 on<br />
page 1189.<br />
Kimberley Prawn Managed Fishery Management<br />
Plan 1993.<br />
Notice of areas closed to fishing for prawns. Notice<br />
No. 1 of 2011. Change to the dates and period<br />
that fishing is prohibited. Changes to the waters<br />
described above. Published on 1 April 2011 in<br />
Government Gazette Number 52 on page 1190.<br />
176<br />
Broome Prawn Managed Fishery Management<br />
Plan 1999. Areas closed to fishing for prawns.<br />
Notice No. 1 of 2011. Prohibit fishing for prawns<br />
as described in Schedule 2 of the plan, from the<br />
date of gazettal until 19 May 2011; and prohibit<br />
fishing for prawns during the period commencing<br />
0800 hours WST on 5 September 2011.<br />
Published on 29 April 2011 in Government<br />
Gazette Number 70 on pages 1537-1538.<br />
Joint Authority Southern Demersal Gillnet And<br />
Demersal Longline Managed Fishery Management<br />
Plan 1992. Closure Of An Area Within The Fishery.<br />
Notice No. 1 of 2011. Prohibit fishing during<br />
the period commencing on 16 August 2011<br />
and ending on 15 October 2011 in that area<br />
of the fishery specified in the schedule, for<br />
the purposes of protecting breeding stocks of<br />
whiskery shark. Published on 24 May 2011 in<br />
Government Gazette Number 85 on pages 1902-<br />
1903.<br />
West Coast Demersal Gillnet And Demersal<br />
Longline (Interim) Managed Fishery Management<br />
Plan 1997. Closure of an area within the fishery<br />
Notice No. 1 of 2011. Prohibit fishing during<br />
the period commencing on 16 August 2011<br />
and ending on 15 October 2011 in that area<br />
of the fishery specified in the schedule, for<br />
the purposes of protecting breeding stocks of<br />
whiskery shark. Published on 24 May 2011 in<br />
Government Gazette Number 85 on page 1903.
APPENDICES � LEgISLATIvE AMENDMENTS AND NEw LEgISLATION<br />
10. Pearling Act 1990 regulations<br />
Pearling (General) Amendment Regulations 2011.<br />
The purpose of this regulation is to increase<br />
a range of fees payable under the Pearling Act<br />
1990. Published on 15 April 2011 in Government<br />
Gazette Number 64 on pages 1415-1417.<br />
Pearling (General) Amendment Regulations (No. 2)<br />
2011.<br />
The purpose of this regulation is to amend the<br />
definition of “medical practitioner” to ensure<br />
consistency of terminology with the new Health<br />
Practitioner Regulation National Law (Western<br />
Australia) Act 2010. Published on 29 April 2011<br />
in Government Gazette Number 70 on page<br />
1523.<br />
11. Pearling Act 1990 Notices<br />
Grant Of A Pearl Oyster Hatchery Licence (For<br />
Propagation) Cygnet Bay, King Sound, Broome.<br />
Notice of the grant of a pearl oyster hatchery<br />
licence at Cygnet Bay, King Sound, Broome to<br />
Cygnet Bay Pearls. Published on 6 July 2010 in<br />
Government Gazette Number 133 on page 3228.<br />
Pearling (Annual Fees) Notice 2010. Annual fees<br />
for farm leases, pearling licences, hatchery<br />
licences and permits. Published on 14 December<br />
2010 in Government Gazette Number 235 on<br />
pages 6305-6306.<br />
Restriction Of Pearling And Hatchery Activities<br />
(Mangrove Island) Notice.<br />
Restriction Of Pearling And Hatchery Activities<br />
(Eighty Mile) Notice.<br />
Restriction Of Pearling And Hatchery Activities<br />
(Whalebone Island) Notice.<br />
177<br />
Restriction Of Pearling And Hatchery Activities<br />
(Dailey Shoal) Notice.<br />
Restriction Of Pearling And Hatchery Activities<br />
(Red Bluff) Notice.<br />
Restriction Of Pearling And Hatchery Activities<br />
(North Turtle Island) Notice.<br />
Restriction Of Pearling And Hatchery Activities<br />
(Weld Island) Notice.<br />
Transition of pearling regulation 45(e) on pearl<br />
holding sites (for the above seven sites).<br />
Published on 21 December 2010 in Government<br />
Gazette Number 244 on pages 6768-6771.<br />
Grant Of Pearl Oyster Farm Lease. Paspaley<br />
Pearling Co Pty Ltd, Roebuck Pearl Producers<br />
Pty Ltd, Pearls Pty Ltd and the Australian South<br />
Sea Pearl Co Pty Ltd issued with a pearl oyster<br />
farm lease. Published on 25 March 2011 in<br />
Government Gazette Number 48 on page 1097.<br />
Restriction Of Pearling and Hatchery Activities<br />
(La Grange Bay) Notice 2011. Restriction of<br />
pearling and hatchery activities at La Grange<br />
Bay. Published on 1 April 2011 in Government<br />
Gazette Number 52 on page 1191.<br />
12. Pearling Act 1990 revocations<br />
Restriction Of Pearling And Hatchery Activities<br />
(North Turtle Islet) (Revocation) Notice. Revocation<br />
Notice. Published on 9 July 2010 in Government<br />
Gazette Number 134 on page 3250.
APPENDICES � LEgISLATIvE AMENDMENTS AND NEw LEgISLATION<br />
13. gazettal not required<br />
Nichol Bay Prawn Managed Fishery Management<br />
Plan – Notice Of Areas Closed To Fishing For<br />
Prawns – Notice No. 1 Of 2011. Cancellation of<br />
Notice No. 1 of 2010 dated 4 March 2010 and<br />
prohibit fishing for prawns in those parts of the<br />
fishery between new times and dates provided.<br />
Shark Bay Prawn Managed Fishery Management<br />
Plan 1993. Determination Of Areas Closed To<br />
Fishing For Prawns. Determination No. 1 Of 2011.<br />
Shark Bay Scallop Managed Fishery Management<br />
Plan 1994. Determination Of Areas Closed To<br />
Fishing For Scallops. Determination No. 2 Of<br />
2011.<br />
Abrolhos Islands And Mid West Trawl Managed<br />
Fishery Management Plan 1993. Notice Of<br />
Areas Open Or Closed To Fishing For Prawns And<br />
Scallops. Notice No. 1 Of 2011<br />
Onslow Prawn Managed Fishery Management<br />
Plan 1991. Notice Of Areas Closed To Fishing For<br />
Prawns. Notice No. 1 Of 2011<br />
Exmouth Gulf Prawn Managed Fishery<br />
Management Plan 1989. Notice Of Permitted And<br />
Prohibited Areas To Fishing For Prawns. Notice No.<br />
1 Of 2011<br />
178
APPENDICES � STATE REgISTER <strong>OF</strong> AUTHORISATIONS, ExEMPTIONS AND AqUACULTURE LEASES<br />
APPeNDIX 4<br />
State Register of Authorisations,<br />
exemptions and Aquaculture Leases<br />
The State Register of Authorisations, Exemptions<br />
and Aquaculture Leases is available to the public on<br />
application to the Registrar and payment of appropriate<br />
fees – see section 125 of the Fish Resources<br />
Management Act 1994 (FRMA).<br />
One aquaculture lease has been granted during the<br />
reporting period.<br />
At 30 June 2011, there were 136,315 recreational<br />
fishing licences recorded on the register. Although<br />
details of recreational licences are recorded on the State<br />
Register, the Registrar is prohibited from making these<br />
available for public search – see section 125(6) of the<br />
FRMA.<br />
At 30 June 2011, there were 441 aquaculture licences<br />
recorded on the State Register.<br />
At 30 June 2011, there were 5,901 commercial<br />
authorizations recorded on the State Register. The<br />
commercial authorisations on the State Register were<br />
made up of the following:<br />
Interim managed fishery licences 178<br />
Mackerel Fishery 66<br />
Pilbara Fish Trawl 11<br />
Shark Bay Crab 5<br />
West Coast Deep Sea Crustacean 7<br />
West Coast Demersal Gillnet & Demersal Long Line 17<br />
West Coast Estuarine 12<br />
West Coast Demersal Scalefish 60<br />
managed fishery licences 1,212<br />
Abalone 45<br />
Abrolhos Mid-Trawl 10<br />
Broome Prawn 5<br />
Cockburn Crab 12<br />
Cockburn Fish Net 1<br />
Cockburn Line & Pot 13<br />
Cockburn Mussel 2<br />
Esperance Rock Lobster 8<br />
Exmouth Prawn 15<br />
Kimberley Gill Net & Barramundi 7<br />
Kimberley Prawn 126<br />
Marine Aquarium Fish Corporate 1<br />
Marine Aquarium Fish Individual 11<br />
Nickol Bay Prawn 14<br />
Northern Demersal 15<br />
Onslow Prawn 30<br />
Pilbara Trap 6<br />
179
APPENDICES � STATE REgISTER <strong>OF</strong> AUTHORISATIONS, ExEMPTIONS AND AqUACULTURE LEASES<br />
Shark Bay Beach Seine 11<br />
Shark Bay Prawn 18<br />
Shark Bay Scallop 29<br />
Shark Bay Snapper 47<br />
South Coast Estuarine 25<br />
South Coast Purse Seine 33<br />
South Coast Salmon 18<br />
South West Salmon 6<br />
South West Trawl 14<br />
Southern Demersal Gillnet and Demersal Longline 50<br />
Specimen Shell 33<br />
Warnbro Crab 0<br />
West Coast Beach Bait Fish 1<br />
West Coast Purse Seine 12<br />
Windy Harbour/Augusta Rock Lobster 2<br />
West Coast Rock Lobster 592<br />
other licences 4,511<br />
Commercial Fishing Licence 2,204<br />
Fish Processing (Land) 121<br />
Fish Processing (Sea) 112<br />
Fishing Boat Licence 1,400<br />
Aquatic Eco Tour 6<br />
Fishing Tour Operators Licence 223<br />
Restricted Fishing Tour 30<br />
Permit to Construct a Fish Processing Establishment 387<br />
Rock Lobster Pot Licence 28<br />
transactions on the register 919<br />
Extracts 467<br />
Searches 58<br />
Notation of security interest 150<br />
Removal of security interest 228<br />
Variation of security interest 16<br />
Fees to access the State Register and obtain copies of<br />
entries in, and extracts from, the register are prescribed<br />
in Schedule 1 Part 1 of the Fish Resources Management<br />
Regulations 1995.<br />
180<br />
The Registrar recorded 12 convictions against 23<br />
authorisations in the relevant period, pursuant to the<br />
statutory obligation under section 224 (1) of the FRMA.<br />
There were no authorisations cancelled (under section<br />
224 (2) of the FRMA) as a result of the recording<br />
of three convictions within 10 years against the<br />
authorisation.<br />
The Registrar provided certificates under section 212 of<br />
the FRMA for the purposes of proceedings for offences<br />
under the FRMA on three occasions.<br />
State register of exemptions 2010/11<br />
exemption No: 1793<br />
Applicant: Fremantle Octopus Pty Ltd<br />
Period of Exemption: 14/07/2010 – 31/01/2015<br />
Provisions: Clause 2 of the Fish Trap Prohibition Notice.<br />
Purpose: Explore and/or develop the octopus fishery<br />
and fishing technology.<br />
exemption No: 1794<br />
Applicant: Sinclair Knight Mertz<br />
Period of Exemption: 01/08/2010 – 31/01/2013<br />
Provisions: Prohibition on Fishing (Coral, ‘Live Rock’ and<br />
Algae) Order 2007 (Order No 11).<br />
Purpose: To provide information on coral reproduction<br />
and to contribute to research towards<br />
understanding the impact of plumes<br />
(associated with port related dredging activity)<br />
on coral spawning.
APPENDICES � STATE REgISTER <strong>OF</strong> AUTHORISATIONS, ExEMPTIONS AND AqUACULTURE LEASES<br />
exemption No: 1795<br />
Applicant: Persons listed in Schedule 1<br />
Period of Exemption: 06/09/2010 – 11/09/2010<br />
Provisions: Sections 46(a), 46(b), 50(3) and 51(2) of<br />
the Fish Resources Management Act 1994<br />
and regulation 16D of the Fish Resources<br />
Management Regulations 1995 which would<br />
otherwise prevent those persons from lawfully<br />
undertaking the research activities.<br />
Purpose: To assist the Research Division, Department of<br />
Fisheries, to undertake a pink snapper stock<br />
assessment survey in Freycinet Estuary, Shark<br />
Bay.<br />
exemption No: 1796<br />
Applicant: Sinclair Knight Mertz<br />
Period of Exemption: 06/09/2010 – 31/12/2011<br />
Provisions: Prohibition on Fishing (Coral, ‘Live Rock’ and<br />
Algae) Order 2007 (Order No 11).<br />
Purpose: To provide information on coral reproduction<br />
and to contribute to research towards<br />
understanding the impact of plumes<br />
(associated with port-related dredging activity)<br />
on coral spawning.<br />
exemption No: 1797<br />
Applicant: Steve McLeary on behalf of Department of<br />
Fisheries’ Research Division<br />
Period of Exemption: 26/09/2010 – 1/10/2010<br />
Provisions: Section 74 of the Fish Resources Management<br />
Act 1994 which would otherwise prevent that<br />
person from lawfully undertaking the research<br />
activities.<br />
Purpose: To assist the Research Division, Department<br />
of Fisheries, in conducting the annual<br />
independent breeding stock survey required to<br />
monitor the sustainability of the rock lobster<br />
fishery.<br />
181<br />
exemption No: 1798<br />
Applicant: James Chandler on behalf of the Department<br />
of Fisheries’ Research Division<br />
Period of Exemption: 26/09/2010 – 16/10/2010<br />
Provisions: Section 74 of the Fish Resources Management<br />
Act 1994 which would otherwise prevent that<br />
person from lawfully undertaking the research<br />
activities.<br />
Purpose: To assist the Research Division, Department<br />
of Fisheries, in conducting the annual<br />
independent breeding stock survey required to<br />
monitor the sustainability of the rock lobster<br />
fishery.<br />
exemption No: 1799<br />
Applicant: Nils Stokke on behalf of the Department of<br />
Fisheries- Research Division<br />
Period of Exemption: 26/09/2010 – 01/10/2010<br />
Provisions: Section 74 of the Fish Resources Management<br />
Act 1994 which would otherwise prevent that<br />
person from lawfully undertaking the research<br />
activities.<br />
Purpose: To assist the Research Division, Department<br />
of Fisheries, in conducting the annual<br />
independent breeding stock survey required to<br />
monitor the sustainability of the rock lobster<br />
fishery.
APPENDICES � STATE REgISTER <strong>OF</strong> AUTHORISATIONS, ExEMPTIONS AND AqUACULTURE LEASES<br />
exemption No: 1800<br />
Applicant: Master and crew of the vessel Alcyone<br />
on behalf of the Department of Fisheries’<br />
Research Division<br />
Period of Exemption: 01/09/2010 – 15/10/2010<br />
Provisions: Sections 46 and 173 of the Fish Resources<br />
Management Act 1994 and clauses 6, 10, 11,<br />
12, 13, 14, 16, 21 and 22 of the Pilbara Trap<br />
Management Plan 1992.<br />
Purpose: To enable the research personnel of the<br />
Department of Fisheries to undertake aquatic<br />
scientific research involving the collection<br />
of fish from areas within the Pilbara Trap<br />
Managed Fishery and including areas closed to<br />
commercial trap and trawl fishing.<br />
exemption No: 1801<br />
Applicant: All persons on-board a boat that is specified<br />
on a Fishing Tour Operator’s Licence<br />
Period of Exemption: 02/03/2010 - 30/06/2011<br />
Provisions: Regulation 124B of the Fish Resources<br />
Management Regulations 1995.<br />
Purpose: Exempt persons on-board a Fishing Tour<br />
Operator’s licenced vessel from the<br />
requirement to hold a recreational (boat)<br />
fishing licence.<br />
exemption No: 1802<br />
Applicant: Terry Ash<br />
Period of Exemption: 27/10/2010 – 1/11/2010<br />
Provisions: Section 74 of the Fish Resources Management<br />
Act 1994.<br />
Purpose: To assist the Research Division, Department<br />
of Fisheries, in conducting the annual<br />
independent breeding stock survey required to<br />
monitor the sustainability of the rock lobster<br />
fishery.<br />
182<br />
exemption No: 1803<br />
Applicant: Kimberley Prawn Company (Australia) Pty Ltd<br />
Period of Exemption: 02/07/2010 – 30/06/2010<br />
Provisions: Sections 90 and 91 of the Fish Resources<br />
Management Act 1994.<br />
Purpose: The engagement in the aquaculture of<br />
barramundi, green mudcrab, brown mudcrab,<br />
white banana prawn, grooved tiger prawn and<br />
silver cobbler.<br />
exemption No: 1804<br />
Applicant: Kimberley College of TAFE<br />
Period of Exemption: 16/06/2010 – 30/06/2010<br />
Provisions: Sections 46 and 47 of the Fish Resources<br />
Management Act 1994 and regulations 10, 15,<br />
39 and 40 of the Fish Resources Management<br />
Regulations 1995. Notice 618.<br />
Purpose: The taking of species as listed in Schedule 4<br />
for aquaculture purposes collected in zones<br />
outlined in Schedule 5, using methods outlined<br />
in Schedule 6.<br />
exemption No: 1805<br />
Applicant: Marine Produce Australia Limited<br />
Period of Exemption: 02/07/2010 – 31/12/2012<br />
Provisions: Sections 50, 51, 90 and 91 of the Fish<br />
Resources Management Act 1994 and<br />
regulations 117 and 121 of the Fish Resources<br />
Management Regulations 1995.<br />
Purpose: To collect cobia and barramundi for use as<br />
broodstock for aquaculture purposes.
APPENDICES � STATE REgISTER <strong>OF</strong> AUTHORISATIONS, ExEMPTIONS AND AqUACULTURE LEASES<br />
exemption No: 1806<br />
Applicant: Kimberley Prawn Company (Aust) Pty Ltd<br />
Period of Exemption: 02/07/2010 – 30/06/2013<br />
Provisions: Sections 90 and 91 of the Fish Resources<br />
Management Act 1994.<br />
Purpose: To engage in the aquaculture of barramundi,<br />
mud crab, prawn and cobbler.<br />
exemption No: 1807<br />
Applicant: Murdoch University – Science and Engineering<br />
Division<br />
Period of Exemption: 05/05/2010 - 05/05/2012<br />
Provisions: Section 90 of the Fish Resources Management<br />
Act 1994<br />
Purpose: Research and Development trials to assess<br />
the feasibility of growing saline micro-algae in<br />
outdoor ponds for bio-diesel production.<br />
exemption No: 1808<br />
Applicant: Andrew Joseph and Tracey Lee Basile<br />
Period of Exemption: 24/09/2010 – 30/09/2013<br />
Provisions: Sections 43, 46, 50 and 51 of the Fish<br />
Resources Management Act 1994 and<br />
regulations 117 and 121 of the Fish Resources<br />
Management Regulations 1995 to the<br />
extent that they would otherwise prevent the<br />
activities.<br />
Purpose: To collect those species listed in Schedule<br />
4 for use as broodstock for aquaculture<br />
purposes.<br />
183<br />
exemption No: 1809<br />
Applicant: Danny Wimpress<br />
Period of Exemption: 01/10/2010 – 31/12/2010<br />
Provisions: Section 43(3) of the Fish Resources<br />
Management Act 1994 which would otherwise<br />
prevent that person from lawfully undertaking<br />
the research activities.<br />
Purpose: To assist the Research Division, Department<br />
of Fisheries, in collecting required data for<br />
biological analysis.<br />
exemption No: 1810<br />
Applicant: Ryan Lewis Thipthorp<br />
Period of Exemption: 01/10/2010 – 31/12/2010<br />
Provisions: Sections 43(3) of the Fish Resources<br />
Management Act 1994 which would otherwise<br />
prevent that person from lawfully undertaking<br />
the research activities.<br />
Purpose: To assist the Research Division, Department<br />
of Fisheries, in collecting required data for<br />
biological analysis.<br />
exemption No: 1811<br />
Applicant: Master and crew of all vessels authorised<br />
to operate in the West Coast Rock Lobster<br />
Managed Fishery<br />
Period of Exemption: 15/11/2009 – 30/08/2011<br />
Provisions: Sections 46(a), 46(b), 46(d) and 74 of the Fish<br />
Resources Management Regulations 1995.<br />
Purpose: To enable members of the commercial fishing<br />
industry to assist the Research Division,<br />
Department of Fisheries.
APPENDICES � STATE REgISTER <strong>OF</strong> AUTHORISATIONS, ExEMPTIONS AND AqUACULTURE LEASES<br />
exemption No: 1812<br />
Applicant: All Fisheries Officers and those assisting<br />
Fisheries Officers.<br />
Period of Exemption: 28/09/2010 – 29/09/2999<br />
Provisions: Sections 43, 46, 47, 50, 51, 74, 79, 82, 86,<br />
88, 172 of the Fish Resources Management<br />
Act 1994 and sections 12, 14, 15, 16, 16b,<br />
16e, 22, 31, 32, 35, 36, 38d, 38h, 38i, 38j,<br />
38k, 38l, 38m, 38n, 38o, 41, 42, 45, 61,<br />
63, 64, 64c, 64e, 64o, 64oaa, 64od, 64s,<br />
117, 121, 123, 124, 124b 125 of the Fish<br />
Resources Management Regulations 1995.<br />
Purpose: To allow Fisheries and Marine Officers to<br />
undertake activities that may be required<br />
in order to investigate possible breaches of<br />
Fisheries legislation.<br />
exemption No: 1813<br />
Applicant: All Fisheries Officers and those assisting<br />
Fisheries Officers.<br />
Period of Exemption: 28/09/2010 – 29/09/2999<br />
Provisions: Sections 43, 46, 50 and 51 of the Fish<br />
Resources Management Act 1994 and<br />
regulations 12, 16e, 38d, 38h, 38i, 38j, 38k,<br />
38l, 38m, 38n, 38o, 44, 63, 64f, 64k, 64o,<br />
64od, 64s, 123 and 176 of the Fish Resources<br />
Management Regulations 1995.<br />
Purpose: To allow Fisheries and Marine Officers to<br />
relocate fish when necessary.<br />
184<br />
exemption No: 1814<br />
Applicant: Licensed Rock Lobster Processors<br />
Period of Exemption: 15/11/2010 – 31/08/2011<br />
Provisions: Section 46(b) of the Fish Resources<br />
Management Act 1994 which would otherwise<br />
prevent those persons from lawfully<br />
undertaking the research activities.<br />
Purpose: By allowing those persons to have in their<br />
possession tagged lobsters that are below<br />
the legal minimum size and/or are setose or<br />
berried.<br />
exemption No: 1815<br />
Applicant: Steven Da Silva<br />
Period of Exemption: 12/03/2010 – 12/03/2011<br />
Provisions: Fish Resources Management Act 1994, the<br />
Warnbro Sound Crab Management Plan 1995,<br />
and any other subsidiary legislation to the Fish<br />
Resources Management Act 1994.<br />
Purpose: The purpose of this Instrument is to permit Mr<br />
Steven Da Silva to continue his commercial<br />
crab fishing operation in the waters of the<br />
Warnbro Sound Crab Managed Fishery as<br />
described in Schedule 4 without a Warnbro<br />
Sound Crab Managed Fishery Licence.<br />
exemption No: 1816<br />
Applicant: Department of Fisheries<br />
Period of Exemption: 20/10/2010 – 31/08/2012<br />
Provisions: Gascoyne Demersal Scalefish Management<br />
Plan 2010.<br />
Purpose: To allow continued commercial near-shore net<br />
fishing in waters north of Long Point at Shark<br />
Bay and south of Red Bluff.
APPENDICES � STATE REgISTER <strong>OF</strong> AUTHORISATIONS, ExEMPTIONS AND AqUACULTURE LEASES<br />
exemption No: 1817<br />
Applicant: Department of Fisheries<br />
Period of Exemption: 20/10/2010 – 01/11/2012<br />
Provisions: Gascoyne Demersal Scalefish Management<br />
Plan 2010.<br />
Purpose: To permit the continued take and landing of<br />
non pink snapper demersal scalefish from<br />
prawn trawl nets in Shark Bay, following the<br />
implementation of the Gascoyne Demersal<br />
Scalefish Fishery.<br />
exemption No: 1818<br />
Applicant: Department of Fisheries<br />
Period of Exemption: 20/10/2010 – 01/11/2012<br />
Provisions: Gascoyne Demersal Scalefish Management<br />
Plan 2010.<br />
Purpose: To allow Fishing Boat Licence 1056 to<br />
continue to commercially fish out of Coral<br />
Bay without the need to hold a pink snapper<br />
entitlement.<br />
exemption No: 1819<br />
Applicant: Milari Aboriginal Corporation<br />
Period of Exemption: 21/10/2010 – 26/10/2010<br />
Provisions: Clause 4 of the Fish Traps Prohibition Notice<br />
1994 (Notice No. 677) and regulations<br />
64L(2), 117 and 118 of the Fish Resource<br />
Management Regulations 1995.<br />
Purpose: To take brown mud crabs (Scylla olivacea)<br />
and green mud crabs (Scylla serrata) with a<br />
combined maximum of twenty crab traps and<br />
drop nets.<br />
185<br />
exemption No: 1820<br />
Applicant: Antonino Paratore<br />
Period of Exemption: 27/10/2010 – 1/11/2010<br />
Provisions: Section 74 of the Fish Resources Management<br />
Act 1994.<br />
Purpose: To assist the Research Division, Department<br />
of Fisheries, in conducting the annual<br />
independent breeding stock survey required to<br />
monitor the sustainability of the rock lobster<br />
managed fishery.<br />
exemption No: 1821<br />
Applicant: Antonino La Macchia and Carmelo La Macchia<br />
Period of Exemption: 11/12/2009 – 30/06/2010 – Revoked New<br />
Exemption Issued<br />
Provisions: Regulations 31, 36, 117(1), 117(4), 117(6)<br />
and 121 of the Fish Resources Management<br />
Regulations 1995. Clause 4 and 7 of the West<br />
Coast Rock Lobster Management Plan 1993,<br />
Fish Trap Prohibition Notice 1994, and Fish<br />
Traps Restrictions Notice 1990.<br />
Purpose: To operate in the area described as Zone C<br />
of the West Coast Rock Lobster Managed<br />
Fishery.<br />
exemption No: 1822<br />
Applicant: Antonino La Macchia and Carmelo La Macchia<br />
Period of Exemption: 23/03/2010 – 30/06/2010<br />
Provisions: Regulations 31, 36, 117(1), 117(4), 117(6)<br />
and 121 of the Fish Resources Management<br />
Regulations 1995. Clause 4 and 7 of the West<br />
Coast Rock Lobster Management Plan 1993,<br />
Fish Trap Prohibition Notice 1994, and Fish<br />
Traps Restrictions Notice 1990.<br />
Purpose: To operate in the area described as Zone C<br />
of the West Coast Rock Lobster Managed<br />
Fishery.
APPENDICES � STATE REgISTER <strong>OF</strong> AUTHORISATIONS, ExEMPTIONS AND AqUACULTURE LEASES<br />
exemption No: 1823<br />
Applicant: All persons in Schedule 1 – University of<br />
Sydney<br />
Period of Exemption: 01/11/2010 – 30/04/2011<br />
Provisions: Sections 50(3) and 51(2) of the Fish<br />
Resources Management Act 1994, regulations<br />
16D and 64F of the Fish Resources<br />
Management Regulations 1995, North<br />
West and Kimberley Recreational Netting<br />
Restrictions Notice 1995 (Notice 691) and<br />
Notice 197.<br />
Purpose: University of Sydney research project on the<br />
effects of cane toads on catfish at Lake Argyle,<br />
WA.<br />
exemption No: 1824<br />
Applicant: The holders of Managed Fishery Licence No.<br />
2678 and persons acting on their behalf.<br />
Period of Exemption: 05/11/2010 – 05/11/2011<br />
Provisions: Northern Demersal Scalefish Management<br />
Plan 2000 and Exemption No. 373<br />
Purpose: Taking fish in connection with an Authority<br />
to Take Fish for Scientific Purposes granted<br />
pursuant to Regulation 178 of the Fish<br />
Resources Management Regulations 1995.<br />
exemption No: 1825<br />
Applicant: Ian John Rowland – Revoked New Exemption<br />
Issued<br />
Period of Exemption: 01/10/2010 – 30/09/2011<br />
Provisions: Regulations 31, 36, 117(1), 117(4), 117(6)<br />
and 121 of the Fish Resources Management<br />
Regulations 1995; clause 4, 7 12 and 12A of<br />
the West Coast Rock Lobster Management<br />
Plan 1993; the Fish Traps Prohibition Notice<br />
1994 ; and the Fish Traps Restricted Notice<br />
1990<br />
Purpose: To operate in the areas described as Zones<br />
A and B in the West Coast Rock Lobster<br />
Managed Fishery as if Mr Ian John Rowland<br />
was the holder of a licence in the fishery.<br />
186<br />
exemption No: 1826<br />
Applicant: Mr Antonino La Macchia and Mr Carmelo La<br />
Macchia – Revoked New Exemption Issued<br />
Period of Exemption: 01/10/2010 – 30/09/2011<br />
Provisions: Regulations 31, 36, 117(1), 117(4), 117(6)<br />
and 121 of the Fish Resources Management<br />
Regulations 1995; clause 4, 7 12 and 12A of<br />
the West Coast Rock Lobster Management Plan<br />
1993; the Fish Traps Prohibition Notice 1994 ;<br />
and the Fish Traps Restricted Notice 1990<br />
Purpose: To operate in the area described as Zone C of<br />
the West Coast Rock Lobster Managed Fishery<br />
as if Mr Antonino La Macchia and Mr Carmelo<br />
La Macchia were the holders of a licence in<br />
the fishery.<br />
exemption No: 1827<br />
Applicant: Commercial rock lobster fishers as described<br />
in Schedule 1.<br />
Period of Exemption: 15/11/2010 – 31/08/2011<br />
Provisions: Regulation 38(2) of the Fish Resources<br />
Regulations 1995 and clause 14 of the West<br />
Coast Rock Lobster Management Plan 1993.<br />
Purpose: To assist the Research Division, Department<br />
of Fisheries, in determining the complete sizerange<br />
of lobsters present in the various water<br />
depths and areas of the fishery.<br />
exemption No: 1828<br />
Applicant: All persons acting under the authority of a West<br />
Coast Rock Lobster Managed Fishery Licence<br />
Period of Exemption: 11/11/2010 – 30/06/2011<br />
Provisions: Clause 17 of the West Coast Demersal<br />
Scalefish Interim Management Plan 2007,<br />
clause 22 of the West Coast Demersal<br />
Scalefish Interim Management Plan 2007<br />
and regulation 45 of the Fish Resources<br />
Management Regulations 1995.<br />
Purpose: To permit a person specified in Schedule 1 to<br />
store and transport demersal scalefish taken<br />
as bycatch in a rock lobster pot.
APPENDICES � STATE REgISTER <strong>OF</strong> AUTHORISATIONS, ExEMPTIONS AND AqUACULTURE LEASES<br />
exemption No: 1829<br />
Applicant: Terry Cockman<br />
Period of Exemption: 22/11/2010 – 31/10/2011<br />
Provisions: Sections 43, 46, 50, 51 and 74 of the<br />
Fish Resources Management Act 1994 and<br />
regulations 12(1) and (2) of the Fish Resources<br />
Management Regulations 1995.<br />
Purpose: For the purposes of assisting the Fisheries<br />
Research Division in determining the dietary<br />
preferences of western rock lobsters in a<br />
range of depths in the centre of the fishery.<br />
exemption No: 1830<br />
Applicant: Ian John Rowland – Revoked New Exemption<br />
Issued<br />
Period of Exemption: 22/11/2010 – 30/09/2011<br />
Provisions: Regulations 31, 36, 117(1), 117(4), 117(6)<br />
and 121 of the Fish Resources Management<br />
Regulations 1995, clause 4, 7 12 and 12A of<br />
the West Coast Rock Lobster Management<br />
Plan 1993; the Fish Traps Prohibition Notice<br />
1994 (as amended); and the Fish Traps<br />
Restrictions Notice 1994.<br />
Purpose: To operate in the areas described as Zones<br />
A and B of the West Coast Rock Lobster<br />
Managed Fishery as if Mr Ian John Rowland<br />
was the holder of a licence in the fishery.<br />
exemption No: 1831<br />
Applicant: Holders of a Fish Processors Licence.<br />
Period of Exemption: 15/11/2010 – 31/08/2010<br />
Provisions: Regulation 64 (5A)<br />
Purpose: To exempt the holder of a Fish Processors<br />
Licence authorised to process western rock<br />
lobsters from submitting a weekly processors<br />
return as required under regulation 64 (5A)<br />
187<br />
exemption No: 1832<br />
Applicant: Ian John Rowland – Revoked New Exemption<br />
Issued<br />
Period of Exemption: 14/11/2010 – 30/09/2011<br />
Provisions: Regulations 31, 36, 117(1), 117(4), 117(6)<br />
and 121 of the Fish Resources Management<br />
Regulations 1995; clause 4, 7 12 and 12A of<br />
the West Coast Rock Lobster Management<br />
Plan 1993; the Fish Traps Prohibition Notice<br />
1994; and the Fish Traps Restrictions Notice<br />
1994.<br />
Purpose: To operate in the areas described as Zones<br />
A and B of the West Coast Rock Lobster<br />
Managed Fishery as if Mr Ian John Rowland<br />
was the holder of a licence in the fishery.<br />
exemption No: 1833<br />
Applicant: Antonino La Macchia and Carmelo La Macchia<br />
– Revoked New Exemption Issued<br />
Period of Exemption: 15/11/2010 – 30/09/2011<br />
Provisions: Regulations 31, 36, 117(1), 117(4), 117(6)<br />
and 121 of the Fish Resources Management<br />
Regulations 1995; clause 4, 7, 12 and 12A<br />
of the West Coast Rock Lobster Management<br />
Plan 1993; the Fish Traps Prohibition Notice<br />
1994; and the Fish Restrictions Notice 1994.<br />
Purpose: To operate in the areas described as Zones<br />
A and B of the West Coast Rock Lobster<br />
Managed Fishery as if Antonino La Macchia<br />
and Carmelo La Macchia were the holder of a<br />
licence in the fishery.
APPENDICES � STATE REgISTER <strong>OF</strong> AUTHORISATIONS, ExEMPTIONS AND AqUACULTURE LEASES<br />
exemption No: 1834<br />
Applicant: Cowaramup District High School<br />
Period of Exemption: 29/11/2010 – 02/12/2010<br />
Provisions: Regulation 123 of the Fish Resources<br />
Management Regulations 1995.<br />
Purpose: Recreational fishing by means of a line in a<br />
dam (known as Duggan’s Dam) on lot 302,<br />
Treeton Road, Cowaramup, as part of the<br />
Cape-to-Cape Catchment Council’s Community<br />
‘fish-down’ program.<br />
exemption No: 1835<br />
Applicant: Kimberley College of TAFE<br />
Period of Exemption: 01/12/2010 – 30/11/2013<br />
Provisions: Sections 46 and 50 of the Fish Resources<br />
Management Act 1994; regulations 16E,<br />
16M, 17A, 39(1), 64K, 64L(2), 64OB 64X,<br />
64ZG and 64ZK; clause 5 of Kimberley Gillnet<br />
Management Plan; clause 5 of the Specimen<br />
Shell Management Plan 1995; and clause 5<br />
of the North West and Kimberley Recreational<br />
Netting Notice.<br />
Purpose: The taking of the specified number or quantity<br />
of the fish listed in the following table, from<br />
the collection area described, using the<br />
method described.<br />
exemption No: 1836<br />
Applicant: Jennifer Kelley and Monica Gagliano<br />
Period of Exemption: 06/12/2010 - 13/12/2010<br />
Provisions: Section 50(3) and 51(2) of the Fish Resources<br />
Management Act 1994 and regulations 64F,<br />
64K, 640B and 123 of the Fish Resources<br />
Management Regulations 1995.<br />
Purpose: Determining whether natural shoals of<br />
rainbowfish are assorted by their colour<br />
patterns, and for molecular studies of fish<br />
colour vision.<br />
188<br />
exemption No: 1837<br />
Applicant: Ron Young<br />
Period of Exemption: 20/12/2010 – 21/01/2011<br />
Provisions: Section 50 of the Fish Resources Management<br />
Act 1994 and regulation 64ZAA of the Fish<br />
Resources Management Regulations 1995.<br />
Purpose: For the purposes of investigating the levels of<br />
heavy metals (mercury, cadmium and lead) in<br />
the tissue of the bivalve, Katelysia scalarina.<br />
exemption No: 1838<br />
Applicant: Guiseppe Pittorini<br />
Period of Exemption: 17/12/2010 – 31/08/2011<br />
Provisions: Sections.43, 50(2), 51(3) and section 74 of<br />
the Fish Resources Management Act 1994.<br />
Purpose: To retain and land sharks taken as bycatch<br />
in rock lobster pots while fishing for rock<br />
lobster under the authority of West Coast Rock<br />
Lobster Management Plan 1993.<br />
exemption No: 1839<br />
Applicant: West Coast Demersal Scalefish Licence<br />
Holders<br />
Period of Exemption: 21/12/2010 – 31/12/2011<br />
Provisions: West Coast Demersal Scalefish Interim<br />
Management Plan 2007, Prohibition on<br />
Commercial Fishing (South West Coast Beach<br />
Bait Net) Order 2010.<br />
Purpose: To permit the persons listed in Schedule 1 to<br />
carry out the activity described in Schedule 2,<br />
pursuant to section 7(2) of the Fish Resources<br />
Management Act 1994.
APPENDICES � STATE REgISTER <strong>OF</strong> AUTHORISATIONS, ExEMPTIONS AND AqUACULTURE LEASES<br />
exemption No: 1840<br />
Applicant: Fremantle Port Authority<br />
Period of Exemption: 22/12/2010 – 01/11/2011<br />
Provisions: Section 50(3) of the Fish Resources<br />
Management Act 1994, regulations 63 and 64L<br />
of the Fish Resources Management Regulations<br />
1995, the Recreational Fishing (Permitted<br />
Fishing Methods) Order 1991 Order No. 527,<br />
and the Fish Traps Prohibition Order 1994<br />
Order No. 6.<br />
Purpose: For the purposes of assisting the Research<br />
Division, Department of Fisheries, to monitor<br />
for introduced marine pest crab species at<br />
Fremantle Port.<br />
exemption No: 1841<br />
Applicant: Port Hedland Port Authority<br />
Period of Exemption: 22/12/2010 – 01/11/2011<br />
Provisions: Section 50(3) of the Fish Resources<br />
Management Act 1994, regulations 63 and 64L<br />
of the Fish Resources Management Regulations<br />
1995, the Recreational Fishing (Permitted<br />
Fishing Methods) Order 1991 Order No. 527,<br />
and the Fish Traps Prohibition Order 1994<br />
Order No. 6.<br />
Purpose: For the purposes of assisting the Research<br />
Division, Department of Fisheries, to monitor<br />
for introduced marine pest crab species at<br />
Port Hedland.<br />
exemption No: 1842 – cancelled<br />
189<br />
exemption No: 1843<br />
Applicant: Dampier Port Authority<br />
Period of Exemption: 22/12/2010 – 01/11/2011<br />
Provisions: Section 50(3) of the Fish Resources<br />
Management Act 1994, regulations 63 and 64L<br />
of the Fish Resources Management Regulations<br />
1995, the Recreational Fishing (Permitted<br />
Fishing Methods) Order 1991 Order No. 527,<br />
and the Fish Traps Prohibition Order 1994<br />
Order No. 6.<br />
Purpose: For the purposes of assisting the Research<br />
Division, Department of Fisheries, to monitor<br />
for introduced marine pest crab species at<br />
Dampier Port.<br />
exemption No: 1844<br />
Applicant: Department of Fisheries/Australian Institute of<br />
Marine Science/University of Western Australia<br />
Period of Exemption: 29/12/2010 – 15/01/2012<br />
Provisions: Schedule 1 from the provisions of Section 46<br />
and 47 of the Fish Resources Management Act<br />
1994 and regulation 10 of the Fish Resources<br />
Management Regulations 1995.<br />
Purpose: For the purposes investigating the macro-algal<br />
and seagrass ecology of the Montgomery Reef<br />
and Kimberley coastline.<br />
exemption No: 1845<br />
Applicant: Department of Fisheries / UWA<br />
Period of Exemption: 29/12/2010 – 31/05/2011<br />
Provisions: Schedule 1 from the provisions of Sections43,<br />
46, 50(3) and 51(2) of the Fish Resources<br />
Management Act 1994 and regulations 64F,<br />
64K, 64OB and 123 of the Fish Resources<br />
Management Regulations 1995.<br />
Purpose: For the purposes of generating a novel<br />
understanding of the physiological trade-offs<br />
and costs underlying animal adaptation to<br />
variable environments.
APPENDICES � STATE REgISTER <strong>OF</strong> AUTHORISATIONS, ExEMPTIONS AND AqUACULTURE LEASES<br />
exemption No: 1846<br />
Applicant: Ms Holly Hunter and Dr Mike van Keulen of the<br />
University of Western Australia<br />
Period of Exemption: 31/12/2010 – 30/04/2011<br />
Provisions: Schedule 1 from the provisions of Section 46<br />
and 47 of the Fish Resources Management Act<br />
1994 and regulation 10 of the Fish Resources<br />
Management Regulations 1995.<br />
Purpose: For the purposes of developing a hard coral<br />
species list, determining the percentage<br />
cover for each species and assessing coral<br />
spawning.<br />
exemption No: 1847<br />
Applicant: Mr Wally Gibb, Dr James O’Shea and Mr Tom<br />
Stewart of the University of Western Australia<br />
Period of Exemption: 30/12/2010 - 22/01/2011<br />
Provisions: Schedule 1 from the provisions of Section<br />
50(3) of the Fish Resources Management Act<br />
1994 and regulation 123 of the Fish Resources<br />
Management Regulations 1995.<br />
Purpose: To collect up to a total of 100 juvenile sharks<br />
using 4 to 4.5-inch mesh monofilament gill<br />
nets set close to shore in shallow sandy<br />
areas near the mangrove zone in Giralia Bay,<br />
Exmouth.<br />
exemption No: 1848<br />
Applicant: Coral World Australia PTY LTD<br />
Period of Exemption: 24/12/2010 - 31/12/2015<br />
Provisions: Sections 43(3), 46, 50(3) and 51(2) of the<br />
Fish Resources Management Act 1994.<br />
Purpose: Fishing for and taking of fish from Western<br />
Australian waters, including fish smaller<br />
than the sizes set out in subdivision 2 of<br />
schedule 2 of the Fish Resources Management<br />
Regulations 1995, of the number/s and<br />
scientific classification/s as listed in Annex 1.<br />
190<br />
exemption No: 1849<br />
Applicant: All Holders of a Recreational Boat Fishing<br />
Licence<br />
Period of Exemption: 01/01/2011 - 31/12/2011<br />
Provisions: Section 46 of the Fish Resources Management<br />
Act 1994.<br />
Purpose: To bring pink snapper of a length equal to, or<br />
greater than, 410mm when taken from the<br />
waters north of 31 degrees 0 minutes south<br />
latitude onto land that is south of 31 degrees<br />
0 minutes south latitude.<br />
exemption No: 1850<br />
Applicant: Charlotte Johansson and Dr Martial<br />
Depczynski<br />
Period of Exemption: 01/02/2011 - 31/03/2012<br />
Provisions: Sections 50(3) and 51(2) of the Fish<br />
Resources Management Act 1994.<br />
Purpose: To collect up to a maximum of 500 sea urchins<br />
and macro-algae by tethering techniques and<br />
filming predation and feeding events.<br />
exemption No: 1851 – cancelled<br />
exemption No: 1852 – cancelled<br />
exemption No: 1853 – cancelled<br />
exemption No: 1854 – cancelled
APPENDICES � STATE REgISTER <strong>OF</strong> AUTHORISATIONS, ExEMPTIONS AND AqUACULTURE LEASES<br />
exemption No: 1855<br />
Applicant: Department of Water employees as described<br />
in Schedule 1.<br />
Period of Exemption: 01/02/2011 - 31/05/2011<br />
Provisions: Schedule 1 from the provisions of Sections<br />
43, 46(a) and (b), 50 (3) and 51 (2) of the Fish<br />
Resources Management Act 1994.<br />
Purpose: To sample by trapping, fyke nets and electrofishing,<br />
using Department of Fisheries/<br />
Department of Environment and Conservationdeveloped<br />
‘turtle safe methods’, the Gingin<br />
Brook and Lennard Brook for the species listed<br />
in Schedule 2.<br />
exemption No: 1856<br />
Applicant: Department of Water employees as described<br />
in Schedule 1.<br />
Period of Exemption: 01/02/2011 - 31/05/2011<br />
Provisions: Schedule 1 from the provisions of Sections<br />
43, 46(a) and (b), 50(3) and 51(2) of the Fish<br />
Resources Management Act 1994.<br />
Purpose: To sample by trapping, fyke nets and electrofishing,<br />
using Department of Fisheries/<br />
Department of Environment and Conservationdeveloped<br />
‘turtle safe methods’, the following<br />
river systems for the species listed in<br />
Schedule 2.<br />
exemption No: 1857<br />
Applicant: Department of Water employees as described<br />
in Schedule 1.<br />
Period of Exemption: 01/04/2011 - 28/02/2013<br />
Provisions: Schedule 1 from the provisions of Sections<br />
43, 46(a) and (b), 50(3) and 51(2) of the Fish<br />
Resources Management Act 1994.<br />
Purpose: To sample by trapping, fyke nets and electrofishing,<br />
using Department of Fisheries/<br />
Department of Environment and Conservationdeveloped<br />
‘turtle safe methods’, the Swan-<br />
Canning catchments listed in Schedule 2 for<br />
the species listed in Schedule 2.<br />
191<br />
exemption No: 1858<br />
Applicant: Marine Farms Ltd<br />
Period of Exemption: 08/02/2011 - 10/05/2013<br />
Provisions: Sections 50 and 51 of the Fish Resources<br />
Management Act 1994 and regulations 117<br />
and 121 of the Fish Resources Management<br />
Regulations 1995.<br />
Purpose: Collect coral trout, barcheek coral trout,<br />
bluespotted coral trout and mangrove jack by<br />
hook and line; collect octopus by hand, scoop<br />
net or hooked instrument held by hand or traps<br />
for broodstock purposes; to revoke Marine<br />
Farms Ltd previous exemption<br />
exemption No: 1859<br />
Applicant: Employees of the Water Corporation<br />
Period of Exemption: 11/02/2011 - 18/11/2011<br />
Provisions: Fish Resources Management Act 1994 and its<br />
subsidiary legislation.<br />
Purpose: The take, landing and possession of any<br />
number of marron, of any carapace size,<br />
including ‘berried’ females, by any means.<br />
exemption No: 1860<br />
Applicant: Curtin University Staff<br />
Period of Exemption: 14/02/2011 - 30/06/2011<br />
Provisions: Section 43, 50(3) and 51(2) of the Fish<br />
Resources Management Act 1994.<br />
Purpose: To collect, by snorkelling, 50 whelks at each of<br />
the sites described in Schedule 2.
APPENDICES � STATE REgISTER <strong>OF</strong> AUTHORISATIONS, ExEMPTIONS AND AqUACULTURE LEASES<br />
exemption No: 1861<br />
Applicant: Allegretta Holdings Pty Ltd – Revoked<br />
Period of Exemption: 08/07/2010 - 10/07/2011<br />
Provisions: Fish Resources Management Act 1994, the<br />
Fish Resources Management Regulations<br />
1995 and the Cockburn Sound (Line and Pot)<br />
Management Plan 1995 and any subsidiary<br />
legislation.<br />
Purpose: For the purpose of using a boat which is<br />
licensed in the Cockburn Sound (Line and<br />
Pot) Managed Fishery but which is greater, in<br />
measured length, than that provided for in the<br />
Cockburn Sound (Line and Pot) Management<br />
Plan 1995.<br />
exemption No: 1862<br />
Applicant: Annette Koenders, laboratory technician,<br />
demonstrator and students of Unit SCB3322<br />
from Edith Cowan University.<br />
Period of Exemption: 01/03/2011 - 31/05/2011<br />
Provisions: Section 43, 50 and 51 of the Fish Resources<br />
Management Act 1994.<br />
Purpose: Collection by hand at low tide of a maximum<br />
of 12 specimens each of molluscs (except<br />
abalone), annelids, echinoderms and ascidians<br />
from Yanchep Lagoon.<br />
exemption No: 1863 – cancelled<br />
exemption No: 1864<br />
Applicant: Andrew Heyward, James Gilmour, Kin Brooks,<br />
Jamie Colquhoun, Tim Cooper and Paul Tinkler<br />
of the Australian Institute of Marine Science<br />
Period of Exemption: 17/02/2011 - 30/06/2011<br />
Provisions: Section 43, 50(3) and 51(2) of the Fish<br />
Resources Management Act 1994.<br />
Purpose: For purposes of assessing the status of<br />
shallow water biological communities at<br />
Seringapatam Reef and Scott Reef.<br />
192<br />
exemption No: 1865<br />
Applicant: Peter Coulson of Murdoch University<br />
Period of Exemption: 17/02/2011 - 30/04/2011<br />
Provisions: Section 46, 50 and 51 of the Fish Resources<br />
Management Act 1994 and South West<br />
Trawl Management Plan (Notice No. 403),<br />
the Recreational Fishing (Permitted Fishing<br />
Methods) Notice 1991 and Notice No. 527.<br />
Purpose: For the purposes of determining the age,<br />
growth and reproductive biology of the<br />
longspine flathead (Platycepahlus longispinis).<br />
exemption No: 1866<br />
Applicant: Department of Fisheries staff<br />
Period of Exemption: 04/03/2011 - 04/03/2012<br />
Provisions: Sections 43, 46, 50 and 51 of the Fish<br />
Resources Management Act 1994 and<br />
regulations 38G, 38H, 38I, 38K, 38L, 38M,<br />
38O, 43, 44, 53, 64F, 64O, 64S, 64T, 64ZH,<br />
124 & 176 of the Fish Resources Management<br />
Regulations 1995.<br />
Purpose: For the purpose of de-stocking marron from<br />
Samson Brook Dam and moving them to<br />
Drakes Brook Dam. Then moving marron from<br />
Drakes Brook Dam to Samson Brook Dam,<br />
following return of sufficient water levels in<br />
Samson Brook Dam.<br />
exemption No: 1867 – cancelled
APPENDICES � STATE REgISTER <strong>OF</strong> AUTHORISATIONS, ExEMPTIONS AND AqUACULTURE LEASES<br />
exemption No: 1868<br />
Applicant: Mr Wally Gibb, Dr Jennifer Rodger and Mr Tom<br />
Stewart of the University of Western Australia<br />
Period of Exemption: 21/03/2011 - 25/03/2011<br />
Provisions: Sections 43(3), 46, 50 and 51 of the Fish<br />
Resources Management Act 1994.<br />
Purpose: To collect a maximum of eight of each of the<br />
following species - black bream, Perth herring,<br />
yellowtail, mullet and toadfish - using nets<br />
from a boat in the Swan River, in the vicinity of<br />
Shelley Traffic Bridge<br />
exemption No: 1869<br />
Applicant: Craig Astbury<br />
Period of Exemption: 14/03/2011 - 30/06/2011<br />
Provisions: Section 50(3) and 51(2) of the Fish Resources<br />
Management Act 1994.<br />
Purpose: To take and retain invertebrate and algal<br />
specimens collected during diving activities.<br />
The collection entails divers scraping off<br />
biofouling, containing invertebrates and algae,<br />
from pylons and other wharf structures within<br />
port waters.<br />
exemption No: 1870<br />
Applicant: Dr Thomas Wernberg, Tim Langlois, Thibault de<br />
Bettignies, Margie Mohring and Matt Fraser.<br />
Period of Exemption: 22/03/2011 - 05/05/2011<br />
Provisions: Sections 50(3) and 51(2) of the Fish<br />
Resources Management Act 1994 and<br />
regulation 113A (1) and (2) of the Fish<br />
Resources management Regulations 1995.<br />
Purpose: To collect by hand while snorkelling one each<br />
of red, brown and green algae per student from<br />
the Cottesloe Fish Habitat Protection Area.<br />
193<br />
exemption No: 9901<br />
Applicant: Ian John Rowland<br />
Period of Exemption: 01/10/2010 - 30/09/2011<br />
Provisions: Regulations 31, 36, 117(1), 117(4), 117(6)<br />
and 121 of the Fish Resources Management<br />
Regulations 1995; clause 4, 7 12 and 12A of<br />
the West Coast Rock Lobster Management<br />
Plan 1993; the Fish Traps Prohibition Notice<br />
1994 ; and the Fish Traps Restricted Notice<br />
1990.<br />
Purpose: To operate in the areas described as Zones<br />
A and B in the West Coast Rock Lobster<br />
Managed Fishery as if Mr Ian John Rowland<br />
was the holder of a licence in the fishery.<br />
exemption No: 9902<br />
Applicant: Antonino La Macchia and Carmelo La Macchia<br />
Period of Exemption: 01/10/2010 - 30/09/2011<br />
Provisions: Regulations 31, 36, 117(1), 117(4), 117(6)<br />
and 121 of the Fish Resources Management<br />
Regulations 1995; Clause 4, 7 12 and 12A<br />
of the West Coast Rock Lobster Management<br />
Plan 1993; the Fish Traps Prohibition Notice<br />
1994 ; and the Fish Traps Restricted Notice<br />
1990.<br />
Purpose: To operate in the areas described as Zones<br />
A and B in the West Coast Rock Lobster<br />
Managed Fishery as if Mr Ian John Rowland<br />
was the holder of a licence in the fishery.<br />
exemption No: 1871 – revoked<br />
Applicant: Ngalang Boodja Enterprises Pty Ltd<br />
Period of Exemption: 09/03/2011 - 10/03/2012<br />
Provisions: Sections 46, 47, 50, 51 and 90 of the<br />
Fish Resources Management Act 1994 and<br />
regulation 10, Schedule 2 Part 1 of the Fish<br />
Resources Management Regulations 1995.<br />
Purpose: For the purposes of enabling the harvesting<br />
and sale of marron (Cherax cainii) without an<br />
Aquaculture Licence.
APPENDICES � STATE REgISTER <strong>OF</strong> AUTHORISATIONS, ExEMPTIONS AND AqUACULTURE LEASES<br />
exemption No: 1872<br />
Applicant: Mr Steven Da Silva<br />
Period of Exemption: 22/03/2011 – 12/03/2013<br />
Provisions: Fish Resources Management Act 1994, the Fish<br />
Resources Management Regulations 1995,<br />
the Warnbro Sound Crab Limited Entry Fishery<br />
Notice 1995 and the Fish Traps Prohibition<br />
Notice 1994 No. 677.<br />
Purpose: To permit the applicant to undertake crab<br />
potting in the Warnbro Sound Crab Managed<br />
Fishery without a Managed Fishery Licence.<br />
exemption No: 1873<br />
Applicant: Glen Whisson and Simon Longbottom of Curtin<br />
University<br />
Period of Exemption: 13/03/2011 - 30/06/2012<br />
Provisions: Sections 46, 50(3) and 51(2) of the Fish<br />
Resources Management Act 1994.<br />
Purpose: For the purposes of investigating macroinvertebrate<br />
diversity in deep water off<br />
Rottnest Island using artificial habitat<br />
collectors.<br />
exemption No: 1874<br />
Applicant: Mark Langdon and Dr Mike van Keulen of<br />
Murdoch University<br />
Period of Exemption: 01/05/2011 - 31/12/2011<br />
Provisions: Section 50(3) and 51(2) of the Fish Resources<br />
Management Act 1994.<br />
Purpose: For the purposes of studying the various<br />
factors affecting the ecology of urchins in the<br />
lagoonal coral reef habitats of the Ningaloo<br />
Marine Park.<br />
194<br />
exemption No: 1875<br />
Applicant: NM and AM Lucas<br />
Period of Exemption: 01/04/2011 - 31/03/2014<br />
Provisions: Fish Traps Prohibition Notice 1994 (Notice No.<br />
677) and the Fish Traps Restriction Notice<br />
1990 (Notice No. 462).<br />
Purpose: To explore and/or develop the crab fishery<br />
and fishing technology of that activity under<br />
the provision of Section 7(3)(c) of the Fish<br />
Resources Management Act 1994.<br />
exemption No: 1876<br />
Applicant: Adrian Neil Templeman<br />
Period of Exemption: 01/04/2011 - 31/03/2014<br />
Provisions: Fish Traps Prohibition Notice 1994 (Notice No.<br />
677) and the Fish Traps Restriction Notice<br />
1990 (Notice No. 462).<br />
Purpose: To explore and/or develop the crab fishery<br />
and fishing technology of that activity under<br />
the provision of Section 7(3)(c) of the Fish<br />
Resources Management Act 1994 and to<br />
gather baseline data about inshore crab<br />
stocks in the waters of the Mandurah to<br />
Bunbury<br />
exemption No: 1877<br />
Applicant: Stephen Conrad Steward Chase and Glen<br />
Underhay of Worley Parsons Pty Ltd<br />
Period of Exemption: 06/04/2011 - 30/06/2011<br />
Provisions: Section 50(3) and 51(2) of the Fish Resources<br />
Management Act 1995.<br />
Purpose: For the purpose of assisting the Research<br />
Division, Department of Fisheries, to monitor<br />
for introduced marine pest species at the<br />
Dampier and Port Hedland ports.
APPENDICES � STATE REgISTER <strong>OF</strong> AUTHORISATIONS, ExEMPTIONS AND AqUACULTURE LEASES<br />
exemption No: 1878<br />
Applicant: West Coast Rock Lobster Managed Fishery<br />
Licence numbers 1060, 1095, 1152, 1159,<br />
1161, 1229, 1312, 1400, 1414, 1447, 1597,<br />
1647, 1786, 1873, 2232, 2233, 2241 and<br />
2245.<br />
Period of Exemption: 22/03/2011 - 30/09/2011<br />
Provisions: Regulation 117(1) of the Fish Resources<br />
Management Regulations 1995 and clauses<br />
4(1)b, 12 and 12A of the West Coast Rock<br />
Lobster Management Plan 1993.<br />
Purpose: To allow the holder of a West Coast Rock<br />
Lobster Managed Fishery Licence to operate in<br />
the fishery when the usual entitlement is less<br />
than 63 units.<br />
exemption No: 1879<br />
Applicant: Lance Litchfield<br />
Period of Exemption: 11/04/2011- 21/04/2011<br />
Provisions: Regulation 38(2) of the Fish Resources<br />
Management Regulations 1995 and clause 14<br />
of the West Coast Rock Lobster Management<br />
Plan 1993.<br />
Purpose: For the purposes of assisting the Research<br />
Division, Department of Fisheries, in<br />
conducting a small-scale stock assessment of<br />
the nearshore reef system.<br />
195<br />
exemption No: 1880<br />
Applicant: Dr David Morgan<br />
Stefania Basile<br />
Dr Alan Lymbery<br />
Dr Stephen Beatty<br />
Mark Allen<br />
Michael Kluzinger<br />
James Keleher<br />
Period of Exemption: 12/04/2011 - 01/03/2012<br />
Provisions: Section 50(3) and 51(2) of the Fish Resources<br />
Management Act 1994.<br />
Purpose: For the purposes of determining the ecological<br />
impacts of the introduced parasite Lemaea<br />
cyprinacea on native and feral fishes of the<br />
south-west of Western Australia.<br />
exemption No: 1881<br />
Applicant: Jane Prince<br />
Wally Gibb<br />
Tom Stewart<br />
Period of Exemption: 12/04/2011 - 01/05/2011<br />
Provisions: Sections 43, 50(3) and 51(2) of the Fish<br />
Resources Management Act 1994 and<br />
regulation 38D of the Fish Resources<br />
Management Regulations 1995.<br />
Purpose: For the purposes of collecting specimens for<br />
undergraduate teaching.<br />
exemption No: 1882<br />
Applicant: Staff members of the CSIRO and Olivier<br />
Lasbouygues from AgroParis Tech, France<br />
Period of Exemption: 15/04/2011 - 31/12/2012<br />
Provisions: Sections 43, 46, 50(3) and 51(2) of the<br />
Fish Resources Management Act 1994,<br />
and regulations 38D and 123 of the Fish<br />
Resources Management Regulations 1995.<br />
Purpose: To characterise key habitats and associated<br />
flora and fauna at risk of rising sea levels,<br />
and develop models to predict the effects<br />
of changing climate on the Shark Bay World<br />
Heritage Area.
APPENDICES � STATE REgISTER <strong>OF</strong> AUTHORISATIONS, ExEMPTIONS AND AqUACULTURE LEASES<br />
exemption No: 1883<br />
Applicant: Staff members of CSIRO and Olivier<br />
Lasbouygues from AgroParis Tech, France<br />
Period of Exemption: 15/04/2011 - 01/06/2011<br />
Provisions: Sections 43, 46, 50(3) and 51(2) of the<br />
Fish Resources Management Act 1994 and<br />
regulations 38D, 38E and 123 of the Fish<br />
Resources Management Regulations 1995.<br />
Purpose: To look at the use of biochemical tracers to<br />
predict ecological interactions.<br />
exemption No: 1884<br />
Applicant: Danielle Lucock of Murdoch University<br />
Period of Exemption: 15/04/2011 - 10/12/2011<br />
Provisions: Section 50(3) and 51(2) of the Fish Resources<br />
Management Act 1994.<br />
Purpose: For the purposes of studying the effects of<br />
atmospheric carbon dioxide on epiphytes<br />
residing on one seagrass species in shallow<br />
waters.<br />
exemption No: 1885<br />
Applicant: Malcolm McCulloch, Alex Piekutowski, Jessie<br />
Short and Taryn Foster of the University of<br />
Western Australia.<br />
Period of Exemption: 03/05/2011 – 01/05/2014<br />
Provisions: Sections 43, 50(3) and 51(2) of the Fish<br />
Resources Management Act 1994.<br />
Purpose: For the purposes of obtaining in situ<br />
calcification rates of corals and calcifying algae<br />
in Western Australia.<br />
196<br />
exemption No: 1886<br />
Applicant: Fernando Smilovitis<br />
Period of Exemption: 03/05/2011 – 31/12/2011<br />
Provisions: Sections 79 and 82 of the Fish Resources<br />
Management Act 1994.<br />
Purpose: To permit the processing of fish other than<br />
rock lobster, prawns and abalone at 4<br />
Wandeara Crescent, Mundaring, without the<br />
establishment having a Fish Processing Permit<br />
and a Fish Processor’s Licence.<br />
exemption No: 1887<br />
Applicant: Emama Nguda Aboriginal Corporation<br />
Period of Exemption: 11/05/2011 - 01/05/2014<br />
Provisions: Clause 4 of the Fish Traps Prohibition Notice<br />
1994 (Notice No. 677).<br />
Purpose: To enable Emama Nguda Aboriginal<br />
Corporation to continue fishing for mud crabs<br />
until alternative management arrangements for<br />
commercial mud crab fishing are implemented.<br />
exemption No: 1888<br />
Applicant: Peter Coulson, Elena Sulin, Ben French, David<br />
Fairclough, Mark Davidson, Kim Clayton and<br />
Tim Leary<br />
Period of Exemption: 06/05/2011 - 31/12/2011<br />
Provisions: Sections 50(3) and 51(2) of the Fish<br />
Resources Management Act 1994.<br />
Purpose: For the purposes of investigating the biological<br />
characteristics of Bight redfish, longsnout<br />
boarfish, yellow-spotted boarfish and knifejaw<br />
assemblages in southern Western Australia.
APPENDICES � STATE REgISTER <strong>OF</strong> AUTHORISATIONS, ExEMPTIONS AND AqUACULTURE LEASES<br />
exemption No: 1889<br />
Applicant: David Morgan and Brendan Ebner<br />
Period of Exemption: 16/05/2011 - 01/06/2011<br />
Provisions: Sections 43, 46, 50(3) and 51(2) of the<br />
Fish Resources Management Act 1994 and<br />
regulations 44, 64F, 64H, 64K, 64O, 123<br />
and 124 of the Fish Resources Management<br />
Regulations 1995.<br />
Purpose: For the purpose of establishing the importance<br />
of the fish community in the Pentecost River<br />
including Emma Gorge. These data will enable<br />
assessment of ‘before-and-after’ cane toad<br />
impacts including in the context of cane toad<br />
exclusion areas (Emma Gorge).<br />
exemption No: 1890<br />
Applicant: Ian Dapson, Jenifer Verduin, Mike van Keulen,<br />
Mike Taylor, Steven Goynich, Rhiannon Jones<br />
and others.<br />
Period of Exemption: 16/05/2011 - 01/02/2012<br />
Provisions: Sections 50 (3), 51 (2) and 46(a) and (b) of<br />
the Fish Resources Management Act 1994.<br />
Purpose: For the purposes of studying the return of<br />
ecosystem functionality within transplanted<br />
seagrass through the return of invertebrate<br />
fauna.<br />
exemption No: 1891<br />
Applicant: Abrolhos Pearls (WA) Pty Ltd<br />
Period of Exemption: 23/05/2011 - 01/05/2012<br />
Provisions: Sections 90 and 91 of the Fish Resources<br />
Management Act 1994.<br />
Purpose: For the purposes of conducting hatchery<br />
operations for pearl oyster spat on a barge.<br />
197<br />
exemption No: 1892<br />
Applicant: Michael Allen, Terry Brooks, Shepherd<br />
Chipfunde and Gregory Warburton<br />
Period of Exemption: 26/05/2011 - 30/06/2011<br />
Provisions: Section 43, 46(a) & (b), 50 (3) and 51 (2) of<br />
the Fish Resources Management Act 1994 and<br />
regulations 38H, 38M, 38O, 44, 64 and 123 of<br />
the Fish Resources Management Regulations<br />
1995.<br />
Purpose: For the purposes of assessing the ecological<br />
impact of sediment removal from Gwambygine<br />
Pool on the Avon River.<br />
exemption No: 1893<br />
Applicant: West Coast Rock Lobster Managed Fishery<br />
holder numbers 1060, 1095, 1152, 1159,<br />
1161, 1229, 1312 and 1400, 1414, 1447,<br />
1597, 1647, 1786, 1873, 2232, 2233, 2241<br />
and 2245<br />
Period of Exemption: 22/03/2011 - 30/09/2011<br />
Provisions: Regulation 117(1) of the Fish Resources<br />
Management Regulations 1995, clause 4(1)b<br />
of the West Coast Rock Lobster Management<br />
Plan 1993 and clause 12 and 12A of the West<br />
Coast Rock Lobster Management Plan 1993.<br />
Purpose: Operating in the West Coast Rock Lobster<br />
Managed Fishery when the usual entitlement<br />
on the Managed Fishery Licence is less than<br />
63 units.<br />
exemption No: 1894<br />
Applicant: Ngalang Boodja Enterprises Pty Ltd<br />
Period of Exemption: 27/05/2011 - 31/05/2012<br />
Provisions: Sections 46, 47, 50, 51 and 90 of the<br />
Fish Resources Management Act 1994 and<br />
regulation 10, Schedule 2 Part 1 of the Fish<br />
Resources Management Regulations 1995.<br />
Purpose: For the purposes of enabling the harvesting<br />
and sale of marron (Cherax cainii) without an<br />
Aquaculture Licence.
APPENDICES � STATE REgISTER <strong>OF</strong> AUTHORISATIONS, ExEMPTIONS AND AqUACULTURE LEASES<br />
exemption No: 1895<br />
Applicant: Dr Miles Parsons, David Fairclough, Ian<br />
Keay, Brett Crisafulli, Paul Lewis and Simon<br />
Longbottom.<br />
Period of Exemption: 03/06/2011 - 31/05/2012<br />
Provisions: Sections 46(a) and (b), 50(3) and 51(2) of<br />
the Fish Resources Management Act 1994<br />
and regulations 45, 123 and 124B of the Fish<br />
Resources Management Regulations 1995.<br />
Purpose: For the purposes of studying passive acoustic<br />
techniques to monitor aggregations of sound<br />
producing fish species<br />
198<br />
exemption No: 1896<br />
Applicant: Professor Shaun Collin<br />
Professor Ian Potter<br />
Dr David Morgan<br />
Dr Howard Gill<br />
Dr Stephen Beatty<br />
Professor David Hunt<br />
Associate Professor Nathan Hart<br />
Miss Simone Niedermueller (PhD student)<br />
Miss Caroline Kerr (Research Associate)<br />
Miss Fanny de Busserolles (PhD student)<br />
Mr. Eduardo Garza Gisholt (PhD student)<br />
Miss Amy Newman (PhD student)<br />
Mr. Ryan Kempster (PhD student)<br />
Miss Barbara Wueringer (PhD student)<br />
Mr. Joao Paulo Coimbra (PhD student)<br />
Dr Shelby Temple<br />
Mr. Carlos Salas Lopez (PhD student)<br />
Mr. Lee Fletcher (Hans student)<br />
Period of Exemption: 03/06/2011 - 31/05/2013<br />
Provisions: Sections 50 (3) and 51 (2) of the Fish<br />
Resources Management Act 1994 and<br />
regulations 64O, 123 and 124 of the Fish<br />
Resources Management Regulations 1995.<br />
Purpose: For the purposes of studying the evolution of<br />
vertebrate light detection.<br />
exemption No: 1897<br />
Applicant: Mike van Keulen<br />
Period of Exemption: 18/06/2011 - 29/06/2011<br />
Provisions: Sections 50(3) and 51(2) of the Fish<br />
Resources Management Act 1994.<br />
Purpose: To collect by hand, net or light trap, only those<br />
amounts of macroalgae and benthic and<br />
planktonic invertebrates necessary to develop<br />
group reference collections for identification<br />
and physiological work, from Ningaloo Marine<br />
Park.
APPENDICES � STATE REgISTER <strong>OF</strong> AUTHORISATIONS, ExEMPTIONS AND AqUACULTURE LEASES<br />
exemption No: 1898<br />
Applicant: Western Australia 2011 Pty Ltd<br />
Period of Exemption: 12/11/2010 - 19/12/2010<br />
Provisions: Order number 11 of 2007 - Prohibition on<br />
Fishing (Coral, ‘Live Rock’ and Algae) and<br />
Clause 5 and 10 of the South West Trawl<br />
Management Plan.<br />
Purpose: Taking by trawl, sea-grass, kelp and other<br />
marine plants and algae from the area<br />
adjacent to Fremantle in Western Australia.<br />
exemption No: 1899<br />
Applicant: Fishing Boat Licence numbers 1005, 1292,<br />
1363, 1938, 2348 and 2451<br />
Period of Exemption: 10/06/2011 - 10/06/2014<br />
Provisions: Schedule 4 of the Notice Number 366, and<br />
only clause 2 of the Prohibition on Fishing<br />
(Diving) Order 1999 (Order Number 3 of 1999)<br />
Purpose: To explore and/or develop the Beche de Mer<br />
Fishery and associated fishing technology<br />
under the provision.<br />
exemption No: 1900<br />
Applicant: Alex Hesp, Ben French, Emily Fisher, Alan<br />
Cottingham, Lauren Veale, Peter Coulsen, Chris<br />
Hallett, James Tweedley, David Fairclough, Ian<br />
Keay and other Department of Fisheries finfish<br />
staff<br />
Period of Exemption: 13/06/2011 - 01/07/2012<br />
Provisions: Sections 46(a) and (b), 50(3) and 51(2) of the<br />
Fish Resources Management Act 1994 and<br />
regulations 16E (2) and (3), 45 (2) and 124B<br />
of the Fish Resources Management Regulations<br />
1995 and Order No. 24 of 2005.<br />
Purpose: For the purposes of biological studies,<br />
including detailed analysis of dietary<br />
compositions, of the silver trevally<br />
(Pseudocaranx georgianus), snapper<br />
(Chrysophrys auratus) and harlequin fish (Othos<br />
dentex).<br />
199<br />
exemption No: 1901<br />
Applicant: Fishing Boat Licence numbers 1005, 1292,<br />
1363, 1938, 2348 and 2451<br />
Period of Exemption: 10/06/2011 - 10/06/2014<br />
Provisions: Clause 2 of the Prohibition on Fishing (Diving)<br />
Order 1999 (Order Number 3 of 1999).<br />
Purpose: To explore and/or develop the Beche de Mer<br />
Fishery and fishing technology of that activity<br />
under the provision of Section 7(3)(c) of the<br />
Fish Resources Management Act 1994 and to<br />
gather baseline data about the beche de mer<br />
stocks in Western Australia.<br />
exemption No: 1902<br />
Applicant: Jessie Short, Professor Malcolm McCulloch,<br />
Professor Gary Kendrick, Taryn Foster<br />
Period of Exemption: 01/09/2011 - 31/08/2012<br />
Provisions: Sections 43, 50(3) and 51(2) of the Fish<br />
Resources Management Act 1994.<br />
Purpose: For the purposes of studying the effects of<br />
ocean acidification on calcification rates of<br />
corals and coralline algae in Western Australia.<br />
exemption No: 1903<br />
Applicant: Kellie O’Neil, Timothy Storer, Lynette Galvin,<br />
Gillian White, Dominic Heald, Sam Norton,<br />
Bronwyn Rennie, Emma Christie, Kieryn<br />
Kilminster, Georgina Evans, Emma Van Looij<br />
and other Dow staff.<br />
Period of Exemption: 01/04/2011 - 28/02/2013<br />
Provisions: Sections 43, 46(a) and (b), 50(3) and 51(2) of<br />
the Fish Resources Management Act 1994.<br />
Purpose: For the purposes of quantitatively sampling<br />
both the fish and crayfish populations in the<br />
Swan-Canning tributaries.
APPENDICES � STATE REgISTER <strong>OF</strong> AUTHORISATIONS, ExEMPTIONS AND AqUACULTURE LEASES<br />
exemption No: 1904<br />
Applicant: All officers of the Research Division of the<br />
Department of Fisheries and masters of their<br />
vessels.<br />
Period of Exemption: 01/07/2011 - 30/06/2013<br />
Provisions: From all of those provisions of the Fish<br />
Resources Management Act 1994 and<br />
regulations.<br />
Purpose: To enable the research personnel of the<br />
Department of Fisheries to undertake aquatic<br />
science research projects to provide scientific<br />
knowledge for the sustainable management<br />
and development of the State’s fish resources<br />
and the protection of fish habitats.<br />
exemption No: 1905<br />
Applicant: Monica Gagliano, Jennifer Kelley and Martial<br />
Depczynski<br />
Period of Exemption: 24/06/2011 - 29/06/2011<br />
Provisions: Provisions of Sections 43, 46, 50(3) and 51(2)<br />
of the Fish Resources Management Act 1994<br />
and regulations 64F, 64K, 64OB and 123 of<br />
the Fish Resources Management Regulations<br />
1995.<br />
Purpose: For the purposes of generating a novel<br />
understanding of the physiological trade-offs<br />
and costs underlying animal adaptation to<br />
variable environments.<br />
exemption No: 1906<br />
Applicant: Lauren Veale, Ian Potter, Peter Coulsen, Elena<br />
Sulin, James Tweedley, Elaine Lek and Alan<br />
Cottingham.<br />
Period of Exemption: 24/06/2011 - 31/01/2012<br />
Provisions: Sections 50(3) and 51(2) of the Fish<br />
Resources Management Act 1994 and<br />
regulations 64F, 1264K, 124 and 124B of the<br />
Fish Resources Management Regulations 1995.<br />
Purpose: For the purposes of general biological studies<br />
of six-lined trumpeter (Pelates sexlineatus).<br />
200<br />
exemption No: 1907<br />
Applicant: Paul Greenwood<br />
Period of Exemption: 24/06/2011 - 30/06/2012<br />
Provisions: Section 51(2) of the Fish Resources<br />
Management Act 1994.<br />
Purpose: For the purposes of assisting the Research<br />
Division, Department of Fisheries, in collecting<br />
required samples for biological analysis<br />
and monitoring the rebuilding of West Coast<br />
demersal fish stocks.<br />
exemption No: 1908<br />
Applicant: Clay Bryce, Phillipe Bouchet, Ellen Strong,<br />
Barry Wilson, Hugh Morrison, Brian Cleaver<br />
and Derrick Mead Hunter.<br />
Period of Exemption: 18/11/2011 - 12/12/2011<br />
Provisions: Sections 46(a) and (b), 50 and 51 of the<br />
Fish Resources Management Act 1994 and<br />
regulations 38D, 124 and 124B of the Fish<br />
Resources Management Regulations 1995.<br />
Purpose: For the purposes of examining the molecular<br />
phylogeny of a wide range of south-west WA<br />
molluscs using bar coding techniques.