

Fundamentals of the Discrete Fourier Transform
Fundamentals of the Discrete Fourier Transform
Fundamentals of the Discrete Fourier Transform

You also want an ePaper? Increase the reach of your titles
YUMPU automatically turns print PDFs into web optimized ePapers that Google loves.
Sound & Vibration Magazine March, 1978<br />
<strong>Fundamentals</strong> <strong>of</strong> <strong>the</strong> <strong>Discrete</strong> <strong>Fourier</strong> <strong>Transform</strong><br />
The <strong>Fourier</strong> transform is a ma<strong>the</strong>matical procedure that<br />
was discovered by a French ma<strong>the</strong>matician named Jean-<br />
Baptiste-Joseph <strong>Fourier</strong> in <strong>the</strong> early 1800's. It has been used<br />
very successfully through <strong>the</strong> years to solve many types <strong>of</strong><br />
engineering, physics, and ma<strong>the</strong>matics problems. The<br />
<strong>Fourier</strong> transform is defined for continuous (or analog)<br />
functions, and is usually applied in situations where <strong>the</strong><br />
functions are assumed to be continuous. More recently<br />
however, it has been implemented in digital form in various<br />
types <strong>of</strong> analyzers. These analyzers compute digital (or<br />
sampled) forms <strong>of</strong> power spectrums, frequency response<br />
functions, and o<strong>the</strong>r types <strong>of</strong> frequency domain functions<br />
from measured (sampled) time domain signals.<br />
The implementation <strong>of</strong> <strong>the</strong> <strong>Discrete</strong> <strong>Fourier</strong> <strong>Transform</strong>, or<br />
DFT, became practical in 1965 when Cooley and Tukey<br />
described an algorithm for computing <strong>the</strong> DFT very efficiently.<br />
Their algorithm (and o<strong>the</strong>rs like it) has become<br />
known as <strong>the</strong> Fast <strong>Fourier</strong> <strong>Transform</strong> (FFT).<br />
Using <strong>the</strong> FFT algorithm, present day mini-computer based<br />
analyzers can compute a DFT in milliseconds where it used<br />
to take hours using standard computational procedures.<br />
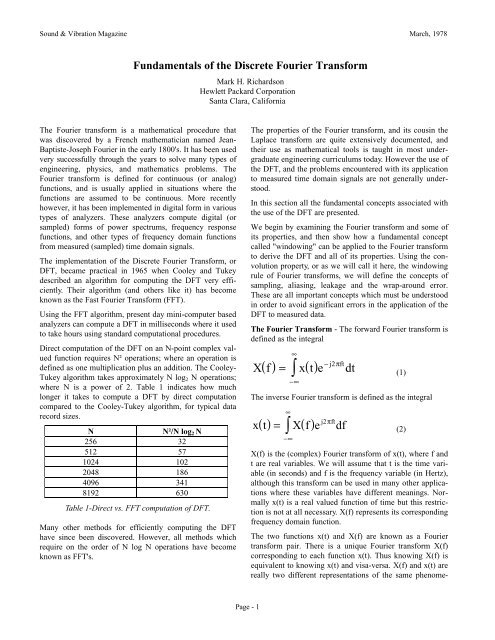
Direct computation <strong>of</strong> <strong>the</strong> DFT on an N-point complex valued<br />
function requires N² operations; where an operation is<br />
defined as one multiplication plus an addition. The Cooley-<br />
Tukey algorithm takes approximately N log2 N operations;<br />
where N is a power <strong>of</strong> 2. Table 1 indicates how much<br />
longer it takes to compute a DFT by direct computation<br />
compared to <strong>the</strong> Cooley-Tukey algorithm, for typical data<br />
record sizes.<br />
N N²/N log2 N<br />
256 32<br />
512 57<br />
1024 102<br />
2048 186<br />
4096 341<br />
8192 630<br />
Table 1-Direct vs. FFT computation <strong>of</strong> DFT.<br />
Many o<strong>the</strong>r methods for efficiently computing <strong>the</strong> DFT<br />
have since been discovered. However, all methods which<br />
require on <strong>the</strong> order <strong>of</strong> N log N operations have become<br />
known as FFT's.<br />
Mark H. Richardson<br />
Hewlett Packard Corporation<br />
Santa Clara, California<br />
Page - 1<br />
The properties <strong>of</strong> <strong>the</strong> <strong>Fourier</strong> transform, and its cousin <strong>the</strong><br />
Laplace transform are quite extensively documented, and<br />
<strong>the</strong>ir use as ma<strong>the</strong>matical tools is taught in most undergraduate<br />
engineering curriculums today. However <strong>the</strong> use <strong>of</strong><br />
<strong>the</strong> DFT, and <strong>the</strong> problems encountered with its application<br />
to measured time domain signals are not generally understood.<br />
In this section all <strong>the</strong> fundamental concepts associated with<br />
<strong>the</strong> use <strong>of</strong> <strong>the</strong> DFT are presented.<br />
We begin by examining <strong>the</strong> <strong>Fourier</strong> transform and some <strong>of</strong><br />
its properties, and <strong>the</strong>n show how a fundamental concept<br />
called "windowing" can be applied to <strong>the</strong> <strong>Fourier</strong> transform<br />
to derive <strong>the</strong> DFT and all <strong>of</strong> its properties. Using <strong>the</strong> convolution<br />
property, or as we will call it here, <strong>the</strong> windowing<br />
rule <strong>of</strong> <strong>Fourier</strong> transforms, we will define <strong>the</strong> concepts <strong>of</strong><br />
sampling, aliasing, leakage and <strong>the</strong> wrap-around error.<br />
These are all important concepts which must be understood<br />
in order to avoid significant errors in <strong>the</strong> application <strong>of</strong> <strong>the</strong><br />
DFT to measured data.<br />
The <strong>Fourier</strong> <strong>Transform</strong> - The forward <strong>Fourier</strong> transform is<br />
defined as <strong>the</strong> integral<br />
∞<br />
∫<br />
( ) ( )<br />
− j2πft X f = x t e dt<br />
−∞<br />
(1)<br />
The inverse <strong>Fourier</strong> transform is defined as <strong>the</strong> integral<br />
∞<br />
∫<br />
( ) ( )<br />
j2πft x t X f e df<br />
= −∞<br />
X(f) is <strong>the</strong> (complex) <strong>Fourier</strong> transform <strong>of</strong> x(t), where f and<br />
t are real variables. We will assume that t is <strong>the</strong> time variable<br />
(in seconds) and f is <strong>the</strong> frequency variable (in Hertz),<br />
although this transform can be used in many o<strong>the</strong>r applications<br />
where <strong>the</strong>se variables have different meanings. Normally<br />
x(t) is a real valued function <strong>of</strong> time but this restriction<br />
is not at all necessary. X(f) represents its corresponding<br />
frequency domain function.<br />
The two functions x(t) and X(f) are known as a <strong>Fourier</strong><br />
transform pair. There is a unique <strong>Fourier</strong> transform X(f)<br />
corresponding to each function x(t). Thus knowing X(f) is<br />
equivalent to knowing x(t) and visa-versa. X(f) and x(t) are<br />
really two different representations <strong>of</strong> <strong>the</strong> same phenome-<br />
(2)
Sound & Vibration Magazine March, 1978<br />
non. If <strong>the</strong> phenomenon is known in terms <strong>of</strong> x(t), <strong>the</strong>n<br />
equation (1) shows how X(f) is represented in terms <strong>of</strong> x(t).<br />
Likewise if X(f) is known, equation (2) shows how x(t) is<br />
represented in terms <strong>of</strong> X(f).<br />
Table 2 lists some commonly used <strong>Fourier</strong> transform pairs.<br />
Time Domain Function Frequency Domain<br />
Function<br />
Auto Correlation Auto Power Spectrum<br />
Cross Correlation Cross Power Spectrum<br />
Impulse Response Frequency Response<br />
Table 2 - <strong>Fourier</strong> transform pairs.<br />
Correlation Functions and Spectral Products - A power<br />
or energy density spectrum is defined as follows:<br />
*<br />
( ) = ( ) ( )<br />
G f X f X f<br />
xx<br />
Gxx(f) is a spectrum obtained by multiplying X(f) by its own<br />
conjugate X * (f). Gxx(f) is real and positive at all frequencies.<br />
The inverse <strong>Fourier</strong> transform <strong>of</strong> Gxx(f) is called <strong>the</strong><br />
autocorrelation function <strong>of</strong> x(t) and is <strong>the</strong>refore written as<br />
<strong>the</strong> integral<br />
xx<br />
∞<br />
= ∫<br />
−∞<br />
xx<br />
( ) ( )<br />
j2πft R t G f e df<br />
This autocorrelation function is usually real valued, but not<br />
necessarily positive for all values.<br />
The cross power spectrum is defined as<br />
*<br />
( ) = ( ) ( )<br />
G f Y f X f<br />
yx<br />
where both Y(f) and X(f) are <strong>Fourier</strong> transforms obtained<br />
from <strong>the</strong> functions y(t) and x(t). The inverse transform is<br />
called <strong>the</strong> cross-correlation function, and can be written as<br />
<strong>the</strong> integral<br />
yx<br />
∞<br />
= ∫<br />
−∞<br />
yx<br />
( ) ( )<br />
j2πft R t G f e df<br />
This quantity is usually real valued.<br />
The frequency response function (also called <strong>the</strong> transfer<br />
function) is computed as <strong>the</strong> ratio <strong>of</strong> <strong>the</strong> cross power spectrum<br />
over <strong>the</strong> auto power spectrum, i.e.<br />
( )<br />
H f<br />
( )<br />
G f<br />
(3)<br />
(4)<br />
(5)<br />
(6)<br />
yx = (7)<br />
G xx(<br />
f)<br />
and its inverse <strong>Fourier</strong> transform is <strong>the</strong> impulse response<br />
function.<br />
Page - 2<br />
Ano<strong>the</strong>r frequency domain function <strong>of</strong>ten used in conjunction<br />
with <strong>the</strong> frequency response function is <strong>the</strong> coherence<br />
function. It is computed as <strong>the</strong> ratio <strong>of</strong> <strong>the</strong> magnitude<br />
squared <strong>of</strong> <strong>the</strong> cross power spectrum divided by <strong>the</strong> product<br />
<strong>of</strong> <strong>the</strong> input and output auto power spectrums, i.e.<br />
γ 2<br />
( f)<br />
2<br />
yx(<br />
)<br />
( ) ( )<br />
G f<br />
= (8)<br />
[ Gxx f G yy f ]<br />
The coherence function is real valued having values between<br />
zero and one.<br />
Figure 1 shows one <strong>of</strong> <strong>the</strong> transform pairs, <strong>the</strong> impulse response<br />
and frequency response function, plotted along <strong>the</strong><br />
time and frequency axes respectively.<br />
Figure 1—Plot <strong>of</strong> <strong>Fourier</strong> transform pair.<br />
Notice that <strong>the</strong> frequency function X(f) exhibits some symmetry<br />
about <strong>the</strong> origin (f = 0) <strong>of</strong> <strong>the</strong> frequency axis. That is<br />
<strong>the</strong> real part Re [X(f)] satisfies <strong>the</strong> equation<br />
Re [X(f)] = Re [X(-f)]<br />
and <strong>the</strong> imaginary part Im [X(f)]satisfies<br />
Im [X(f) ] = - Im [X(-f)]<br />
Re [X(f)] is called an even function and Im [X(f)] an odd<br />
function.<br />
Ano<strong>the</strong>r way <strong>of</strong> saying this is that <strong>the</strong> function value for<br />
negative frequencies is <strong>the</strong> complex conjugate <strong>of</strong> <strong>the</strong> function<br />
value for <strong>the</strong> corresponding positive frequency, i.e.<br />
X(f) = X * (-f)
Sound & Vibration Magazine March, 1978<br />
This property is called Hermitian symmetry. It is <strong>the</strong> result<br />
<strong>of</strong> <strong>the</strong> following general rule.<br />
Symmetry Rule: The <strong>Fourier</strong> transform <strong>of</strong> a real valued<br />
function is Hermitian symmetric about <strong>the</strong> origin in <strong>the</strong><br />
o<strong>the</strong>r (transform) domain.<br />
Because <strong>of</strong> <strong>the</strong> Hermitian symmetry, normally only <strong>the</strong> values<br />
<strong>of</strong> <strong>the</strong> frequency function X(f) for non-negative frequencies<br />
are displayed on <strong>the</strong> CRT <strong>of</strong> a <strong>Fourier</strong> analyzer. It<br />
is important to keep in mind however that <strong>the</strong> complete<br />
function X(f) also includes <strong>the</strong> conjugate values for negative<br />
frequencies.<br />
Windowing - In practice we usually measure some signal<br />
x(t) which corresponds to <strong>the</strong> phenomenon we wish to<br />
analyze, e.g. motion, pressure, temperature, etc. This analog<br />
signal x(t) is commonly measured as an electrical voltage,<br />
and it could be processed using analog techniques to<br />
perform <strong>the</strong> indicated multiplication and integration <strong>of</strong><br />
equation (1) to obtain <strong>the</strong> <strong>Fourier</strong> transform <strong>of</strong> <strong>the</strong> signal.<br />
However this is impractical and is not done in commercially<br />
available instrumentation today.<br />
Moreover, a more serious drawback to obtaining a <strong>Fourier</strong><br />
transform is that we can't measure <strong>the</strong> signal x(t) over <strong>the</strong><br />
infinite interval (-∞, ∞), but only over some finite interval<br />
(t1,t2) as shown in Figure 2. Hence we never measure <strong>the</strong><br />
entire signal x(t) but only a "windowed" version <strong>of</strong> it, x( t ) .<br />
The windowed<br />
Figure 2 - Truncating <strong>the</strong> time signal.<br />
signal x(t) can be thought <strong>of</strong> as <strong>the</strong> entire signal x(t) multiplied<br />
by <strong>the</strong> windowing function w(t), where w(t) is equal<br />
to 1 in <strong>the</strong> interval (t1,t2) and zero elsewhere.<br />
Secondly, <strong>the</strong> DFT works with digital or sampled data. This<br />
sampling process can also be thought <strong>of</strong> as a multiplication<br />
<strong>of</strong> <strong>the</strong> continuous signal by a sequence <strong>of</strong> unit amplitude<br />
impulses as shown in Figure 3. Hence <strong>the</strong> sampled data is<br />
really <strong>the</strong> continuous data multiplied by a "sampling" window<br />
or function.<br />
This windowing <strong>of</strong> <strong>the</strong> signal brings into effect a fundamental<br />
rule <strong>of</strong> <strong>the</strong> <strong>Fourier</strong> transform.<br />
Page - 3<br />
Figure 3 - Sampling <strong>the</strong> time signal.<br />
Windowing Rule: If two functions are multiplied toge<strong>the</strong>r in<br />
one domain <strong>the</strong>ir <strong>Fourier</strong> transforms are convolved toge<strong>the</strong>r<br />
in <strong>the</strong> o<strong>the</strong>r domain.<br />
Convolution is a simple ma<strong>the</strong>matical procedure but is<br />
somewhat difficult to grasp conceptually without working<br />
out an example. Convolution is defined by <strong>the</strong> integral<br />
∞<br />
( ) = ( ) ( − )<br />
c t ∫ x τ y t τ dτ<br />
−∞<br />
Figure 4 depicts <strong>the</strong> process for two rectangular functions<br />
x(t) and y(t). The function c(t) is computed by sliding <strong>the</strong><br />
function y(-t) in <strong>the</strong> time direction and summing up<br />
(integrating) <strong>the</strong> products <strong>of</strong> <strong>the</strong> two functions where <strong>the</strong>y<br />
intersect. After y(-t) has completely passed by x(t) <strong>the</strong> function<br />
c(t) is complete.<br />
Figure 4 - Convolution <strong>of</strong> two functions.<br />
The <strong>Discrete</strong> <strong>Fourier</strong> <strong>Transform</strong> (DFT) - The need for<br />
calculation <strong>of</strong> <strong>the</strong> <strong>Fourier</strong> transform has become increasingly<br />
important over <strong>the</strong> years, partly because <strong>the</strong> cost <strong>of</strong><br />
computers has been steadily declining, and partly because
Sound & Vibration Magazine March, 1978<br />
<strong>the</strong> difficulty and sophistication <strong>of</strong> our measurements has<br />
been steadily increasing. The continuous transform <strong>the</strong>ory<br />
is very useful for <strong>the</strong>oretical work, but is not suited for calculation<br />
with instrumentation techniques. To compute <strong>the</strong><br />
DFT we must work with sampled versions <strong>of</strong> our functions<br />
in both <strong>the</strong> time and <strong>the</strong> frequency domains, and our functions<br />
are <strong>of</strong> limited duration in both domains.<br />
It is possible to ei<strong>the</strong>r develop <strong>the</strong> DFT from basic axioms,<br />
or to derive it from <strong>the</strong> continuous <strong>Fourier</strong> transform. We<br />
will take <strong>the</strong> latter approach, because one or our main goals<br />
will be to relate <strong>the</strong> results <strong>of</strong> our discrete measurements<br />
and calculations to <strong>the</strong> results that we expect from application<br />
<strong>of</strong> <strong>the</strong> <strong>Fourier</strong> transform to continuous signals.<br />
Sampled versus Continuous Data<br />
There are three modifications that must be made to <strong>the</strong> time<br />
function x(t) and its transform X(f), in order to represent<br />
<strong>the</strong>se functions in digital instrumentation.<br />
It is <strong>the</strong>refore convenient to describe this process <strong>of</strong> converting<br />
continuous data to discrete data as three distinct<br />
steps or operations. A thorough understanding <strong>of</strong> <strong>the</strong>se<br />
processing steps, and <strong>the</strong> order in which <strong>the</strong>y occur, should<br />
eliminate most <strong>of</strong> <strong>the</strong> confusion that might arise concerning<br />
<strong>the</strong> interpretation <strong>of</strong> various DFT results.<br />
1. x(t) must be multiplied by a time window w(t) <strong>of</strong> duration<br />
T to obtain a time record <strong>of</strong> finite extent. This results<br />
in <strong>the</strong> convolution <strong>of</strong> <strong>the</strong> spectrum X(f) with <strong>the</strong> transform<br />
<strong>of</strong> w(t). This transform is called <strong>the</strong> line shape <strong>of</strong> w(t) and<br />
denoted by L(f).<br />
2. x(t) = x(t) w(t) must be sampled N times at Δt intervals<br />
in anticipation <strong>of</strong> storage in a digital memory. Thus, T =<br />
NΔt. This is done by multiplying <strong>the</strong> windowed time function<br />
by a second "sampling function" known as <strong>the</strong> SHAH<br />
function. This causes replication <strong>of</strong> <strong>the</strong> frequency function<br />
at intervals 1/Δt along <strong>the</strong> frequency axis.<br />
3. Finally, it is necessary to restrict <strong>the</strong> resulting frequency<br />
function to a finite number <strong>of</strong> samples in order to store <strong>the</strong><br />
result in a digital memory. The frequency function is sampled<br />
N times at Δf intervals. Thus 2Fmax = NΔf if we sample<br />
<strong>the</strong> function over an interval (-Fmax, Fmax). This sampling is<br />
done by multiplying <strong>the</strong> frequency function by ano<strong>the</strong>r<br />
SHAH function which causes replication <strong>of</strong> <strong>the</strong> time function<br />
at intervals 1/Δf along <strong>the</strong> time axis.<br />
These three essential steps are illustrated in both domains<br />
by <strong>the</strong> example in Figure 5. Here, <strong>the</strong> original time function<br />
is a cosine function <strong>of</strong> frequency (fo), and its true frequency<br />
spectrum is a pair <strong>of</strong> delta functions located at frequencies<br />
±fo. We have applied a rectangular window w(t) in <strong>the</strong> time<br />
domain, corresponding to <strong>the</strong> frequency<br />
Page - 4<br />
Figure 5 - The three steps to convert continuous data to<br />
discrete data.<br />
domain convolution with <strong>the</strong> line shape L(f) = (sin πf)/ πf.<br />
Notice that each delta function is "smeared" by L(f) and<br />
causes intermixing <strong>of</strong> various frequencies. This phenomenon<br />
is called leakage, and will be discussed in more detail<br />
later.
Sound & Vibration Magazine March, 1978<br />
The time function is sampled at intervals <strong>of</strong> Δt, and <strong>the</strong><br />
smeared frequency spectrum is reproduced at Intervals <strong>of</strong><br />
1/Δt along <strong>the</strong> frequency axis. Notice that <strong>the</strong>re is some<br />
over lap <strong>of</strong> <strong>the</strong>se replicated spectra. This overlap effect is<br />
called aliasing, and will also be discussed more fully in a<br />
later section.<br />
Finally, <strong>the</strong> replicated spectrum is sampled at Δf intervals,<br />
causing <strong>the</strong> truncated time function to be replicated at 1/Δf<br />
intervals, and becoming periodic with a 1/Δf period. The<br />
net result is a periodic sequence <strong>of</strong> N samples per period in<br />
each domain. Since each function can be described entirely<br />
if one period is known, it is only necessary to store <strong>the</strong> N<br />
samples <strong>of</strong> one period.<br />
It should be apparent that <strong>the</strong> final discrete frequency spectrum<br />
appears to be substantially different from <strong>the</strong> true<br />
spectrum. However in <strong>the</strong> following sections where each <strong>of</strong><br />
<strong>the</strong>se steps is examined in more detail, techniques for<br />
minimizing <strong>the</strong>se errors will be discussed.<br />
Returning to <strong>the</strong> definition <strong>of</strong> <strong>the</strong> <strong>Fourier</strong> transform eq. (1),<br />
if we now let f = mΔf, t = nΔt and if we assume that x(t)<br />
has non zero values only at <strong>the</strong> times t = nΔt for N values <strong>of</strong><br />
n and that X(f) has non-zero values only at <strong>the</strong> frequencies<br />
f = mΔf for N values <strong>of</strong> m <strong>the</strong>n <strong>the</strong> <strong>Discrete</strong> <strong>Fourier</strong> <strong>Transform</strong><br />
becomes<br />
N−1<br />
( Δ ) = Δ ∑ ( Δ )<br />
X m f t x n t e<br />
n=<br />
0<br />
− j2π mn/ N<br />
m = 0K, N −1<br />
Likewise <strong>the</strong> Inverse <strong>Discrete</strong> <strong>Fourier</strong> transform is written<br />
N−1<br />
( Δ ) = Δ ∑ ( Δ )<br />
x n t f X m f e<br />
m=<br />
0<br />
j2π mn/ N<br />
n = 0K, N − 1<br />
where T = NΔt = 1/Δf. The independent variables are now<br />
<strong>the</strong> pair <strong>of</strong> indices m and n. X(mΔf) has discrete values at<br />
intervals <strong>of</strong> Δf = 1/T, and is periodic with period 1/Δt,<br />
while x(nΔt) has discrete values at intervals <strong>of</strong> Δt, and is<br />
periodic with period T. Each sequence comprises N numbers,<br />
which may be real or complex. If x(nΔt) is real, <strong>the</strong>n<br />
X(mΔf) will be Hermitian. Thus, only <strong>the</strong> positive halfperiod<br />
<strong>of</strong> X(mΔf) need be calculated. There are exactly N<br />
independent numbers that describe <strong>the</strong> transform function<br />
in each domain. In <strong>the</strong> time domain, <strong>the</strong>re are N real samples<br />
<strong>of</strong> <strong>the</strong> time function, and in <strong>the</strong> frequency domain <strong>the</strong>re<br />
are (N-1)/2 complex numbers for <strong>the</strong> range 1
Sound & Vibration Magazine March, 1978<br />
cal <strong>of</strong> all line shapes that result from finite time windows.<br />
The line shape comprises a<br />
Figure 6 - A rectangular time window and its corresponding<br />
frequency line shape.<br />
main lobe (analogous to antenna or optical <strong>the</strong>ory) centered<br />
about <strong>the</strong> frequency origin, and a number <strong>of</strong> smaller side<br />
lobes that persist over <strong>the</strong> remaining frequency range.<br />
When we convolve a spectrum with a function <strong>of</strong> this sort,<br />
we find that <strong>the</strong> energy or power that is intended to be associated<br />
with a particular frequency, is in reality spread over a<br />
wide range <strong>of</strong> adjacent frequencies. We call this phenomenon<br />
leakage. It should be ra<strong>the</strong>r obvious that leakage can be<br />
a serious source <strong>of</strong> error in our measurements, unless we<br />
take steps to constrain this parasitic spread <strong>of</strong> energy.<br />
Leakage, and What To Do About It<br />
Leakage is always undesirable! Fortunately, it can sometimes<br />
be completely eliminated, and can always be reduced<br />
to an arbitrarily small amount with a suitable window.<br />
Leakage is completely absent when a rectangular window is<br />
applied to data that is exactly periodic in <strong>the</strong> window interval<br />
T, and <strong>the</strong> resulting spectrum is sampled at intervals <strong>of</strong><br />
Δf = 1/T. The reason becomes apparent when we observe<br />
that frequency domain sampling causes time domain replication,<br />
and that <strong>the</strong> replication <strong>of</strong> one cycle <strong>of</strong> a periodic<br />
function simply reproduces <strong>the</strong> original function. In <strong>the</strong><br />
frequency domain, <strong>the</strong> line shape sinc(ft) has nulls at all<br />
multiples <strong>of</strong> 1/T along <strong>the</strong> frequency axis (except at f = 0),<br />
and <strong>the</strong> spectrum <strong>of</strong> <strong>the</strong> original periodic time signal has<br />
values only at frequencies which are multiples <strong>of</strong> 1/T. Thus,<br />
<strong>the</strong> convolution with sinc(fT) does not produce any interaction<br />
between <strong>the</strong>se frequencies at multiples <strong>of</strong> 1/T.<br />
Obviously, if existing time signals are periodic, it is possible<br />
to eliminate leakage if <strong>the</strong> window width can be adjusted<br />
properly to encompass an integer number <strong>of</strong> data<br />
Page - 6<br />
periods. In some cases, measurements can be made on a<br />
physical system by applying a controlled source <strong>of</strong> excitation<br />
to <strong>the</strong> system, in which <strong>the</strong> excitation is made suitably<br />
periodic in <strong>the</strong> window interval. It is necessary that <strong>the</strong> period<br />
be held as close to T as possible throughout <strong>the</strong> measurement<br />
interval, or else <strong>the</strong> spectral samples will occur at<br />
points where <strong>the</strong> sinc(fT) line shape is not precisely zero.<br />
Thus, for signals that are periodic in <strong>the</strong> window interval T.<br />
or for transients (whe<strong>the</strong>r repetitive or not) that completely<br />
decay within <strong>the</strong> window interval, <strong>the</strong> rectangular window<br />
is optimum. We assume that non-periodic noise is negligible<br />
in <strong>the</strong>se cases. O<strong>the</strong>r windows may be used, but <strong>the</strong> result<br />
will be a considerable and unnecessary loss in frequency<br />
resolution.<br />
When x(t) contains a significant amount <strong>of</strong> random noise,<br />
such noise is not periodic in <strong>the</strong> window interval T. Thus,<br />
<strong>the</strong> measured noise spectrum will have considerable leakage.<br />
If <strong>the</strong> shape <strong>of</strong> <strong>the</strong> noise spectrum is <strong>of</strong> particular interest,<br />
it is necessary to choose a window with less leakage<br />
than <strong>the</strong> rectangular shape.<br />
When x(t) is not periodic in <strong>the</strong> window interval T. we must<br />
use a window whose line shape is a compromise between<br />
small side lobes and a narrow main lobe. The side lobes can<br />
always be made arbitrarily small, at <strong>the</strong> expense <strong>of</strong> main<br />
lobe broadening. Thus, it is always necessary to balance <strong>the</strong><br />
desired frequency resolution against <strong>the</strong> deleterious effects<br />
<strong>of</strong> leakage. The optimum choice depends on <strong>the</strong> application.<br />
One window that is commonly used with non-periodic random<br />
data is <strong>the</strong> Hanning window, shown in Figure 7.<br />
Figure 7 - Windows and <strong>the</strong>ir line shapes.<br />
Sampling In <strong>the</strong> Time Domain - Since <strong>the</strong> DFT operates<br />
on digital or sampled data, <strong>the</strong> measured time domain signal<br />
must be sampled, and <strong>the</strong> resulting numbers stored in<br />
memory.<br />
Ideal sampling is <strong>the</strong> process <strong>of</strong> observing a continuous<br />
signal only at discrete instants <strong>of</strong> time. The FFT algorithm<br />
assumes that <strong>the</strong> signal is sampled uniformly, i.e. <strong>the</strong> time<br />
period between successive samples remains constant.
Sound & Vibration Magazine March, 1978<br />
The sampling process may be viewed as <strong>the</strong> multiplication<br />
<strong>of</strong> a continuous signal by a sequence <strong>of</strong> unit amplitude delta<br />
functions. This sequence <strong>of</strong> delta functions, called <strong>the</strong><br />
SHAH function, is shown toge<strong>the</strong>r with its <strong>Fourier</strong> transform<br />
in Figure 8a. Note that if we sample <strong>the</strong> signal with a<br />
period t between samples, <strong>the</strong> <strong>Fourier</strong> transform <strong>of</strong> <strong>the</strong><br />
SHAH function is ano<strong>the</strong>r SHAH function with impulses<br />
separated by a frequency equal to <strong>the</strong> sampling frequency<br />
(fs = 1/Δt).<br />
Figure 8 - The effect <strong>of</strong> sampling.<br />
Applying <strong>the</strong> windowing rule, we see that multiplication <strong>of</strong><br />
<strong>the</strong> continuous signal by a SHAH function in <strong>the</strong> time domain<br />
results in a replication <strong>of</strong> <strong>the</strong> <strong>Fourier</strong> transform <strong>of</strong> <strong>the</strong><br />
signal in <strong>the</strong> frequency domain, due to <strong>the</strong> convolution <strong>of</strong><br />
its transform with ano<strong>the</strong>r SHAH function.<br />
Figure 8a shows <strong>the</strong> spectrum <strong>of</strong> a "band limited" signal,<br />
i.e. its spectrum (<strong>Fourier</strong> transform multiplied by its conjugate)<br />
contains non-zero values only in <strong>the</strong> interval (-Fmax,<br />
Fmax)<br />
Figures 8c, 8d and 8e show <strong>the</strong> effects <strong>of</strong> sampling <strong>the</strong> time<br />
domain signal at slower and slower rates. It is clear that as t<br />
becomes larger, 1/t becomes smaller and <strong>the</strong> replicated<br />
<strong>Fourier</strong> transform <strong>of</strong> <strong>the</strong> signal begins to overlap upon itself,<br />
as shown in Figure 8e. This overlapping <strong>of</strong> <strong>the</strong> frequency<br />
domain function upon itself is called aliasing.<br />
In practice two different methods can be used to prevent<br />
aliasing<br />
1. Sample a known band limited signal at a high enough<br />
rate. If a signal is known to be band limited in <strong>the</strong> interval<br />
(-Fmax, Fmax), <strong>the</strong>n sampling it at a rate fs = 2Fmax is sufficient<br />
to prevent aliasing. Fmax is called <strong>the</strong> Nyquist rate.<br />
2. If <strong>the</strong> bandwidth <strong>of</strong> <strong>the</strong> signal is unknown, band-limit it<br />
by passing it through an analog low pass (antialiasing) filter<br />
before sampling it. Then follow step 1 above.<br />
Most antialiasing filters can be characterized by a line<br />
shape in <strong>the</strong> frequency domain as shown in Figure 9. Their<br />
Page - 7<br />
roll<strong>of</strong>f rate varies with design but most commercially available<br />
filters will adequately bandlimit a signal if <strong>the</strong>ir cut<strong>of</strong>f<br />
frequency (fc) equals Fmax/2. Hence a safe rule <strong>of</strong> thumb for<br />
preventing aliasing in a signal <strong>of</strong> unknown bandwidth is to<br />
analog filter it using a cut<strong>of</strong>f frequency <strong>of</strong> Fmax/2 and sample<br />
it using a sampling frequency <strong>of</strong> 2 Fmax. Useable data is <strong>the</strong>n<br />
in <strong>the</strong> range (-Fmax/2, Fmax/2).<br />
Figure 9 - Antialiasing filter line shape.<br />
Frequency Domain Sampling - The last <strong>of</strong> <strong>the</strong> three processing<br />
steps is to multiply <strong>the</strong> frequency function by some<br />
suitable sampling function in <strong>the</strong> frequency domain. This<br />
step is necessary so that we can evaluate <strong>the</strong> <strong>Fourier</strong> transform<br />
with a finite number <strong>of</strong> calculations, and so that we<br />
can store <strong>the</strong> results in a finite digital memory. We know<br />
that this technique <strong>of</strong> frequency sampling is permissible,<br />
provided we sample at uniform intervals no greater than Δf<br />
= 1/T, because this implies that <strong>the</strong> corresponding time<br />
function will be replaced with a period no smaller than T.<br />
Since our time window width is T, this sampling interval<br />
will insure that no time overlap occurs during this replication<br />
step.<br />
Quadratic Frequency and Correlation Domains - We are<br />
<strong>of</strong>ten interested in measurements involving <strong>the</strong> product <strong>of</strong><br />
two frequency functions, ei<strong>the</strong>r in <strong>the</strong> form <strong>of</strong> an autopower<br />
spectrum, or a cross-spectrum between two related<br />
quantities. As discussed earlier, <strong>the</strong> inverse <strong>Fourier</strong> transforms<br />
<strong>of</strong> <strong>the</strong>se frequency quantities are called correlation<br />
functions.<br />
Applying <strong>the</strong> windowing rule once again, multiplication <strong>of</strong><br />
two functions toge<strong>the</strong>r in <strong>the</strong> frequency domain causes convolution<br />
<strong>of</strong> <strong>the</strong> inverse transforms in <strong>the</strong> time domain.<br />
The convolution process for <strong>the</strong> discrete transform differs<br />
from <strong>the</strong> continuous transform in that it is circular in nature.<br />
That is, we are always convolving periodic functions,<br />
so <strong>the</strong> convolution with one period <strong>of</strong> a function overlaps<br />
that <strong>of</strong> adjacent periods. It might be helpful to visualize one<br />
period <strong>of</strong> each function wrapped around a cylinder <strong>of</strong> <strong>the</strong><br />
appropriate radius. All displacements associated with <strong>the</strong><br />
convolution operation can be pictured as incremental rotations<br />
<strong>of</strong> one waveform with respect to <strong>the</strong> o<strong>the</strong>r around <strong>the</strong><br />
circumference <strong>of</strong> this cylinder. Thus, as a portion <strong>of</strong> a function<br />
moves past <strong>the</strong> t = T boundary <strong>of</strong> <strong>the</strong> time window, it<br />
immediately reappears at t = 0.
Sound & Vibration Magazine March, 1978<br />
In Figure 10, we see that a rectangle <strong>of</strong> width T. convolved<br />
with itself, produces a triangle <strong>of</strong> width 2T. However, when<br />
we sample <strong>the</strong> resulting spectrum at intervals <strong>of</strong> 1/T, we<br />
replicate this composite time function at intervals <strong>of</strong> T. and<br />
<strong>the</strong> sum <strong>of</strong> <strong>the</strong>se multiple images is a constant. This is obviously<br />
quite different from <strong>the</strong> true triangular shape. The<br />
"tails" <strong>of</strong> <strong>the</strong> expected triangle are "wrapped-around" <strong>the</strong><br />
cylinder, and fill in <strong>the</strong> remaining portion <strong>of</strong> <strong>the</strong> triangle,<br />
producing a rectangle.<br />
Figure 10 - The wrap-around effect caused by sampling a<br />
quadratic frequency spectrum at 1/T intervals instead <strong>of</strong><br />
1/2T intervals<br />
When overlap <strong>of</strong> periodic time functions occurs this is<br />
called wrap-around error. This is completely analogous to<br />
aliasing in <strong>the</strong> frequency domain and is sometimes called<br />
time domain aliasing. As with aliasing, this phenomenon is<br />
caused by undersampling <strong>the</strong> product <strong>of</strong> two functions<br />
which have been multiplied toge<strong>the</strong>r in <strong>the</strong> frequency domain.<br />
If some wrap-around does occur, it means that <strong>the</strong><br />
multiplication <strong>of</strong> two frequency domain functions has produced<br />
a frequency spectrum that cannot be adequately represented<br />
by samples spaced 1/T apart. Generally speaking,<br />
<strong>the</strong> product <strong>of</strong> k functions can introduce additional fine<br />
detail into <strong>the</strong> result which requires finer sampling by a<br />
factor k to completely represent <strong>the</strong> product.<br />
In many cases, <strong>the</strong> sum <strong>of</strong> <strong>the</strong> widths <strong>of</strong> <strong>the</strong> individual time<br />
functions is effectively less than T, so when <strong>the</strong>se functions<br />
are convolved toge<strong>the</strong>r, <strong>the</strong> composite width is also effectively<br />
less than T, and <strong>the</strong> wrap-around effect is absent, or<br />
at least negligible. O<strong>the</strong>rwise, this phenomenon causes significant<br />
errors in <strong>the</strong> convolution or correlation process,<br />
particularly near <strong>the</strong> ends <strong>of</strong> <strong>the</strong> time interval.<br />
Page - 8