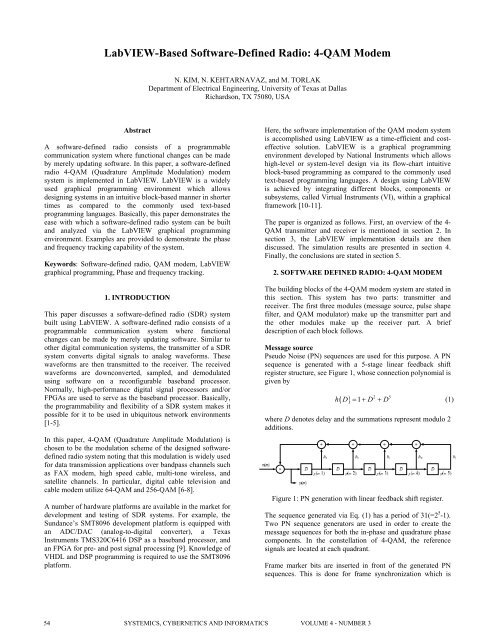
LabVIEW-Based Software-Defined Radio: 4-QAM Modem
LabVIEW-Based Software-Defined Radio: 4-QAM Modem
LabVIEW-Based Software-Defined Radio: 4-QAM Modem

Create successful ePaper yourself
Turn your PDF publications into a flip-book with our unique Google optimized e-Paper software.
<strong>LabVIEW</strong>-<strong>Based</strong> <strong>Software</strong>-<strong>Defined</strong> <strong>Radio</strong>: 4-<strong>QAM</strong> <strong>Modem</strong><br />
Abstract<br />
A software-defined radio consists of a programmable<br />
communication system where functional changes can be made<br />
by merely updating software. In this paper, a software-defined<br />
radio 4-<strong>QAM</strong> (Quadrature Amplitude Modulation) modem<br />
system is implemented in <strong>LabVIEW</strong>. <strong>LabVIEW</strong> is a widely<br />
used graphical programming environment which allows<br />
designing systems in an intuitive block-based manner in shorter<br />
times as compared to the commonly used text-based<br />
programming languages. Basically, this paper demonstrates the<br />
ease with which a software-defined radio system can be built<br />
and analyzed via the <strong>LabVIEW</strong> graphical programming<br />
environment. Examples are provided to demonstrate the phase<br />
and frequency tracking capability of the system.<br />
Keywords: <strong>Software</strong>-defined radio, <strong>QAM</strong> modem, <strong>LabVIEW</strong><br />
graphical programming, Phase and frequency tracking.<br />
1. INTRODUCTION<br />
This paper discusses a software-defined radio (SDR) system<br />
built using <strong>LabVIEW</strong>. A software-defined radio consists of a<br />
programmable communication system where functional<br />
changes can be made by merely updating software. Similar to<br />
other digital communication systems, the transmitter of a SDR<br />
system converts digital signals to analog waveforms. These<br />
waveforms are then transmitted to the receiver. The received<br />
waveforms are downconverted, sampled, and demodulated<br />
using software on a reconfigurable baseband processor.<br />
Normally, high-performance digital signal processors and/or<br />
FPGAs are used to serve as the baseband processor. Basically,<br />
the programmability and flexibility of a SDR system makes it<br />
possible for it to be used in ubiquitous network environments<br />
[1-5].<br />
In this paper, 4-<strong>QAM</strong> (Quadrature Amplitude Modulation) is<br />
chosen to be the modulation scheme of the designed softwaredefined<br />
radio system noting that this modulation is widely used<br />
for data transmission applications over bandpass channels such<br />
as FAX modem, high speed cable, multi-tone wireless, and<br />
satellite channels. In particular, digital cable television and<br />
cable modem utilize 64-<strong>QAM</strong> and 256-<strong>QAM</strong> [6-8].<br />
A number of hardware platforms are available in the market for<br />
development and testing of SDR systems. For example, the<br />
Sundance’s SMT8096 development platform is equipped with<br />
an ADC/DAC (analog-to-digital converter), a Texas<br />
Instruments TMS320C6416 DSP as a baseband processor, and<br />
an FPGA for pre- and post signal processing [9]. Knowledge of<br />
VHDL and DSP programming is required to use the SMT8096<br />
platform.<br />
54<br />
N. KIM, N. KEHTARNAVAZ, and M. TORLAK<br />
Department of Electrical Engineering, University of Texas at Dallas<br />
Richardson, TX 75080, USA<br />
Here, the software implementation of the <strong>QAM</strong> modem system<br />
is accomplished using <strong>LabVIEW</strong> as a time-efficient and costeffective<br />
solution. <strong>LabVIEW</strong> is a graphical programming<br />
environment developed by National Instruments which allows<br />
high-level or system-level design via its flow-chart intuitive<br />
block-based programming as compared to the commonly used<br />
text-based programming languages. A design using <strong>LabVIEW</strong><br />
is achieved by integrating different blocks, components or<br />
subsystems, called Virtual Instruments (VI), within a graphical<br />
framework [10-11].<br />
The paper is organized as follows. First, an overview of the 4-<br />
<strong>QAM</strong> transmitter and receiver is mentioned in section 2. In<br />
section 3, the <strong>LabVIEW</strong> implementation details are then<br />
discussed. The simulation results are presented in section 4.<br />
Finally, the conclusions are stated in section 5.<br />
2. SOFTWARE DEFINED RADIO: 4-<strong>QAM</strong> MODEM<br />
The building blocks of the 4-<strong>QAM</strong> modem system are stated in<br />
this section. This system has two parts: transmitter and<br />
receiver. The first three modules (message source, pulse shape<br />
filter, and <strong>QAM</strong> modulator) make up the transmitter part and<br />
the other modules make up the receiver part. A brief<br />
description of each block follows.<br />
Message source<br />
Pseudo Noise (PN) sequences are used for this purpose. A PN<br />
sequence is generated with a 5-stage linear feedback shift<br />
register structure, see Figure 1, whose connection polynomial is<br />
given by<br />
( )<br />
h D D D<br />
2 5<br />
= 1+<br />
+ (1)<br />
where D denotes delay and the summations represent modulo 2<br />
additions.<br />
Figure 1: PN generation with linear feedback shift register.<br />
The sequence generated via Eq. (1) has a period of 31(=2 5 -1).<br />
Two PN sequence generators are used in order to create the<br />
message sequences for both the in-phase and quadrature phase<br />
components. In the constellation of 4-<strong>QAM</strong>, the reference<br />
signals are located at each quadrant.<br />
Frame marker bits are inserted in front of the generated PN<br />
sequences. This is done for frame synchronization which is<br />
SYSTEMICS, CYBERNETICS AND INFORMATICS VOLUME 4 - NUMBER 3
discussed later. A known bit sequence of length 10 is used as<br />
the frame marker. This frame marker is chosen to carry low<br />
correlation with PN sequences.<br />
Pulse shape filter<br />
The generated message sequences are passed through a raisedcosine<br />
FIR filter to create a band-limited baseband signal. The<br />
excess bandwidth beyond the Nyquist frequency is specified by<br />
a roll-off factor of the filter. In our implementation, a roll-off<br />
factor of 0.5 is used.<br />
<strong>QAM</strong> modulator<br />
The output of the raised cosine filter is then used to build a<br />
s% t , of a <strong>QAM</strong> signal expressed by<br />
complex envelope, ( )<br />
∞<br />
() = ∑ k T ( − )<br />
s% t c g t kT<br />
(2)<br />
k =−∞<br />
where c k indicates a complex message, made up of two real<br />
messages k a and k b , ck = ak + jbk<br />
.<br />
After modulating s% ( t)<br />
with<br />
j ct<br />
e ω<br />
signal, s( t ) , can be expressed as<br />
, the transmitted <strong>QAM</strong><br />
jωct ( ) =ℜ ⎡% ( ) ⎤<br />
⎣ ⎦<br />
= at () cos( ω t) −bt<br />
() sin ( ω t)<br />
st este<br />
c c<br />
where ℜe⎡⎤ ⎣⎦ ⋅ corresponds to the real part of the complex value<br />
inside the brackets.<br />
Hilbert transformer<br />
A Hilbert transformer builds the analytic signal for<br />
demodulation from the transmitted <strong>QAM</strong> signal. That is, if<br />
r( nT ) is considered to be the sampled received signal, the<br />
analytic signal r+ ( nT)<br />
is given by<br />
( ) ( ) ˆ(<br />
)<br />
(3)<br />
r+ nT = r nT + jr nT<br />
(4)<br />
where ˆr () ⋅ indicates the Hilbert transform of r () ⋅ . An FIR<br />
filter is used for its implementation.<br />
<strong>QAM</strong> demodulation<br />
This block involves the multiplication of a complex carrier<br />
having a negative frequency with the analytic signal obtained<br />
from the Hilbert transformer block.<br />
The complex envelope of the received <strong>QAM</strong> signal r% ( nT)<br />
can<br />
be expressed as<br />
( ) = + ( ) − jωcnT = a( nT) + jb( nT)<br />
r% nT r nT e<br />
Frame Synchronization<br />
Frame synchronization is required for properly grouping<br />
transmitted bits into an alphabet. To achieve this<br />
synchronization, a similarity measure, consisting of crosscorrelation,<br />
is computed between the known marker bits and<br />
(5)<br />
received samples. The cross-correlation of two complex values<br />
v and w is given by<br />
∞<br />
Rwv ⎡⎣ j⎤⎦= ∑ w⎡⎣n⎤⎦v⎡⎣n+ j⎤⎦<br />
(6)<br />
n=−∞<br />
where the bar denotes complex conjugate.<br />
Decision <strong>Based</strong> Carrier Tracking<br />
Let us now examine the phase offset, denoted by θ , between<br />
the transmitter and the receiver. <strong>Based</strong> on this offset, the<br />
received signal can be written as<br />
( ) = ( )<br />
r% nT r+ − j( ωcnT+ θ )<br />
nT e<br />
− jθ<br />
= ce ˆn<br />
where c ˆn indicates the output of a slicer mapping a received<br />
sample to the nearest ideal reference in the signal constellation.<br />
As a result, the baseband error at the receiver is given by<br />
( ) = − ( )<br />
(7)<br />
e% nT cˆn r% nT<br />
(8)<br />
Next, the LMS (least mean square) update method is used to<br />
∆ θ n given by<br />
minimize the phase error ( )<br />
{ % ( ) % ( ) }<br />
ℑmenTrnT<br />
∆ θ ( n)<br />
=<br />
c<br />
2<br />
n<br />
When both phase and frequency tracking are considered, the<br />
carrier phase of the receiver becomes the phase update ∆ ϕ ( n)<br />
and is given by<br />
( n) k ( n) ( n)<br />
1<br />
(9)<br />
∆ ϕ = ∆ θ + ψ<br />
(10)<br />
where ψ ( n)<br />
denotes the contribution of frequency tracking,<br />
which can be expressed as<br />
( n) ( n 1)<br />
k ( n)<br />
ψ = ψ − + ∆ θ<br />
(11)<br />
The scale factors k 1 and k 2 are configured to be small here<br />
and usually k1/ k2 ≥ 100 is required for phase convergence.<br />
The reader is referred to [2] for more theoretical details of the<br />
modem mentioned here.<br />
3. LABVIEW IMPLEMENTATION OF <strong>QAM</strong> MODEM<br />
This section presents the <strong>LabVIEW</strong> software implementation<br />
of the 4-<strong>QAM</strong> modem system. <strong>LabVIEW</strong> is a graphical<br />
programming environment which allows one to design<br />
complex DSP systems in a relatively time-efficient manner as<br />
compared to textual programming.<br />
A <strong>LabVIEW</strong> program consists of two major components: Front<br />
Panel (FP) and Block Diagram (BD). A Front Panel provides a<br />
graphical user interface while a Block Diagram contains<br />
building blocks of a system resembling a flowchart. <strong>LabVIEW</strong><br />
SYSTEMICS, CYBERNETICS AND INFORMATICS VOLUME 4 - NUMBER 3 55<br />
2
locks are called Virtual Instruments, or VIs. The interested<br />
reader is referred to [10-11] for details on <strong>LabVIEW</strong><br />
programming.<br />
A system-level BD of the <strong>QAM</strong> modem is shown in Figure 2.<br />
An overview description regarding the implementation of each<br />
block follows.<br />
<strong>QAM</strong> Transmitter<br />
Message source: The first component of the <strong>QAM</strong><br />
modem is the message source. Here, PN sequences are used for<br />
this purpose. Frame marker bits are inserted in front of these<br />
sequences to achieve frame synchronization. The BD of the<br />
Message Source VI is shown in Figure 3Error! Reference<br />
source not found..<br />
Note that the generated samples are oversampled 4 times<br />
according to the specification of the pulse shape filter. This is<br />
done by comparing with 0 the remainder of a global counter.<br />
Thus, out of four executions of this VI, one message sample<br />
(frame marker bit or PN sample) is generated. For the<br />
remaining three executions of the VI, zero samples get<br />
56<br />
Figure 2: System-level BD of 4-<strong>QAM</strong> modem system.<br />
Figure 3: Message Source VI.<br />
generated. The total length of the message for one period of a<br />
PN sequence and frame marker bits is 164, which is obtained<br />
by 4 (oversampling rate) × [10 (frame marker bits) + 31 (period<br />
of PN sequence)]. A constant array of 10 complex numbers is<br />
used to specify the marker bits. The real parts of the complex<br />
values are used as the frame marker bits of the in-phase<br />
samples and the imaginary parts as the frame marker bits of the<br />
quadrature-phase samples.<br />
The PN Generator VI, shown as an icon in Figure 3, generates<br />
a pseudo-noise sequence of length 31 by XORing the values of<br />
the second and fifth shift registers.<br />
Pulse shape filter: Next, the generated samples are<br />
passed through a pulse shape filter that is shown in Figure 4. A<br />
raised cosine filter is used to serve as the pulse shape filter. An<br />
FIR filter (FIR Filter PtByPt VI) is utilized for this purpose.<br />
The two outputs of the pulse shape filter are combined to<br />
construct the complex value pulse shaped message signal. The<br />
filter coefficients can be obtained by any filter design tool such<br />
as <strong>LabVIEW</strong> DFD toolkit and stored in an array of constants.<br />
SYSTEMICS, CYBERNETICS AND INFORMATICS VOLUME 4 - NUMBER 3
The coefficients are designed based on the specified<br />
oversampling rate, i.e. 4 in our case.<br />
Figure 4: Pulse shape filter.<br />
The output of the pulse shape filter is illustrated in Figure 5. As<br />
shown in the figure, the digital sequence is smoothed or filtered<br />
to minimize any intersymbol interference (ISI). The eye<br />
diagram of this signal is also shown in Figure 5.<br />
(a)<br />
(b)<br />
Figure 5: Pulse shape filter output and eye diagram.<br />
Modulator: The signal passed through the pulse<br />
shape filter is then connected to the <strong>QAM</strong> modulator shown in<br />
Figure 6. The <strong>QAM</strong> modulated signal s() t is obtained by<br />
taking the real part of the pre-envelope signal s+ ( t)<br />
. This is<br />
achieved by performing a complex multiplication between the<br />
complex input and a complex carrier consisting of a cosine and<br />
a sine waveform.<br />
Figure 6: <strong>QAM</strong> modulator.<br />
This completes the transmitter. Next, the receiver blocks are<br />
mentioned.<br />
<strong>QAM</strong> Receiver<br />
Hilbert transformer: The first module on the<br />
receiver side is the Hilbert transformer. This module builds the<br />
required analytic signal for demodulation based on the<br />
transmitted <strong>QAM</strong> signal. The Hilbert transformer is<br />
implemented as a bandpass filter with the specification<br />
indicated in Figure 7. To have an integer group delay, an even<br />
number, such as 32, is specified as the filter order.<br />
Figure 7: Analysis of Hilbert transformer.<br />
Once the coefficient set of the Hilbert transformer is acquired<br />
based on the supplied specifications, the Hilbert transformer is<br />
implemented using an FIR filter with the coefficients<br />
previously obtained. This VI is shown in Figure 8.<br />
Figure 8: Hilbert Transform VI.<br />
SYSTEMICS, CYBERNETICS AND INFORMATICS VOLUME 4 - NUMBER 3 57
A data queue (Data Queue PtByPt VI) is employed in order to<br />
synchronize the input and output of the Hilbert transformer. In<br />
other words, the input samples are delayed until the<br />
corresponding output samples become available. This is needed<br />
due to the group delay associated with the filtering operation.<br />
For an FIR filter of 33 taps or order of 32, the group delay is<br />
16. An array of numeric constants corresponding to the filter<br />
coefficients is set up based on the designed Hilbert transformer<br />
shown in Figure 7.<br />
Demodulator: The analytic signal obtained from the<br />
Hilbert transformer is demodulated by the <strong>QAM</strong> demodulator<br />
as illustrated in Figure 9. The demodulation process is similar<br />
to the modulation process except for the negative frequency<br />
part.<br />
Figure 9: <strong>QAM</strong> demodulator.<br />
Frame Synchronization: Next, the <strong>QAM</strong><br />
demodulated signal is decimated by 4. To achieve this, a Case<br />
Structure is used so that every fourth sample is selected for<br />
processing, as illustrated in Figure 2. The decimated signal is<br />
58<br />
Figure 10: Sync & Tracking VI – frame synchronization mode.<br />
sent to the Sync & Tracking VI for frame synchronization and<br />
phase/frequency tracking. The Sync & Tracking VI is an<br />
intermediate level subVI incorporating several<br />
subVIs/functions and operating in two different modes: frame<br />
synchronization and phase/frequency tracking.<br />
Let us examine the BD of this VI, which is displayed in Figure<br />
10. The input samples are passed into the receiver queue,<br />
implemented via the Complex Queue PtByPt VI, in order to<br />
obtain the beginning of a frame by cross-correlating the frame<br />
marker bits and received samples in the queue. Filling the<br />
queue is continued until the queue is completely filled. Extra<br />
iterations are done to avoid including any transient samples due<br />
to the delays associated with the filtering operations in the<br />
transmitter.<br />
The length of the queue is configured to be 51 in order to<br />
include the entire marker bits in the queue. This length is<br />
decided based on this calculation: 31 [(one period of PN<br />
sequence) + 2 × 10 (frame marker bits)]. Also, 16 extra<br />
samples are taken to flush out any possible transient output of<br />
the filter as mentioned previously. Bear in mind that the length<br />
of the queue or the number of extra reads varies based upon the<br />
specification of the transmitted signal such as the length of the<br />
frame marker bits and the number of taps of the phase shape<br />
filter. A counter, denoted by the Loop Count VI in Figure 10, is<br />
used to count the number of samples filling the queue. Once the<br />
queue is completely filled and extra reads are done, the frame<br />
synchronization module is initiated.<br />
The VI for frame synchronization is shown in Figure 11. In this<br />
VI, the cross-correlation of the frame marker bits and the<br />
samples in the receiver queue are computed. The absolute value<br />
of the complex output is used to obtain the cross-correlation<br />
peak since the location of this peak coincides with the<br />
beginning of the frame.<br />
SYSTEMICS, CYBERNETICS AND INFORMATICS VOLUME 4 - NUMBER 3
Figure 11: Frame Synchronization VI.<br />
Figure 12: Complex CrossCorrelation VI.<br />
In Figure 12, the Complex CrossCorrelation VI is shown. This<br />
VI accomplishes the complex cross-correlation operation by<br />
evaluating Eq. (6).<br />
Once the index of the maximum cross-correlation value is<br />
obtained, all data samples are taken at this location of the<br />
queue. Consequently, data bits are synchronized.<br />
Phase and frequency tracking: The initial phase<br />
estimation is achieved using the phase of the complex data at<br />
the beginning of the marker bits. Considering that the ideal<br />
reference is known for the first bit of the frame marker, 1+ i in<br />
our case. This allows us to obtain the phase difference between<br />
the ideal reference and the received frame marker bits. The real<br />
and imaginary parts of data at the beginning of the marker bits<br />
are also passed to the Phase and Frequency Tracking VI to<br />
provide the initial constellation.<br />
The subVI of the frame synchronization is now complete. Note<br />
that in order to control the flow of data for the frame<br />
synchronization, local variables, shown as a label with two<br />
border lines, are used in the BD. More details on using local<br />
and global variables can be found in [10].<br />
The initial value of the local variable, denoted by Sync, is set to<br />
true to execute the frame synchronization. Then, it is changed<br />
to false within the case structure so that it is not invoked again.<br />
The other two local variables, Initial Const and Delay Index,<br />
are used as the inputs of the phase and frequency tracking<br />
module, see Figure 13.<br />
Figure 13: Sync & Tracking VI – phase and frequency tracking<br />
mode.<br />
Next, let us describe the Phase and Frequency Tracking VI<br />
illustrated in Figure 14. A Formula Node, shown as a box with<br />
thick gray border, is capable of evaluating a script including a<br />
C or a MATLAB text-based code. The formula node shown in<br />
the upper part of the BD acts as a slicer to determine the<br />
nearest ideal reference based on the quadrant on the I-Q plane.<br />
There are numerous built-in mathematical functions and<br />
variables in <strong>LabVIEW</strong> which can be used in a formula node.<br />
For example, pi represents π in the formula node script shown<br />
in Figure 13. Further details on formula node appear in [11].<br />
The phase error, see the BD in Figure 14, is computed from Eq.<br />
(9). This error is multiplied by a small scale factor to determine<br />
the phase update ∆ ϕ ( n)<br />
in a second formula node<br />
corresponding to Eq. (11).<br />
In what follows, we provide key features of <strong>LabVIEW</strong> that are<br />
utilized for our implementation. The same features can be<br />
utilized for implementing other types of SDR.<br />
Formula node: Formula node allows one to use Clike<br />
code in <strong>LabVIEW</strong>. In Figure 13, logical comparisons and<br />
simple mathematical equations are written in the form of Clanguage<br />
within the gray enclosure called Formula Node.<br />
Digital Filtering: The digital filtering operations<br />
used in pulse shaping and Hilbert transformation can be<br />
achieved through a <strong>LabVIEW</strong> toolkit called <strong>LabVIEW</strong> DFD.<br />
Modulation-Demodulation: Though not utilized in<br />
our implementation, the <strong>LabVIEW</strong> Modulation toolkit can be<br />
used to implement the widely used modulation and<br />
demodulation schemes.<br />
Point-by-point processing: <strong>LabVIEW</strong> supports<br />
point-by-point processing in addition to vector/matrix<br />
processing. Thus, all the filtering and modulation VIs can be<br />
carried out based on point-by-point processing.<br />
Other features: <strong>LabVIEW</strong> DSP Integration &<br />
<strong>LabVIEW</strong> FPGA toolkits require no textual coding. These<br />
toolkits generate the object code for specific target platforms,<br />
e.g. TI TMS320C6713 DSK. Hence, the development time can<br />
be shortened by using these tools. Also, Mathscripting is a<br />
newly added feature of <strong>LabVIEW</strong> allowing one to incorporate<br />
MATLAB compatible scripts into the <strong>LabVIEW</strong> graphical<br />
programming environment.<br />
SYSTEMICS, CYBERNETICS AND INFORMATICS VOLUME 4 - NUMBER 3 59
It is worth mentioning that other graphical tools such as<br />
Simulink can be used for the implementation of SDR.<br />
<strong>LabVIEW</strong> is used here since in a comparative study reported in<br />
[12], it is shown that <strong>LabVIEW</strong> provides preferred interactivity<br />
and graphical-user-interface capabilities.<br />
In summary, as compared to a hardware-based solution, the<br />
<strong>LabVIEW</strong>-based SDR implementation presented in this work<br />
has enabled a rapid prototyped software solution. Moreover, in<br />
this solution, C and MATLAB textual codes can be integrated<br />
in a seamless manner. The built SDR VI can be easily<br />
converted to object codes for a number of specific target<br />
platforms.<br />
4. SIMULATION RESULTS<br />
This section provides the simulation study done to test the<br />
performance of the SDR modem system. To watch the<br />
simulation outcome, a waveform chart and an XY graph are<br />
added to the system-level BD shown in Figure 2.<br />
If there exist a phase and a frequency offset with no tracking,<br />
the received signal appears as shown in Figure 15. As<br />
displayed in this figure, the constellation of the received signal<br />
is rotated, and the amplitudes of some of the received samples<br />
become too small. Obviously, the received signal will change<br />
by introducing channel noise.<br />
By executing the phase tracking routine, the phase error,<br />
affected by the initial phase and frequency difference, is<br />
minimized and the received signal becomes a perfect<br />
reproduction of the transmitted signal except for the time delay.<br />
This is illustrated in Figure 16.<br />
More specifically, the change in the constellation via the phase<br />
and frequency tracking is shown in Figure 16. The constellation<br />
of the samples in the I-Q plane becomes that of the ideal<br />
60<br />
Figure 14: Phase & Frequency Tracking VI.<br />
reference as the tracking operation progresses. Figure 16<br />
illustrates a typical compensation achieved for the phase and/or<br />
frequency offset between the transmitter and receiver. The<br />
results show that the developed software-defined radio system<br />
provides successful decoding of the transmitted message<br />
samples.<br />
Figure 15: Received signal with no phase & frequency<br />
tracking.<br />
SYSTEMICS, CYBERNETICS AND INFORMATICS VOLUME 4 - NUMBER 3
Figure 16: Perfect reproduction of transmitted signal with<br />
phase & frequency tracking.<br />
(a)<br />
(b)<br />
Figure 16: 4-<strong>QAM</strong> constellation: (a) phase offset exists<br />
between transmitter/receiver (ideal references are indicated by<br />
‘o’), and (b) outcome of phase and frequency tracking process.<br />
5. CONCLUSION<br />
In this paper, it is shown how <strong>LabVIEW</strong> can be used to build a<br />
software-defined radio system. In particular, a 4-<strong>QAM</strong> modem<br />
system consisting of a message source, a pulse shape filter, a<br />
modulator, an automatic gain controller, a Hilbert transformer,<br />
demodulator, a frame synchronizer, and a phase and frequency<br />
tracker was built in the graphical programming environment of<br />
<strong>LabVIEW</strong>. Basically, the use of <strong>LabVIEW</strong> allowed this<br />
interactive software-defined radio system to be built in a<br />
shorter time as compared to text-based programming<br />
languages.<br />
6. ACKNOWLEDGEMENT<br />
This work was supported by a grant from National Instruments<br />
to University of Texas at Dallas.<br />
7. REFERENCES<br />
[1] W. Tuttlebee, <strong>Software</strong> <strong>Defined</strong> <strong>Radio</strong>: Baseband<br />
Technologies for 3G Handsets and Basestations, John<br />
Wiley & Sons , 2004.<br />
[2] C. Johnson, Jr., and W. Sethares, Telecommunication<br />
Breakdown: Concepts of Communication Transmitted<br />
via <strong>Software</strong>-<strong>Defined</strong> <strong>Radio</strong>, Prentice-Hall, 2004.<br />
[3] S. Tretter, Communication System Design Using DSP<br />
Algorithms, Klumer Academic/Plenum Publishers, 2003.<br />
[4] J. Mitola, "The <strong>Software</strong> <strong>Radio</strong> Architecture," IEEE<br />
Communication Magazine, vol. 33, no. 5, May 1995, pp.<br />
26–38.<br />
[5] GNU <strong>Radio</strong> - The GNU <strong>Software</strong> <strong>Radio</strong> Project.<br />
http://www.gnu.org/software/gnuradio/<br />
[6] D. Bryan, "<strong>QAM</strong> for Terrestrial and Cable Transmission",<br />
IEEE Trans. Consumer Electronics, vol. 41, no. 3, pp.<br />
383-391, 1995.<br />
[7] G. Karam, K. Maalej, V. Paxal, and H. Sari, "Variable<br />
Symbol-rate Demodulators for Cable and Satellite TV<br />
Broadcasting," IEEE Trans. Broadcasting, vol. 42, no.<br />
2, 1996, pp. 102-109.<br />
[8] L. D'Luna et al., "A Single-chip Universal Cable Set-top<br />
Box/<strong>Modem</strong> Transceiver," IEEE Journal of Solid-State<br />
Circuits, vol. 34, no. 11, 1999, pp. 1647-1660.<br />
[9] Sundance, <strong>Software</strong> <strong>Defined</strong> <strong>Radio</strong> Development<br />
Platform. http://focus.ti.com/lit/ml/sprt348a/sprt348a.pdf<br />
[10] N. Kehtarnavaz and N. Kim, Digital Signal Processing<br />
System-Level Design Using <strong>LabVIEW</strong>, Elsevier, 2005.<br />
[11] National Instruments, <strong>LabVIEW</strong> User Manual, Part<br />
Number 320999E-01, 2003.<br />
[12] N. Kehtarnavaz and C. Gope, “DSP System Design Using<br />
Labview and Simulink: A Comparative Evaluation,”<br />
Proceedings of ICASSP, vol. 2, 2006, pp. 985-988.<br />
SYSTEMICS, CYBERNETICS AND INFORMATICS VOLUME 4 - NUMBER 3 61