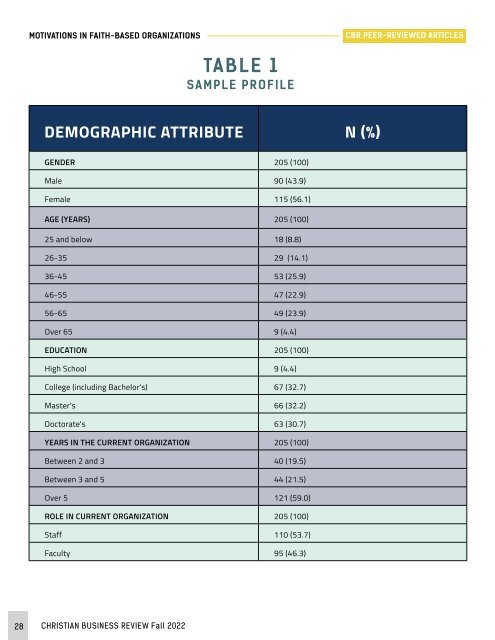
MOTIVATIONS IN FAITH-BASED ORGANIZATIONS CBR PEER-REVIEWED ARTICLES TABLE 1 SAMPLE PROFILE DEMOGRAPHIC ATTRIBUTE N (%) GENDER 205 (100) Male 90 (43.9) Female 115 (56.1) AGE (YEARS) 205 (100) 25 and below 18 (8.8) 26-35 29 (14.1) 36-45 53 (25.9) 46-55 47 (22.9) 56-65 49 (23.9) Over 65 9 (4.4) EDUCATION 205 (100) High School 9 (4.4) College (including Bachelor's) 67 (32.7) Master's 66 (32.2) Doctorate's 63 (30.7) YEARS IN THE CURRENT ORGANIZATION 205 (100) Between 2 and 3 40 (19.5) Between 3 and 5 44 (21.5) Over 5 121 (59.0) ROLE IN CURRENT ORGANIZATION 205 (100) Staff 110 (53.7) Faculty 95 (46.3) 28 CHRISTIAN BUSINESS REVIEW Fall <strong>2022</strong>
MOTIVATIONS IN FAITH-BASED ORGANIZATIONS CBR PEER-REVIEWED ARTICLES METHODOLOGY RESPONDENTS AND PROCEDURE We tested the six hypotheses in a cross-sectional online survey in four <strong>Christian</strong> colleges in Canada, using an internet-based survey. All four are attached to a religious organization or tradition, have strong statements of faith and deeply embed faith in their operational structure, meeting Torry’s FBO definition. 10 The link to the survey was sent to faculty and staff in each university, after permission from management. The respondents were informed that the purpose of the survey was to examine various motivational factors in FBOs. We added two screening questions to ensure that only faculty and staff (not administrators) would be included in the survey and that only employees who had been working at the university continuously for at least two years would be included (recognizing that it may take time for the three motivating factors to have an effect on job satisfaction). Questions in the survey included measures of job satisfaction, personal faith, perceived fit between personal and organizational faith, TL, motivation, demographics, and job-related questions (i.e., age, gender, education level, and years in the organization). 36 Three hundred and five respondents attempted to participate, resulting in a response rate of 43.70% (cumulatively, the four universities have 698 employees). 37 We removed 98 responses because of either the two noted restrictions or missing data. We eliminated two more responses because of unengaging behaviors (too short a time to complete the survey). As a result, the final sample size was 205. As some questions asked respondents to evaluate the transformational leadership of their immediate supervisors, we anticipated there would be some unwillingness to provide accurate answers out of a concern that data would be disclosed. To overcome this possible response bias, we purposely did not ask respondents to identify their university, in addition to providing confidentiality guarantees. We were then unable to compare response patterns across the universities as well as leaving university management unexamined as an exogenous variable; however, the discrepancies in responses are likely to be low because of similar mission and organizational faith. A random drawing for three gift cards was offered as an incentive to participate. Table 1 provides the sample profile. MEASURES There are various schools of transformational leadership. For example, Anthony and Schwartz identify five characteristics of transformational leaders (e.g., they tend to be “insider outsiders”, and use cultural change to drive engagement). 38 Lancefield and Rangen describe four actions that transformational leaders often take (e.g., sharing leadership more systematically, and making empowerment live up to its promise). 39 In this research, we adopted the 15-item seven-point scale to measure transformational leadership from Bass and Avolio’s Multifactor Leadership Questionnaire, 40 including four, four, three, and four items for idealized influence, inspirational motivation, intellectual stimulation, and individualized consideration, respectively. The fit indexes for the four first-order factors plus one second-order factor fell within an acceptable range (χ 2 (86) = 240.31, p < .001; comparative fit index [CFI] = .95; Tucker–Lewis index [TLI] = .94; root mean square error of approximation [RMSEA] = .09 (slightly higher than the .08 cutoff value); standardized root mean square residual [SRMR] = .04), suggesting that the dimensions we used reflected the transformational leadership construct. Based on the definitions of expectancy, instrumentality, and valence, we developed four, four, and three measurement items to measure the three concepts, respectively. We dropped one item each for expectancy and instrumentality due to low factor loadings, which resulted in a nine-item seven-point scale to measure motivation, including three items each for expectancy, instrumentality, and valence. The fit indexes for the three first-order factors plus one second-order factor fell within an acceptable range (χ 2 (24) = 65.13, p < .001; CFI = .98; TLI = .97; RMSEA = .09 (slightly higher than the .08 cutoff value); SRMR = .06); thus, the dimensions we used reflected the motivation construct. We used a four-item seven-point scale to measure personal faith, adapted from the Spiritual Transcendence Index. 41 We drafted four measurement items based on the definition of perceived fit between personal and organizational faith. We dropped one item with low factor loading, which resulted in a three-item seven-point scale to measure perceived fit. We measured job satisfaction with a three-item seven-point scale adapted from the satisfaction with overall job scale. 42 All variables had good Cronbach’s alpha values. All constructs demonstrated convergent and discriminant validity. Average CHRISTIAN BUSINESS REVIEW Fall <strong>2022</strong> 292