Download the Journal - Transportation Research Forum
Download the Journal - Transportation Research Forum
Download the Journal - Transportation Research Forum

Create successful ePaper yourself
Turn your PDF publications into a flip-book with our unique Google optimized e-Paper software.
Volume 50, Number 1 Spring 2011<br />
<strong>Transportation</strong> <strong>Research</strong> <strong>Forum</strong><br />
NDSU Dept. 2880<br />
PO Box 6050<br />
Fargo, ND 58108-6050<br />
www.trforum.org
<strong>Journal</strong> of <strong>the</strong> <strong>Transportation</strong> <strong>Research</strong> <strong>Forum</strong><br />
The <strong>Transportation</strong> <strong>Research</strong> <strong>Forum</strong>, founded in 1958, is an independent, nonprofit organization of transportation<br />
professionals who conduct, use, and benefit from research. Its purpose is to provide an impartial meeting ground<br />
for carriers, shippers, government officials, consultants, university researchers, suppliers, and o<strong>the</strong>rs seeking<br />
exchange of information and ideas related to both passenger and freight transportation. More information on<br />
<strong>the</strong> <strong>Transportation</strong> <strong>Research</strong> <strong>Forum</strong> can be found on <strong>the</strong> Web at www.trforum.org.<br />
General Editors: Michael W. Babcock, Kansas State University and Kofi Obeng, North Carolina A&T State<br />
University<br />
Book Review Editor: Jack S. Ventura, Surface <strong>Transportation</strong> Board<br />
Associate Editors:<br />
Richard Gritta, University of Portland; Robert Harrison, University of Texas; Kevin H. Horn, G.E.C. Inc.;<br />
Wesley Wilson, University of Oregon; Barry Prentice, University of Manitoba; Carl Scheraga, Fairfield<br />
University; and John Bitzan, North Dakota State University.<br />
Disclaimer:<br />
The facts, opinions, and conclusions set forth in <strong>the</strong> articles contained herein are those of <strong>the</strong> authors and<br />
quotations should be so attributed. They do not necessarily represent <strong>the</strong> views and opinions of <strong>the</strong> <strong>Transportation</strong><br />
<strong>Research</strong> <strong>Forum</strong> (TRF), nor can TRF assume any responsibility for <strong>the</strong> accuracy or validity of any of <strong>the</strong><br />
information contained herein.<br />
Subscriptions:<br />
The <strong>Journal</strong> of <strong>the</strong> <strong>Transportation</strong> <strong>Research</strong> <strong>Forum</strong> (JTRF) is distributed to members of <strong>the</strong> <strong>Transportation</strong><br />
<strong>Research</strong> <strong>Forum</strong> and subscribers.<br />
Currently, <strong>the</strong> JTRF is published three times per year. Annual subscriptions are available to <strong>the</strong> general public<br />
for $150 and must be purchased for a calendar year.<br />
An electronic version (PDF format) is available for $50 per <strong>Journal</strong> or single <strong>Journal</strong> articles for $10 each.<br />
Subscriptions and/or membership applications may be obtained from <strong>the</strong> following office or online at<br />
www.trforum.org<br />
Copyright 2011<br />
The <strong>Transportation</strong> <strong>Research</strong> <strong>Forum</strong><br />
All Rights Reserved<br />
ISSN 1046-1469<br />
Published and Distributed by<br />
<strong>Transportation</strong> <strong>Research</strong> <strong>Forum</strong><br />
NDSU Dept. 2880<br />
P.O. Box 6050<br />
Fargo, ND 58108-6050<br />
P: (701) 231-7766 • F: (701) 231-1945<br />
or apply online at www.trforum.org
<strong>Journal</strong> of <strong>the</strong> <strong>Transportation</strong> <strong>Research</strong> <strong>Forum</strong><br />
Volume 50, Number 1 • Spring 2011<br />
Table of Contents<br />
A Message from <strong>the</strong> JTRF Co-General Editors 3<br />
Kofi Obeng and Michael W. Babock<br />
ARTICLES<br />
Safety Analysis of Continuous Green Through Lane Intersections 5<br />
Thobias Sando, Deo Chimba, Valerian Kwigizile, and Holly Walker<br />
Transit Passenger Perceptions: Face-to-Face Versus Web-Based Survey 19<br />
Laura Eboli and Gabriella Mazzulla<br />
Methodology for Measuring Output, Value Added, and Employment Impacts of<br />
State Highway and Bridge Construction Projects 37<br />
Michael W. Babcock and John C. Lea<strong>the</strong>rman<br />
Rail Rate and Revenue Changes Since <strong>the</strong> Staggers Act 55<br />
Ken Casavant, Eric Jessup, Marvin E. Prater, Bruce Blanton, Pierre Bahizi,<br />
Daniel Nibarger, Johnny Hill, and Isaac Weingram<br />
Measuring Bulk Product <strong>Transportation</strong> Fuel Efficiency 79<br />
C. Phillip Baumel<br />
Demand Analysis for Coal on <strong>the</strong> United States Inland Waterway System:<br />
Fully Modified Cointegration (FM-OLS) Approach 89<br />
Junwook Chi and Jungho Baek<br />
State of <strong>the</strong> Art: Centerline Rumble Strips Usage in <strong>the</strong> United States 101<br />
Daniel E. Karkle, Margaret J. Rys, and Eugene R. Russell<br />
BOOK REVIEW<br />
Understanding <strong>the</strong> Railway Labor Act 119<br />
Gordon P. MacDougall<br />
On <strong>the</strong> cover: Barge transportation on <strong>the</strong> inland waterways plays a large role in <strong>the</strong> transport of crude oil,<br />
petroleum products, coal, grain, and ores. In “Demand Analysis for Coal on <strong>the</strong> United States Inland Waterway<br />
System: Fully Modified Cointegration Approach,” Junwook Chi and Jungho Baek examine <strong>the</strong> dynamic<br />
relationship between demand for coal barge transportation and variables such as barge and rail rates, domestic<br />
coal consumption and production, and coal exports.<br />
1
<strong>Transportation</strong> <strong>Research</strong> <strong>Forum</strong> 121<br />
Statement of Purpose 121<br />
History and Organization 121<br />
Annual Meetings 122<br />
TRF Council 123<br />
TRF Foundation Officers 123<br />
Past Presidents 124<br />
Recipients of <strong>the</strong> TRF Distinguished <strong>Transportation</strong> <strong>Research</strong>er Award 124<br />
Recipients of <strong>the</strong> Herbert O. Whitten TRF Service Award 124<br />
Past Editors of JTRF 125<br />
Recipients of <strong>the</strong> TRF Best Paper Award 125<br />
Guidelines for Manuscript Submission 127<br />
2
A Message from <strong>the</strong> JTRF<br />
Co-General Editors<br />
The papers in this issue of <strong>the</strong> JTRF cover topics ranging from passenger to freight transportation<br />
and from highway safety to rail revenue. The specific topics addressed are:<br />
• Transit passenger perceptions from face-to-face and web-based survey<br />
• Safety analysis of continuous green through lane intersections<br />
• The use of centerline rumble strips in <strong>the</strong> United States<br />
• Methodology for measuring output, value added, and employment impacts of state highway<br />
and bridge construction projects<br />
• Measuring bulk product transportation fuel efficiency<br />
• Demand analysis for coal on <strong>the</strong> United States inland waterway system<br />
• Rail rate and revenue changes since <strong>the</strong> Staggers Act.<br />
Eboli and Mazulla use a relatively homogeneous group of respondents–university students–<br />
who commute by bus to collect customer satisfaction and importance rating data from web-based<br />
and face-to-face surveys. Then, using paired t-test, Fisher F-test, and discriminant analysis <strong>the</strong>y<br />
compare responses from <strong>the</strong>se surveys to determine if <strong>the</strong>re are statistical differences between <strong>the</strong>m.<br />
They found that <strong>the</strong> average importance ratings in <strong>the</strong> face-to-face surveys were generally higher<br />
than those from <strong>the</strong> web-based surveys. This led Eboli and Mazulla to surmise that users tend to<br />
give more importance to service characteristics in face-to-face interviews than <strong>the</strong>y do when <strong>the</strong>y<br />
complete a questionnaire. For satisfaction rating <strong>the</strong>y found significant differences between <strong>the</strong><br />
samples in terms of service frequency, reliability of runs, facilities at bus stops, and availability of<br />
service frequency. They also found similarities in <strong>the</strong> ratings of satisfaction and importance in <strong>the</strong><br />
web-based survey and recommended asking respondents only satisfaction ratings questions in webbased<br />
survey.<br />
Contrary to <strong>the</strong> Eboli and Mazulla paper, two papers in this issue deal with safety analysis.<br />
The first by Sando et al. analyzes <strong>the</strong> levels of injury severity from crashes at intersections with<br />
continuous green through lanes in Florida using paired t-test and ordered probit statistical models.<br />
Among <strong>the</strong>ir findings are more rear-ended crashes followed by sideswipe crashes and crashes from<br />
left-turning vehicles. In terms of crash severity, <strong>the</strong>y found that angle crashes and crashes from<br />
lane changing maneuvers were more severe than rear-end crashes. They also found higher injury<br />
severities for drivers 65 years and older and lower injury severity for crashes which occur during<br />
<strong>the</strong> day. These findings led Sando et al. to suggest advance warning signs for <strong>the</strong> presence of such<br />
an intersection on a road. The second safety paper is by Karkle et al. and deals with centerline<br />
rumble strips. This paper’s objective is to survey states about <strong>the</strong>ir policies and guidelines in using<br />
centerline rumble strips and identify gaps in research along with good practices. They found 11,233<br />
miles of centerline rumble strips throughout <strong>the</strong> United States (excluding Texas and Colorado) and<br />
did not find many states with written policies for <strong>the</strong>ir use.<br />
Babcock and Lea<strong>the</strong>rman develop an input-output methodology involving 11 steps to measure<br />
<strong>the</strong> output, value added, and employment economic impacts of various types of highway and bridge<br />
improvement programs. They applied <strong>the</strong> model to <strong>the</strong> Kansas Comprehensive <strong>Transportation</strong><br />
Program and concluded that <strong>the</strong>ir method can be used to estimate <strong>the</strong> impacts of any type of highway<br />
improvement once <strong>the</strong> contract values of <strong>the</strong> highway improvement programs are known because<br />
each highway improvement has a different multiplier.<br />
Casavant et al. study changes in <strong>the</strong> rail rate structure for agricultural commodities since <strong>the</strong><br />
implementation of <strong>the</strong> Staggers Act and compares <strong>the</strong>m to changes in <strong>the</strong> rates of o<strong>the</strong>r products<br />
3
over <strong>the</strong> same period. They found that rail rates for agricultural products are higher than those of<br />
o<strong>the</strong>r commodities and increased more rapidly from 2004-2008. Fur<strong>the</strong>r, <strong>the</strong>y found that rail rates<br />
are lower for large volume shipments, especially those using multiple rail cars, but <strong>the</strong> rates for<br />
large shipments increased faster than <strong>the</strong> rates for smaller shipments. O<strong>the</strong>r findings are that on a per<br />
ton-mile basis, <strong>the</strong> rates for distances less than 500 miles are larger than those for distances of 750<br />
miles. Additionally, <strong>the</strong>y found railroads have shifted car ownership costs to shippers, and railroads<br />
recover fuel costs through surcharges.<br />
The last two studies deal with bulk shipment transportation. Chi and Baek analyze <strong>the</strong> demand for<br />
coal barge transportation in <strong>the</strong> United States using <strong>the</strong> Phillip-Hansen fully modified cointegration<br />
method to determine <strong>the</strong> factors affecting coal movement and <strong>the</strong> substitution effects between rail<br />
and barge carriers. They used <strong>the</strong> volume of coal transportation as <strong>the</strong> dependent variable and coal<br />
barge rate, coal export level, domestic coal production, domestic consumption of coal and <strong>the</strong><br />
rates of o<strong>the</strong>r transportation modes as <strong>the</strong> independent variables. Their results showed one stable<br />
equilibrium and long run demand for barge transportation that is more responsive to changes in<br />
domestic coal exports and domestic coal consumption than barge and rail rates. In <strong>the</strong> short run, <strong>the</strong>y<br />
found <strong>the</strong> demand for transporting coal by barges is responsive to domestic coal production only.<br />
Baumel also examines bulk product transportation, but in terms of fuel efficiency. His analysis<br />
shows that fuel efficiency based only on net ton miles per gallon can produce erroneous results. To<br />
correct this problem he provides alternative measures of fuel efficiency, such as total fuel consumed<br />
from origin to destination by each mode and argues <strong>the</strong>y can improve <strong>the</strong> accuracy of fuel efficiency<br />
comparisons.<br />
Michael W. Babcock Kofi Obeng<br />
Co-General Editor Co-General Editor<br />
4
Safety Analysis of Continuous Green<br />
Through Lane Intersections<br />
by Thobias Sando, Deo Chimba, Valerian Kwigizile and Holly Walker<br />
This paper examines safety characteristics of continuous green through lane (CGTL) intersections<br />
using paired-t test and ordered probit (OP) statistical models. The results suggest that <strong>the</strong>re is a<br />
significant difference between <strong>the</strong> proportions of sideswipe crashes in <strong>the</strong> CGTL direction compared<br />
with <strong>the</strong> opposite direction. However, <strong>the</strong> results did not suggest a significant difference between <strong>the</strong><br />
proportions of rear-end and right-angle crashes for <strong>the</strong> CGTL and normal directions. The results<br />
fur<strong>the</strong>r suggest that angle crashes and crashes involving lane changing maneuvers are significantly<br />
more severe compared with rear-end crashes.<br />
INTRODUCTION<br />
Escalating traffic demands on urban roadways have caused traffic engineers to use various measures<br />
to reduce congestion, especially at signalized intersections. <strong>Transportation</strong> agencies are using<br />
unconventional measures where conventional measures have been exhausted. One unconventional<br />
low cost design strategy used in parts of Florida is <strong>the</strong> installation of continuous green through<br />
lanes (CGTLs). These lanes are used to<br />
reduce increasing demand for longer green<br />
times for through movement at intersections<br />
with considerably higher through volumes.<br />
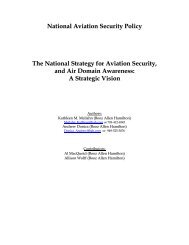
CGTLs are “T” intersections with one<br />
or two through lanes on <strong>the</strong> mainline leg<br />
receiving a continuous green indication,<br />
i.e., passing without stopping, while <strong>the</strong><br />
inside through lane(s) in <strong>the</strong> same direction<br />
receive conventional green, yellow, and red<br />
indications (Figure 1). Installation of CGTLs<br />
is less costly than intersection widening<br />
alternatives, hence in most cases <strong>the</strong>y<br />
provide a cost effective solution for handling<br />
high through traffic at T-intersections.<br />
Although CGTLs have been used for<br />
Figure 1: An Example of CGTL Intersection<br />
more than three decades in Florida and <strong>the</strong>ir operational benefits are evident, <strong>the</strong>y are still considered<br />
a relatively new design alternative which many agencies are reluctant to approve. There have been<br />
mixed reviews of <strong>the</strong> suitability and effectiveness of CGTL intersections in Jacksonville, Florida.<br />
This is because citizens feel <strong>the</strong>y are not safe, especially for motorists unfamiliar with <strong>the</strong>ir design,<br />
and this has led to <strong>the</strong>ir removal from several locations while new ones continue to be installed<br />
in o<strong>the</strong>r locations. This study evaluates different crash patterns that occur at CGTLs and fur<strong>the</strong>r<br />
analyzes <strong>the</strong> influence of roadway, traffic, driver, and environmental conditions on injury severity<br />
for different crash patterns.<br />
The rest of <strong>the</strong> paper is organized as follows: The next section provides a summary of <strong>the</strong><br />
literature on <strong>the</strong> analysis of crash patterns at intersections. It is followed by a methodology section<br />
which outlines <strong>the</strong> analytical techniques used in this study. The methodology section is followed by<br />
<strong>the</strong> results where <strong>the</strong> findings are discussed and explanations offered for <strong>the</strong>m. The final section of<br />
<strong>the</strong> paper presents <strong>the</strong> conclusions and recommendation.<br />
5
Safety Analysis<br />
LITERATURE REVIEW<br />
Many previous studies have evaluated crash patterns at signalized intersections. Wang and Abdel-<br />
Aty (2008) evaluated left-turn crashes occurring at 197 four-legged signalized intersections<br />
(intersections connecting four roadway segments) in Florida and found that traffic flows, <strong>the</strong> width<br />
of <strong>the</strong> crossing distance and signal phasing, affect left-turn crashes. Mitra et al. (2002) studied rightangled<br />
and rear-end crashes by maneuver type at four-legged signalized intersections in Singapore.<br />
The results indicated that <strong>the</strong> presence of uncontrolled left-turn channels, wider medians, higher<br />
approach volumes, and an increase in signal phase are <strong>the</strong> most important factors that increase<br />
accidents from both types of maneuvers. In an attempt to develop expected conflict value tables for<br />
unsignalized three-legged intersections, Weerasuriya and Pietrzyk (1998) modeled conflict types<br />
at unsignalized three-legged intersections. They divided conflicts into three main groups: same<br />
direction, opposing direction, and cross traffic conflicts, which were fur<strong>the</strong>r subdivided into 12<br />
crash categories. Traffic conflicts increased as <strong>the</strong> number of lanes increased. For example, <strong>the</strong>y<br />
observed an average of about 70 rear-end conflicts on three-legged 2 x 6 intersections with six lanes<br />
in <strong>the</strong> major street and two lanes in <strong>the</strong> minor street. About 20 rear-end conflicts on average were<br />
observed for three-legged 2 x 2 (two lanes for minor street and two lanes for major street) and 2<br />
x 4 intersections, i.e., intersections with two lanes for minor street and four lanes for major street.<br />
Persaud and Nguyen (1998) developed safety performance models for four-legged intersections<br />
based on 25 specific crash patterns, which were defined by <strong>the</strong> movements of <strong>the</strong> accident vehicles<br />
prior to collisions. Out of <strong>the</strong> 25 patterns, <strong>the</strong> leading three patterns in property damage only crashes<br />
in <strong>the</strong> order of importance were rear-end, left-turn versus opposing through traffic, and right-angle<br />
crashes. Additionally, <strong>the</strong> proportion of crashes that involved left-turn versus opposing through<br />
traffic was <strong>the</strong> highest, followed by right-angle and rear-end crashes among severe crashes.<br />
Whereas <strong>the</strong>re is a growing body of research about modeling intersection crash data and crash<br />
patterns in particular, <strong>the</strong>re is still a lack of an overall picture of <strong>the</strong> safety characteristics of CGTL<br />
intersections, particularly crash patterns. The literature on <strong>the</strong> safety of CGTLs is limited. Hummer<br />
and Boone (1995) investigated possible gains in travel efficiency from three unconventional<br />
strategies, including median U-turn, two different CGTLs, and <strong>the</strong> North Carolina bowtie<br />
intersection. The Florida and North Carolina versions of <strong>the</strong> CGTLs provided substantial reductions<br />
in travel time and stops for through volumes less than 700 vehicles per hour per lane. Jarem (2004)<br />
evaluated <strong>the</strong> safety and cost-and-benefit ratios of five CGTL intersections in Orlando, Florida, and<br />
found that crashes related to CGTLs ranged from 8% to 24% for <strong>the</strong> five intersections that were<br />
investigated. Most of <strong>the</strong> crashes were rear-end caused by unexpected stopping of vehicles in <strong>the</strong><br />
CGTLs followed by sideswipe crashes caused by erratic lane changes of vehicles from non-CGTLs<br />
to avoid a red light. Few crashes involved left-turn vehicles encroaching on CGTLs, and each of <strong>the</strong><br />
five intersections had a different magnitude of each type of crash related to <strong>the</strong> CGTL.<br />
Although <strong>the</strong> levels of CGTL related crashes reported by Jarem (2004) differ for <strong>the</strong> intersections<br />
that were investigated, he does not study <strong>the</strong> influence of site characteristics on <strong>the</strong> occurrence of<br />
different types of crashes at CGTLs. The study reported herein was conducted on all CGTLs in<br />
Jacksonville with <strong>the</strong> purpose of quantifying <strong>the</strong> effects of site characteristics on <strong>the</strong> safety of CGTL<br />
intersections.<br />
METHODOLOGY<br />
Data<br />
At <strong>the</strong> beginning of this study, <strong>the</strong> city of Jacksonville had a total of 17 known CGTL intersections.<br />
Eight of <strong>the</strong>m (shaded intersections in Table 1) have been converted to traditional intersection<br />
configurations or have had major maintenance or construction work done between 2003 and 2008<br />
and were not considered in this study, leaving only nine (sites one though nine in Table 1) to be<br />
6
JTRF Volume 50 No. 1, Spring 2011<br />
studied. Several data sources, including drawings, condition diagrams, intersection photos, aerial<br />
photographs, and straight line diagrams, were used to examine differences in site characteristics<br />
between <strong>the</strong> intersections. These sources toge<strong>the</strong>r with field visits were used to collect data on<br />
intersection characteristics such as configurations, land use proximity and location of driveways,<br />
signs and pavement markings, and number of CGTLs.<br />
Table 1: List of CGTL Intersections in Jacksonville, Florida<br />
No. Intersection Install Date Removal Date<br />
1 US 17 @ Ortega Forest Dr. 2/3/1987 -<br />
2 US 17 @ Entrance to Roosevelt Mall 10/13/1986 -<br />
3 US 17 @ Park Street South 9/29/1983 -<br />
4 US 17 @ Long Bow Rd. 5/1/1972 -<br />
5 US 17 @ Baisden Road 2/1/1991 -<br />
6 US 1 @ 45th Street 10/4/1978 -<br />
7 Normandy @ Country Creek 5/1/1985 -<br />
8 Normandy@ I-295 - -<br />
9 SR 13 @ Beauclerc Rd. 10/12/1973 -<br />
10 US 17 @ I-295 South 2/23/1972 11/9/2003<br />
11 US 17 @ Plymouth 8/19/1986 10/2/2004<br />
12 A1A @ Marlin Street 3/1/1987 4/15/2002<br />
13 A1A @ Ponte Vedra Lakes Blvd. 5/1/1987 5/2/2002<br />
14 US 17 @ I-295 North 11/16/1995 -<br />
15 US 17 @ Heckscher Drive 2/1/1987 -<br />
16 US 17 @ Emerson Park Blvd. 5/17/1992 -<br />
17 US 17 @ US 19 3/26/1992 -<br />
Table 2 summarizes <strong>the</strong> characteristics of <strong>the</strong> nine sites, including driveway code, number of<br />
CGTLs, and separator type. Categorical values were used to describe differences in <strong>the</strong>se three basic<br />
site characteristics. For driveways, a zero code represents absence of driveways within 250 feet of<br />
an intersection, one represents intersections which do not have driveways in a non-CGTL direction,<br />
and, two, intersections which do not have driveways in <strong>the</strong> CGTL direction. As far as <strong>the</strong> number of<br />
continuous green through lanes are concerned, intersections with one CGTL are coded as one while<br />
those with two CGTLs are coded as two. Three main methods were used to separate continuous<br />
green traffic from o<strong>the</strong>r movements. These are double white lines (coded as a zero), raised rounded<br />
domes (coded as one), and raised curbs (coded as two). These methods help motorists identify <strong>the</strong><br />
special use of CGTLs, provide a buffer between vehicles making left turns from minor roads and<br />
vehicles in <strong>the</strong> CGTL, and discourage swerving from adjacent lanes as drivers tend to avoid being<br />
stopped by a red light.<br />
7
Safety Analysis<br />
Table 2: Basic Site Characteristics<br />
8<br />
Site Characteristic<br />
Intersection Number*<br />
1 2 3 4 5 6 7 8 9<br />
Driveway code 0 1 0 0 0 0 2 0 1<br />
Number of CGGLs 2 2 2 2 1 2 1 1 2<br />
Separator type 0 0 0 0 0 1 0 2 0<br />
*Intersection numbers (1 through 9) are in <strong>the</strong> order presented in Table 1.<br />
Crash data were collected from <strong>the</strong> Florida Department of <strong>Transportation</strong> (FDOT) database<br />
known as <strong>the</strong> Crash Analysis Reporting (CAR) System. The data are for 398 crashes that occurred<br />
at nine CGTL intersections from 2003 to 2008. The data categorize <strong>the</strong> degree of injury severity<br />
as none, possible, non-incapacitating, incapacitating, and fatal. Generally, possible injury and<br />
non-incapacitating injuries represent <strong>the</strong> same injury severity level, i.e., non-incapacitating injury.<br />
Therefore, <strong>the</strong>y were combined giving a total of four levels of injury severity. O<strong>the</strong>r variables<br />
are site characteristics, traffic, and environmental conditions at <strong>the</strong> time of <strong>the</strong> crash. The site<br />
characteristics included whe<strong>the</strong>r or not <strong>the</strong> crash involved vehicles using CGTL traffic lanes, <strong>the</strong><br />
number of CGTLs, and if <strong>the</strong>re is a driveway in <strong>the</strong> vicinity of <strong>the</strong> intersection. The environmental<br />
conditions are wea<strong>the</strong>r and lighting. Speed limit and annual average daily traffic (AADT) are <strong>the</strong><br />
traffic factors. O<strong>the</strong>r factors considered are driver age, number of vehicles involved in <strong>the</strong> accident,<br />
and time of day. All crashes that occurred within 250 feet of <strong>the</strong> study intersection were assumed to<br />
be influenced by <strong>the</strong> intersections. The crashes were fur<strong>the</strong>r screened by examining crash diagrams<br />
to remove those that were not intersection related but within 250 feet of <strong>the</strong> intersection. Table 3<br />
shows a description of each variable used in <strong>the</strong> model.<br />
Analytical Techniques<br />
Three methods were used in this study to analyze <strong>the</strong> data. The first is proportions analysis, which<br />
uses simple percentage calculations to examine crash patterns at CGTLs. The second is comparative<br />
analysis to determine if <strong>the</strong>re is any underrepresentation or overrepresentation of some crash patterns<br />
on CGTL, and <strong>the</strong> third method is <strong>the</strong> ordered probit (OP) model, which was used to model injury<br />
severity.<br />
In <strong>the</strong> comparative analysis, four distinct conflict types are analyzed. They are those due to<br />
lane changes (pattern one versus pattern 10), rear-end crashes (patterns two and three versus pattern<br />
six), angle crashes involving left-turning traffic from a minor street (patterns four and five versus<br />
pattern seven), and o<strong>the</strong>r crashes. For each conflict pattern, <strong>the</strong> proportion of <strong>the</strong> total intersection<br />
crashes for <strong>the</strong> CGTL direction was compared with <strong>the</strong> proportion in <strong>the</strong> non-CGTL direction using<br />
a paired-t test. This test is appropriate in analyzing samples which have two different treatments,<br />
i.e., paired treatments. In this case, every intersection has two treatments at each mainline direction:<br />
installation of continuous green through lanes (in <strong>the</strong> CGTL direction) and normal lanes (in <strong>the</strong><br />
non-CGTL direction). This method provides <strong>the</strong> statistic which is used to determine if <strong>the</strong>re is a<br />
significant difference between <strong>the</strong> proportion means for <strong>the</strong> CGTL and non-CGTL directions. The<br />
null hypo<strong>the</strong>sis is that <strong>the</strong> proportions of <strong>the</strong> aforementioned three conflict types are equal for <strong>the</strong><br />
CGTL and non-CGTL directions, while <strong>the</strong> alternative hypo<strong>the</strong>sis is that <strong>the</strong> proportions of <strong>the</strong><br />
conflict types are not equal for <strong>the</strong> CGTL and non-CGTL directions. The alternative hypo<strong>the</strong>sis<br />
is accepted only when <strong>the</strong> data suggest sufficient evidence to support it, hence rejecting <strong>the</strong> null<br />
hypo<strong>the</strong>sis. All conflict types were tested at <strong>the</strong> 95% confidence level.
Table 3: Description of <strong>the</strong> Model Variables<br />
Explanatory Variables Categories Explanation<br />
Injury Severity 0 No injury<br />
1 Non-incapacitating injury<br />
2 Incapacitating injury<br />
3 Fatal<br />
Crash Conflict Group 0 Rear-end (patterns 2, 6, and 9)<br />
1 Angle (patterns 4, 5, and 7)<br />
2 Lane-change (patterns 1 and 10)<br />
3 Left-turn (patterns 8 and 11)<br />
4 All o<strong>the</strong>r<br />
On CGTL 0 Not involving vehicles on CGTL<br />
1 Involving vehicles on CGTL<br />
Number of CGTL 0 One CGTL<br />
1 Two CGTLs<br />
Driveway 0 No driveways<br />
1 Driveways on normal direction<br />
2 Driveways on CGTL direction<br />
Separator Type 0 Double white lines<br />
1 Rounded domes<br />
2 Raised concrete curb<br />
Lighting 0 Daylight<br />
1 Dark<br />
Wea<strong>the</strong>r 0 Clear and cloudy<br />
1 Rainy<br />
JTRF Volume 50 No. 1, Spring 2011<br />
Time of day 0 Early morning/Late at night (midnight to 6:00 am)<br />
Speed limit 0 45 mph<br />
1 Morning (6:00 am to noon)<br />
2 Afternoon (noon to 6:00 pm)<br />
3 Evening (6:00 pm to midnight)<br />
1 50 mph<br />
Age (years) 0 =65<br />
Number of vehicles Continuous variable<br />
Annual Average Daily<br />
Traffic (AADT)<br />
Continuous variable<br />
9
Safety Analysis<br />
An ordered probit (OP) model was used because injury severity is ordered, i.e., from no injury<br />
(property damage only), possible injury, non-incapacitating injury, incapacitating injury and killed.<br />
Several previous studies have used this method in modeling injury severity (Quddus et al. 2002,<br />
Kockelman and Kweon 2002, Abdel-Aty 2003, Abdel-Aty and Keller 2005). Because <strong>the</strong> injury<br />
data used in this study are categorical, <strong>the</strong> use of OP is appropriate as it requires no assumptions<br />
regarding <strong>the</strong> ordinal nature of <strong>the</strong> dependent variable (Quddus 2002). The OP model for four<br />
categories of injury severity is given in <strong>the</strong> following form (Kockelman 2002, Washington et al.<br />
2003):<br />
(1)<br />
Where q n is <strong>the</strong> observed injury severity (coded as a categorical variable), and µ i values are <strong>the</strong><br />
thresholds (cutoffs) that define each q n . The probabilities associated with ordinal outcomes of an OP<br />
model are calculated as:<br />
(2)<br />
Where φ is <strong>the</strong> standard normal cumulative density function, β is <strong>the</strong> vector of estimated parameters,<br />
and z a vector of model variables. Predictions from <strong>the</strong> OP models are done by considering <strong>the</strong><br />
thresholds and comparing <strong>the</strong> predicted probability with <strong>the</strong> given cutoff probability boundaries and<br />
<strong>the</strong>n classifying injuries based on <strong>the</strong> cutoffs.<br />
RESULTS<br />
Crash Pattern<br />
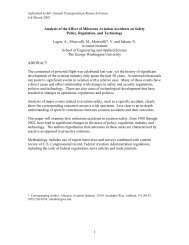
This analysis involved careful examinations of crash diagrams to determine distinct crash patterns.<br />
After reviewing crash diagrams and narratives in crash reports, crashes were classified into <strong>the</strong> 11<br />
distinct patterns shown in Figure 2. Crashes that did not fall into <strong>the</strong> 11 patterns shown in Figure 2<br />
were combined into pattern 12 as shown in Table 4. This table shows a summary of <strong>the</strong> percentages<br />
of each of <strong>the</strong> 12 crash patterns for each intersection. Most of <strong>the</strong> crashes in pattern 12 occurred on<br />
<strong>the</strong> side street (minor street direction) while few involved vehicles in <strong>the</strong> major street. Some crash<br />
types in pattern 12 include rear-end and right-turning crashes from <strong>the</strong> minor street, run-off <strong>the</strong><br />
road crashes, pedestrian crashes, and collisions with vehicles from driveways. These crashes were<br />
combined into one group and included in <strong>the</strong> comparative analysis.<br />
The data in Table 4 also show that <strong>the</strong>re are more crashes involving lane changing in <strong>the</strong> CGTL<br />
direction (conflict pattern one) compared with <strong>the</strong> direction which has traditional through lanes<br />
(conflict pattern 10). Approximately 6.01% of <strong>the</strong> crashes involved vehicles changing lanes in<br />
<strong>the</strong> CGTL direction while only 1.78% involved lane changing vehicles in <strong>the</strong> traditional through<br />
lanes. The percentages of rear end crashes for both traditional through lanes direction (pattern six)<br />
and <strong>the</strong> CGTL direction (patterns two and three) appear to be approximately equal (23.60% for<br />
continuous through lanes and 23.39% for traditional through lanes). A thorough examination of <strong>the</strong><br />
crash diagrams and police report narratives revealed that rear end crashes on <strong>the</strong> traditional lanes<br />
involved through and right-turning vehicles, mostly caused by right-turning vehicles reducing speed<br />
to perform a right turning maneuver. Crash patterns two and three, which represent rear-end crashes<br />
in <strong>the</strong> CGTL direction, were mostly caused by motorists who unexpectedly stopped in <strong>the</strong> CGTL.<br />
10<br />
n<br />
( k)<br />
ϕ ( µ − β z ) − ϕ(<br />
µ − z )<br />
P β<br />
= k+1<br />
n<br />
k<br />
n
Figure 2: CGTL Intersection Crash Patterns Classified by Conflict Types<br />
JTRF Volume 50 No. 1, Spring 2011<br />
Conflict categories four and five represent right angle crashes involving left-turning vehicles<br />
from <strong>the</strong> minor street and vehicles crossing <strong>the</strong> intersection from <strong>the</strong> CGTL direction. The difference<br />
between <strong>the</strong>se two categories is that conflict category four involves right angle crashes with drivers<br />
who are in <strong>the</strong> non-continuous lane while category five is for right angle collisions that occur on <strong>the</strong><br />
CGTL. The main causes of conflict category five crashes are <strong>the</strong> motorists in <strong>the</strong> non-continuous<br />
lane who are supposed to stop on red but inattentively cross <strong>the</strong> intersection by assuming that <strong>the</strong><br />
continuous green arrow applies to <strong>the</strong>ir lane. Conversely, conflict category five crashes are caused<br />
by left-turning vehicles veering into <strong>the</strong> CGTL, disregarding lane separation markers. It is observed<br />
from <strong>the</strong> data in Table 4 that <strong>the</strong>re were no crashes caused by crash conflict pattern five at intersection<br />
eight (Normandy at I-295) due to <strong>the</strong> use of a curb to separate continuous green through movements<br />
from o<strong>the</strong>r movements. Also, <strong>the</strong>re were no crashes caused by conflict pattern one (lane changing<br />
from normal lane to CGTL to avoid stopping at intersection) because <strong>the</strong> separation curb is extended<br />
to both sides of <strong>the</strong> intersection.<br />
11
Safety Analysis<br />
Table 4: Proportions of Crashes by Pattern Type for Each Intersection in <strong>the</strong> Study<br />
12<br />
Conflict<br />
Pattern Conflict Description 1 2 3 4 5 6 7 8 9 Average<br />
Sideswipe between non-CGTL and CGTL<br />
1<br />
5.88% 9.52% 6.56% 7.89% 0.00% 5.41% 17.14% 0.00% 7.14% 6.01%<br />
through traffic<br />
2 Rear-end on CGTL 33.33% 0.00% 0.00% 21.05% 11.76% 13.51% 11.43% 3.08% 12.50% 14.25%<br />
3 Rear-end on non-CGTL 11.76% 14.29% 3.28% 10.53% 5.88% 8.11% 2.86% 6.15% 19.64% 9.35%<br />
Angle collision between left-turn minor street<br />
4<br />
1.96% 0.00% 4.92% 0.00% 0.00% 0.00% 0.00% 0.00% 5.36% 1.78%<br />
and non-CGTL through traffic<br />
Angle collision between left-turn minor street<br />
5<br />
1.96% 0.00% 3.28% 5.26% 11.76% 8.11% 11.43% 0.00% 7.14% 4.68%<br />
and CGTL through traffic<br />
6 Rear-end on conventional approach 17.65% 38.10% 16.39% 18.42% 11.76% 18.92% 5.71% 50.77% 28.57% 23.39%<br />
13.73% 14.29% 0.00% 7.89% 8.82% 2.70% 0.00% 4.62% 5.36% 6.68%<br />
Right-angle collision between through traffic<br />
from conventional approach and left-turn<br />
7<br />
traffic from minor street<br />
0.00% 9.52% 1.64% 5.26% 8.82% 5.41% 2.86% 6.15% 7.14% 4.23%<br />
Angle collision between through traffic from<br />
conventional approach and left-turn traffic<br />
8<br />
from CGTL approach<br />
9 Rear-end collision on left turn lane 0.00% 4.76% 0.00% 0.00% 2.94% 2.70% 2.86% 6.15% 1.79% 2.00%<br />
10 Sideswipe on conventional approach 0.00% 4.76% 1.64% 2.63% 0.00% 0.00% 2.86% 6.15% 0.00% 1.78%<br />
0.00% 0.00% 1.64% 0.00% 2.94% 0.00% 34.29% 0.00% 0.00% 3.12%<br />
Angle collision between left turn traffic from<br />
minor and major streets<br />
11<br />
13.73% 4.76% 60.66% 21.05% 35.29% 35.14% 8.57% 17.92% 5.36% 22.72%<br />
All o<strong>the</strong>r conflict patterns not represented by<br />
categories 1 through 11<br />
12<br />
*Intersection numbers (1 through 9) are in <strong>the</strong> order presented in Table 1.
Comparative Analysis<br />
JTRF Volume 50 No. 1, Spring 2011<br />
The data show that <strong>the</strong>re are more crashes from lane changing maneuvers in <strong>the</strong> CGTL direction<br />
(pattern one) than in <strong>the</strong> non-CGTL direction (pattern 10). The results in Table 5 indicate that <strong>the</strong>re<br />
is a significant difference between <strong>the</strong> proportions of lane changing crashes in <strong>the</strong> CGTL and non-<br />
CGTL directions (p-value = 0.038) at <strong>the</strong> 95% confidence level. The high proportion of lane changing<br />
crashes might be due to motorists who suddenly swerve to <strong>the</strong> CGTLs to avoid being stopped by<br />
<strong>the</strong> red light on non-CGTLs. The data suggest a slightly higher average proportion of rear-end<br />
crashes in <strong>the</strong> non-CGTL direction (0.256% of all crashes) than in <strong>the</strong> CGTL direction (0.229% of<br />
all crashes). Rear-end crashes on CGTLs are most probably caused by motorists who are unfamiliar<br />
with how <strong>the</strong> CGTLs operate and who unexpectedly stop in <strong>the</strong> CGTL by mistakenly observing a<br />
red light meant for non-CGTLs. However, <strong>the</strong> results in <strong>the</strong> table show that this difference is not<br />
significant at <strong>the</strong> 95% confidence level (p-value = 0.736). The observed average proportion of rightangle<br />
crashes involving left-turns from <strong>the</strong> minor street and vehicles in <strong>the</strong> CGTL direction was<br />
slightly higher (0.074) than for <strong>the</strong> non-CGTL direction (0.071). The crash diagrams revealed that<br />
right-angle crashes involving CGTLs are mostly caused by motorists turning left from <strong>the</strong> minor<br />
street and veering into <strong>the</strong> CGTLs instead of turning to <strong>the</strong> non-CGTLs. Fur<strong>the</strong>rmore, Table 5 shows<br />
<strong>the</strong>re is no significant difference in <strong>the</strong> observed proportions of angle crashes (patterns four, five, and<br />
seven) between CGTL and non-CGTL directions.<br />
Table 5: Comparative Analysis Results<br />
Conflict<br />
type<br />
Lane<br />
changing<br />
Rearending<br />
Angle<br />
Direction<br />
Proportion<br />
mean<br />
Standard<br />
Deviation<br />
CGTL 0.072 0.055<br />
Non-CGTL 0.023 0.027<br />
CGTL 0.229 0.135<br />
Non-CGTL 0.256 0.164<br />
CGTL 0.074 0.053<br />
Non-CGTL 0.071 0.059<br />
Injury Severity at CGTL Intersection Crashes<br />
Degrees<br />
of<br />
freedom<br />
t-value p-value Reject<br />
null?<br />
8 2.475 0.038 yes<br />
8 -0.350 0.736 No<br />
8 0.102 0.321 No<br />
The STATA statistical package was used for <strong>the</strong> ordered probit model runs. Two injury severity models<br />
were estimated as in Abdel-Aty and Keller (2005). The first describes <strong>the</strong> relationship between injury<br />
severity with different crash conflict patterns while <strong>the</strong> second explains <strong>the</strong> relationship between<br />
injury severity and intersection characteristics, environmental conditions, and traffic characteristics.<br />
Table 6 shows <strong>the</strong> coefficients of <strong>the</strong> first model. The results indicate that right-angle crashes (crash<br />
conflict group one) and lane changing crashes (crash conflict group two) are significant predictors<br />
of injury severity at CGTL intersections. The level of injury severity is higher for conflict categories<br />
one and two compared with rear-end crashes (crash conflict group zero in Table 3).<br />
13
Safety Analysis<br />
Table 6: Ordered Probit Model for Crash Conflict Groups<br />
Variable Coefficient Standard Error Z P>z<br />
Involving Continuous Green<br />
Through Lane Traffic<br />
Crash Conflict Group<br />
0.2096 0.2135 0.98 0.326<br />
Angle (patterns 4, 5, and 7) 0.4796 0.2401 2.10 0.036<br />
Lane-change (patterns 1 and 10) 0.5035 0.3038 1.99 0.046<br />
Left-turn (patterns 8 and 11) 0.4416 0.3385 1.31 0.192<br />
All o<strong>the</strong>r -7.2223<br />
Thresholds<br />
0.0000 0 1<br />
µ 1 -0.1312 0.1054<br />
µ 2 0.6819 0.1087<br />
µ 3 1.4721 0.1274<br />
µ 4 2.3822 0.2086<br />
The results of <strong>the</strong> second model in Table 7 indicate crashes that take place during <strong>the</strong> time<br />
categories of 6:00 a.m. in <strong>the</strong> morning to noon and noon to 6:00 p.m. result in lower injury severity.<br />
The results also suggest that drivers 65 years and older have higher injury severity levels. Also, as<br />
<strong>the</strong> table shows, all <strong>the</strong> o<strong>the</strong>r variables in <strong>the</strong> model had statistically insignificant coefficients. These<br />
include speed limit, rounded domes, raised concrete curbs, number of vehicles, and annual average<br />
daily traffic.<br />
CONCLUSIONS AND RECOMMENDATIONS<br />
This study was conducted to examine <strong>the</strong> safety characteristics of unconventional continuous<br />
green through lanes at nine sites in Jacksonville, Florida. A thorough review of crash data<br />
resulted in 11 distinct crash conflict patterns that were used to examine <strong>the</strong> influence of CGTLs<br />
on <strong>the</strong> safety characteristics of <strong>the</strong> study intersections. Three analysis methods were used: general<br />
proportions analysis, comparative analysis, and injury severity ordered probit modeling. Based<br />
on <strong>the</strong> proportions analysis, <strong>the</strong>re are three common types of crashes that involve CGTL traffic:<br />
(1) sideswipe crashes caused by motorists weaving from adjacent through lanes to avoid having to<br />
stop for <strong>the</strong> red signal indication, (2) angle crashes caused by motorists turning left from a minor<br />
street and swerving into <strong>the</strong> CGTL by disregarding <strong>the</strong> “do not change lane” barriers such as double<br />
white lines and rounded domes, and (3) rear-end crashes caused by motorists who unexpectedly<br />
stop in <strong>the</strong> CGTL. The results of <strong>the</strong> proportions analysis show that on average <strong>the</strong> proportion<br />
of sideswipe crashes in <strong>the</strong> CGTL was 6.01% (conflict pattern one) compared with 1.78% in <strong>the</strong><br />
opposite direction (conflict pattern 10). Also, on average, 4.68% of all crashes were caused by leftturning<br />
vehicles from <strong>the</strong> minor direction (conflict pattern five) crossing to <strong>the</strong> CGTLs. Typically,<br />
conflict pattern five is caused by inattentive drivers or motorists who are not familiar with <strong>the</strong><br />
presence of CGTL. It is also worth mentioning that on average <strong>the</strong>re were more rear-end crashes on<br />
continuous green through lanes (conflict pattern two, 14.25%) compared with normal lanes (conflict<br />
pattern 3, 9.35%).<br />
The results of <strong>the</strong> comparative analysis which employed a paired t-test indicate that <strong>the</strong>re is a<br />
significant difference between <strong>the</strong> proportions of sideswipe crashes in <strong>the</strong> CGTL direction compared<br />
with <strong>the</strong> opposite direction. On <strong>the</strong> o<strong>the</strong>r hand, <strong>the</strong> paired-t test results did not suggest a significant<br />
difference between <strong>the</strong> proportions of rear-end and right-angle crashes for <strong>the</strong> CGTL and normal<br />
directions.<br />
14
JTRF Volume 50 No. 1, Spring 2011<br />
Table 7: Injury Severity Results Based on Site and Traffic Characteristics and<br />
Environmental Conditions<br />
Variable Coefficient Standard Error Z P>z<br />
Annual average daily traffic 1.8E-05 0.0000 1.43 0.152<br />
Number of continuous green through<br />
lanes 0.2852 0.3187<br />
0.9 0.371<br />
Number of vehicles<br />
Traffic Involved<br />
0.0727 0.1482 0.49 0.624<br />
Involving vehicles on CGTL<br />
Presence of driveways<br />
-0.2008 0.2258 -0.89 0.374<br />
Driveways on normal direction -0.1636 0.3536 -0.46 0.644<br />
Driveways on CGTL direction<br />
Separator type<br />
-0.3025 0.5080 -0.6 0.552<br />
Rounded domes 0.3887 0.5293 0.73 0.463<br />
Raised concrete curb<br />
Lighting<br />
0.2079 0.5741 0.36 0.717<br />
Dark<br />
Wea<strong>the</strong>r<br />
0.4913 0.4173 1.18 0.239<br />
Rainy<br />
Time of day<br />
-0.3694 0.5263 -0.7 0.483<br />
Morning (6:00 am to noon) -0.9012 0.4577 -1.97 0.049<br />
Afternoon (noon to 6:00 pm) -0.8451 0.3395 -2.49 0.013<br />
Evening (6:00 pm to midnight)<br />
Speed Limit<br />
-0.5480 0.4598 -1.19 0.233<br />
50 mph<br />
Age (years)<br />
0.1241 0.3955 0.31 0.754<br />
25 to 64 0.4094 0.2277 1.8 0.072<br />
>=65 0.8517<br />
Thresholds<br />
0.3399 2.63 0.012<br />
µ 1 -1.8869 0.5142<br />
µ 2 0.7630 0.4335<br />
µ 3 1.5785 0.4359<br />
µ 4 2.3698 0.4400<br />
Two different ordered probit models were developed: one based on crash pattern types and<br />
ano<strong>the</strong>r considering site conditions, environmental factors, and traffic conditions. The results of<br />
<strong>the</strong> first model indicate that angle crashes and crashes involving lane changing maneuvers are<br />
significantly more severe than rear-end crashes. For <strong>the</strong> second model, only time of day and age<br />
of driver were found to be significant in predicting injury severity level. Lower injury severity was<br />
observed for crashes that occurred during <strong>the</strong> day, i.e., between 6:00 a.m. and 6:00 p.m. Crashes that<br />
involved drivers who were 65 years or older had higher injury severity level.<br />
15
Safety Analysis<br />
Based on <strong>the</strong> observations of this study, <strong>the</strong> following design features are recommended as<br />
<strong>the</strong>y may improve <strong>the</strong> safety of CGTL intersections: advance warning signs and highly visible<br />
raised separators. Advance warning signs provide guidance to motorists as to <strong>the</strong> purpose of <strong>the</strong><br />
continuous through lanes and lane use instructions. This is particularly helpful to non-commuters<br />
who are not familiar with continuous green through lanes. Providing highly visible raised separators,<br />
in lieu of double white lines and raised rounded domes, creates a distinct separation between <strong>the</strong><br />
continuous through traffic and <strong>the</strong> adjacent lanes. This separation will prevent lane changing caused<br />
by motorists crossing <strong>the</strong> double white lines.<br />
Fur<strong>the</strong>r research is needed to study <strong>the</strong> influence of <strong>the</strong> factors which were not included in this<br />
study, such as type of left-turn restrictions (protected versus permitted), downstream and upstream<br />
traffic conditions, advance warning signage, and typical driver population, among o<strong>the</strong>r factors.<br />
Efforts are underway to conduct a comparative analysis between CGTL intersections and traditional<br />
“T” intersections. There are also plans to increase <strong>the</strong> dataset to include CGTL intersections in o<strong>the</strong>r<br />
parts of Florida. It is recommended that some specific site characteristics such as signage and lane<br />
markings, left-turning restrictions, and o<strong>the</strong>r pertinent variables be included in <strong>the</strong> analysis. Finally,<br />
because <strong>the</strong> study used one locality, fur<strong>the</strong>r studies of similar intersections elsewhere are required to<br />
permit generalizations of <strong>the</strong> results in this paper.<br />
References<br />
Abdel-Aty, M. and J. Keller. “Exploring <strong>the</strong> Overall and Specific Crash Severity Levels at Signalized<br />
Intersections.” Accident Analysis and Prevention 37, (2005): 417–425.<br />
Abdel-Aty. M. “Analysis of Driver Injury Severity Levels at Multiple Locations Using Ordered<br />
probit Models.” <strong>Journal</strong> of Safety <strong>Research</strong> 34, (2003): 597– 603.<br />
Hummer, J.E. and J.L. Boone. “Travel Efficiency of Unconventional Suburban Arterial Intersection<br />
Designs.” <strong>Transportation</strong> <strong>Research</strong> Record: <strong>Journal</strong> of <strong>the</strong> <strong>Transportation</strong> <strong>Research</strong> Board 1500,<br />
(1995): 153-161.<br />
Jarem, E.S. “Safety and Operational Characteristics of Continuous Green Through Lanes at<br />
Signalized Intersections in Florida.” Presented at ITE Annual Meeting and Exhibit, Orlando, FL,<br />
August 2004.<br />
Kockelman, K.M. and Y. Kweon. “Driver Injury Severity: An Application of Ordered Probit<br />
Models.” Accident Analysis and Prevention 34, (2002): 313–321.<br />
Mitra, S., H.C. Chin and M.A. Quddus. “Study of Intersection Accidents by Maneuver Type.”<br />
<strong>Transportation</strong> <strong>Research</strong> Record: <strong>Journal</strong> of <strong>the</strong> <strong>Transportation</strong> <strong>Research</strong> Board 1784, (2002): 43-<br />
50.<br />
Persaud, B. and T. Nguyen. “Dissagregate Safety Performance Models for Signalized Intersections<br />
on Ontario Provincial Roads.” <strong>Transportation</strong> <strong>Research</strong> Record: <strong>Journal</strong> of <strong>the</strong> <strong>Transportation</strong><br />
<strong>Research</strong> Board 1635, (1998): 113-120.<br />
Quddus, M.A., R.B. Noland and H.C. Chin. “An Analysis of Motorcycle Injury and Vehicle Damage<br />
Severity Using Ordered Probit Models.” <strong>Journal</strong> of Safety <strong>Research</strong> 33, (2002): 445– 462.<br />
Wang, X. and M. Abdel-Aty. “Analysis of Left-turn Crash Injury Severity by Conflicting Pattern<br />
Using Partial Proportional Odds Models.” Accident Analysis and Prevention 40, (2008): 1674–1682.<br />
Washington. S.P., M.G. Karlaftis, and F. L. Mannering. Statistical and Econometric Methods for<br />
<strong>Transportation</strong> Data Analysis. Chapman & Hall/CRC, Florida, 2003.<br />
16
JTRF Volume 50 No. 1, Spring 2011<br />
Weerasuriya, S.A. and M.C. Pietrzyk. “Development of Expected Conflict Value Tables for<br />
Unsignalized Three-Legged Intersections.” <strong>Transportation</strong> <strong>Research</strong> Record: <strong>Journal</strong> of <strong>the</strong><br />
<strong>Transportation</strong> <strong>Research</strong> Board 1635, (1998): 121-126.<br />
Thobias Sando is an assistant professor at <strong>the</strong> University of North Florida in Jacksonville, Florida.<br />
He teaches and conducts research in <strong>the</strong> area of transportation engineering. His research interests<br />
include modeling of highway safety data, intermodal facility design, intelligent transportation<br />
systems, operational analysis of bicycle and pedestrian facilities, and traffic simulation.<br />
Deo Chimba is an assistant professor at <strong>the</strong> University of Tennessee in Nashville. He teaches<br />
transportation engineering and conducts research in highway safety modeling, transportation<br />
planning, and traffic simulation.<br />
Valerian Kwigizile is an assistant professor of civil engineering at <strong>the</strong> West Virginia University<br />
Institute of Technology where he teaches courses in transportation and traffic engineering. His<br />
research interests include intelligent transportation systems, highway safety, roadway design, and<br />
multimodal transportation systems.<br />
Holly Walker works in <strong>the</strong> Quality Assurance Section/Exceptions and Variations in <strong>the</strong> Roadway<br />
Design Office in Tallahassee, reviewing and analyzing technical engineering design documents for<br />
recommendations to <strong>the</strong> state roadway design engineer. Additionally, she is involved in developing<br />
and delivering as appropriate, training on crash analysis procedures.<br />
17
Transit Passenger Perceptions: Face-to-Face<br />
Versus Web-Based Survey<br />
by Laura Eboli and Gabriella Mazzulla<br />
In this paper, face-to-face and web-based survey methods of collecting transit passenger perception<br />
data are compared using two transit customer satisfaction survey tools. Multivariate statistical<br />
analyses are applied to determine <strong>the</strong> differences between <strong>the</strong> two surveys. Some differences in<br />
behavior and attitudes of web survey respondents compared with those from a face-to-face survey<br />
are found. The results can help transit agencies manage <strong>the</strong>ir bus services to improve passenger<br />
satisfaction and service quality.<br />
INTRODUCTION<br />
Customer satisfaction surveys are tools for capturing consumer perceptions of service. To meet<br />
customer requirements, it is fundamental to provide good basic public services, such as public<br />
transport and social security, which are subject to different conditions and performance standards<br />
than private sector companies. Capturing passenger perceptions and evaluating customer satisfaction<br />
allow transit agencies to improve service quality and maintain passenger loyalty. Moreover, in<br />
a regulated market such as public transport, good management cannot be based only on service<br />
efficiency and effectiveness (e.g., fare revenues and <strong>the</strong> number of passengers), but, most of all,<br />
service quality as measured by different service attributes. In <strong>the</strong> first place, a transit service is<br />
characterized by frequency, travel time, and route characteristics such as length, number of stops,<br />
distance between stops and accessibility to stops, and reliability in terms of schedule adherence.<br />
O<strong>the</strong>r important transit service attributes are information provided to users about departure and<br />
arrival scheduled times, boarding/alighting stop location, fares, climate control, seat comfort, ride<br />
comfort – including <strong>the</strong> severity of acceleration and braking – odors, and vehicle noise. Cleanliness<br />
of vehicles, terminals and stops, safety, and security are also important quality of service measures.<br />
Still o<strong>the</strong>rs are <strong>the</strong> fare, personnel appearance and helpfulness, environmental protection, and<br />
customer services such as ease of purchasing tickets and administration of complaints. Each service<br />
attribute plays a part in determining <strong>the</strong> level of quality of service. As a consequence, passengers’<br />
perceptions of <strong>the</strong> overall service depend on how <strong>the</strong>y perceive <strong>the</strong> different service attributes.<br />
This paper focuses on <strong>the</strong> analysis of transit passenger satisfaction regarding an extra-urban bus<br />
service used by university students. Data ga<strong>the</strong>ring was based on traditional face-to-face interviews<br />
and <strong>the</strong> more innovative Web-based surveys. A comparison of <strong>the</strong>se two different data collection<br />
methods is made to highlight <strong>the</strong> advantages and disadvantages of both surveys. Although Internet<br />
surveys using online panels are common, <strong>the</strong>re are few studies that compare <strong>the</strong> two different<br />
surveys, and even fewer studies regarding transit passenger perceptions. Our work aims at <strong>the</strong><br />
comparison between face-to-face and web-survey interviews, thus filling a gap in <strong>the</strong> literature.<br />
The relevance of this paper is certainly <strong>the</strong> lack of studies about <strong>the</strong> topic in <strong>the</strong> transport sector. In<br />
addition, <strong>the</strong> findings resulting from <strong>the</strong> comparison of <strong>the</strong> two surveys can be very useful for transit<br />
agencies to manage bus services.<br />
LITERATURE REVIEW<br />
Traditionally, surveys are carried out by three main methods: face-to-face surveys where <strong>the</strong><br />
interviewer conducts a personal interview by asking questions of <strong>the</strong> respondent; telephone surveys<br />
where an interviewer conducts a survey by contacting respondents by telephone; and mail surveys<br />
19
Transit Passenger Perceptions<br />
where questionnaires are mailed to sampled individuals who complete and return <strong>the</strong>m by mail<br />
(Fricker et al. 2005). Face-to-face and telephone surveys are interviewer-administered methods<br />
whereas mail surveys are self-administered (Biemer and Lyberg 2003). In addition, <strong>the</strong>re are new<br />
technologies developed in <strong>the</strong> last decade for communicating and interfacing with respondents in<br />
<strong>the</strong>ir homes, at work, and during travel (Nicholls et al. 1997). Each method has advantages and<br />
disadvantages and its selection is often complex and depends on <strong>the</strong> objective of <strong>the</strong> survey, its<br />
characteristics, design and methodological issues, and <strong>the</strong> financial resources available (Biemer and<br />
Lyberg 2003).<br />
Face-to-face interviews provide for <strong>the</strong> maximum degree of communication and interaction<br />
between <strong>the</strong> interviewer and <strong>the</strong> respondent. Therefore, it is often associated with good quality<br />
data and it is preferred by many researchers because it allows long and complex interviews to be<br />
conducted, and it is characterized by flexible questions. Owing to <strong>the</strong> presence of <strong>the</strong> respondent, <strong>the</strong><br />
interviewer can gain cooperation, obtain personal information, make direct observations during <strong>the</strong><br />
interview, record spontaneous reactions, and ensure that <strong>the</strong> respondent’s answers are not affected by<br />
<strong>the</strong> presence of o<strong>the</strong>r persons. These surveys are characterized by relatively high response rates and<br />
elevated coverage of <strong>the</strong> general population. Its disadvantage is <strong>the</strong> tendency of respondents to be<br />
more concerned about <strong>the</strong> interviewer than in providing accurate answers. In fact, interviewers are<br />
an important error source in such surveys and tend to affect respondents in different ways. Ano<strong>the</strong>r<br />
disadvantage is “misbehavior by interviewers” (Kiecker and Nelson 1996) and refers to activities<br />
that are dishonest. A face-to-face interview is usually more expensive than <strong>the</strong> o<strong>the</strong>r methods of data<br />
collection since it requires <strong>the</strong> interviewer to visit or meet <strong>the</strong> respondents at home, work, or public<br />
places. This fact usually requires more time and personnel resources.<br />
A telephone interview has not always been accepted as a good data collection method for<br />
social and economic research. The increased interest in this approach, however, is its lower cost<br />
and <strong>the</strong> increased coverage of <strong>the</strong> targeted population (Biemer and Lyberg 2003). Groves and Kahn<br />
(1979) show that it can provide comparable quality data to those from face-to-face surveys. Indeed,<br />
both face-to-face and telephone interviews have very similar characteristics in that <strong>the</strong>y can create<br />
interviewer variance and social desirability bias which describes <strong>the</strong> tendency of respondents to<br />
reply in a manner that will be viewed favorably by o<strong>the</strong>rs. However, <strong>the</strong> literature suggests that<br />
<strong>the</strong>se effects are somewhat less in telephone surveys than in face-to-face interviews and that social<br />
desirability bias might be less in telephone interviews than in face-to-face interviews because of <strong>the</strong><br />
anonymity of <strong>the</strong> interviewer. Also, telephone interviews are less complex and considerably shorter<br />
than face-to-face interviews, with most lasting 30 minutes or less. Typically, <strong>the</strong>ir response rates are<br />
lower than in face-to-face surveys of comparable type and size (Biemer and Lyberg 2003).<br />
Today, face-to-face and telephone interviews are increasingly conducted using CAI (Computer-<br />
Assisted Interviewing) technology and its variants, CAPI (Computer-Assisted Personal Interviewing)<br />
and CATI (Computer-Assisted Telephone Interviewing), where <strong>the</strong> interviewer asks questions and<br />
enters <strong>the</strong> respondent’s answers using a computer program. As discussed by Groves and Tortora<br />
(1998), <strong>the</strong> <strong>the</strong>oretical and logical advantages associated with CAI are not always supported by<br />
data. Never<strong>the</strong>less, studies show clear reductions in indicators of measurement error and item nonresponse<br />
rates in such methods.<br />
The major advantage of <strong>the</strong> presence of interviewers is that it ensures respondents understand<br />
<strong>the</strong> questions and a uniform interpretation of <strong>the</strong> question leads to more accurate responses (Conrad<br />
and Schober 2000). However, its major disadvantage is <strong>the</strong> possibility of having biased results<br />
(Beatty 1995) unless each interviewer handles and interprets each question in exactly <strong>the</strong> same<br />
manner. Interview methods such as mail and Web-based surveys that do not use interviewers have<br />
different features. For example, in a mail survey, because <strong>the</strong>re is no interviewer, <strong>the</strong> questionnaire<br />
and instructions are made easy to understand. To a much greater extent, <strong>the</strong> quality of data from noninterviewer<br />
surveys hinges on <strong>the</strong> quality of <strong>the</strong> questionnaire design. However, mail surveys may<br />
have some advantages in terms of lower cost and reduced risks of social desirability bias associated<br />
with self-administration caused by <strong>the</strong> privacy involved in completing <strong>the</strong> questionnaire. In addition,<br />
20
JTRF Volume 50 No. 1, Spring 2011<br />
<strong>the</strong> response rate to mail surveys can vary considerably depending upon <strong>the</strong> experience, skill, and<br />
knowledge of <strong>the</strong> survey organization. Also, <strong>the</strong> response rates are lower than in interviewer-assisted<br />
surveys, <strong>the</strong>y have a greater risk of considerable item non-response rates, and require a long time<br />
to get acceptable response rates. In addition, it is not possible to ensure that <strong>the</strong> intended people<br />
complete <strong>the</strong> questionnaire or that <strong>the</strong> respondent does not collaborate with o<strong>the</strong>rs.<br />
The increasing popularity and wide availability of World Wide Web technologies provide<br />
researchers with a new data collection method called web survey. This method uses <strong>the</strong> internet<br />
to collect data from sampled populations (Al-Subaihi 2008) by interactive interviews or by<br />
questionnaires purposefully designed for self-completion. For example, electronic one-to-one<br />
interviews can be conducted via e-mail or chat rooms. Questionnaires also can be administered<br />
by e-mail (e.g., using mailing lists), postings to newsgroups, or using fill-in forms (Eysenbach and<br />
Wyatt 2002) on <strong>the</strong> Internet. Over <strong>the</strong> last 10 years, Web-based surveys have become widely used in<br />
<strong>the</strong> social sciences and educational research (Couper 2000), and a fur<strong>the</strong>r increase is expected since<br />
it allows access to a large number of potential respondents (Couper 2000, Loosveldt and Sonck<br />
2008).<br />
Web survey design focuses more on programming ability and web page design ra<strong>the</strong>r than<br />
traditional survey methodology (Couper 2001). As Al-Subaihi (2008) reports, <strong>the</strong> effects of variables<br />
related to web survey on response rates and data accuracy have been of interest to researchers<br />
and applied statisticians and continue to receive considerable attention in <strong>the</strong> survey methodology<br />
literature. (See, for example, Coomber 1997, Cook et al. 2000, Couper 2000, Dillman and Bowker<br />
2001, Ganassali 2008, Converse et al. 2008.) Web surveys, however, have been suggested to be<br />
far from perfect (Gorman 2000). That is, <strong>the</strong>ir non-response rates and coverage errors may be high<br />
(Couper 2000) and respondents may falsify <strong>the</strong>ir demographic information. The use of panels<br />
specifically recruited for online research though can mitigate <strong>the</strong>se weaknesses (James 2003). Like<br />
mail surveys, <strong>the</strong>y are cheaper to do and less time consuming than interviewer-administered surveys.<br />
In addition to web-surveys, a number of computerized versions of self-administered interviews<br />
have been developed, such as Disk By Mail (DBM) and Electronic Mail Survey (EMS), Touchtone<br />
Data Entry (TDE) and Voice Recognition Entry (VRE), Computer-Assisted Self-Interviewing<br />
(CASI) with its variants Audio CASI (or ACASI), and Telephone Audio CASI (T-ACASI). A<br />
description of <strong>the</strong>se methods is in Ramos et al. (1998) and an extensive literature review of web<br />
surveys is reported in Schonlau et al. (2002). Al-Subaihi (2008) also presents an interesting literature<br />
review based on technical factors (method of presentation, graphics, or colors), methodological<br />
factors (cost, coverage sampling, and validity), and social factors (social behavior variables such as<br />
age, gender, ethnicity, level of education).<br />
Some studies compare different survey methods. For example, Bonnel and Le Nir (1998)<br />
compare face-to-face and telephone interviews; telephone and mail surveys are compared in Walker<br />
and Restuccia (1984) and Coderre et al. (2004). Al-Subaihi (2008), Braunsberger et al. (2007),<br />
and Fricker et al. (2005) compare telephone interviews and Web surveys while Cobanoglu et al.<br />
(2001) and McDonald and Adam (2003) compare mail interview and Web surveys. While <strong>the</strong>se<br />
comparisons provide useful information, except Heerwegh and Loosveldt (2008) and Bayart and<br />
Bonnel (2008), little research has been done to compare Web-based and face-to-face interview<br />
surveys. And <strong>the</strong> only such work regarding transport services is by Elmore-Yalch et al. (2008) who<br />
analyzed passenger perceptions collected by telephone interviews and compared <strong>the</strong>m with similar<br />
data collected by Web surveys. Because not much has been done on this comparison in transport,<br />
this study fills a gap in <strong>the</strong> literature.<br />
21
Transit Passenger Perceptions<br />
METHODOLOGY<br />
Survey<br />
In this paper, customer satisfaction data about transit are collected by face-to-face and Web-based<br />
interviews. A face-to-face survey was conducted in 2006 using a sample of users of an extra-urban<br />
bus line connecting some towns in <strong>the</strong> province of Cosenza located on <strong>the</strong> Tyrrhenian coast with<br />
<strong>the</strong> University of Calabria in Cosenza, South Italy. Bus service is supplied by one of <strong>the</strong> largest<br />
transit agencies operating in <strong>the</strong> province. The bus line covers a distance of about 103 km, and<br />
<strong>the</strong> route has about 40 stops. The service spans 12 hours, from 6:00 a.m. till 6:00 p.m. and service<br />
frequency is less than one run per hour. The price of a one-way ticket varies with distance, from<br />
a minimum of about 1.50 Euros to a maximum of about 4.50 Euros. Rail transit services are not<br />
available in <strong>the</strong> study area and mode choice is very much inclined toward <strong>the</strong> private car. In 2006<br />
<strong>the</strong> transit agency sold about 280,000 tickets and 2,400 weekly or monthly travel cards. About 1,000<br />
University students daily reach <strong>the</strong> campus from <strong>the</strong> Tyrrhenian coast by bus service.<br />
The Web-based survey was conducted in 2008 and was addressed to all students of <strong>the</strong><br />
University of Calabria who lived in <strong>the</strong> province of Cosenza and used <strong>the</strong> extra-urban bus services<br />
to access <strong>the</strong> campus. While some students used <strong>the</strong>se transit services daily, o<strong>the</strong>rs used <strong>the</strong>m to go<br />
home on weekends.<br />
Questionnaire Design<br />
The questionnaire is made up of about 50 items grouped into three sections (see <strong>the</strong> Appendix). The<br />
first section aims to collect some socio-economic data about <strong>the</strong> passengers interviewed, such as<br />
age, gender, major course of study, post graduate classification, place of residence, family income,<br />
number of family members, car driving license and number of owned cars, car availability, etc.<br />
The second section collects data about boarding/alighting, access/egress transport mode, access/<br />
egress travel time, waiting time, time on board, bus ticket and fare. In <strong>the</strong> last section, respondents<br />
were asked to rate <strong>the</strong> importance of and <strong>the</strong>ir satisfaction with 16 service attributes, in addition<br />
to a request for <strong>the</strong>m to rate <strong>the</strong>ir satisfaction of <strong>the</strong> overall service. The service attributes are<br />
availability of a bus stop near home, route, service frequency, reliability of runs in terms of schedule<br />
adherence, reliability of runs in terms of on-time service, availability of shelter and benches at bus<br />
stops, availability of seats, cleanliness of vehicle interior, seats, and windows. O<strong>the</strong>rs are ticket<br />
cost, availability of schedule/maps at bus stops, availability of service information by phone or<br />
Internet, vehicle reliability, competence of drivers, security against crimes at bus stops, personnel<br />
helpfulness, administration of complaints, and <strong>the</strong> physical conditions of bus stops.<br />
In <strong>the</strong> face-to-face survey, an interviewer administered a paper questionnaire to a sample of<br />
150 users at <strong>the</strong> bus terminal at <strong>the</strong> university campus. The questionnaire was completed in five<br />
to eight minutes by each respondent. In a second survey, an invitation to complete a Web-based<br />
questionnaire was sent to 9,900 students using <strong>the</strong> e-mail addresses provided by <strong>the</strong> university. Of<br />
<strong>the</strong>se, 329 responded giving a response rate of 3.32%. This low rate is because many of those not<br />
responding did not use transit services or <strong>the</strong>ir e-mail addresses provided by <strong>the</strong> university were<br />
wrong. Of <strong>the</strong> 329 responding, 251 (76.3%) completed <strong>the</strong> questionnaire well enough for <strong>the</strong>ir<br />
responses to be included in <strong>the</strong> study. The o<strong>the</strong>r 78 (21.7%) could not be considered because <strong>the</strong>y<br />
did not specify <strong>the</strong> bus service used. Some of <strong>the</strong> interviews (92 out of <strong>the</strong> 251 who participated<br />
in <strong>the</strong> Web-based survey) were completed by passengers traveling on <strong>the</strong> same bus lines as those<br />
interviewed in <strong>the</strong> face-to-face survey.<br />
The descriptive statistics in Table 1 show <strong>the</strong> two samples are similar with most of <strong>the</strong><br />
respondents being female, younger than 22 years old, and belonging to middle income-class<br />
families. The average number of people in a respondent’s family is about four (4.35 for face-to-face<br />
respondents and 4.07 for online ones) while <strong>the</strong> average number of people with drivers licenses is<br />
22
JTRF Volume 50 No. 1, Spring 2011<br />
about three (3.24 for face-to-face respondents and 3.18 for online ones). Finally, <strong>the</strong> average number<br />
of cars per family is 1.9 in both cases.<br />
Table 1: General Characteristics of <strong>the</strong> Respondents<br />
Characteristic Value<br />
Face-to-face survey<br />
(150 respondents)<br />
Item<br />
(%) response<br />
rate (%)<br />
Gender Male 37<br />
100.0<br />
Age up to 22 years 43<br />
Female 63 66<br />
from 22 to 24 years<br />
from 24 to 27 years<br />
39<br />
11<br />
100.0<br />
28<br />
9<br />
over 27 years 7 8<br />
Family size 4.35 4.07<br />
Family income level * Lower<br />
lower-middle<br />
Middle<br />
upper-middle<br />
Upper<br />
20<br />
16<br />
52<br />
9<br />
3<br />
100.0<br />
19<br />
27<br />
44<br />
7<br />
3<br />
Faculty Arts<br />
Economics<br />
Engineering<br />
14<br />
29<br />
23<br />
15<br />
20<br />
20<br />
Math., Phys. and Nat. Science 13 100.0 18<br />
Pharmacy<br />
Politics<br />
11<br />
8<br />
11<br />
10<br />
Inter-faculty 2 6<br />
Family members<br />
Members with driving<br />
license<br />
3 or less<br />
4<br />
5 or more<br />
2 or less<br />
3<br />
4 or more<br />
17<br />
43<br />
40<br />
25<br />
35<br />
40<br />
100.0<br />
100.0<br />
27<br />
45<br />
28<br />
21<br />
46<br />
33<br />
Number of cars per family 1<br />
2<br />
3 or more<br />
29<br />
51<br />
20<br />
100.0<br />
24<br />
60<br />
16<br />
Average 3.24 3.18<br />
Car driving license<br />
ownership<br />
did not own car driving license<br />
own car driving license<br />
3<br />
97<br />
100.0<br />
3<br />
97<br />
Car availability did not own car<br />
own car<br />
53<br />
47<br />
100.0<br />
74<br />
26<br />
Ticket/card one-way ticket<br />
one-day travel card<br />
weekly travel card<br />
0<br />
99<br />
0<br />
100.0<br />
22<br />
73<br />
0<br />
monthly travel card 1 5<br />
Travel time minutes 48 52<br />
Travel time including<br />
access and egress times<br />
minutes 73 57<br />
Web-based survey<br />
(92 respondents)<br />
Item<br />
(%) response<br />
rate (%)<br />
34<br />
93.5<br />
55<br />
90.2<br />
91.3<br />
92.4<br />
92.4<br />
92.4<br />
90.2<br />
92.4<br />
90.2<br />
100.0<br />
* The lower level is to 1,000 Euros, <strong>the</strong> lower-middle from 1,000 to 2,000 Euros, <strong>the</strong> middle from 2,000 to 4,000<br />
Euros, <strong>the</strong> upper-middle from 4,000 to 5,000 Euros, <strong>the</strong> upper is over 5,000 Euros. The classes of income refer<br />
to net monthly income of a family unit.<br />
23
Transit Passenger Perceptions<br />
Transit users were asked to specify <strong>the</strong>ir travel times to <strong>the</strong> university by bus. The reported<br />
average travel time in <strong>the</strong> face-to-face survey in Table 1 is about 48 minutes, while it is about 52<br />
minutes for those who completed <strong>the</strong> Web-based survey. Although <strong>the</strong>se times are comparable,<br />
<strong>the</strong>re are notable differences, such as <strong>the</strong> average total travel time including waiting and access/<br />
egress times, which are about 73 minutes for those in <strong>the</strong> face-to-face survey and 57 minutes for<br />
<strong>the</strong> o<strong>the</strong>rs in <strong>the</strong> Web-based survey. The travel times of those in <strong>the</strong> face-to-face interviews are<br />
reliable compared with <strong>the</strong> travel times of those in <strong>the</strong> Web survey. This is because those in <strong>the</strong> Web<br />
survey did not understand <strong>the</strong> difference between total travel time and on-board travel time, given<br />
that many of <strong>the</strong>m gave similar values for both. Examining <strong>the</strong> item responses <strong>the</strong> face-to-face<br />
survey does not produce loss of information, while for each item statement <strong>the</strong>re are 6%-10% nonrespondents<br />
in <strong>the</strong> Web-based survey.<br />
Analytical Techniques<br />
To determine <strong>the</strong> differences between <strong>the</strong> samples in <strong>the</strong> face-to-face and Web-based surveys, three<br />
analytical techniques were employed. Paired t-test was used to compare <strong>the</strong> means of <strong>the</strong> variables<br />
in <strong>the</strong> two surveys. Specifically, it was used to test <strong>the</strong> significance of <strong>the</strong> differences between <strong>the</strong><br />
sample means in <strong>the</strong> face-to-face and Web-based surveys regarding <strong>the</strong> importance and satisfaction<br />
ratings of <strong>the</strong> service quality attributes. The null hypo<strong>the</strong>sis is that <strong>the</strong>re are no differences between<br />
<strong>the</strong> two observations. If <strong>the</strong> probability associated with a t value is low (< 0.05), <strong>the</strong>re is evidence<br />
to reject <strong>the</strong> null hypo<strong>the</strong>sis.<br />
Next, <strong>the</strong> Fisher F-test is used to compare <strong>the</strong> variances in <strong>the</strong> two surveys by testing <strong>the</strong> null<br />
hypo<strong>the</strong>sis that <strong>the</strong> different populations responding to <strong>the</strong> surveys have <strong>the</strong> same variance. More<br />
specifically, this method tests <strong>the</strong> significance of <strong>the</strong> differences between <strong>the</strong> sample variances of <strong>the</strong><br />
ratings expressed by users in <strong>the</strong> face-to-face and Web-based surveys. Finally, discriminant analysis<br />
is used to predict membership in <strong>the</strong> groups responding to <strong>the</strong> face-to-face and <strong>the</strong> Web-based<br />
interviews on <strong>the</strong> basis of a linear combination of some of <strong>the</strong> variables in Table 2. This multivariate<br />
statistical technique allows <strong>the</strong> variables that discriminate between <strong>the</strong> two surveys to be identified.<br />
FACE-TO-FACE IN COMPARISON TO WEB SURVEY<br />
In both surveys, <strong>the</strong> respondents expressed <strong>the</strong>ir feelings about level of service by rating its importance<br />
and <strong>the</strong>ir levels of satisfaction with <strong>the</strong> service. The survey used 16 service quality variables and a<br />
numerical scale ranging from one to 10. The service characteristics and <strong>the</strong>ir descriptive statistics<br />
are in Table 2. While <strong>the</strong> face-to-face survey provided ratings by all <strong>the</strong> passengers interviewed, in<br />
<strong>the</strong> Web-based survey <strong>the</strong>re were six non-responses on average for each service attribute both for<br />
importance and satisfaction rating. The attribute, administration of complaints, is <strong>the</strong> least rated in<br />
terms of importance with an item response rate of 88%. The averages of <strong>the</strong> ratings of importance<br />
in <strong>the</strong> face-to-face survey are higher than <strong>the</strong> ratings in <strong>the</strong> Web-based survey. In <strong>the</strong> face-to-face<br />
survey, <strong>the</strong> attribute with <strong>the</strong> lowest importance rating is “availability of service information by<br />
phone and internet” and <strong>the</strong> highest rated item is “vehicle reliability and competence of drivers.”<br />
The overall average rating of importance from <strong>the</strong> face-to-face survey is 8.62 compared with 7.68<br />
for <strong>the</strong> Web-based survey. For each service attribute <strong>the</strong>re is almost a difference of one point between<br />
<strong>the</strong> rating based on <strong>the</strong> face-to-face and <strong>the</strong> Web-based survey.<br />
The t-test test shows that <strong>the</strong> averages of <strong>the</strong> importance ratings are dissimilar in both surveys<br />
except for reliability of runs and information through telephones and <strong>the</strong> Internet etc. (See Table<br />
3.) From Table 2 <strong>the</strong>re are some attributes whose satisfaction ratings are higher in <strong>the</strong> face-to-face<br />
survey than in <strong>the</strong> Web survey. These include security and personnel helpfulness. The attributes for<br />
which <strong>the</strong> satisfaction ratings are lower in <strong>the</strong> face-to-face interviews are reliability in terms of ontime<br />
performance and availability of schedules or maps at bus stops. In both surveys <strong>the</strong> average<br />
rating of satisfaction is about 6.5. However, in <strong>the</strong> face-to-face survey, <strong>the</strong> range of <strong>the</strong> average<br />
24
JTRF Volume 50 No. 1, Spring 2011<br />
satisfaction rating is from 3.63 (“availability of shelter and benches at bus stops”) to 8.49 (“security<br />
against crimes at bus stops”). In <strong>the</strong> Web-based survey <strong>the</strong> range is from 4.74 (“physical condition<br />
of bus stops”) to 7.46 (“vehicle reliability, competence of drivers”). The service attributes, schedule<br />
adherence, vehicle reliability, and competence of drivers are rated similarly in both surveys. A t-test<br />
of differences of means confirms <strong>the</strong> same average satisfaction ratings in both surveys. O<strong>the</strong>r service<br />
attributes with similar average satisfaction ratings as <strong>the</strong> overall average are <strong>the</strong> availability of a bus<br />
stop near home, service frequency and reliability of runs, bus cleanliness, vehicle reliability and<br />
driver competence, <strong>the</strong> administration of complaints, and <strong>the</strong> physical condition of bus stops.<br />
Table 2: User Perceptions of Services<br />
Face-to-face survey Web-based survey<br />
Importance Satisfaction Importance Satisfaction<br />
rates<br />
rates<br />
rates<br />
rates<br />
Service attributes mean<br />
st.<br />
dev.<br />
mean<br />
st.<br />
dev.<br />
mean<br />
st.<br />
dev.<br />
mean<br />
st.<br />
dev.<br />
Availability of bus stop near home 8.99 1.25 6.53 2.69 7.66 2.69 6.27 2.66<br />
Path 8.42 1.40 7.32 1.79 6.91 2.24 6.74 2.29<br />
Service frequency 8.93 1.09 7.50 1.62 8.14 2.46 7.21 2.18<br />
Reliability of runs that come on<br />
schedule<br />
8.56 1.23 5.81 1.69 8.53 1.95 7.40 1.96<br />
Reliability of runs that come on time 8.83 1.12 6.46 2.16 8.20 2.11 6.48 2.37<br />
Availability of shelter and benches<br />
at bus stops<br />
8.21 1.41 3.63 2.14 7.17 2.69 4.87 2.48<br />
Availability of seats 8.85 1.12 7.31 2.11 7.92 1.89 6.25 2.31<br />
Cleanliness of interior, seats and<br />
windows<br />
9.08 1.06 6.88 2.01 8.21 1.91 7.33 2.12<br />
Ticket cost 8.63 1.10 7.24 1.64 7.45 2.39 6.56 2.15<br />
Availability of schedule/maps at bus<br />
stops<br />
8.27 1.30 3.74 2.19 7.18 2.42 6.17 2.67<br />
Availability of service information<br />
by phone, internet<br />
7.75 1.38 5.43 2.20 7.44 2.27 6.43 2.43<br />
Vehicle reliability, competence of<br />
drivers<br />
9.61 0.76 7.45 1.67 8.65 1.86 7.46 1.95<br />
Security against crimes at bus stops 9.32 1.24 8.49 1.59 7.98 2.37 7.00 2.58<br />
Personnel helpfulness 8.42 1.27 7.93 1.71 7.47 2.32 6.72 2.39<br />
Administration of complaints 7.94 1.32 6.31 1.60 7.25 2.35 5.88 2.39<br />
Physical condition of bus stops 8.11 1.38 5.10 2.07 6.68 2.48 4.74 2.44<br />
Overall service 7.24 0.97 6.95 1.54<br />
25
Transit Passenger Perceptions<br />
Table 3: Tests of Differences of Means and Equality of Variance<br />
t-test of differences of<br />
means<br />
26<br />
Fisher F-test of <strong>the</strong> equality<br />
between <strong>the</strong> variances<br />
Service attributes Importance Satisfaction Importance Satisfaction<br />
rates * rates * rates ** rates **<br />
Availability of bus stop near home 5.23 n.s. * 0.22 1.02<br />
Path 6.48 2.20 0.39 0.61<br />
Service frequency 3.46 n.s. * 0.20 0.55<br />
Reliability of runs that come on schedule n.s. -6.70 0.40 0.74<br />
Reliability of runs that come on time 3.04 n.s. * 0.28 0.83<br />
Availability of shelter and benches at bus<br />
stops<br />
3.92 -4.11 0.27 0.74<br />
Availability of seats 4.81 3.65 0.35 0.84<br />
Cleanliness of interior, seats and windows 4.56 n.s. * 0.31 0.90<br />
Ticket cost 5.20 2.79 0.21 0.58<br />
Availability of schedule/maps at bus stops 4.55 -7.70 0.29 0.67<br />
Availability of service information by<br />
phone, internet<br />
n.s. -3.31 0.37 0.82<br />
Vehicle reliability, competence of drivers 5.62 n.s. * 0.17 0.73<br />
Security against crimes at bus stops 5,78 5.54 0.27 0.38<br />
Personnel helpfulness 4.10 4.59 0.30 0.51<br />
Administration of complaints 2.94 n.s. * 0.32 0.45<br />
Physical condition of bus stops 5.73 n.s. * 0.31 0.72<br />
Overall service - n.s. * 0.40<br />
(*) Not significant at a level of 5% (t=2.10); (**) not significant at a level of 5% (F=1.27, df (num) = 91, df (den) = 149)<br />
Additional information can be obtained by analyzing <strong>the</strong> variability of <strong>the</strong> ratings of importance<br />
and satisfaction. This analysis shows that user ratings are nearly <strong>the</strong> same in <strong>the</strong> face-to-face survey,<br />
and <strong>the</strong> variance of <strong>the</strong> importance ratings of all <strong>the</strong> 16 service attributes is higher for <strong>the</strong> web-based<br />
survey than for direct interviews (Table 2). This is similar to what was obtained for <strong>the</strong> satisfaction<br />
ratings of <strong>the</strong> attributes except availability of bus stop near home. The different levels of similarity<br />
in user perceptions are also confirmed by <strong>the</strong> tests of equality of <strong>the</strong> variances of <strong>the</strong> two samples<br />
using <strong>the</strong> Fisher F-test (Table 3). The obtained values of <strong>the</strong> test suggest that <strong>the</strong> equality of variance<br />
test is not significant. Therefore, we surmise that <strong>the</strong> variances of <strong>the</strong> two groups of respondents are<br />
significantly different.<br />
Discriminant analysis was used to provide more statistically accurate results to support <strong>the</strong><br />
findings. We applied discriminant analysis to both <strong>the</strong> importance and satisfaction ratings expressed<br />
by <strong>the</strong> users about <strong>the</strong> service quality attributes. A summary of <strong>the</strong> statistical tests regarding <strong>the</strong><br />
canonical discriminant function is shown in Table 4. This function shows an eigenvalue of 1.266 for<br />
<strong>the</strong> analysis based on <strong>the</strong> importance ratings and 2.079 for <strong>the</strong> analysis based on satisfaction ratings.<br />
An eigenvalue compares between group variance to within group variance. So, a large eigenvalue<br />
is associated with a model that explains a large proportion of between group variance compared<br />
to within group variance. The canonical relation represents a correlation between <strong>the</strong> discriminant
JTRF Volume 50 No. 1, Spring 2011<br />
scores and <strong>the</strong> levels of <strong>the</strong> dependent variable (importance ratings of face-to-face and Web-based<br />
surveys). The values of correlation obtained are 0.748 and 0.822 respectively, which are high and<br />
show that <strong>the</strong> function discriminates well between <strong>the</strong> two survey methods.<br />
Wilks’ Lambda is <strong>the</strong> ratio of within-groups sums of squares to <strong>the</strong> total sums of squares. This<br />
is <strong>the</strong> proportion of <strong>the</strong> total variance in <strong>the</strong> discriminant scores not explained by differences among<br />
groups. A Lambda value of one is obtained when <strong>the</strong> observed group means are equal (i.e., all <strong>the</strong><br />
variance is explained by factors o<strong>the</strong>r than <strong>the</strong> differences between those means), while a small<br />
Lambda occurs when within-groups variability is small compared with <strong>the</strong> total variability. A small<br />
Lambda indicates that group means appear to differ. The associated significance value indicates<br />
whe<strong>the</strong>r or not <strong>the</strong> difference is significant. We obtained a Wilks’ Lambda of 0.441 for importance<br />
ratings and of 0.325 for satisfaction ratings, which are significant at <strong>the</strong> 0.000 level. Thus, <strong>the</strong><br />
average importance ratings significantly differ between <strong>the</strong> two samples as well as <strong>the</strong> average<br />
satisfaction ratings.<br />
The canonical discriminant function coefficients show <strong>the</strong> standardized independent variables<br />
included in <strong>the</strong> discriminant equation. The results indicate that <strong>the</strong> differences between <strong>the</strong> samples<br />
are more evident for <strong>the</strong> importance ratings of routes, reliability of runs, ticket cost, and availability<br />
of schedules/maps at bus stops, availability of service information by phone, internet, vehicle<br />
reliability, and security against crimes at bus stops. The most discriminating variables among <strong>the</strong> two<br />
samples of respondents expressing satisfaction are service frequency, reliability of runs, availability<br />
of shelter and benches at bus stops, availability of schedule/maps at bus stops, availability of service<br />
information by phone, internet, security against crimes at bus stops, personnel helpfulness, and<br />
administration of complaints.<br />
The top and bottom parts of Table 5 summarize <strong>the</strong> numbers and percentages of those in <strong>the</strong><br />
face-to-face interview and <strong>the</strong> Web-based survey correctly and incorrectly classified. The results<br />
show that 91.3% of <strong>the</strong> grouped cases are correctly classified into “face-to-face” or “online” groups<br />
(importance ratings). Face-to-face respondents were classified with better accuracy (98.0%) than<br />
online respondents (79.0%). Regarding satisfaction ratings, <strong>the</strong> percentage of correctly classified<br />
cases increases to 95.6% (Table 5). In this case, face-to-face respondents were classified with<br />
slightly better accuracy (97.3%) than online respondents (92.1%). A total of 21 observations in <strong>the</strong><br />
analysis based on <strong>the</strong> ratings of satisfaction and 16 based on <strong>the</strong> ratings of importance were excluded<br />
because of lack of at least one discriminant variable.<br />
O<strong>the</strong>r results can be obtained from analyzing <strong>the</strong> difference between <strong>the</strong> importance and<br />
satisfaction ratings of each service attribute. It is found that this gap is higher for <strong>the</strong> data collected<br />
by personal interviews and that <strong>the</strong> ratings of satisfaction expressed by <strong>the</strong> Web survey participants<br />
are closer to <strong>the</strong> ratings of importance <strong>the</strong>y expressed. Passenger perceptions about <strong>the</strong> overall<br />
service are very similar between <strong>the</strong> two types of surveys. In fact, <strong>the</strong> passengers interviewed in<br />
<strong>the</strong> face-to-face survey expressed an overall satisfaction of 7.24, while those interviewed in <strong>the</strong><br />
Web survey gave overall satisfaction of 6.95 (Table 2). According to <strong>the</strong> t-test this difference is<br />
statistically significant at a level of significance of 95%.<br />
Ano<strong>the</strong>r overall measure is provided by <strong>the</strong> Customer Satisfaction Index (CSI), which is an<br />
index of service quality calculated as <strong>the</strong> sum of <strong>the</strong> average satisfaction rating of each attribute<br />
weighted by <strong>the</strong> respective average importance rating. A similar index, <strong>the</strong> Heterogeneous Customer<br />
Satisfaction Index (HCSI), takes into account <strong>the</strong> heterogeneity in user perceptions by means of <strong>the</strong><br />
variance of <strong>the</strong> importance and satisfaction rates (Eboli and Mazzulla 2009). CSI is similar for <strong>the</strong><br />
two types of surveys: for face-to-face survey it is 6.49, whereas it is 6.51 for <strong>the</strong> Web-based survey.<br />
On <strong>the</strong> contrary, HCSI is 7.56 for <strong>the</strong> face-to-face survey data, and 7.26 for <strong>the</strong> Web-based survey.<br />
This difference can be explained by <strong>the</strong> heterogeneity of user perceptions.<br />
27
Transit Passenger Perceptions<br />
Table 4: Summary of <strong>the</strong> Results About Canonical Discriminant Function<br />
28<br />
Importance rates<br />
Eigenvalues Eigenvalue<br />
% of<br />
Variance<br />
Cumulative %<br />
Canonical<br />
correlation<br />
1.266 100.0 100.0 0.748<br />
Test of function Wilks’ Lambda Chi-square Df Sig.<br />
Discriminant variables<br />
0.441 176.3 7 0.000<br />
Standardized<br />
coefficients<br />
Correlation<br />
values<br />
Path 0.443 0.404<br />
reliability of runs that come on schedule -0.287 0.015<br />
ticket cost 0.222 0.388<br />
availability of schedule/maps at bus stops 0.307 0.224<br />
availability of service information by phone,<br />
internet<br />
-0.874 -0.261<br />
vehicle reliability, competence of drivers 0.469 0.489<br />
security against crimes at bus stops 0.475 0.448<br />
Satisfaction rates<br />
Eigenvalues Eigenvalue<br />
% of<br />
Variance<br />
Cumulative %<br />
Canonical<br />
correlation<br />
2.079 100.0 100.0 0.822<br />
Test of function Wilks’ Lambda Chi-square Df Sig.<br />
Discriminant variables<br />
0.325 233.9 8 0.000<br />
Standardized<br />
coefficients<br />
Correlation<br />
values<br />
service frequency -0.271 -0.079<br />
reliability of runs that come on schedule 0.214 0.275<br />
availability of shelter and benches at bus stops 0.355 0.422<br />
availability of schedule/maps at bus stops 0.381 0.416<br />
availability of service information by phone,<br />
internet<br />
0.272 0.317<br />
security against crimes at bus stops -0.603 -0.540<br />
personnel helpfulness -0.385 -0.457<br />
administration of complaints 0.244 0.098
Table 5: Classification Results<br />
Importance rates *<br />
Predicted Group Membership<br />
Group variable online face-to-face total<br />
Count online 64 17 81<br />
face-to-face 3 147 150<br />
% online 79.0 21.0 100.0<br />
Satisfaction rates **<br />
face-to-face 2.0 98.0 100.0<br />
Predicted Group Membership<br />
Group variable online face-to-face total<br />
Count online 70 6 76<br />
face-to-face 4 146 150<br />
% online 92.1 7.9 100.0<br />
face-to-face 2.7 97.3 100.0<br />
(*) 91.3% of importance grouped cases correctly classified<br />
(**) 95.6% of satisfaction grouped cases correctly classified<br />
CONCLUSION<br />
JTRF Volume 50 No. 1, Spring 2011<br />
The aim of this research is to determine significant differences or similarities in behavior when<br />
passengers are asked to provide <strong>the</strong>ir perceptions about <strong>the</strong>ir use of transit services through two<br />
types of surveys. These perceptions were collected from face-to-face and Web-based surveys<br />
addressed to users of an extra-urban bus service. No particular differences regarding socioeconomic<br />
characteristics were observed in <strong>the</strong> two samples. These results contrast o<strong>the</strong>rs where<br />
those interviewed in <strong>the</strong> Web survey were generally younger and had higher household incomes<br />
than those interviewed by traditional survey methods. However, our findings are different because<br />
both samples are university students belonging to middle income families.<br />
More interestingly, <strong>the</strong>re is a significant difference in <strong>the</strong> judgments of importance in <strong>the</strong> surveys.<br />
For almost all <strong>the</strong> service attributes analyzed, <strong>the</strong> average rating of importance in <strong>the</strong> face-to-face<br />
interview survey is higher than <strong>the</strong> average rating in <strong>the</strong> self-administered survey. These results<br />
suggest that when users personally express <strong>the</strong>ir judgments of importance to an interviewer, <strong>the</strong>y<br />
tend to give more importance to service characteristics than when <strong>the</strong>y complete <strong>the</strong> questionnaire<br />
alone. Also, users have a different threshold of importance depending on <strong>the</strong> type of survey. These<br />
differences were not observed for <strong>the</strong> satisfaction judgments. In fact, <strong>the</strong>re are some attributes for<br />
which satisfaction ratings are higher in <strong>the</strong> face-to-face interview and o<strong>the</strong>rs for which <strong>the</strong>y are<br />
lower. Moreover, passenger satisfaction about overall service is very similar between <strong>the</strong> two types<br />
29
Transit Passenger Perceptions<br />
of surveys. These results contrast <strong>the</strong> findings of Elmore-Yalch et al. (2008) that respondents of Web<br />
surveys are more satisfied with service than respondents of telephone surveys.<br />
Fur<strong>the</strong>r results highlight <strong>the</strong> most significant discriminating service attributes between <strong>the</strong> two<br />
different types of surveys, confirming some results of <strong>the</strong> descriptive analysis. From this analysis<br />
<strong>the</strong>re are important differences between <strong>the</strong> two samples of passengers. In fact, it emerges that <strong>the</strong><br />
differences between <strong>the</strong> samples are more evident for <strong>the</strong> importance ratings of service aspects like<br />
route, reliability of runs, ticket cost, and availability of service information. For <strong>the</strong> satisfaction<br />
ratings <strong>the</strong> differences between <strong>the</strong> samples regard service frequency, reliability of runs, facilities<br />
at bus stops and availability of service information. Ano<strong>the</strong>r important finding is that <strong>the</strong> ratings of<br />
satisfaction expressed by <strong>the</strong> Web survey are closer to <strong>the</strong> ratings of importance. Perhaps users did<br />
not understand <strong>the</strong> difference between importance and satisfaction, or <strong>the</strong>ir ratings of importance<br />
and satisfaction are mutually influenced. This is also shown by observing that for <strong>the</strong> data collected<br />
by Web survey <strong>the</strong> classification of <strong>the</strong> service attributes according to <strong>the</strong> ratings of importance is<br />
similar to <strong>the</strong> classification according to <strong>the</strong> ratings of satisfaction.<br />
From <strong>the</strong> analysis of heterogeneity in user judgments, <strong>the</strong> data collected from <strong>the</strong> face-to-face<br />
surveys could be considered more reliable than those from <strong>the</strong> self-administered interviews. These<br />
results can be considered useful contributions to <strong>the</strong> analysis of <strong>the</strong> differences in behavior and<br />
attitudes of respondents depending on <strong>the</strong> type of survey. Despite <strong>the</strong> Web survey being cheaper<br />
and less time consuming to conduct than <strong>the</strong> face-to-face survey, <strong>the</strong> data collected by <strong>the</strong> faceto-face<br />
survey are more accurate owing to <strong>the</strong> presence of interviewers who ensured respondents<br />
understood <strong>the</strong> questions. Based on <strong>the</strong> findings, we recommend asking users only satisfaction<br />
ratings when a Web-based data collection method is adopted in customer satisfaction surveys. The<br />
Web-based survey, however, can be considered a valid and convenient alternative to traditional faceto-face<br />
interviews, especially when customer satisfaction surveys are addressed to groups of people<br />
belonging to public or private corporations like universities.<br />
30
APPENDIX: The Questionnaire<br />
JTRF Volume 50 No. 1, Spring 2011<br />
31
Transit Passenger Perceptions<br />
32
JTRF Volume 50 No. 1, Spring 2011<br />
33
Transit Passenger Perceptions<br />
References<br />
Al-Subaihi, A.A. “Comparison of Web and Telephone Survey Response Rates in Saudi Arabia.” The<br />
Electronic <strong>Journal</strong> of Business <strong>Research</strong> Methods 6 (2), (2008): 123-132.<br />
Bayart, C. and P. Bonnel. “Comparison of Web and Face-to-Face Household Travel Survey-<br />
Application to Lyon Case.” Proceedings of <strong>the</strong> European Transport Conference, Leeuwenhorst<br />
Conference Centre, The Ne<strong>the</strong>rlands, October 6-8, 2008.<br />
Beatty, P. “Understanding <strong>the</strong> Standardized/non-standardized Interviewing Controversy.” <strong>Journal</strong><br />
of Statistics 11, (1995): 147-60.<br />
Biemer, P.P. and L.E. Lyberg. Introduction to Survey Quality. Wiley, New York, 2003.<br />
Bonnel, P. and M. Le Nir. “The Quality of Survey Data: Telephone versus Face-to-Face Interviews.”<br />
<strong>Transportation</strong> 25, (1998): 147-167.<br />
Braunsberger, K., H. Wybenga, and R. Gates. “A Comparison of Reliability Between Telephone and<br />
Web-based Surveys.” <strong>Journal</strong> of Business <strong>Research</strong> 60, (2007): 758-764.<br />
Cobanoglu, C., B. Warde, and P.J. Moreo. “A Comparison of Mail, Fax, and Web-based Survey<br />
Methods.” International <strong>Journal</strong> of Market <strong>Research</strong> 43 (4), (2001): 441-52.<br />
Coderre, F., A. Mathieu, and N. St-Laurent. “Comparison of <strong>the</strong> Quality of Qualitative Data Obtained<br />
Through Telephone, Postal and Email Surveys.” International <strong>Journal</strong> of Market <strong>Research</strong> 46 (3),<br />
(2004): 347-357.<br />
Conrad, F.G. and M.F. Schober. “Clarifying Question Meaning in a Household Telephone Survey.”<br />
Public Opinion Quarterly 64 (1), (2000): 1-28.<br />
Converse, P.D., E.W. Wolfe, Huang Xiaoting, and F.L. Oswald. “Response Rates for Mixed-Mode<br />
Surveys Using Mail and E-mail/Web.” American <strong>Journal</strong> of Evaluation 29 (1), (2008): 99-107.<br />
Cook, C., F. Heath, and R.L. Thompson. “A Meta-Analysis of Response Rates in Web-or Internetbased<br />
Surveys.” Educational and Psychological Measurement 60, (2000): 821-836.<br />
Coomber, R. “Using <strong>the</strong> Internet for Survey <strong>Research</strong>.” Sociological <strong>Research</strong> Online 2 (2), (1997):<br />
14-23.<br />
Couper, M.P. “Web Surveys: A Review of Issues and Approaches.” Public Opinion Quarterly 64<br />
(4), (2000): 464-494.<br />
Couper, M.P. “Web Surveys: The Questionnaire Design Challenge.” Proceedings of <strong>the</strong> 53rd Session<br />
of <strong>the</strong> ISI, Seoul, South Korea, August 22-29, 2001.<br />
Dillman, D.A. and D.K. Bowker. “The Web Questionnaire Challenge to Survey Methodologists.”<br />
U.D. Reips and M. Bosnjak eds. Dimensions of Internet Science. Lengerich, Germany: Pabst Science<br />
Publishers (2001): 159-178.<br />
Eboli, L. and G. Mazzulla. “A New Customer Satisfaction Index for Evaluating Transit Service<br />
Quality.” <strong>Journal</strong> of Public <strong>Transportation</strong> 12 (3), (2009): 21-37.<br />
Elmore-Yalch, R., J. Busby, and C. Britton. “Know thy Customer? Know thy <strong>Research</strong>!: A<br />
Comparison of Web-based and Telephone Responses to a Public Service Customer Satisfaction<br />
34
JTRF Volume 50 No. 1, Spring 2011<br />
Survey.” Proceedings of <strong>the</strong> 87th Annual Meeting of <strong>the</strong> TRB, Washington, D.C., January 13-17,<br />
2008.<br />
Eysenbach, G. and J.Wyatt. “Using <strong>the</strong> Internet for Surveys and Health <strong>Research</strong>.” <strong>Journal</strong> of<br />
Medical Internet <strong>Research</strong> 4 (2), (2002).<br />
Fricker, S., M. Galesic, R. Tourangeau, and T. Yan. “An Experimental Comparison of Web and<br />
Telephone Surveys.” Public Opinion Quarterly 69 (3), (2005): 370-92.<br />
Ganassali, S. “The Influence of <strong>the</strong> Design of Web Survey Questionnaires on <strong>the</strong> Quality of<br />
Responses.” Survey <strong>Research</strong> Methods 2 (1), (2008): 21-32.<br />
Gorman, J.W. “An Opposing View of Online Surveying.” Marketing News 34 (9), (2000): 48-49.<br />
Groves, R.M. and R.L. Kahn. Surveys by Telephone: A National Comparison With Personal<br />
Interviews. Academic Press, San Diego, CA., 1979.<br />
Groves, R.M. and R.D. Tortora. “Integrating CASIC into Existing Designs and Organizations: A<br />
Survey of <strong>the</strong> Field.” M.P. Couper, R.P. Baker, J. Bethlehem, C.Z.F. Clark, J. Martin, W.L. Nicholls<br />
and J.M. O’Reilly eds. Computer Assisted Survey Information Collection. New York: Wiley (1998):<br />
45-61.<br />
Heerwegh, D. and G. Loosveldt. “Face-to-Face Versus Web Surveying in a High-Internet-Coverage<br />
Population: Differences in Response Quality.” Public Opinion Quarterly 72 (5), (2008): 836-846.<br />
James, D. “The Future of Online <strong>Research</strong>.” Mark News 1, (2003): 1.<br />
Kiecker, P. and J.E. Nelson. “Do Interviewers Follow Telephone Survey Instructions?” <strong>Journal</strong> of<br />
<strong>the</strong> Market <strong>Research</strong> Society 38 (2), (1996): 161-76.<br />
Loosveldt, G. and N. Sonck. “An Evaluation of <strong>the</strong> Weighting Procedures for an Online Access<br />
Panel Survey.” Survey <strong>Research</strong> Methods 2 (2), (2008): 93-105.<br />
McDonald, H. and S. Adam. “A Comparison of Online and Postal Data Collection Methods in<br />
Marketing <strong>Research</strong>.” Marketing Intelligence & Planning 21 (2), (2003): 85-95.<br />
Nicholls, W.L., R.P. Baker, and J. Martin. “The Effect of New Data Collection Technologies on<br />
Survey Data Quality.” L. Lyberg, P. Biemer, M. Collins, E. De Leeuw, C. Dippo, N. Schwarz and<br />
D. Trewin eds. Survey Measurement and Process Quality. New York: Wiley (1997): 221-248.<br />
Ramos, M., B.M. Sedivi, and E.M. Sweet. “Computerized Self-Administered Questionnaires.” M.P.<br />
Couper, R.P. Baker, J. Bethlehem, C.Z.F. Clark, J. Martin, W.L. Nicholls and J.M. O’Reilly eds.<br />
Computer Assisted Survey Information Collection. New York: Wiley (1998): 389-408.<br />
Sconlau, M., R.D. Fricker, and M.N. Elliott. “Conducting <strong>Research</strong> Surveys via E-mail and Web.”<br />
MR1480, RAND Corporation, 2002.<br />
Walker, A.H. and J.D. Restuccia. “Obtaining Information on Patient Satisfaction with Hospital<br />
Care: Mail versus Telephone.” Health Services <strong>Research</strong> 19 (3), (1984): 291-306.<br />
35
Transit Passenger Perceptions<br />
Laura Eboli received her Ph.D. in environmental planning and technologies from <strong>the</strong> University<br />
of Calabria, Italy. She is an assistant professor of transportation engineering in <strong>the</strong> Faculty of<br />
Engineering at <strong>the</strong> University of Calabria, where she undertakes research in transportation planning<br />
and service quality in public transport. Her articles on service quality and customer satisfaction<br />
measures have been published in such journals as <strong>Transportation</strong> Planning and Technology, <strong>Journal</strong><br />
of Public <strong>Transportation</strong>, International <strong>Journal</strong> of Management Cases, Transport Reviews, EuroMed<br />
<strong>Journal</strong> of Business.<br />
Gabriella Mazzulla received her Ph.D. in road infrastructure and transportation systems from<br />
University Federico II in Naples, Italy. She is an assistant professor of transportation engineering<br />
in <strong>the</strong> Faculty of Engineering at <strong>the</strong> University of Calabria, Italy, where she teaches urban and<br />
metropolitan transport. Her research interests focus on transportation planning, specifically analysis,<br />
modeling, and estimation of travel demand. Her publications have appeared in transportation<br />
journals, including <strong>Transportation</strong> Planning and Technology, <strong>Journal</strong> of Public <strong>Transportation</strong>,<br />
European Transport, European <strong>Journal</strong> of Operational <strong>Research</strong>, and Transport Reviews.<br />
36
Methodology for Measuring Output, Value Added,<br />
and Employment Impacts of State Highway and<br />
Bridge Construction Projects<br />
by Michael W. Babcock and John C. Lea<strong>the</strong>rman<br />
The purpose of this paper is to present a methodology to measure some of <strong>the</strong> economic impacts of<br />
state highway programs. State departments of transportation (DOTs) need such a methodology for<br />
a variety of reasons, including long-term highway planning as well as advising state policymakers<br />
concerning <strong>the</strong> economic impacts of highway programs. The specific objectives of this study are:<br />
(1) describe a procedure to measure <strong>the</strong> output, value added, and employment impacts of specific<br />
types of highway and bridge improvement, and (2) illustrate an application of <strong>the</strong> model using data<br />
from Kansas.<br />
The objectives of <strong>the</strong> research are accomplished with input-output modeling. An 11-step<br />
procedure is described for adjusting <strong>the</strong> Kansas IMPLAN input-output model so that it is capable<br />
of measuring economic impacts for specific types of highway and bridge improvement. The model is<br />
illustrated using data from a recently completed study of <strong>the</strong> Kansas Comprehensive <strong>Transportation</strong><br />
Program (CTP), which included expenditure of $5.24 billion on state highway system projects. Data<br />
from this study are used to demonstrate <strong>the</strong> calculation of output, value added, and employment<br />
impacts for five different highway and bridge improvement categories.<br />
INTRODUCTION<br />
In 2008 and 2009, nearly every U.S. state significantly reduced <strong>the</strong>ir budgets as a result of <strong>the</strong><br />
2008 financial crisis followed by severe recession in 2009. In 2010, nearly 10% of <strong>the</strong> U.S. labor<br />
force was unemployed. Since states can’t have deficits in <strong>the</strong>ir budgets, legislators have difficult<br />
decisions to make in allocating diminishing funds to state programs. Although politics and policies<br />
will always be <strong>the</strong> primary factor in government budget decisions, in recent years, benefit-cost<br />
analysis has been given some weight in <strong>the</strong>se decisions. While <strong>the</strong>re is near unanimous agreement<br />
among economists that government programs whose benefits exceed <strong>the</strong>ir costs are an efficient use<br />
of resources, practical application of this technique has been limited by <strong>the</strong> difficulty in measuring<br />
<strong>the</strong> benefits of government programs. The purpose of this paper is to present a methodology to<br />
measure some of <strong>the</strong> benefits of state highway programs.<br />
State Departments of <strong>Transportation</strong> (DOTs) need such a methodology for a variety of purposes.<br />
State policymakers often request DOTs to supply economic impact information for highway<br />
programs. Currently, many DOTs are unable to supply this information. In <strong>the</strong> current financially<br />
austere environment, state DOTs attempt to justify <strong>the</strong>ir budget requests by estimating <strong>the</strong> economic<br />
benefits of <strong>the</strong>ir proposed highway programs. The model presented in this paper could be used to<br />
measure some of <strong>the</strong>se benefits. State DOTs also need economic benefit and impact information for<br />
long-term highway planning, and <strong>the</strong> model in this paper could be helpful for this purpose, although<br />
<strong>the</strong> model is not intended to be a substitute for an in-depth analysis of future transport demands.<br />
A very large literature exists in <strong>the</strong> area of <strong>the</strong> impact of highways on regional output, income,<br />
and employment, as well as <strong>the</strong> role highways play in regional economic development. A partial<br />
list of <strong>the</strong>se studies from <strong>the</strong> 1970s include Dodgson (1974), Humphrey and Sell (1975), Kuehn and<br />
West (1971), and Miller (1979). Numerous contributions to <strong>the</strong> literature in this area occurred in<br />
<strong>the</strong> 1980s, including Allen et al. (1988), Briggs (1981 and 1983), Carlino and Mills (1987), Eagle<br />
and Stephanedes (1988), Isserman et al. (1989), Lichter and Fuguitt (1980), Politano and Rodifer<br />
37
Highway and Bridge Construction Projects<br />
(1989), Stephanedes (1989), Stephanedes and Eagle (1986a, 1986b, 1987), and Wilson et al. (1982).<br />
Highways and <strong>the</strong>ir effect on economic development continued to attract research interest in <strong>the</strong><br />
1990s, including Allen et al. (1994), Babcock et al. (1997), Babcock and Bratsberg (1998), Boarnet<br />
(1995), Brown (1999), Crane and Leatham (1993), Garrison and Souleyrette II (1996), Holleyman<br />
(1996), Holtz-Eakin and Schwartz (1995), Khanam (1996), Midwest <strong>Transportation</strong> Center (1990),<br />
Mullen and Williams (1992), Singletary et al. (1995), Repham and Isserman (1994), and Talley<br />
(1996). More recent contributions to this area of <strong>the</strong> literature include Babcock et al. (2010), Chi<br />
and Cleveland (2006), Chandra and Thompson (2000), Van de Vooren (2004), and Peterson and<br />
Jessup (2008).<br />
The consensus of this literature is that highways have <strong>the</strong>ir greatest economic impact during <strong>the</strong><br />
construction phase with a smaller lagged impact over <strong>the</strong> long run (Eagle and Stephanedes [1988],<br />
Stephanedes [1989], and Stephanedes and Eagle [1986a, 1986b, and 1987]). Economic impacts<br />
vary widely by region, industry, and time period. Highways have economic impacts in rural areas<br />
but good highways do not guarantee economic development if <strong>the</strong> region lacks o<strong>the</strong>r resources that<br />
are necessary for growth.<br />
This study differs from most of <strong>the</strong> previous studies in <strong>the</strong> literature which addressed whe<strong>the</strong>r<br />
highways affected growth and which provided an aggregate estimate of how much impact highways<br />
had on regional growth. In contrast, this study describes how state DOTs can estimate output,<br />
income, and employment impacts of specific types of road and bridge improvements.<br />
This study doesn’t measure o<strong>the</strong>r important benefits of highway investment, each of which is<br />
a formidable research task. For example, <strong>the</strong> study doesn’t measure reductions in congestion that<br />
result in lower vehicle operating costs such as maintenance, fuel, tires, and depreciation. It does not<br />
measure <strong>the</strong> benefits of lower accident costs fostered by road improvements. Also, <strong>the</strong> study does<br />
not directly measure <strong>the</strong> benefit of travel time savings resulting from highway investment (Allen,<br />
Baumel, and Forkenbrock 1994). These latter benefits are indirectly measured since it is <strong>the</strong> lower<br />
transport costs (time) generated by <strong>the</strong> highway investment that leads to economic growth (impacts)<br />
in <strong>the</strong> affected region. Never<strong>the</strong>less, <strong>the</strong> study does measure some important impacts of different<br />
types of highway and bridge improvement. The specific objectives of this paper are to:<br />
1. Describe how to measure <strong>the</strong> output, value added, and employment impacts of specific<br />
types of highway and bridge improvements.<br />
2. Illustrate an application of <strong>the</strong> model using data from <strong>the</strong> state of Kansas.<br />
INPUT-OUTPUT METHODOLOGY<br />
The objectives of <strong>the</strong> research are achieved with input-output modeling. An input-output model<br />
is a quantitative framework of analysis for examining <strong>the</strong> complicated interdependence within <strong>the</strong><br />
production system of an economy. There are three components to <strong>the</strong> standard input-output model:<br />
an interindustry transactions matrix; a direct requirements matrix; and a direct, indirect, and induced<br />
requirements matrix. Each of <strong>the</strong>se can be explained with <strong>the</strong> aid of a simple illustrative example<br />
from Professor Steven Deller (Deller and Williams 2009).<br />
The transactions matrix describes <strong>the</strong> flow of goods and services between all individual<br />
industries of <strong>the</strong> economy in a given year. The columns show purchases by a particular industry from<br />
all o<strong>the</strong>r industries. For example, in <strong>the</strong> highly simplified example of an input-output transaction<br />
matrix appearing in Table 1, <strong>the</strong> data in <strong>the</strong> Agriculture sector column show that, in order to produce<br />
its $50 million output, that sector purchases $10 million from farm enterprises, $4 million from<br />
manufacturing firms, and $6 million from service establishments. Agriculture firms also made<br />
purchases from non-processing sectors of <strong>the</strong> economy, such as <strong>the</strong> household sector ($16 million)<br />
and imports from o<strong>the</strong>r regions ($14 million). Purchases from <strong>the</strong> household sector represent value<br />
added or income to people in <strong>the</strong> form of wages, salaries, and investment returns. The data in <strong>the</strong><br />
Agriculture sector row indicate that Agriculture sold $10 million to farm enterprises, $6 million<br />
to manufacturing, $2 million to services, and <strong>the</strong> remaining $32 million was sold to households<br />
38
JTRF Volume 50 No. 1, Spring 2011<br />
within <strong>the</strong> region or exported out of <strong>the</strong> region. In this case, $20 million was sold to households<br />
within <strong>the</strong> region and $12 million was sold to firms or households outside <strong>the</strong> region. Note that total<br />
agriculture output (sum of <strong>the</strong> row) is exactly equal to Agriculture purchases (sum of <strong>the</strong> column),<br />
or demand equals supply. This is <strong>the</strong> case for each sector.<br />
The transactions table is significant because it provides a quantitative framework for <strong>the</strong> region’s<br />
economy. Not only does it show <strong>the</strong> total output of each sector but also <strong>the</strong> interdependencies<br />
between sectors. It also reveals <strong>the</strong> degree of “openness” of <strong>the</strong> region through imports and exports.<br />
More open economies have a high percentage of total expenditures devoted to imports and, thus,<br />
smaller multipliers.<br />
The direct requirements matrix indicates <strong>the</strong> input requirement from each industry for a<br />
particular industry to produce an average $1 of output. These purchase coefficients are obtained<br />
by dividing purchase data in each industry column of <strong>the</strong> transactions matrix by <strong>the</strong> corresponding<br />
output value for that industry. The resulting purchase coefficients, or input ratios, may be thought of<br />
as production recipes for a particular product. From <strong>the</strong> data in <strong>the</strong> simplistic transactions matrix in<br />
Table 1, a direct requirements matrix can be calculated (Table 2). As an example, <strong>the</strong> first column<br />
(Agriculture) shows that to produce an average $1 of output, <strong>the</strong> Agriculture sector buys $.20 from<br />
farming enterprises, $.08 from manufacturing firms, and $.12 from services firms. The Agriculture<br />
column also shows that <strong>the</strong> sector makes payments of $.32 to households and $.28 to imports.<br />
Households and imports are referred to as final payments sectors.<br />
Table 1: Illustrative Input-Output Transactions Matrix (Millions of Dollars)<br />
Purchasing Sectors (Demand) Final Demand<br />
Processing Sectors<br />
Total<br />
(Sellers) Agr. Mfg. Serv. HH Exports Output<br />
Agriculture 10 6 2 20 12 50<br />
Manufacturing 4 4 3 24 14 49<br />
Services 6 2 1 34 10 53<br />
Households 16 25 38 1 52 132<br />
Imports 14 12 9 53 0 88<br />
Total Inputs 50 49 53 132 88 372<br />
Table 2: Illustrative Direct Requirements Matrix<br />
Purchasing Sectors<br />
(Demand)<br />
Processing Sectors (Sellers) Agr. Mfg. Serv.<br />
Agriculture 0.20 0.12 0.04<br />
Manufacturing 0.08 0.08 0.06<br />
Services 0.12 0.04 0.02<br />
Households 0.32 0.51 0.72<br />
Imports 0.28 0.24 0.17<br />
Total Inputs 1.00 1.00 1.00<br />
39
Highway and Bridge Construction Projects<br />
The direct and indirect requirements matrix is one of <strong>the</strong> two matrices that measure <strong>the</strong><br />
interaction among industries. The o<strong>the</strong>r, <strong>the</strong> direct, indirect, and induced requirements matrix, is<br />
similar but includes <strong>the</strong> effects of household income and spending in addition to <strong>the</strong> interindustry<br />
interaction. It is referred to as <strong>the</strong> total requirement matrix. The data in <strong>the</strong> columns of Table 3 for<br />
each industry indicate <strong>the</strong> total requirements of all industries necessary for that industry to deliver<br />
$1 of output to final demand. As an example, for <strong>the</strong> Agriculture sector to increase output to final<br />
demand by $1, it must increase its overall output by $1.28 (including <strong>the</strong> initial $1 increase), <strong>the</strong><br />
Manufacturing sector must increase its output $.12 and <strong>the</strong> Services sector must increase its output<br />
$.16. The total output increase of Agriculture in this simplistic economy is <strong>the</strong> sum of <strong>the</strong>se three<br />
values, or 1.56 times larger than <strong>the</strong> initial output expansion in Agriculture. The corresponding<br />
values for Manufacturing and Services are 1.35 and 1.16, respectively. These numbers are output<br />
multipliers.<br />
Table 3: Illustrative Total Requirements Matrix<br />
Purchasing Sectors (Demand)<br />
Processing Sectors (Sellers) Agr. Mfg. Serv.<br />
Agriculture 1.28 0.17 0.06<br />
Manufacturing 0.12 1.11 0.07<br />
Services 0.16 0.17 1.03<br />
Total Inputs 1.56 1.35 1.16<br />
PROCEDURES<br />
Measurement of <strong>the</strong> economic impacts of specific types of highway improvement requires <strong>the</strong><br />
following 11-step procedure, developed by <strong>the</strong> authors, which is illustrated with Kansas data<br />
(Babcock et al. 2010).<br />
1. Establish objectives<br />
2. Conduct secondary data search<br />
3. Tabulate <strong>the</strong> population of construction firms eligible to obtain state highway contracts<br />
4. Select highway improvement types<br />
5. Measure <strong>the</strong> total state expenditure for each highway improvement type<br />
6. Select highway construction firm samples<br />
7. Design <strong>the</strong> questionnaire<br />
8. Conduct <strong>the</strong> survey<br />
9. Perform consistency check<br />
10. Calculate output, value added (income), and employment multipliers for each highway<br />
improvement type<br />
11. Calculate output, value added (income), and employment impacts<br />
Any study must start with clear objectives to provide a framework for <strong>the</strong> research effort. In<br />
this type of study, <strong>the</strong> objectives are determined by <strong>the</strong> information needed by <strong>the</strong> state DOT. In a<br />
study recently completed for <strong>the</strong> state of Kansas, <strong>the</strong> following objectives were established by <strong>the</strong><br />
Kansas Department of <strong>Transportation</strong> (KDOT):<br />
1. Measure <strong>the</strong> direct output, value added, and employment impacts by highway improvement<br />
type of <strong>the</strong> Kansas Comprehensive <strong>Transportation</strong> Program (CTP).<br />
2. Measure <strong>the</strong> indirect and induced output, value added, and employment impacts by highway<br />
improvement type of <strong>the</strong> Kansas Comprehensive <strong>Transportation</strong> Program (CTP).<br />
The Kansas CTP extended from July 1999 to July 2009 and included expenditures of $5.24<br />
billion for state highway system projects, including interstate highways (Babcock et al. 2010).<br />
40
JTRF Volume 50 No. 1, Spring 2011<br />
A secondary data search helps provide insight regarding <strong>the</strong> potential outcome of <strong>the</strong> research<br />
project. For example, <strong>the</strong> U.S. input-output model (Minnesota IMPLAN Group 1999) was examined.<br />
The model contains input data for construction of new highways as well as maintenance and repair<br />
of highways. Analysis of this data indicated <strong>the</strong> types of inputs and approximate cost structure that<br />
should emerge from <strong>the</strong> state survey of highway contractors.<br />
The third step is to tabulate <strong>the</strong> population of construction firms eligible to obtain state highway<br />
contracts in order to draw a sample for <strong>the</strong> survey. Every state DOT maintains a list of construction<br />
firms eligible to bid on state highway construction contracts. In <strong>the</strong> Kansas CTP study, <strong>the</strong> list of<br />
firms supplied by KDOT was supplemented by a directory published by <strong>the</strong> Kansas Contractors<br />
Association (KCA). These directories are likely available in <strong>the</strong> great majority of states.<br />
The next step is <strong>the</strong> selection of highway and bridge improvement categories. The general<br />
principle with respect to classification of highway and bridge improvement types is homogeneity.<br />
Highway and bridge improvement types with similar cost structures and requiring similar inputs<br />
should be placed in <strong>the</strong> same class. For <strong>the</strong> Kansas CTP study, <strong>the</strong> research team and KDOT<br />
categorized and selected <strong>the</strong> following highway and bridge improvement types for analysis. 1<br />
Category Highway Improvement Type<br />
1 Resurfacing<br />
2 Restoration and Rehabilitation; Reconstruction and Minor Widening<br />
3 New Bridges and Bridge Replacement<br />
4 Major and Minor Bridge Rehabilitation<br />
5 New Construction; Relocation; Major Widening<br />
6 Safety/Traffic Operations/Traffic Systems Management; Environmentally<br />
Related; Physical Maintenance, Traffic Services<br />
The fifth step is measurement of total expenditure for each highway and bridge improvement<br />
type during <strong>the</strong> time frame of <strong>the</strong> study. These data are needed to expand <strong>the</strong> state survey sample data<br />
to population totals. Every state DOT has records that tabulate total annual expenditure by highway<br />
and bridge improvement type. For <strong>the</strong> Kansas CTP study, <strong>the</strong> value of construction contracts by<br />
highway and bridge improvement type is as follows:<br />
Value of CTP Construction Contracts,<br />
Category July 1999-July 2009 (Millions of Dollars)<br />
Resurfacing $1,240.9 (23.7%)<br />
Restoration and Rehabilitation;<br />
Reconstruction and Minor Widening $2,684.8 (51.3%)<br />
New Bridges and Bridge Replacement $439.1 (8.4%)<br />
Major and Minor Bridge Rehabilitation<br />
New Construction; Relocation; Major<br />
$199.8 (3.8%)<br />
Widening $503.2 (9.6%)<br />
Safety/Traffic Operations/Traffic Systems<br />
Management; Environmentally Related;<br />
Physical Maintenance; Traffic Services $169.2 (3.2%)<br />
Grand Total $5,237.0<br />
The sixth step is selection of survey samples for each highway and bridge improvement type.<br />
The general principle is to concentrate research efforts on <strong>the</strong> construction firms with <strong>the</strong> largest<br />
highway contracts simply because <strong>the</strong>y are <strong>the</strong> firms that account for <strong>the</strong> majority of <strong>the</strong> construction<br />
activity. For example, suppose <strong>the</strong>re are 10 firms performing a certain type of highway work in a<br />
particular year, and total state spending on this highway improvement type is $50 million. Also<br />
41
Highway and Bridge Construction Projects<br />
assume that one firm has a contract for $25 million, while <strong>the</strong> remaining $25 million is split equally<br />
among <strong>the</strong> o<strong>the</strong>r nine firms. If random sampling is employed, <strong>the</strong>re is only one chance in 10 that <strong>the</strong><br />
firm with <strong>the</strong> $25 million contract will be selected. A better and more useful strategy is to select <strong>the</strong><br />
firms with <strong>the</strong> large contracts. These samples were drawn from state DOT records which tabulate<br />
each construction contract by amount, highway improvement type, and name of construction firm.<br />
The research team selected <strong>the</strong> construction firm samples by highway and bridge improvement type<br />
from <strong>the</strong>se records.<br />
KDOT and <strong>the</strong> research team selected <strong>the</strong> highway contractors who obtained Kansas CTP<br />
highway construction contracts during <strong>the</strong> period January 1, 2004, to December 31, 2007. The<br />
total value of <strong>the</strong> sample contracts let during <strong>the</strong> 2004-2007 period was $1.98 billion, 37.9% of <strong>the</strong><br />
total CTP contract value of $5.24 billion (Babcock et al. 2010). Of <strong>the</strong> $1.98 billion of contracts<br />
let in <strong>the</strong> sample period, $1.42 billion was obtained from sample contractors, which was 71.4% of<br />
<strong>the</strong> $1.98 billion and 27% of <strong>the</strong> 10-year CTP total contract value of $5.24 billion (Babcock et al<br />
2010). Members of <strong>the</strong> research team conducted personal interviews with <strong>the</strong> highway contractors<br />
who received <strong>the</strong> larger contracts in each highway and bridge improvement category. In <strong>the</strong> CTP<br />
study it was not uncommon for <strong>the</strong> large construction firms to be in <strong>the</strong> sample for more than one<br />
highway improvement category.<br />
The seventh step is designing <strong>the</strong> questionnaire. The general principles are brevity and clarity.<br />
It should have any necessary explanatory notes as well as definitions and examples of each of <strong>the</strong><br />
industry sectors in <strong>the</strong> model. The questionnaire for <strong>the</strong> Kansas CTP study had four pages (see<br />
Appendix A). The first page lists <strong>the</strong> highway contracts for which purchase and cost information<br />
is requested, and space is provided for <strong>the</strong> firm to provide <strong>the</strong> final contract amount and total<br />
labor hours for each contract. The contract amount is required for a consistency check since <strong>the</strong><br />
sum of <strong>the</strong> purchases and retained earnings from <strong>the</strong> second page of <strong>the</strong> questionnaire must equal<br />
<strong>the</strong> total contract amount of <strong>the</strong> first page. Total labor hours are needed to calculate <strong>the</strong> average<br />
wage per hour for each improvement type. The second page of <strong>the</strong> questionnaire pertains to input<br />
purchases and o<strong>the</strong>r costs of <strong>the</strong> highway construction firms. On this page <strong>the</strong> firm lists <strong>the</strong> name of<br />
each supplying industry, <strong>the</strong> total purchases from that industry, and <strong>the</strong> percent of total purchases<br />
supplied by firms located in <strong>the</strong> state. 2 This page of <strong>the</strong> questionnaire also requests amounts of o<strong>the</strong>r<br />
expenditures such as amounts paid to subcontractors, wages and salaries, taxes, and depreciation.<br />
The latter figure is combined with retained earnings to preserve profit confidentiality, a necessary<br />
ingredient in obtaining <strong>the</strong> cooperation of <strong>the</strong> sample construction firms. The third and fourth page<br />
of <strong>the</strong> questionnaire contains definitions and examples of <strong>the</strong> input supplying sectors which <strong>the</strong><br />
construction firms are requested to use in classifying <strong>the</strong>ir purchases.<br />
The next step is to conduct <strong>the</strong> survey, which begins with sending a letter to <strong>the</strong> presidents of<br />
<strong>the</strong> sample construction firms explaining <strong>the</strong> objectives of <strong>the</strong> study and how <strong>the</strong> research project<br />
could benefit <strong>the</strong> company. The letter is followed by a call to <strong>the</strong> presidents of <strong>the</strong> firms to discuss<br />
<strong>the</strong> project. During <strong>the</strong> call, explain <strong>the</strong> research objectives thoroughly, emphasize confidentiality,<br />
and ask for an appointment. At <strong>the</strong> interview <strong>the</strong>y explain <strong>the</strong> questionnaire in detail and answer all<br />
questions.<br />
The ninth step is performing consistency checks. After receiving <strong>the</strong> questionnaires, <strong>the</strong>y should<br />
be checked for errors, inconsistencies (such as <strong>the</strong> value of <strong>the</strong> contract not matching <strong>the</strong> contractrelated<br />
expenditures), and omitted data. Call <strong>the</strong> respondent to clarify any problems. After resolving<br />
any data problems, <strong>the</strong> input-output tables were constructed.<br />
The next step is <strong>the</strong> calculation of output, value added (income), and employment multipliers for<br />
each highway and bridge improvement type. Output multipliers are a good indicator of <strong>the</strong> degree<br />
of economic interaction between each state industry sector and <strong>the</strong> rest of <strong>the</strong> state economy as well<br />
as exports to and imports from o<strong>the</strong>r regions. The output multipliers are calculated by summing <strong>the</strong><br />
columns corresponding to each highway improvement type of <strong>the</strong> total requirements matrix.<br />
Value added (income) is <strong>the</strong> sum of employee compensation (total payroll including value of<br />
benefits), proprietors’ income (payments to self employed individuals), property income (such as<br />
42
JTRF Volume 50 No. 1, Spring 2011<br />
rents, royalties, dividends, and corporate profits), and indirect business taxes (excise taxes, property<br />
taxes, licenses, fees, and sales taxes paid by business). Value added multipliers indicate <strong>the</strong> total<br />
value added generated from <strong>the</strong> construction projects of a given highway or bridge improvement<br />
type, including direct value added within <strong>the</strong> construction industry as well as <strong>the</strong> indirect value<br />
added of <strong>the</strong> industries that supply <strong>the</strong> construction industry with materials, goods, and services.<br />
The value added multiplier also includes <strong>the</strong> induced value added in various consumer markets<br />
produced by <strong>the</strong> increased spending of people employed both directly and indirectly as a result of<br />
state construction projects.<br />
The employment multipliers for each highway or bridge improvement type represent <strong>the</strong> sum of<br />
three effects: <strong>the</strong> direct employment within <strong>the</strong> construction industry itself, <strong>the</strong> indirect employment<br />
in <strong>the</strong> input supplier industries, and <strong>the</strong> induced employment in various consumer markets generated<br />
by increased consumer spending of people employed directly and indirectly on state highway<br />
construction projects.<br />
The output, value added, and employment multipliers for five highway and bridge improvement<br />
types are displayed in Table 4. 3 Using resurfacing as an example, <strong>the</strong> multipliers are interpreted in <strong>the</strong><br />
following manner. In <strong>the</strong> case of <strong>the</strong> output multiplier, for every $1 increase in resurfacing contract<br />
value, total Kansas production increases by $1.74 (including <strong>the</strong> initial $1 increase). With respect<br />
to <strong>the</strong> value added multiplier, for every $1 increase in value added in <strong>the</strong> Kansas construction firms<br />
performing road surfacing, total Kansas value added increases by $1.78 (including <strong>the</strong> initial $1<br />
increase). In <strong>the</strong> case of <strong>the</strong> employment multiplier, for every job generated in Kansas construction<br />
firms involved in resurfacing work, total Kansas employment increases by 1.91 jobs (including <strong>the</strong><br />
initial one job increase).<br />
Table 4: Output, Value Added, and Employment Multipliers of <strong>the</strong> Kansas CTP Study<br />
Output Value Added Employment<br />
Highway Improvement Type<br />
Multiplier Multiplier Multiplier<br />
Resurfacing 1.74047 1.78454 1.90737<br />
Restoration, Rehabilitation, Reconstruction and<br />
Minor Widening<br />
1.60446 1.68217 1.89845<br />
New Bridges and Bridge Replacement, Major<br />
and Minor Bridge Rehabilitation<br />
1.50128 1.64579 1.69373<br />
New Construction; Relocation, Major Widening 1.52279 1.62144 1.76020<br />
Safety/Traffic Operations/ Traffic Systems<br />
Management; Environmentally Related,<br />
Physical Maintenance, Traffic Services<br />
1.54372 1.63245 1.89454<br />
Total 1.61929 1.69779 1.86215<br />
Source: Babcock et al. (2010).<br />
The multipliers were calculated with a 345 sector input-output model calibrated to 2006, roughly<br />
<strong>the</strong> mid-point of <strong>the</strong> project investment period, using <strong>the</strong> IMPLAN modeling system originally<br />
developed by <strong>the</strong> U.S. Forest Service (Minnesota IMPLAN Group, Inc. 1999). IMPLAN creates<br />
a detailed model of <strong>the</strong> economy that charts <strong>the</strong> financial flows between all production sectors and<br />
institutions, i.e., government, households, and capital. The purchase and cost information from <strong>the</strong><br />
contractor survey was placed in <strong>the</strong> appropriate sector of <strong>the</strong> 90 sectors most closely associated<br />
with highway construction. The national production function of highway, street, bridge, and tunnel<br />
construction was used for this purpose. This production function provides a national average<br />
43
Highway and Bridge Construction Projects<br />
“production recipe” of inputs required to produce <strong>the</strong> output associated with highway construction.<br />
Thus, we can apportion total reported spending to each of <strong>the</strong> industry sectors associated with<br />
highway construction activity.<br />
The first step in this process was to bridge <strong>the</strong> 43 sector contractor survey expenditures and<br />
<strong>the</strong> 90 IMPLAN highway industry input sectors that were present in Kansas. For example, Kansas<br />
contractors reported spending for non-metallic minerals such as sand and gravel. In <strong>the</strong> IMPLAN<br />
system, non-metallic minerals is represented by two sectors, stone mining and quarrying, and sandgravel-clay<br />
and refractory mining. To determine how much of <strong>the</strong> Kansas contractor spending on<br />
non-metallic minerals that each IMPLAN sector gets, we examined <strong>the</strong> national production function<br />
and observe that stone mining gets 77% of <strong>the</strong> non-metallic minerals spending while sand-gravelclay<br />
and refractory mining gets 23%. Thus, if a total of $10 million had been spent on non-metallic<br />
minerals, $7.7 million was assigned to stone mining and $2.3 million was assigned to sand-gravelclay<br />
and refractory mining. There is a direct correspondence between agricultural services and<br />
agriculture and forestry support activities. Thus, <strong>the</strong> IMPLAN sector for agriculture and forestry<br />
support activities gets 100% of <strong>the</strong> spending reported by <strong>the</strong> highway contractors for agriculture<br />
services. In this way <strong>the</strong> inter-industry input patterns for Kansas highway construction closely<br />
approximate national input patterns yet retains <strong>the</strong> distinctive expenditure distribution reported by<br />
Kansas contractors.<br />
Following this procedure, total in-state spending for each of <strong>the</strong> construction categories was<br />
input into <strong>the</strong> 90 highway construction input sectors represented in <strong>the</strong> Kansas input-output model.<br />
With <strong>the</strong> introduction of <strong>the</strong> spending into <strong>the</strong> model, IMPLAN calculates <strong>the</strong> associated indirect and<br />
induced impacts associated with <strong>the</strong> activity. At <strong>the</strong> same time, it generates <strong>the</strong> various economic<br />
multipliers reported in Table 4 that summarize <strong>the</strong> total economic activity associated with <strong>the</strong> new<br />
highway spending.<br />
CALCULATION OF OUTPUT, VALUE ADDED, AND EMPLOYMENT IMPACTS<br />
The last step of <strong>the</strong> procedure is calculation of impacts. Once <strong>the</strong> various multipliers have been<br />
determined, <strong>the</strong> output, value added, and employment impacts of state highway programs can be<br />
easily calculated. To compute output impacts, <strong>the</strong> researcher obtains from <strong>the</strong> state DOT <strong>the</strong> value<br />
of construction contracts by highway and bridge improvement type awarded during <strong>the</strong> time frame<br />
of <strong>the</strong> study. The values of contracts spent in <strong>the</strong> state by highway improvement type are multiplied<br />
by <strong>the</strong>ir respective multipliers to obtain <strong>the</strong> output impacts. The output impacts by highway and<br />
bridge improvement types for <strong>the</strong> Kansas CTP study are in Table 5. Examination of <strong>the</strong> table reveals<br />
that <strong>the</strong> $5.24 billion Kansas CTP generated a total output impact of $6.7 billion (includes <strong>the</strong> $5.24<br />
billion direct impact).<br />
Value added impacts by highway and bridge improvement type are calculated by multiplying<br />
direct value added (value added generated within <strong>the</strong> construction industry) by <strong>the</strong>ir respective<br />
multipliers. In <strong>the</strong> Kansas CTP study, <strong>the</strong> total Kansas direct value added of $1.83 billion resulted<br />
in a total value added impact of $3.11 billion (Table 6).<br />
Employment impacts by highway and bridge improvement type are obtained by multiplying<br />
direct employment by <strong>the</strong> appropriate employment multiplier. The Kansas IMPLAN inputoutput<br />
model doesn’t measure employment within <strong>the</strong> Kansas highway construction industry<br />
(direct employment), so it had to be estimated manually. To estimate Kansas direct construction<br />
employment, we used total state output and employment in <strong>the</strong> Kansas highway construction sector<br />
(Babcock et al. 2010). In 2006, Kansas highway construction output totaled $840,275,000 and<br />
highway construction employment was 8,100 workers. Thus, each $1million in highway construction<br />
outputs was associated with 9.64 workers (8,100/840,275). Multiplying Kansas total construction<br />
spending by highway improvement type for <strong>the</strong> 10-year CTP era by 9.64 yields an estimate of direct<br />
employment in highway construction companies. The results are in Table 7.<br />
44
JTRF Volume 50 No. 1, Spring 2011<br />
The employment impact by highway and bridge improvement type is obtained by multiplying<br />
<strong>the</strong> direct employment from Table 7 by <strong>the</strong> appropriate multiplier (Table 8). In <strong>the</strong> Kansas CTP<br />
study, <strong>the</strong> direct employment of 50,483 generated a total of 94,007 jobs (including <strong>the</strong> direct<br />
employment of 50,483).<br />
Table 5: Kansas CTP Output Impact by Highway Improvement Types<br />
(1)<br />
Highway<br />
Improvement<br />
Type<br />
(2)<br />
Value of CTP<br />
Contracts<br />
(3)<br />
Proportion of<br />
Contracts Spent<br />
Outside Kansas<br />
(4)<br />
Value of<br />
Contracts Spent<br />
in Kansas<br />
(5)<br />
In-state Output<br />
Multiplier<br />
(6)<br />
Output Impact<br />
1 $1,240,934,211 15.77% $1,045,226,437 1.74047 $1,819,192,241<br />
2 $2,684,791,829 18.84% $2,178,896,284 1.60446 $3,495,973,173<br />
3-4 $638,865,242 34.09% $421,063,094 1.50128 $632,136,472<br />
5 $503,152,560 29.46% $354,900,856 1.52279 $540,441,136<br />
6 $169,224,802 18.39% $138,107,886 1.54372 $213,200,167<br />
Total $5,236,968,645 20.98% $4,138,194,557 1.61929 $6,700,943,189<br />
Column (6) is <strong>the</strong> product of Columns (4) and (5), although not exactly due to rounding of <strong>the</strong> multiplier. All<br />
data reported in dollars are measured in 2009 dollars.<br />
Source: Babcock et al. (2010).<br />
Table 6: Kansas CTP Value Added Impact by Highway Improvement Type<br />
(1)<br />
Highway<br />
Improvement<br />
Type<br />
(2)<br />
Value of CTP<br />
Contracts<br />
(3)<br />
Direct Value<br />
Added<br />
(4)<br />
Value Added<br />
Multiplier<br />
(5)<br />
Value Added<br />
Impact<br />
1 $1,240,934,211 $463,875,286 1.78454 $827,808,555<br />
2 $2,684,791,829 $973,537,493 1.68217 $1,637,661,853<br />
3-4 $638,865,242 $174,278,818 1.64579 $286,828,010<br />
5 $503,152,560 $157,080,456 1.62144 $254,696,910<br />
6 $169,224,802 $61,054,547 1.63245 $99,668,973<br />
Total $5,236,968,645 $1,829,826,600 1.69779 $3,106,664,301<br />
Column (5) is <strong>the</strong> product of Columns (3) and (4), although not exactly due to rounding of <strong>the</strong> multiplier.<br />
Data measured in dollars is reported in 2009 dollars.<br />
Source: Babcock et al. (2010).<br />
CONCLUSION<br />
State highway policymakers are usually very interested in <strong>the</strong> labor impacts of highway investment.<br />
The model suggested in this paper is capable of measuring some of <strong>the</strong>se impacts. Suppose<br />
policymakers want to know how many jobs would be generated by annual spending of $105 million<br />
on new construction and major widening. Using data from Table 7, direct employment is 1,012 jobs<br />
(105 x 9.64). Multiplying 1,012 by <strong>the</strong> employment multiplier in Table 8 of 1.76020 results in a<br />
total impact of 1,782 jobs. According to <strong>the</strong> contractor survey of <strong>the</strong> CTP study <strong>the</strong> average wages,<br />
salaries, and benefits per hour in <strong>the</strong> New Construction and Major Widening category is $34.25<br />
(Babcock et al. 2010). Assuming 2,000 annual work hours results in direct annual wages, salaries,<br />
45
Highway and Bridge Construction Projects<br />
and benefits per worker of $68,500. When this figure is multiplied by 1,782 workers, <strong>the</strong> result is<br />
total annual direct wages, salaries, and benefits of $122.1 million.<br />
The model in this paper can be employed by state DOTs to advise highway policymakers<br />
regarding <strong>the</strong> economic impacts of alternative highway programs. If policymakers supply state<br />
DOTs with <strong>the</strong> proposed total contract value of <strong>the</strong> various highway improvement types (i.e., column<br />
[2] of Table 5), <strong>the</strong> state DOT can use <strong>the</strong> output multipliers to estimate <strong>the</strong> output impact of any<br />
proposed highway program. Even if <strong>the</strong> total contract value of alternative highway programs is <strong>the</strong><br />
same, <strong>the</strong> economic impacts will different because <strong>the</strong> multipliers of <strong>the</strong> various highway and bridge<br />
improvement types are different.<br />
The highway construction impacts analyzed in this paper represent only a part of <strong>the</strong> benefits of<br />
highway investment. A more comprehensive view of <strong>the</strong> benefits would combine three categories<br />
of benefits that would include construction, highway user, and regional economic growth benefits.<br />
Once a highway is built it becomes an asset that yields benefits to highway users over <strong>the</strong> useful life<br />
of <strong>the</strong> asset. Many of <strong>the</strong> user benefits have been identified in <strong>the</strong> literature and include logistics cost<br />
reductions for firms using truck freight, accident cost reductions, travel time savings for motorists,<br />
and lower vehicle operating costs. However, measurement of <strong>the</strong>se benefits, especially on a regional<br />
basis, is a formidable research task (Allen et al. 1994).<br />
Table 7: Estimated Direct Construction Contractor Employment by<br />
Highway Improvement Type<br />
(1)<br />
Highway<br />
Improvement Type<br />
46<br />
(2)<br />
Value of CTP Contracts<br />
(Millions of dollars)<br />
(3)<br />
Direct Employment per<br />
Million Dollars<br />
(4)<br />
Direct<br />
Employment<br />
1 $1,240.9 9.64 11,962<br />
2 $2,684.8 9.64 25,881<br />
3-4 $638.9 9.64 6,158<br />
5 $503.2 9.64 4,850<br />
6 $169.2 9.64 1,631<br />
Total<br />
Source: Babcock et al. (2010).<br />
$5,236.9 9.64 50,483<br />
Table 8: Kansas CTP Employment Impact by Highway Improvement Type<br />
(1)<br />
Highway<br />
Improvement Type<br />
(2)<br />
Indirect<br />
Employment<br />
(3)<br />
Direct<br />
Employment<br />
(4)<br />
Employment<br />
Multiplier<br />
(5)<br />
Total Employment<br />
Impact<br />
1 10,854 11,962 1.90737 22,816<br />
2 23,253 25,881 1.89845 49,134<br />
3-4 4,272 6,158 1.69373 10,430<br />
5 3,687 4,850 1.76020 8,537<br />
6 1,459 1,631 1.89454 3,090<br />
Total 43,524 50,483 1.86215 94,007<br />
Column (5) is <strong>the</strong> product of Columns (3) and (4).<br />
Source: Babcock et al. (2010).
APPENDIX<br />
JTRF Volume 50 No. 1, Spring 2011<br />
HIGHWAY CONTRACTOR SURVEY FORMS FOR PURCHASE-COST INFORMATION<br />
KDOT Contractor No.: SAMPLE<br />
AND TOTAL LABOR HOURS<br />
HIGHWAY ECONOMIC IMPACT PROJECT<br />
PRIME CONTRACT SURVEY<br />
Person answering questionnaire _______________________________<br />
We request your purchase and cost information on <strong>the</strong> highway projects listed below.<br />
These contracts deal only with:<br />
KDOT KDOT Final Total<br />
Contract Project Contract Labor<br />
Numbers Route Number Let Date Amount (if avail.) Hours<br />
92000001 K-490 K 1000-01 10/20/04 ____________ _______<br />
93000001 U-220 K 2000-01 8/28/06 ____________ _______<br />
PQ1<br />
TOTALS ____________ _______<br />
47
Highway and Bridge Construction Projects<br />
48<br />
HIGHWAY ECONOMIC IMPACT PROJECT<br />
KDOT Contractor No.: SAMPLE Respondent _____________________<br />
Please provide your firm’s purchases by supplying industry on only <strong>the</strong> projects on <strong>the</strong> previous<br />
page, which were let from January 1, 2004 to December 31, 2007.<br />
Provide figures from all <strong>the</strong> projects as though <strong>the</strong>y were one project.<br />
PURCHASES:<br />
Supplying Industries<br />
- brief description<br />
(See attached list of industries.)<br />
O<strong>the</strong>r Expenditures:<br />
Paid to Subcontractors<br />
Wages and salaries (include both direct and<br />
overhead salaries)<br />
Taxes - Federal<br />
- State<br />
- Local<br />
Depreciation and Retained Earnings<br />
TOTAL EXPENDITURES<br />
Total Purchases<br />
(Include both direct<br />
and overhead costs)<br />
($ or %)<br />
PQ1<br />
Percent Supplied<br />
by Producers in<br />
Kansas
1. Agricultural Services - landscaping, grass seeding<br />
2. Non-Metallic Minerals - rocks, stone, sand, dirt, aggregates<br />
3. O<strong>the</strong>r Mining - Oil, gas, coal, o<strong>the</strong>r minerals<br />
JTRF Volume 50 No. 1, Spring 2011<br />
4. Construction Maintenance and Repair - maintenance and repair of capital assets including<br />
construction machinery and vehicles<br />
5. Heavy Construction - general contractors engaged in <strong>the</strong> construction of highways, streets,<br />
and bridges. Doesn’t include payments to subcontractors. Only includes purchases from<br />
o<strong>the</strong>r construction firms.<br />
6. Special Trade Contractors - plumbing, plastering, painters, carpenters<br />
7. Paper and Allied Products - paper bags, boxes, all types of paper<br />
8. Printing and Publishing - brochures, reports, any type of published material<br />
9. Industrial Chemicals - basic industrial chemicals such as industrial gases, pigments, dyes, etc.<br />
10. Agricultural Chemicals - fertilizer, pesticides<br />
11. O<strong>the</strong>r Chemicals - explosives, paint, cleaning preparations, glue, ink<br />
12. Petroleum and Coal Products - asphalt, lubricating oils, and greases<br />
13. Rubber and Plastic Products - tires, cold plastic and <strong>the</strong>rmal plastic pavement markings,<br />
plastic cones and barrels<br />
14. Cement and Concrete Products - hydraulic cement, concrete products like pipe, pre-stressed<br />
beams, drilled shaft casings<br />
15. Stone, Clay, and Glass Products - lime, gypsum, abrasives, cut stone products, glass products,<br />
flat glass, bricks<br />
16. Primary Metal Products - iron, steel, aluminum, copper, iron pipe<br />
17. Fabricated Structural Metal - rebar, structural steel, corrugated metal pipe, signs, sign<br />
supports, guard rail<br />
18. O<strong>the</strong>r Fabricated Metal - tools, containers, fasteners, wire, nuts, bolts, valves<br />
19. Farm Machinery and Equipment - tractors, combines, bailers<br />
20. Construction and Industrial Machinery - construction machinery parts, equipment, and rentals.<br />
Does not include construction machinery repairs (see sector 4)<br />
21. Electrical Machinery - air conditioning, refrigeration, materials handling machines, power<br />
driven hand tools, lighting fixtures, electric motors, generators, batteries<br />
22. O<strong>the</strong>r Machinery - engines, turbines, machine tools<br />
23. Motor Vehicles and Equipment - purchases of cars and car parts<br />
24. O<strong>the</strong>r Transport Equipment - railroads, boat, aircraft equipment and parts<br />
25. O<strong>the</strong>r Manufacturing - lumber and wood products, furniture, lea<strong>the</strong>r products, scientific<br />
instruments, metal filing cabinets, miscellaneous manufacturing<br />
26. Railroad <strong>Transportation</strong> - transport by railroad<br />
27. Motor Freight <strong>Transportation</strong> - transport by truck<br />
28. O<strong>the</strong>r <strong>Transportation</strong> - transport by air, water, or oil pipeline<br />
29. Communications - phones, cell phones, internet connection fees, anything involving oral or<br />
visual communication<br />
49
Highway and Bridge Construction Projects<br />
30. Electric, Gas, and Sanitary Services - expenditures for electricity, natural gas, water, garbage<br />
collection<br />
31. Wholesale Trade, Machinery, and Equipment - purchases from wholesalers of machinery,<br />
equipment, and supplies<br />
32. O<strong>the</strong>r Wholesale Trade - purchases from wholesalers o<strong>the</strong>r than for machinery, equipment,<br />
and supplies<br />
33. Gasoline Service Stations - purchases of gas or diesel fuel<br />
34. Eating and Drinking Places - restaurant purchases<br />
35. O<strong>the</strong>r Retail Trade - all o<strong>the</strong>r purchases from retail stores, except fuel and food<br />
36. Banking - interest payments on bank loans<br />
37. O<strong>the</strong>r Financial Institutions - interest on all non-bank loans<br />
38. Insurance and Real Estate - performance bonds, liability insurance, employee health<br />
insurance, building or o<strong>the</strong>r rental payments<br />
39. Lodging Services - payments to hotels and motels<br />
40. Personal Services - services involving care of <strong>the</strong> person or person’s clothing<br />
41. Business Services - licenses, filing fees, advertising, data and word processing, professional<br />
and legal services, consulting, vehicle rental or leasing, accounting, tax preparation<br />
42. Medical and Health Services - payments for medical or surgical services to persons. Doesn’t<br />
include health insurance for employees (see sector 38)<br />
43. O<strong>the</strong>r Services - payments for all o<strong>the</strong>r services not enumerated above like automotive repair,<br />
entertainment, education<br />
Endnotes<br />
1. The highway improvement categories of <strong>the</strong> Kansas CTP study are combinations of Federal<br />
Highway Administration (FHWA) highway and bridge improvement types.<br />
2. The questionnaire employed to obtain <strong>the</strong> purchase and cost data for <strong>the</strong> various highway<br />
improvement types requires <strong>the</strong> respondent to report <strong>the</strong> percent of each input purchase type that<br />
is supplied by in-state producers. This is done to net out imports that have no impact in <strong>the</strong> state<br />
and are thus not included in <strong>the</strong> study. For example, if a construction firm purchases $10 million<br />
of cement and 80% is purchased from an in-state supplier, <strong>the</strong> study measures only <strong>the</strong> impact of<br />
<strong>the</strong> $8 million that increases cement production within <strong>the</strong> state. The o<strong>the</strong>r $2 million increases<br />
cement production in an out-of-state location and is not included in <strong>the</strong> impacts measured by <strong>the</strong><br />
study.<br />
3. The relatively small amount of Category 4 (Major and Minor Bridge Rehabilitation) contract<br />
value in returned contractors’ questionnaires resulted in combing Category 3 (New Bridges and<br />
Bridge Replacement) with Category 4.<br />
50
References<br />
JTRF Volume 50 No. 1, Spring 2011<br />
Allen, B.L., W. Butterfield, A. Kazakov, M.L. Kliman, A.A. Kuburst, and J.D. Welland. “Measuring<br />
Economic Stimulation from Capital Investment in <strong>Transportation</strong>.” Presented at <strong>the</strong> 67 th Annual<br />
Meeting of <strong>the</strong> <strong>Transportation</strong> <strong>Research</strong> Board, Washington, D.C., 1988.<br />
Allen, Benjamin C., C. Phillip Baumel, and David J. Forkenbrock. “Expanding <strong>the</strong> Set of Efficiency<br />
Gains of a Highway Investment: Conceptual, Methodological, and Practical Issues.” <strong>Transportation</strong><br />
<strong>Journal</strong> 34 (1), (1994): 39-47.<br />
Babcock, Michael W., M. Jarvin Emerson, and Marvin Prater. “A Model Procedure for Estimating<br />
Economic Impacts of Alternative Types of Highway Improvement.” <strong>Transportation</strong> <strong>Journal</strong> 36 (4),<br />
(1997): 30-43.<br />
Babcock, Michael W., John C. Lea<strong>the</strong>rman, Mark Melichar, and E. Dean Landman. Economic<br />
Impacts of <strong>the</strong> Kansas Comprehensive <strong>Transportation</strong> Program (CTP) Highway Construction and<br />
Maintenance Activities. Kansas Department of <strong>Transportation</strong>, Topeka, Kansas, July 2010.<br />
Babcock, Michael W. and Bernt Bratsberg. “Measurement of Economic Impacts of Highway and<br />
Bridge Construction.” <strong>Journal</strong> of <strong>the</strong> <strong>Transportation</strong> <strong>Research</strong> <strong>Forum</strong> 37 (2), (1998): 52-66.<br />
Boarnet, Marlon G. “New Highways and Economic Growth: Rethinking <strong>the</strong> Link.” Access:<br />
<strong>Research</strong> at <strong>the</strong> University of California <strong>Transportation</strong> Center No. 7, (Fall 1995): 11-15.<br />
Briggs, R. “The Interstate Highway System and Development in Nonmetropolitan Areas.”<br />
<strong>Transportation</strong> <strong>Research</strong> Record 812, (1981): 9-12.<br />
Briggs, Ronald. “The Impact of <strong>the</strong> Interstate Highway System on Nonmetropolitan Development,<br />
1950-1980.” R.H. Platt and George Machinko eds. Beyond <strong>the</strong> Urban Fringe. Minneapolis:<br />
University of Minnesota Press (1983): 83-105.<br />
Brown, Dennis M. Highway Investment and Rural Economic Development: An Annotated<br />
Bibliography. Food and Rural Economics Division, Economic <strong>Research</strong> Service, U.S. Department<br />
of Agriculture, Washington, D.C., 1999.<br />
Carlino, Gerald A. and Edwin S. Mills. “The Determinants of County Growth.” <strong>Journal</strong> of Regional<br />
Science 27 (1), (1987): 39-54.<br />
Chandra A. and E. Thompson. “Does Public Infrastructure Affect Economic Activity? Evidence<br />
from <strong>the</strong> Rural Interstate Highway System.” Regional Science and Urban Economics 30, (2000):<br />
457-490.<br />
Chi, Guangqing and C.J. Cleveland. “Highway Effects on Economic and Population Growth:<br />
Regional Economic Explanation.” C.J. Cleveland ed. Encyclopedia of Earth. Washington, D.C.:<br />
National Council for Science and <strong>the</strong> Environment (2006).<br />
Crane, Laurence M. and David J. Leatham. “Distributed Lag Effects of <strong>Transportation</strong> Expenditures<br />
on Rural Income and Employment.” The Review of Regional Studies 23 (2), (1993): 163-182.<br />
Deller, Steven C. and David Williams. “The Contribution of Agriculture to <strong>the</strong> Wisconsin Economy.”<br />
Department of Agricultural and Applied Economics, University of Wisconsin-Madison, 2009.<br />
Dodgson, J.S. “Motorway Investment, Industrial Transport Costs and Subregional Growth. A Case<br />
Study of M62.” Regional Studies 8, (1974): 75-91.<br />
51
Highway and Bridge Construction Projects<br />
Eagle, D. and Y.J. Stephanedes. “Dynamic Highway Impacts on Economic Development.”<br />
<strong>Transportation</strong> <strong>Research</strong> Record No. 1125, (1988): 1-14.<br />
Garrison, William L. and R.R. Souleyrette II. “<strong>Transportation</strong> Innovation and Development: The<br />
Companion Innovation Hypo<strong>the</strong>sis.” The Logistics and <strong>Transportation</strong> Review 32 (1), (1996): 63-<br />
76.<br />
Holleyman, Chris. “Industry Studies of <strong>the</strong> Relationship Between Highway Infrastructure and<br />
Productivity.” The Logistics and <strong>Transportation</strong> Review 32 (1), (1996): 93-118.<br />
Holtz-Eakim Douglas and Amy Schwartz. “Spatial Product Spillovers from Public Infrastructure:<br />
Evidence from State Highways.” International Tax and Public Finance 2 (3), (1995): 459-468.<br />
Humphrey, C.R. and R.A. Sell. “The Impact of Controlled Access Highways in Population Growth<br />
in Pennsylvania Nonmetropolitan Communities, 1940-1970.” Rural Sociology 40, (1975): 332-<br />
343.<br />
Isserman, Andrew M., T. Rephann, and D.J. Sorenson. “Highways and Rural Economic<br />
Development: Results from Quasi-Experimental Approaches.” Paper Presented at <strong>the</strong> Annual<br />
Meeting of <strong>the</strong> American Collegiate Schools of Planning, October, 1989.<br />
Khanam, B.R. “Highway Infrastructure Capital and Productivity Growth: Evidence from Canadian<br />
Goods-Producing Sector.” The Logistics and <strong>Transportation</strong> Review 32 (3), (1996): 251-268.<br />
Kuehn, John A. and J.G. West. “Highways and Regional Development.” Growth and Change 2,<br />
(1971): 23-28.<br />
Lichter, Daniel T. and Glenn V. Fuguitt. “Demographic Response to <strong>Transportation</strong> Innovation:<br />
The Case of <strong>the</strong> Interstate Highway.” Social Forces 59 (2), (1980): 492-511.<br />
Midwest <strong>Transportation</strong> Center and <strong>the</strong> University of Iowa Public Policy Center. Road Investment<br />
to Foster Local Economic Development, Iowa City, IA, 1990.<br />
Miller, James P. “Interstate Highways and Job Growth in Nonmetropolitan Areas: A Reassessment.”<br />
<strong>Transportation</strong> <strong>Journal</strong> 19, (1979): 78-81.<br />
Minnesota IMPLAN Group, Inc. IMPLAN Professional (version 2.0) Users Guide, Analysis Guide,<br />
Data Guide. Stillwater, MN, 1999.<br />
Mullen, J. and M. Williams. “The Contribution of Highway Infrastructure to States’ Economies.”<br />
International <strong>Journal</strong> of Transport Economics 19 (2), (1992).<br />
Peterson, Steven K. and Eric L. Jessup. “Evaluating <strong>the</strong> Relationship Between <strong>Transportation</strong><br />
Infrastructure and Economic Activity: Evidence from Washington State.” <strong>Journal</strong> of <strong>the</strong><br />
<strong>Transportation</strong> <strong>Research</strong> <strong>Forum</strong> 47 (2), (2008): 21-40.<br />
Politano, A.L. and C.J. Roadifer. “Regional Economic Impact Model for Highway Systems<br />
(REIMHS).” <strong>Transportation</strong> <strong>Research</strong> Record 1229, (1989): 43-52.<br />
Repham, T.J. and A.M. Isserman. “New Highways as Economic Development Tools: An Evaluation<br />
Using Quasi-Experimental Matching Methods.” Regional Science and Urban Economics 24 (6),<br />
(1994): 723-751.<br />
52
JTRF Volume 50 No. 1, Spring 2011<br />
Singletary, Loretta, Mark Henry, Kerry Brooks and James London. “The Impact of Highway<br />
Investment on New Manufacturing Employment in South Carolina: A Small Region Spatial<br />
Analysis.” Review of Regional Studies 25 (1), (1995): 83-90.<br />
Stephanedes, Y.J. <strong>Transportation</strong> and Economic Development: The Link Between Highway<br />
Investment and Economic Development: A Time Series Investigation. Minnesota Department of<br />
<strong>Transportation</strong>, Report No. MN/RC, 1989.<br />
Stephanedes, Y.J. and D.M. Eagle. “Highway Expenditures and Nonmetropolitan Employment.”<br />
<strong>Journal</strong> of Advanced <strong>Transportation</strong> 20 (1), (1986): 43-61.<br />
Stephanedes, Y.J. and David M. Eagle. “Time Series Analysis of Interactions Between <strong>Transportation</strong><br />
and Manufacturing and Retail Employment.” <strong>Transportation</strong> <strong>Research</strong> Record No. 1074, (1986):<br />
16-24.<br />
Stephanedes, Y.J. and D.M. Eagle. “Highway Impacts on Regional Employment.” <strong>Journal</strong> of<br />
Advanced <strong>Transportation</strong> 21, (1987): 369-389.<br />
Talley, Wayne. “Linkages Between <strong>Transportation</strong> Infrastructure Investment and Economic<br />
Production.” The Logistics and <strong>Transportation</strong> Review 32 (1), (1996): 145-154.<br />
Van de Vooren, F.W.C.J. “Modeling Transport in Interaction with <strong>the</strong> Economy.” <strong>Transportation</strong><br />
<strong>Research</strong> Part E 40 E (5), (2004): 417-437.<br />
Wilson, F.R., Albert M. Stevens, and Timothy R. Holyoke. “Impact of <strong>Transportation</strong> on Regional<br />
Development.” <strong>Transportation</strong> <strong>Research</strong> Record No. 851, (1982): 13-16.<br />
Michael W. Babcock is a full professor of economics at Kansas State University. In his 38-year<br />
career at KSU, he has published over 80 articles in professional journals, along with numerous<br />
monographs and technical reports. His research has been cited in over 75 books, <strong>the</strong> transportation<br />
press, and professional journals. He has been principal investigator or co-principal investigator on<br />
33 federal and state research grants worth a total of $2.3 million.<br />
Dr. Babcock has received numerous national awards for his transportation research. He has<br />
won five best paper awards from <strong>the</strong> <strong>Transportation</strong> <strong>Research</strong> <strong>Forum</strong> (TRF) for outstanding research<br />
in transportation economics. He has received <strong>the</strong> E.S. Bagley award five times from <strong>the</strong> Economics<br />
Department of KSU for outstanding achievements in transportation economics research. In 1998 he<br />
was awarded <strong>the</strong> ISBR Senior Faculty Award for research excellence in The Social and Behavioral<br />
Science from KSU. In 2005, he received <strong>the</strong> Herbert O. Whitten TRF Service Award (<strong>the</strong> highest<br />
honor bestowed by TRF) for professional contributions to TRF, becoming only <strong>the</strong> eighth person to<br />
receive <strong>the</strong> award in <strong>the</strong> 50 year history of TRF. He has served as general editor of <strong>the</strong> <strong>Journal</strong> of<br />
<strong>the</strong> <strong>Transportation</strong> <strong>Research</strong> <strong>Forum</strong> since 2000.<br />
Dr. John Lea<strong>the</strong>rman is a professor in <strong>the</strong> Department of Agricultural Economics at Kansas State<br />
University and local government specialist with K-State <strong>Research</strong> & Extension. He also is <strong>the</strong> director<br />
of <strong>the</strong> Office of Local Government, an educational outreach and technical assistance program for<br />
city and county governments in Kansas. He has worked with <strong>the</strong> Cooperative Extension Service<br />
since 1984 in areas of community and regional economic development policy and practice, local<br />
government and public finance, and natural resources management. <strong>Research</strong> interests include<br />
economic and fiscal impact analysis, regional economic modeling, rural development and policy<br />
analysis, local public finance, and natural resource management and environmental protection.<br />
53
Rail Rate and Revenue Changes<br />
Since <strong>the</strong> Staggers Act<br />
by Ken Casavant, Eric Jessup, Marvin E. Prater, Bruce Blanton, Pierre Bahizi,<br />
Daniel Nibarger, Johnny Hill, and Isaac Weingram<br />
An examination of <strong>the</strong> effects of deregulation and <strong>the</strong> performance of <strong>the</strong> Surface <strong>Transportation</strong><br />
Board (STB) under that deregulation usually includes an analysis of rail rates that have evolved<br />
since implementation of <strong>the</strong> Staggers Act of 1980 (Staggers Act). This paper examines <strong>the</strong> rail rate<br />
structure for agricultural commodities and compares it with rates for o<strong>the</strong>r commodities. Changes<br />
in agricultural rail rates are evaluated relative to shipment size and distance shipped to understand<br />
how <strong>the</strong>y affect agricultural shippers. Railroads transferred costs to agricultural shippers and overrecovered<br />
fuel costs with surcharges. Shippers question <strong>the</strong> reasonableness of rail rates in <strong>the</strong> light<br />
of railroad revenue adequacy data.<br />
INTRODUCTION<br />
Individual agricultural producers in <strong>the</strong> short run are “price takers” ra<strong>the</strong>r than “price makers,” with<br />
little control in <strong>the</strong> short run over <strong>the</strong> price <strong>the</strong>y receive for <strong>the</strong>ir products (Kohls 1967). Due to<br />
<strong>the</strong>ir numbers (many), relative size (small), <strong>the</strong> nature of <strong>the</strong>ir products (homogeneous with many<br />
substitutes), and lack of market power, <strong>the</strong>y have little or no ability to influence <strong>the</strong> price <strong>the</strong>y<br />
receive for <strong>the</strong>ir products, <strong>the</strong>refore, are usually unable to pass cost increases on to customers (USDA<br />
November 7, 2006). Agricultural producers are unique in that <strong>the</strong>y typically bear <strong>the</strong> transportation<br />
costs, not <strong>the</strong> grain elevator, when grain is transported (Kohls 1967). Consequently, increases in<br />
transportation costs result in decreased producer profit (Montana Wheat & Barley Committee et<br />
al. 2006). For agricultural shippers with no cost-effective alternative to rail, and located far from<br />
markets, rail is <strong>the</strong> only viable transportation available and <strong>the</strong> rail rate determines <strong>the</strong> net price <strong>the</strong><br />
producer receives (USDA November 2, 2006).<br />
Lower prices and incomes hinder farmers from borrowing funds to purchase fertilizer, seed, and<br />
machinery, reducing economic prosperity in rural areas. Higher transportation costs also affect <strong>the</strong><br />
competitive position of U.S. agricultural products in highly competitive export markets. The rates<br />
agricultural shippers pay for rail transportation can facilitate or inhibit American competitiveness in<br />
world agricultural markets (USDA November 2, 2006).<br />
The costs of rail transportation to market represent a significant percentage of <strong>the</strong> average onfarm<br />
price because grain and oilseeds are bulk commodities with a low value in proportion to <strong>the</strong>ir<br />
weight (Figure 1). For example, average rail tariff rates as a percent of <strong>the</strong> farm price of wheat have<br />
varied from 11.3% in 2007, when wheat prices were high, to 23.1% in 1999, when wheat prices<br />
were low. Rail transportation costs for individual movements of agricultural products have been as<br />
much as 40% of <strong>the</strong> delivered price (USDA 2005).<br />
Despite <strong>the</strong>se concerns, rates for land transportation of agricultural commodities in <strong>the</strong> United<br />
States remain among <strong>the</strong> lowest in <strong>the</strong> world. Although rail rates for agricultural commodities have<br />
not fallen as much as rates for some o<strong>the</strong>r products (such as coal) (GAO 2006), Figure 1 shows that<br />
<strong>the</strong> rail transportation cost during 2007, as a percentage of <strong>the</strong> price of a bushel of wheat, was at a<br />
14-year low.<br />
This paper evaluates changes in agricultural rail rates relative to shipment size and distance shipped<br />
to understand how <strong>the</strong>y affect agricultural shippers. Since <strong>the</strong> Staggers Act, railroads have transferred<br />
costs to agricultural shippers and over-recovered fuel costs with surcharges. Captive agricultural<br />
shippers question <strong>the</strong> reasonableness of rail rates in light of railroad revenue adequacy data.<br />
55
Rail Rate and Revenue Changes<br />
Figure 1: Wheat–Average Rail Tariff Compared to Average Farm Price*<br />
Average tariff rail rate per bushel<br />
LITERATURE REVIEW<br />
For nearly 100 years, <strong>the</strong> performance of railroads reflected <strong>the</strong> constraints put on <strong>the</strong>m by federal<br />
regulation. The Interstate Commerce Commission Act of 1887 (ICC Act) created <strong>the</strong> Interstate<br />
Commerce Commission (ICC). The ICC implemented <strong>the</strong> provisions of <strong>the</strong> ICC Act, working for<br />
“just and reasonable” rates without price discrimination. The regulatory environment created by <strong>the</strong><br />
ICC Act and subsequent statutes required railroads to employ cost-of-service pricing and to price at<br />
average cost, with some variation usually allowed by commodity and length of haul.<br />
Pervasive regulation interfered with <strong>the</strong> ability of railroads to react to competitive situations<br />
and efficiently manage <strong>the</strong>ir firms. Rate adjustments were slow, innovations were stymied, and<br />
rationalization of rail infrastructure was expensive and time-consuming (Gallamore 1999). The<br />
unwieldy regulatory framework, along with increased competition from o<strong>the</strong>r modes—in part due<br />
to government promotion of competing transportation modes—led to a loss of market share of<br />
intercity freight and <strong>the</strong> attendant revenue (GAO 1990). The railroads were unable to maintain <strong>the</strong>ir<br />
infrastructure, were close to bankruptcy, and were not competitive.<br />
Regulatory reform happened slowly. The most important legislation was <strong>the</strong> Staggers Act<br />
of 1980. Railroads seized on <strong>the</strong>ir new regulatory freedom to actively pursue profits and return<br />
on investment using differential pricing, cost efficiencies, abandonment of un-remunerative rail<br />
lines, mergers with o<strong>the</strong>r railroads, and <strong>the</strong> rate innovations of contracts and multiple-car pricing<br />
(Gallamore 1999).<br />
Railroads have also successfully controlled and reduced costs by abandoning rail lines,<br />
creating short line railroads, reducing labor in operations and administration, making longer hauls,<br />
increasing traffic density on rail lines, and using new technologies imaginatively (Gallamore 1999,<br />
Prater and Klindworth 2000). Increasing shipment and car sizes, running directionally, 1 and sharing<br />
dispatching have also contributed to efficiency.<br />
56<br />
$0.90<br />
$0.85<br />
$0.80<br />
$0.75<br />
$0.70<br />
$0.65<br />
$0.60<br />
$0.55<br />
$0.50<br />
4.55<br />
0.630<br />
1995<br />
4.30<br />
0.613<br />
1996<br />
0.584<br />
1997<br />
3.38<br />
2.65 2.55 2.62<br />
0.572<br />
1998<br />
0.588 0.585<br />
1999<br />
2000<br />
*Marketing year ending May 31.<br />
Sources: STB Confidential Waybill Sample<br />
USDA, NASS, Crop Value Summary<br />
Average rail tariff rate per bushel<br />
National average price of all wheat<br />
2.78<br />
0.573<br />
2001<br />
Year*<br />
3.60<br />
0.577<br />
2002<br />
0.694<br />
3.40 3.40<br />
3.40<br />
0.592<br />
2003<br />
0.639<br />
2004<br />
2005<br />
0.746<br />
2006<br />
4.26<br />
6.48<br />
2007<br />
0.732<br />
0.850<br />
6.80<br />
2008<br />
8.00<br />
7.00<br />
6.00<br />
5.00<br />
4.00<br />
3.00<br />
2.00<br />
1.00<br />
0.00<br />
Average farm price per bushel
JTRF Volume 50 No. 1, Spring 2011<br />
Railroads adopted differential pricing to use <strong>the</strong>ir capacity efficiently and recover <strong>the</strong>ir high<br />
fixed and common costs. If a railroad charged <strong>the</strong> same prices to all shippers, some shippers would<br />
find it more profitable to ship by ano<strong>the</strong>r mode. As <strong>the</strong>se shippers withdrew, <strong>the</strong> railroad would have<br />
to raise prices on its remaining customers to cover its fixed costs. Differential pricing also gives<br />
railroads <strong>the</strong> flexibility to react to differences in modal competition (Prater and Klindworth 2000).<br />
Consequently, <strong>the</strong> variable cost of providing rail transportation serves only as a floor below<br />
which rates should not go and bears little relationship to individual rail rates. Instead, rail rates are<br />
based on <strong>the</strong> price and service characteristics of competing transportation modes, <strong>the</strong> railroad’s own<br />
price and service characteristics, and <strong>the</strong> railroad’s cost.<br />
With differential pricing, shippers are charged different rates for <strong>the</strong> same service based on <strong>the</strong><br />
shipper’s dependence upon rail service. Differential pricing results in unequal rates and revenue-tovariable<br />
cost ratios for different commodities, geographical locations, and producers, even in similar<br />
circumstances. Consequently, with differential pricing, captive shippers bear a higher proportion of<br />
a railroad’s fixed and common costs than non-captive shippers (Prater and Klindworth 2000).<br />
The Staggers Act relies on competition to limit rail rates, but includes rate appeal procedures<br />
to limit <strong>the</strong> rates railroads could charge captive shippers (who have no competitive transportation<br />
choice). A shipper must meet three conditions to appeal rail rates (USDA and USDOT 2010):<br />
• Shippers may appeal only tariff rates. 2 The STB has no jurisdiction over contract rates<br />
and rates for exempt movements. 3<br />
• The movement must have a revenue-to-variable cost ratio that exceeds 180%.<br />
• The shipper must show that <strong>the</strong> railroad has market dominance, which is <strong>the</strong> lack of<br />
effective intermodal and rail-to-rail competition.<br />
In <strong>the</strong> early years of deregulation, intramodal competition may have been sufficient to yield a<br />
competitive rail grain rate structure. However, rail mergers and line abandonments have reduced<br />
intramodal competition considerably, resulting in an oligopolistic market structure that may allow<br />
railroads considerably more pricing freedom.<br />
Thus, although differential pricing offers shippers <strong>the</strong> benefit of having viable and stable<br />
rail service, reaction to rail deregulation from shippers has not been all positive. Shippers feel<br />
responsiveness to shipper needs has been lost, rail costs have been shifted to <strong>the</strong> shipper, overall rail<br />
service and capacity have decreased, rates are generally increasing, and rates have been “unfair and<br />
inequitable” in some corridors and for some commodities. Such shippers often charge that railroads<br />
unreasonably raise <strong>the</strong>ir rates to levels that are far beyond those that should be charged (Montana<br />
Wheat & Barley Committee et al. 2005; NGFA 2005; USDA 2005).<br />
Numerous papers (cited below) discuss railroad industry competition and pricing, providing<br />
varying degrees of analysis as to <strong>the</strong> impact of competition within <strong>the</strong> industry. Many of <strong>the</strong>se<br />
papers are regional in scope, investigate <strong>the</strong> impact of deregulation after <strong>the</strong> Staggers Rail Act of<br />
1980, and <strong>the</strong> majority were written in <strong>the</strong> decade after enactment. The following is not a complete<br />
survey of <strong>the</strong> prior research related to railroad competition, but instead emphasizes <strong>the</strong> interaction<br />
between railroad competition and rail grain transportation prices.<br />
Babcock, Sorenson, Chow, and Klindworth (1985) investigated <strong>the</strong> impact of <strong>the</strong> Staggers Act<br />
on Kansas agriculture. The study found substantial railroad rate reductions in <strong>the</strong> four-year period<br />
of 1981 through 1984. The pattern of rate changes suggested <strong>the</strong> presence of both intramodal and<br />
intermodal transportation competition. Tariff rates to <strong>the</strong> Gulf of Mexico during this period dropped<br />
34% compared with a 64% increase in <strong>the</strong> four years preceding <strong>the</strong> Staggers Act.<br />
MacDonald (1987) used regression analysis of <strong>the</strong> 1983 waybill sample data to examine <strong>the</strong><br />
rail rates for corn, wheat, and soybeans. Rates were negatively related to tonnage, distance, and<br />
volume of <strong>the</strong> shipments. Also, rates were negatively related to increased intramodal competition<br />
(<strong>the</strong> reciprocal of <strong>the</strong> Herfindahl Index) and rail rates increased with distance to waterways.<br />
A later study (MacDonald 1989) uses waybill data from 1981 through 1985 to analyze rail rates<br />
and competition for corn, wheat, and soybeans. MacDonald found that when rail service goes from<br />
a monopoly to a duopoly, rail rates decline 18%. The addition of a third competing railroad resulted<br />
57
Rail Rate and Revenue Changes<br />
in an additional 11% decrease in rail rates. Also, he found that shippers located 400 miles from barge<br />
access paid rail rates that were 40% higher than those located 100 miles from barge access. Finally,<br />
MacDonald calculated inverse Herfindahl-Hirschman indices for each crop reporting district (CRD)<br />
and concluded that each CRD was characterized by rail oligopolies.<br />
Chow (1986) studied post-Staggers rail grain rates for <strong>the</strong> Central Plains region. His analysis<br />
indicated an overall reduction in wheat rail rates of 34.5% in <strong>the</strong> five-year period after enactment of<br />
<strong>the</strong> Staggers Act, with <strong>the</strong> most significant reductions occurring in movements to <strong>the</strong> export markets.<br />
Kwon, Babcock, and Sorenson (1994) examined <strong>the</strong> impacts of <strong>the</strong> Staggers Act in <strong>the</strong> latter<br />
half of <strong>the</strong> 1980s and found that railroads practiced differential pricing for intra Kansas and export<br />
shipments of wheat. They discovered substantial differences in <strong>the</strong> factors affecting <strong>the</strong> revenueto-variable<br />
cost ratios for intra Kansas wheat movements versus that of Kansas export wheat<br />
movements. Revenue-to-variable cost ratios increased steadily from 1986 through 1989, but this<br />
could have been caused by diminishing export demand.<br />
Fuller, Bessler, MacDonald, and Wohlgenant (1987) found deregulation to have had a significant<br />
effect on rail corridors linking Kansas and Texas with Gulf ports and a relatively modest effect on<br />
<strong>the</strong> corridor linking Indiana with East Coast ports. Real rail rates declined $.37 per bushel in <strong>the</strong><br />
Kansas corridor and $.31 per bushel in <strong>the</strong> Texas corridor during <strong>the</strong> 1981-1985 period. In <strong>the</strong><br />
Indiana corridor, real rail rates were estimated to decrease $.08 per bushel. Railroad deregulation<br />
had little statistically significant effects on real rail rates from Iowa and Illinois to <strong>the</strong> Gulf ports.<br />
Koo, Tolliver, and Bitzan (1993) examined railroad pricing behavior in North Dakota, which<br />
is often considered a captive railroad shipping market. The region has unique transportation<br />
characteristics that include limited intermodal competition due to great distances to barge-loading<br />
facilities and to major domestic and export markets. They found that distance, volume, weight per<br />
car, intramodal competition, and intermodal competition had significant negative effects on rail<br />
rates.<br />
Thompson, Hauser, and Coughlin (1990) evaluated <strong>the</strong> pre- and post-Staggers effect of<br />
competition on railroad revenue-to-variable cost ratios for export shipments of corn and wheat. The<br />
regression results for corn were less significant than those of wheat. There was a lack of identifiable<br />
differences in pre- and post-Staggers pricing, which may be attributable to <strong>the</strong> close correlation<br />
between changes in operating factors, such as shipment size, and destination opportunity. They<br />
concluded that <strong>the</strong>ir results did not indicate a clear effect of <strong>the</strong> Staggers Rail Act on rail rate<br />
competitiveness.<br />
Wilson and Wilson (2001) examined rail rates for barley, corn, sorghum, wheat, and soybeans<br />
moved by rail. The explanatory variables include commodity ton-miles, commodity prices, average<br />
length of haul, and a non-linear specification of deregulation that allows <strong>the</strong> effects to phase in over<br />
time. They found that commodity prices have positive effects on rail rates and length of haul has a<br />
strong negative effect. The results indicate a large negative effect on rates from deregulation, which<br />
dissipate with time.<br />
The STB waybill rate data are used in Figure 2 to examine <strong>the</strong> real revenue per ton-mile for<br />
<strong>the</strong> period 1985 to 2007. The STB uses <strong>the</strong> Tornqvist Index to track rail rates. The Tornqvist index<br />
measures <strong>the</strong> change in prices in commodity categories and assigns a percentage weight to each<br />
category based on its share of total revenue. The index is essentially <strong>the</strong> weighted average of price<br />
changes within <strong>the</strong> various commodity categories. Both <strong>the</strong> prices within <strong>the</strong> various commodity<br />
categories and <strong>the</strong> weights assigned to each category can vary (STB 2009).<br />
The downward pressure on rates identified above as a result of railroad efficiency improvements<br />
and competitive pricing is evident. From 1985 to 2004 <strong>the</strong> rail rate index fell almost continuously,<br />
with only a slight increase being noted in 2002. However, as frequently stated to <strong>the</strong> STB by<br />
shippers, <strong>the</strong> years since 2004 have seen rapidly increasing rates for shippers. Starting in 1985, rail<br />
rates dropped about 10% in <strong>the</strong> first two years, continued dropping at nearly that rate through 1992,<br />
and <strong>the</strong>n declined at a slower rate during <strong>the</strong> period between 1992 and 2000. Over <strong>the</strong> next few<br />
58
100.0<br />
94.4<br />
90.5<br />
88.1<br />
83.7<br />
80.8<br />
77.0<br />
72.4<br />
71.8<br />
69.6<br />
67.2<br />
65.9<br />
64.4<br />
JTRF Volume 50 No. 1, Spring 2011<br />
Figure 2: STB Rail Rate Index 1985 to 2007; Real Revenue Per Ton-Mile (1985=100)<br />
Tornqvist Index<br />
100.0<br />
90.0<br />
80.0<br />
70.0<br />
60.0<br />
50.0<br />
40.0<br />
years, <strong>the</strong> rates hovered in a narrow range, varying both positively and negatively until 2004. From<br />
2004 to 2007 <strong>the</strong> rate index increased nearly 15%, from 56.8 to 65.5 (STB 2009).<br />
Various studies (GAO 1990, GAO 2006, Christensen 2008) have agreed with <strong>the</strong> findings that<br />
overall rail rates decreased substantially from <strong>the</strong> mid-1980s to <strong>the</strong> early 2000s. The causes of <strong>the</strong><br />
decrease included:<br />
• The rationalization of <strong>the</strong> rail network, with abandonments and creations of short line or<br />
regional railroads decreasing costs while maintaining much of <strong>the</strong> original traffic.<br />
• The increase in trainload shipments.<br />
• The shifts to larger-capacity rail cars and technology innovations.<br />
The recent STB study of railroad rates from 1985 to 2007 (2009) found that “inflation-adjusted<br />
rates” increased from 2005 to 2007. The STB wrote: “This represents a significant change from prior<br />
years, given that inflation-adjusted rail rates declined in every year but one from 1985 through 2004.”<br />
The STB fur<strong>the</strong>r elaborated: “In fact, adjusting for <strong>the</strong> purchasing power of <strong>the</strong> dollar, shippers spent<br />
$7.8 billion more in 2007 than <strong>the</strong>y would have if <strong>the</strong> rate levels of 2004 had remained in place.”<br />
The STB rate study (2009) fur<strong>the</strong>r points out that well over half <strong>the</strong> increase in rail rates between<br />
2004 and 2007 could be attributed to higher fuel costs. Yet, even after consideration of fuel costs,<br />
railroad rates have been steadily increasing during <strong>the</strong> last few years (STB 2009).<br />
The Government Accountability Office (GAO) has reported that <strong>the</strong> percentage of traffic in<br />
tons traveling at rates above a revenue-to-variable cost ratio (R/VC) of 300, which is substantially<br />
above <strong>the</strong> statutory jurisdiction level of 180, has generally increased from 1985 through 2005 (GAO<br />
2007). The share of tonnage traveling at rates over 300% R/VC increased from 6.1% in 2004 to<br />
6.4% in 2005.<br />
This paper examines <strong>the</strong> R/VC for railroad grain and oilseed movements and railroad rates<br />
for grain and oilseed movements by shipment size and distance. Railroad fuel surcharges are also<br />
examined and found to exceed <strong>the</strong> growth in railroad fuel costs. Finally, railroad revenue adequacy<br />
is examined relative to railroad industry costs and merger premiums.<br />
62.4<br />
60.8<br />
58.6<br />
58.1<br />
58.8 57.2<br />
56.8<br />
65.5<br />
64.3<br />
60.8<br />
1985 1986 1987 1988 1989 1990 1991 1992 1993 1994 1995 1996 1997 1998 1999 2000 2001 2002 2003 2004 2005 2006 2007<br />
Year<br />
Source: STB, Study of Railroad Rates: 1985-2007<br />
59
Rail Rate and Revenue Changes<br />
RECENT RAIL RATE LEVELS<br />
This study calculated average R/VC ratios for grain and oilseed tariff rates by dividing <strong>the</strong> freight<br />
revenue field in <strong>the</strong> Confidential Waybill Sample by <strong>the</strong> variable cost field. The variable costs are<br />
calculated for <strong>the</strong> waybill sample by <strong>the</strong> STB using its Uniform Rail Costing System.<br />
Figure 3 shows a slight downward trend from 1988 to 1998 in <strong>the</strong> percent of grain and oilseed<br />
tonnage traveling above an R/VC of 300%. The increase in <strong>the</strong> percentage of tons moving at R/VC<br />
greater than 300% began in 1999 and peaked at 7.7% in 2002, <strong>the</strong>n decreased to 2.8% in 2006 and to<br />
2.4% in 2007. The vertical line in figures 3 and 4 denotes <strong>the</strong> lack of waybill data for 1992 and 1993.<br />
Figure 3: Percent of Grain and Oilseed Tons Moved at Tarriff Rates with R/VC Greater<br />
Than 300%<br />
Percent<br />
In some states, however, a much greater percentage of grain and oilseed tonnage moves at R/VC<br />
ratios greater than 300% (Figure 4). These states include Iowa, Montana, and North Dakota. The<br />
high percentage of rail rates exceeding a R/VC of 300% for Montana shippers from 1998 through<br />
2004 could be due to its distance from intermodal competition and <strong>the</strong> fact that one railroad handles<br />
95% of <strong>the</strong> rail movements of grain. However, rates and R/VC ratios for movements of agricultural<br />
commodities can differ from state to state for numerous reasons, and can change significantly from<br />
year to year as Figure 4 shows.<br />
The analysis of rail rates is limited to tariff rates since contract rates are confidential and<br />
unregulated. However, several limitations in Waybill Sample data mean that tariff rates should<br />
be used with some caution. Volume discounts and rebates for use of non-railroad equipment are<br />
not included in tariff rates. Fees for guaranteeing delivery of rail equipment on specific dates, or<br />
“certificates of transportation” payments, are not included. Also, in some instances contract rates<br />
can differ substantially from tariff rates, while in o<strong>the</strong>r instances <strong>the</strong>re can be little if any difference<br />
between contract and tariff rates. Thus, <strong>the</strong> use of Waybill Sample tariff data and costs for <strong>the</strong><br />
calculation of R/VC ratios can provide a misleading picture for some comparisons. While <strong>the</strong>se<br />
anomalies can distort <strong>the</strong> R/VC calculations for some comparisons, <strong>the</strong> results presented in <strong>the</strong> rate<br />
analysis for this study are thought to be generally representative of rate trends over <strong>the</strong> period.<br />
Agriculture Rates are Higher Than Those of O<strong>the</strong>r Commodities<br />
The GAO found that “although rates have declined since 1985, <strong>the</strong>y have not done so uniformly, and<br />
rates for some commodities are significantly higher than rates for o<strong>the</strong>rs” (GAO 2006) (Figure 5).<br />
Specifically, GAO found that “grain rates declined from 1985 through 1987, but <strong>the</strong>n diverged from<br />
<strong>the</strong> o<strong>the</strong>r commodity trends and increased, resulting in a net 9% increase by 2004.” In 2005, rates<br />
60<br />
10<br />
9<br />
8<br />
7<br />
6<br />
5<br />
4<br />
3<br />
2<br />
1<br />
0<br />
3.7<br />
1988<br />
2.6 2.6 3.0 3.5 2.9 2.1 2.5 2.5<br />
1989<br />
1990<br />
1991<br />
1994<br />
1995<br />
1996<br />
Source: USDA analysis of STB Waybill Sample<br />
1997<br />
1998<br />
Year<br />
5.8 5.4<br />
1999<br />
2000<br />
6.9 7.7 7.6 6.7<br />
2001<br />
2002<br />
2003<br />
2004<br />
4.7<br />
2005<br />
2.8 2.4<br />
2006<br />
2007
JTRF Volume 50 No. 1, Spring 2011<br />
Figure 4: Selected States with Higher Percentages of Grain and Oilseeds Moving at R/VC<br />
Over 300%<br />
Percentage<br />
50<br />
45<br />
40<br />
35<br />
30<br />
25<br />
20<br />
15<br />
10<br />
5<br />
0<br />
1988<br />
1989<br />
1990<br />
1991<br />
1994<br />
for all commodities increased by 9% over 2004 rates, <strong>the</strong> largest annual increase in 20 years. Rail<br />
rates for grain increased 8.5% over 2004 (GAO 2007).<br />
According to <strong>the</strong> AAR Freight Commodity Statistics, agricultural rates not only are higher than<br />
those of o<strong>the</strong>r commodities, but also have increased more rapidly (see Figure 6). For instance, rail<br />
rates for grain and oilseeds increased to $2,809 per carload in 2008, up 73% from 2003; rates for<br />
all o<strong>the</strong>r commodities increased to $1,556 per carload, up 50%. In addition, grain and oilseed rates<br />
during 2008 were 81% higher than those paid by all o<strong>the</strong>r commodities, compared with 55% higher<br />
in 1998. The average number of grain and oilseed tons per carload increased 2.2%, from 97.6 tons<br />
per carload in 1998 to 99.7 tons per carload in 2008.<br />
Comparison of Rates by Shipment Size and Distance Shipped<br />
1995<br />
1996<br />
Source: USDA analysis of STB Waybill Sample<br />
1997<br />
1998<br />
The STB waybill sample allows specific analysis of grains and oilseeds, which is presented in detail<br />
in this section. This study did not have access to <strong>the</strong> unmasked confidential waybill data, which report<br />
<strong>the</strong> unmasked rail rates for contract movements as well as for tariff movements. Consequently, only<br />
tariff rail rates are analyzed in this section. In addition, samples with fewer than 30 observations are<br />
not included in <strong>the</strong> figures to increase <strong>the</strong> statistical reliability of <strong>the</strong> analysis. The vertical lines in<br />
figures 7 and 8 denote <strong>the</strong> lack of waybill data for 1992 and 1993.<br />
The rates for grain and oilseeds reflect a significant advantage for large trainload shipments.<br />
As can be seen in Figure 7, rates for all shipment sizes have risen steadily and rapidly since 2003.<br />
The rates for <strong>the</strong> smallest shipment size have increased 21% since 2003, compared with 25 and<br />
23%, respectively, for 6–49 car and 50+ car shipments, keeping <strong>the</strong> relative relationships between<br />
shipment size categories about <strong>the</strong> same over <strong>the</strong> last five years analyzed. However, since 1988,<br />
<strong>the</strong> rates for <strong>the</strong> smallest shipment sizes have increased by only 13%, while <strong>the</strong> rates for 6–49 car<br />
shipments and 50+ car shipments have increased by 40% and 43%, respectively. This shows that<br />
<strong>the</strong> rates for larger sized shipments have increased relatively more than for smaller shipments over<br />
<strong>the</strong> entire period.<br />
Rates for large shipments are nearly 2.1 cents per ton-mile, contrasted with about 3.0 cents for<br />
smaller movements. Rates for large shipments are about one cent or 33% lower than <strong>the</strong> smallest<br />
1999<br />
2000<br />
2001<br />
2002<br />
2003<br />
2004<br />
2005<br />
2006<br />
Iowa Montana North Dakota<br />
2007<br />
61
Rail Rate and Revenue Changes<br />
Figure 5: Rate Changes for Coal, Grain, Mixed Shipments, and Motor Vehicles, 1985–2005<br />
Source: GAO analysis of STB data<br />
Figure 6: Railroad Average Freight, Revenue per Carload<br />
Dollars per carload<br />
62<br />
3,300<br />
2,800<br />
2,300<br />
1,800<br />
1,300<br />
1,559<br />
Grain and oilseeds up 73%; 2008 over 2003;<br />
All o<strong>the</strong>r commodities up 50%; 2008 over 2003.<br />
1,613 1,615 1,608 1,609<br />
1,624<br />
1,786<br />
1,004 1,008 1,017 1,028 1,030 1,039 1,078<br />
2,063<br />
1,171 1,281<br />
2,251 2,369<br />
2,809<br />
1,362 1,556<br />
800<br />
1998 1999 2000 2001 2002 2003 2004 2005 2006 2007 2008<br />
All o<strong>the</strong>r commodities Grain and oilseeds<br />
Source: Association of American Railroads, Freight Commodity Statistics
0.035<br />
0.030<br />
0.025<br />
0.020<br />
0.015<br />
0.010<br />
JTRF Volume 50 No. 1, Spring 2011<br />
Figure 7: Grain and Oilseeds Tariff Revenue (Current $) Per Ton-mile by Shipment Size<br />
Dollars per ton-mile<br />
Source: STB Waybill Samples<br />
1988<br />
1989<br />
1990<br />
1991<br />
1994<br />
1995<br />
1996<br />
1997<br />
1998<br />
1999<br />
2000<br />
2001<br />
2002<br />
2003<br />
2004<br />
2005<br />
2006<br />
2007<br />
1-5 cars 6-49 cars 50+ cars<br />
shipment size. In 1988, though, large shipments were 46% less than small shipments. The discount<br />
for medium-size shipments relative to small shipments has decreased substantially—from 23% in<br />
1988 to only 5% in 2007.<br />
A similar situation holds for shorter distance movements, in which rates are consistently about<br />
double <strong>the</strong> rates for movements over 751 miles in length—4.6 cents versus 2.15 cents per tonmile<br />
in 2007. Rates for short hauls started increasing in 2000, but longer hauls didn’t have sharp<br />
increases until <strong>the</strong> last four years (see Figure 8).<br />
Figure 8: Grain and Oilseeds Tariff Revenue (Current $) Per Ton-mile by Shipment Distance<br />
Dollars per ton-mile<br />
0.050<br />
0.045<br />
0.040<br />
0.035<br />
0.030<br />
0.025<br />
0.020<br />
0.015<br />
Source: STB Waybill Samples<br />
20-500 miles 501-750 miles 750+ miles<br />
63
Rail Rate and Revenue Changes<br />
This detailed examination of <strong>the</strong> grain and oilseeds commodity group shows <strong>the</strong> effect of<br />
distance on railroad rates. As railroads seek to increase <strong>the</strong> usage and revenue generation of <strong>the</strong>ir<br />
rolling stock, it is often in <strong>the</strong>ir best interest to give price/rate incentives to shippers with long hauls.<br />
Also, <strong>the</strong> cost disadvantages in equipment utilization make <strong>the</strong> short hauls more expensive for <strong>the</strong><br />
carriers.<br />
It is widely acknowledged that railroads have used trainload or multiple car rates to encourage<br />
shippers to consolidate shipments, <strong>the</strong>reby increasing <strong>the</strong> efficiency of <strong>the</strong> capital stock, power, and<br />
labor. The analyses above demonstrate that <strong>the</strong> longer <strong>the</strong> movement, <strong>the</strong> lower <strong>the</strong> rate charged by<br />
<strong>the</strong> railroads. However, <strong>the</strong> analysis does not consider <strong>the</strong> costs that have been shifted to <strong>the</strong> shipper<br />
so <strong>the</strong>y could access <strong>the</strong>se rates.<br />
TRANSFER OF RAILROAD COSTS TO SHIPPERS<br />
Rail rates have decreased since deregulation in <strong>the</strong> early 1980s. Inflation-adjusted rates have<br />
decreased by slightly over 30% since 1985. However, a broad and consistent increase in rail rates<br />
over at least <strong>the</strong> last four years—and for some commodities <strong>the</strong> last seven years—indicates <strong>the</strong><br />
railroads have used rates to achieve profit levels previously unseen in <strong>the</strong> industry.<br />
Moreover, <strong>the</strong> overall decrease in revenue per ton-mile for railroads does not reflect <strong>the</strong> actual<br />
impact on shippers. The logistical cost to shippers, and to <strong>the</strong> public, has increased over that time.<br />
The Christensen study defined cost-shifting as additional costs incurred by shippers as a<br />
result of changes in railroad operations. Examples of cost-shifting identified in that study include<br />
(Christensen 2008):<br />
• A shift in railcar ownership and its associated expenses, such as maintenance and<br />
insurance, from railroads to shippers or o<strong>the</strong>r private firms.<br />
• Increased railcar maintenance standards being required by railroads as necessary to<br />
maintain service and capacity.<br />
• Increases in and additions to accessorial charges, such as finance charges, charges for<br />
faxing versus electronic transmission, higher demurrage charges, private car storage<br />
charges, and car cleaning charges.<br />
• Deterioration in railroad service, causing <strong>the</strong> increased use of shipper labor to monitor<br />
railroad performance or to unload railcars.<br />
• The use of trucking to transport goods to distant terminals to access multiple-car rates.<br />
• Increased highway congestion and maintenance because of <strong>the</strong> increased use of trucking.<br />
The average rate per ton-mile has decreased, in part, because all shippers, and especially grain<br />
shippers, are assuming greater responsibility for car supply and o<strong>the</strong>r functions that railroads have<br />
traditionally provided. Many shippers, in times of short railcar supply, use guaranteed rail-ordering<br />
systems, paying fees in addition to tariff rates to guarantee car delivery within a specified time<br />
period ra<strong>the</strong>r than risking a delay in receiving railcars on a first-come-first-served basis (Prater and<br />
Klindworth 2000).<br />
The attractiveness of unit and shuttle trains due to <strong>the</strong> railroad’s rate structure has caused<br />
shippers to invest in sidings, inventory, storage capacity, and loading facilities to access <strong>the</strong>se more<br />
cost-effective rail services. Shippers note that, after investing in equipment to handle 50–54-rail-car<br />
shipments, <strong>the</strong> railroads have changed some rate structures to emphasize 100–110-car shipments,<br />
requiring fur<strong>the</strong>r investments.<br />
The costs of railcar ownership have shifted from railroads to shippers, adding fur<strong>the</strong>r to costs<br />
not reflected in tariff rates. As can be seen in Figure 9, private ownership has been <strong>the</strong> source, in<br />
a steady increase, of new covered hopper railcar capacity. In 1981, private ownership accounted<br />
for 41% of <strong>the</strong> total covered hopper cars, with <strong>the</strong> Class I railroads providing 56% and <strong>the</strong> smaller<br />
railroads contributing 3% of <strong>the</strong> capacity (AAR, Railroad Equipment Report 1982). By 2008,<br />
hopper car ownership was 70% private, 26% Class I railroad, and 4% smaller railroads (AAR,<br />
Railroad Equipment Report 2008). Ano<strong>the</strong>r way of looking at rail car ownership is to see that from<br />
64
Figure 9: U.S. Covered Hopper Fleet Ownership, 1982–2008<br />
Cars<br />
500,000<br />
400,000<br />
300,000<br />
200,000<br />
100,000<br />
0<br />
1982<br />
1984<br />
1986<br />
1988<br />
Source: AAR, Railroad Equipment Report<br />
JTRF Volume 50 No. 1, Spring 2011<br />
1981 to 2008 privately owned cars increased from 128,394 to 290,176, or 126%, as Class I railroads<br />
decreased <strong>the</strong>ir ownership by 37% (AAR, Railroad Equipment Report 1982-2008). The costs of car<br />
ownership have been shifted to <strong>the</strong> shippers or <strong>the</strong>ir agents.<br />
Fuel Surcharges Versus Fuel Prices<br />
1990<br />
1992<br />
1994<br />
Rates per-ton-mile decreased from <strong>the</strong> time of deregulation until around 2002. Over <strong>the</strong> last four<br />
years <strong>the</strong>se rates have significantly increased. Recently, railroad fuel charges have added to <strong>the</strong><br />
shipper’s cost burden. These surcharges are designed to allow railroad firms to recover from shippers<br />
<strong>the</strong> impact on costs caused by abnormally high fuel prices. Basic fuel charges have always been<br />
included in rail rate determination, but <strong>the</strong> recent spikes and variation in fuel prices caused railroads<br />
to search for ways of recapturing <strong>the</strong>se costs in <strong>the</strong> near term.<br />
The fuel cost increases were first estimated as a percentage of tariff rates, but shippers felt<br />
any errors in estimation were on <strong>the</strong> side of <strong>the</strong> railroad carrier. As fuel prices and <strong>the</strong> attendant<br />
fuel surcharges were implemented, shippers felt that carriers were using <strong>the</strong>se surcharges as profit<br />
centers, whe<strong>the</strong>r <strong>the</strong> fuel costs were going up or down. They also believed that rate-based fuel<br />
surcharges did not fairly apportion <strong>the</strong> additional cost of <strong>the</strong> fuel among shippers. Subsequent to a<br />
regulatory proceeding on rail fuel surcharges, <strong>the</strong> STB (STB 2007) on January 25, 2007, ruled that:<br />
• Computing rail fuel surcharges as a percentage of a base rate is an unreasonable business<br />
practice because rail rates do not accurately reflect <strong>the</strong> additional cost of fuel used in<br />
individual movements. The STB reasoned that a rate-based fuel surcharge would result in<br />
shippers who pay higher rail rates also paying higher fuel surcharges.<br />
• The fact that a railroad may not be able to recover its increased fuel costs from some of<br />
its traffic does not provide a reasonable basis for shifting those costs onto o<strong>the</strong>r traffic.<br />
• Railroads are prohibited from “double dipping”—charging a fuel surcharge in addition to<br />
increasing rates using an index that includes fuel costs as a component.<br />
• Railroads operating in <strong>the</strong> United States had until April 26, 2007, to change <strong>the</strong>ir fuel<br />
surcharge programs to comply with <strong>the</strong> STB ruling.<br />
When examining <strong>the</strong> performance of fuel surcharges in recovering fuel cost increases, wide<br />
differences among fuel surcharge rates cause concern about <strong>the</strong> accuracy of surcharge formulas.<br />
For instance, during September 2008, when surcharges peaked, <strong>the</strong>y varied among railroads from<br />
1996<br />
1998<br />
2000<br />
2002<br />
2004<br />
Total Hoppers Private Owned<br />
Class I Railroad Small Railroad<br />
2006<br />
2008<br />
65
Rail Rate and Revenue Changes<br />
Figure 10: Growth in Railroad Grain Fuel Surcharges v. Growth in Railroad Fuel<br />
Costs by Quarter<br />
750<br />
650.77<br />
650<br />
1<br />
46.58 cents to 87 cents per car mile, a difference of nearly 87%. The weighted average surcharge<br />
was 59 cents per car mile or $590 per car moving 1,000 miles.<br />
Shippers contend that fuel surcharges should reimburse railroads for only <strong>the</strong> incremental<br />
increase in fuel costs and not <strong>the</strong> base, since <strong>the</strong> base fuel costs are already in <strong>the</strong> rate. The average<br />
growth in fuel surcharge per grain carload during <strong>the</strong> 3 rd quarter of 2008 was $650.77, contrasted to<br />
<strong>the</strong> growth in railroad fuel costs from 2001 until <strong>the</strong> 3 rd quarter of 2008 of $286.46, a difference of<br />
127% over <strong>the</strong> incremental increase in <strong>the</strong> cost of fuel (see Figure 10).<br />
Figure 11 shows that <strong>the</strong> percentage by which <strong>the</strong> growth in grain fuel surcharges exceed <strong>the</strong><br />
growth in railroad fuel costs since 2004 ranges from -30% to 163%. Note that <strong>the</strong> percentage growth<br />
in grain fuel surcharges exceeds <strong>the</strong> growth in railroad fuel costs in all but two quarters. Fur<strong>the</strong>rmore,<br />
as fuel costs increase, <strong>the</strong> difference between <strong>the</strong> quarterly growth in grain fuel surcharges and <strong>the</strong><br />
growth in railroad fuel costs tends to increase. This correlation is not perfect mainly because fuel<br />
surcharges lag fuel cost increases by two months.<br />
RAILROAD REVENUE ADEQUACY<br />
An evaluation of railroad rate reasonableness requires consideration of both <strong>the</strong> relative profitability<br />
and costs of railroads. Such an evaluation must also consider merger premiums 4 and how <strong>the</strong>y relate<br />
to STB revenue adequacy measures 5 , as well as <strong>the</strong> revenue adequacy and profitability of Class I<br />
railroads over time.<br />
66<br />
$ per carload<br />
550<br />
450<br />
350<br />
250<br />
150<br />
50<br />
(50)<br />
4Q '01<br />
2Q '02<br />
4Q '02<br />
2Q '03<br />
4Q '03<br />
2Q '04<br />
4Q '04<br />
2Q '05<br />
4Q '05<br />
2Q '06<br />
4Q '06<br />
2Q '07<br />
4Q '07<br />
2Q '08<br />
286.46<br />
4Q '08<br />
Growth in Grain Fuel Surcharges (since Qtr. 4, 2001)<br />
Growth in Rail Fuel Costs (Since Qtr. 4, 2001)<br />
1 For <strong>the</strong> 7 Class I railroads operating in <strong>the</strong> United States. Weighted average fuel surcharges per carload<br />
were estimated by multiplying <strong>the</strong> average length of haul for grain by <strong>the</strong> quarterly weighted average fuel<br />
surcharge per carload mile. Weighted average fuel surcharge per carload mile prior to 2Q ’06 was estimated<br />
using mileage-based fuel surcharge formulas for individual railroads.<br />
Source: Class I Railroad quarterly filings to <strong>the</strong> Security and Exchange Commission.<br />
AAR, The Rail <strong>Transportation</strong> of Grain (2009).<br />
2Q '09<br />
4Q '09
Figure 11: Percentage Growth in Grain Fuel Surcharges Exceed Growth<br />
in Railroad Fuel Costs<br />
200%<br />
150%<br />
100%<br />
50%<br />
0%<br />
-50%<br />
Merger Premiums and STB Revenue Adequacy<br />
JTRF Volume 50 No. 1, Spring 2011<br />
1Q '04<br />
2Q '04<br />
3Q '04<br />
4Q '04<br />
1Q '05<br />
2Q '05<br />
3Q '05<br />
4Q '05<br />
1Q '06<br />
2Q '06<br />
3Q '06<br />
4Q '06<br />
1Q '07<br />
2Q '07<br />
3Q '07<br />
4Q '07<br />
1Q '08<br />
2Q '08<br />
3Q '08<br />
4Q '08<br />
1Q '09<br />
2Q '09<br />
3Q '09<br />
4Q '09<br />
Source: Class I Railroad quarterly filings to <strong>the</strong> Security and Exchange Commission.<br />
AAR, The Rail <strong>Transportation</strong> of Grain (2009).<br />
The STB annually measures <strong>the</strong> revenue earned from <strong>the</strong> rate structure against <strong>the</strong> adequacy of that<br />
revenue stream to infuse capital into <strong>the</strong> industry. To determine <strong>the</strong> annual revenue adequacy, <strong>the</strong><br />
carrier’s return on net investment (ROI) is compared with <strong>the</strong> rail industry’s after-tax cost of capital<br />
for that year. If ROI is greater than <strong>the</strong> cost of capital, revenue is determined to be adequate.<br />
ROI is normally determined by dividing net income from railroad operations by <strong>the</strong> depreciated<br />
original cost, or book value, of <strong>the</strong> railroads’ assets. This ROI is <strong>the</strong>n compared with <strong>the</strong> railroad<br />
industry cost of capital. The STB seeks to ensure that a railroad has <strong>the</strong> capability to invest in its<br />
infrastructure and provide a reasonable return to its investors.<br />
The costs to be included in determining <strong>the</strong> critical ROI have been examined in various<br />
proceedings and shipper testimonies. If <strong>the</strong> depreciated book value, or original cost, is increased,<br />
<strong>the</strong>n calculated ROI decreases and revenue adequacy is negatively affected, allowing railroads to<br />
charge higher rates. In addition, <strong>the</strong> STB’s Uniform Rail Costing System uses <strong>the</strong>se higher cost<br />
values in <strong>the</strong> calculation of variable costs, <strong>the</strong>reby driving down <strong>the</strong> R/VC calculations for <strong>the</strong><br />
railroad’s movements.<br />
Shippers and shipper representatives have become concerned about <strong>the</strong> premiums being paid<br />
to newly formed railroads when a merger is granted. The ICC/STB has been consistent in allowing<br />
such premiums, usually above <strong>the</strong> current stock or book price prior to <strong>the</strong> merger, to be included<br />
in <strong>the</strong> depreciated cost figure. Shippers have argued that railroads should not be allowed to pay<br />
acquisition premiums if <strong>the</strong>se costs are <strong>the</strong>n used to decrease <strong>the</strong> railroad firm ROI, which is used<br />
for revenue adequacy determination. This can result in <strong>the</strong> railroads being allowed to charge higher<br />
rates than would have been possible if <strong>the</strong> premiums had not been paid, resulting in economic<br />
impact and harm to <strong>the</strong> shippers.<br />
The extent of <strong>the</strong>se premiums is difficult to determine, but some information is available.<br />
Recent mergers have involved significant premiums paid by <strong>the</strong> merging railroads. These estimated<br />
premiums range from $1.4 billion for <strong>the</strong> Union Pacific (UP) purchase of Chicago Northwestern<br />
in 1996 to $2.7 billion for <strong>the</strong> Atchison, Topeka, & Santa Fe merger with Burlington Nor<strong>the</strong>rn in<br />
1995, and $3.7 billion for UP’s purchase of Sou<strong>the</strong>rn Pacific in 1996. Consultants estimate that <strong>the</strong><br />
premium paid for Conrail by Norfolk Sou<strong>the</strong>rn and CSX <strong>Transportation</strong> was about $6.9 billion.<br />
O<strong>the</strong>r estimates also have been generated, but <strong>the</strong> relevant point is that <strong>the</strong>se premiums, if added to<br />
<strong>the</strong> book value of <strong>the</strong> merger, affect <strong>the</strong> ROI value used for revenue adequacy purposes.<br />
67
Rail Rate and Revenue Changes<br />
The railroad industry and <strong>the</strong> STB are <strong>the</strong> only industry and regulator that use book value for<br />
determining ROI and add merger premiums into <strong>the</strong> rate base. For example, <strong>the</strong> Federal Energy<br />
Regulatory Commission will not allow regulated entities to pass through to <strong>the</strong> customer acquisition<br />
or merger premiums unless <strong>the</strong> effect of <strong>the</strong> transaction has a net benefit (typically, a rate reduction)<br />
to <strong>the</strong> customers of <strong>the</strong> acquired entity. The net result is that this approach discourages <strong>the</strong> payment<br />
of large premiums because <strong>the</strong>y are not likely to be permitted to be passed through to customers.<br />
The net effect of merger premiums, which increase both variable and fixed costs of <strong>the</strong> railroads,<br />
is that some rates that would have been above 180% of variable costs might no longer meet that<br />
criterion and would no longer be subject to STB regulation.<br />
A contrasting opinion on <strong>the</strong> ROI calculation is offered by <strong>the</strong> railroad industry and <strong>the</strong><br />
AAR. The railroads, through <strong>the</strong> AAR, have argued that <strong>the</strong> ROI calculation should be based not<br />
on depreciated value but on <strong>the</strong> replacement cost of <strong>the</strong> rail assets used to provide transportation.<br />
Merger premiums also could reflect <strong>the</strong> net present value of <strong>the</strong> merger in expected cost savings to<br />
<strong>the</strong> combined firm.<br />
STB Measures of Rail Revenue Adequacy<br />
Class I railroad revenue adequacy is determined by comparing <strong>the</strong> ROI with <strong>the</strong> cost of capital. The<br />
STB determines <strong>the</strong> cost of capital for each year and determines which Class I railroads are revenue<br />
adequate. The STB used a simple discounted cash flow (DCF) method to determine <strong>the</strong> industry’s<br />
weighted average cost of capital through 2005. After shippers requested public hearings to examine<br />
<strong>the</strong> methodology, <strong>the</strong> STB <strong>the</strong>n changed to a capital asset pricing model (CAPM) for <strong>the</strong> years 2006<br />
and 2007. After ano<strong>the</strong>r public hearing, STB decided to use a simple average of CAPM and a multistage<br />
discounted cash flow model (MSDCF) in 2008 and beyond.<br />
Since <strong>the</strong> Staggers Act, <strong>the</strong> ROI for <strong>the</strong> railroad industry has increased from an average of 2.5%<br />
during <strong>the</strong> 1970s to an average of 10.25% from 2006 through 2008 (AAR, Railroad Facts).<br />
Based upon <strong>the</strong> CAPM methodology, Figure 12 shows that <strong>the</strong> Class I railroads have been<br />
revenue adequate during 2005 and 2006 and nearly revenue adequate for <strong>the</strong> o<strong>the</strong>r years since<br />
2002. In contrast, <strong>the</strong> Christensen (2008) study, which used return on equity, found that <strong>the</strong> Class I<br />
railroads could be considered revenue adequate since 2001.<br />
Figure 12: Class I Railroad Cost of Capital and Return on Net Investment, 1997–2008<br />
Percent<br />
68<br />
14<br />
12<br />
10<br />
8<br />
6<br />
4<br />
2<br />
0<br />
1997<br />
1998<br />
1999<br />
2000<br />
2001<br />
2002<br />
DCF CAPM ROI CAPM + MSDCF<br />
Sources: AAR Railroad Facts; Surface <strong>Transportation</strong> Board<br />
2003<br />
2004<br />
2005<br />
2006<br />
2007<br />
2008
Financial Measures of Railroad Profitability<br />
JTRF Volume 50 No. 1, Spring 2011<br />
Whe<strong>the</strong>r measured by commonly used financial measures or by STB-determined revenue adequacy<br />
standards, <strong>the</strong> profitability of <strong>the</strong> railroad industry has improved considerably since deregulation.<br />
The Christensen (2008) study used various measures of profitability to compare <strong>the</strong> railroad industry<br />
with o<strong>the</strong>r industries and with <strong>the</strong> Standard & Poor’s 500. Since 2004, railroad profitability was<br />
found to be comparable to that of most o<strong>the</strong>r industries (Christensen 2008).<br />
The rapid increase in rail rates since 2004 contributed to <strong>the</strong> surge in railroad profitability at that<br />
time. The increase in rail rates is <strong>the</strong> result of aggressive pricing as rail capacity constraints appeared<br />
and <strong>the</strong> over-recovery of fuel costs. The higher rail rates also reflect higher rail costs since 2004<br />
(Figure 13).<br />
Railroad financial measures of profitability increased at a moderate rate through 2004, and<br />
<strong>the</strong>n surged from 2005 through 2007. Net income, earnings before interest and taxes (EBIT),<br />
and earnings before interest, taxes, depreciation, and amortization (EBITDA) are commonly used<br />
financial measures of profitability. Net income, EBIT, and EBITDA changed 2%, -5%, and 5%,<br />
respectively, over <strong>the</strong> six-year period from 1998 to 2004. Over <strong>the</strong> four-year period from 2004 to<br />
2008, net profit, EBIT, and EBITDA increased 183%, 152%, and 102%, respectively.<br />
Figure 13: Class I Railroad Profitability<br />
Billion $<br />
20<br />
18<br />
16<br />
14<br />
12<br />
10<br />
8<br />
6<br />
4<br />
2<br />
0<br />
1998 1999 2000 2001 2002 2003 2004 2005 2006 2007 2008<br />
Sources: AAR, Analysis of Class I Railroads<br />
Factors Affecting Railroad Industry Costs<br />
Net income EBIT EBITDA<br />
Several factors affecting railroad costs are often overlooked when analyzing those costs. Railroad<br />
management decisions affect some of <strong>the</strong>se factors, which include merger premiums, size of<br />
operation, traffic density, <strong>the</strong> amount invested in capacity, and successful integration of operations<br />
during mergers. O<strong>the</strong>r factors, such as unusually high fuel costs and extreme wea<strong>the</strong>r events, are<br />
factors that railroad management are unable to control.<br />
As discussed in an earlier section, merger premiums can add substantially to <strong>the</strong> average fixed<br />
and variable costs 6 of <strong>the</strong> new railroad firm. The effects of <strong>the</strong>se mergers, including increased<br />
costs due to merger implementation difficulties, are visible in Figure 14, showing average railroad<br />
industry costs. Variable costs for <strong>the</strong> railroad industry increased from 1997 through 2000 and fixed<br />
costs increased from 1995 through 1997.<br />
69
Rail Rate and Revenue Changes<br />
Figure 14: Railroad Industry Average Cost, Variable Cost, and Fixed Cost in Dollars<br />
Per Ton-mile (adjusted for inflation in 2000 dollars)<br />
Source: Laurits Christensen Associates (2008)<br />
Variable and total costs for <strong>the</strong> merged railroads increased after each of <strong>the</strong>se major rail mergers<br />
or acquisitions:<br />
• The merger of <strong>the</strong> Atchison, Topeka, & Santa Fe with <strong>the</strong> Burlington Nor<strong>the</strong>rn<br />
(September 1995)<br />
• The Union Pacific with <strong>the</strong> Sou<strong>the</strong>rn Pacific (implemented December 1996)<br />
• The split of Conrail between CSXT and Norfolk Sou<strong>the</strong>rn (June 1999)<br />
In each of <strong>the</strong>se mergers, <strong>the</strong> railroads had difficulties merging operating systems and lines,<br />
resulting in congestion that drove up average total and variable costs for <strong>the</strong> merging railroads.<br />
A recent study of railroad cost curves concluded that <strong>the</strong> four largest Class I railroads, BNSF,<br />
CSXT, NS, and UP, may have surpassed <strong>the</strong> optimal size of operation and may be experiencing<br />
diseconomies of scale (Bereskin 2008). This means that <strong>the</strong> average costs for those railroads are<br />
higher than <strong>the</strong>y would be if <strong>the</strong> firms were smaller. Based upon 2005 data, <strong>the</strong> optimal size of a<br />
railroad was estimated to be slightly less than 21,000 route miles. BNSF and UP operate more than<br />
32,000 route miles, while CSXT and NS operate more than 21,000 route miles. The three smaller<br />
Class I railroads, Kansas City Sou<strong>the</strong>rn, Canadian National, and Canadian Pacific, all appear to be<br />
operating with constant or increasing returns to scale.<br />
Excess traffic density on <strong>the</strong> railroad also affects railroad average costs by slowing train speeds<br />
and increasing terminal dwell times. The slower train speeds and reduced terminal efficiency fur<strong>the</strong>r<br />
reduce <strong>the</strong> effective capacity of <strong>the</strong> railroad, compounding <strong>the</strong> problem. When a railroad has excess<br />
capacity, fixed costs are higher than necessary. As railroads near capacity and capacity constraints<br />
appear, variable costs increase. The effects of railroad capacity constraints, beginning in 2005, are<br />
also visible in <strong>the</strong> above figure, which shows average railroad industry costs.<br />
Ano<strong>the</strong>r factor affecting average railroad fixed and variable costs is <strong>the</strong> amount <strong>the</strong> railroad<br />
industry invests in rail capacity. From 2004 through 2006, <strong>the</strong> railroad industry invested heavily<br />
70<br />
$0.035<br />
$0.030<br />
$0.025<br />
$0.020<br />
$0.015<br />
$0.010<br />
$0.005<br />
$0.000<br />
1987 1988 1989 1990 1991 1992 1993 1994 1995 1996 1997 1998 1999 2000 2001 2002 2003 2004 2005 2006<br />
ATC AVC AFC
JTRF Volume 50 No. 1, Spring 2011<br />
in capacity, which is shown in <strong>the</strong> average cost data in Figure 14 as increased fixed costs for <strong>the</strong><br />
industry after 2004. As capacity bottlenecks are removed, however, variable costs should be reduced<br />
by <strong>the</strong>se investments.<br />
Unusually high fuel costs occurred from 2004, peaking in September of 2008. Fuel is a major<br />
component of railroad costs, so high fuel costs result in increased operating costs. This can be seen<br />
in <strong>the</strong> figure above, where high fuel costs and capacity constraints resulted in increasing variable<br />
costs in 2005 and 2006.<br />
Extreme wea<strong>the</strong>r events can also increase railroad industry costs by adding <strong>the</strong> costs of repair<br />
and rerouting traffic. For instance, Hurricanes Katrina and Rita resulted in substantial damage to <strong>the</strong><br />
rail network in Louisiana and Mississippi. Damages to <strong>the</strong> CSX coastal line, which had <strong>the</strong> most<br />
damage, required nearly $250 million to repair (CSX <strong>Transportation</strong> 2006). Likewise, a massive<br />
mudslide on <strong>the</strong> UP line between Klamath Falls and Eugene, OR, swept track, ties, and ballast<br />
halfway down <strong>the</strong> mountain and buried over 3,000 feet of mainline track in 20 feet of mud, snow,<br />
and downed trees (Union Pacific Railroad 2008).<br />
Railroad Industry Revenue Compared to Marginal Costs<br />
Railroad industry revenue per ton-mile decreased slowly through 1996, rose slowly through 2004,<br />
and <strong>the</strong>n increased rapidly in 2005 and 2006. Marginal costs (i.e., <strong>the</strong> addition to total cost attributable<br />
to <strong>the</strong> addition of one ton-mile) increased in 2005 and 2006, probably due to rail congestion as<br />
capacity constraints in <strong>the</strong> rail network and higher fuel costs drove marginal costs up (see Figure<br />
15). Average revenue increased more rapidly than marginal costs in 2005 and 2006, indicating<br />
aggressive pricing due to capacity constraints and over recovery of fuel costs.<br />
Figure 15: Railroad Industry Average Revenue Per Ton-mile and Marginal Costs<br />
$0.035<br />
$0.030<br />
$0.025<br />
$0.020<br />
$0.015<br />
$0.010<br />
$0.005<br />
$0.000<br />
19871988 1989 1990 1991 19921993 19941995 1996 19971998 1999 2000 2001 2002 2003 20042005 2006<br />
RPTM MC<br />
Source: Laurits Christensen Associates (2008)<br />
71
Rail Rate and Revenue Changes<br />
SUMMARY<br />
In both <strong>the</strong> short and long run, farmers cannot individually raise <strong>the</strong> prices of <strong>the</strong>ir commodities to<br />
reflect rising costs, so any increase in costs reduces <strong>the</strong>ir individual profit. Agricultural producers<br />
are unique in that <strong>the</strong>y bear <strong>the</strong> transportation costs when grain is transported; in <strong>the</strong> short run <strong>the</strong><br />
price <strong>the</strong> producer receives from <strong>the</strong> elevator is net of transportation costs. Consequently, increases<br />
in transportation costs result in decreased producer profit.<br />
Rail rates need to be sufficient to provide railroads with sufficient profit to maintain <strong>the</strong>ir<br />
equipment and lines, provide reliable service, invest in needed capacity, and provide a reasonable<br />
return on investment. However, unnecessarily high rail rates can damage <strong>the</strong> economic health of<br />
<strong>the</strong> farming sector and rural communities, and also make it more difficult for America to compete<br />
in export markets.<br />
The costs of rail transportation to market are important to agricultural producers because<br />
<strong>the</strong>y represent a significant percentage of <strong>the</strong> average on-farm price; grain and oilseeds are bulk<br />
commodities with a low value in proportion to <strong>the</strong>ir weight. Average rail tariff rates as a percent of<br />
<strong>the</strong> farm price of wheat have varied from 11.3% in 2007, when wheat prices were high, to 23.1% in<br />
1999, when wheat prices were low.<br />
Agricultural producers have become more concerned with rail rates as rail mergers and line<br />
abandonments after implementation of <strong>the</strong> Staggers Act, with its limited regulation of rates, have<br />
led to less intramodal competition.<br />
This study reported an increase in <strong>the</strong> percentage of tons moving at R/VC greater than 300%<br />
that began in 1999, peaked in 2002, and decreased until 2007. In Iowa, Montana, and North Dakota,<br />
however, a much greater percentage of grain and oilseed tonnage moved at R/VC ratios greater than<br />
300%. The high percentage of rail rates exceeding an R/VC of 300% for Montana shippers from<br />
1998 through 2004 could be due to its distance from intermodal competition and <strong>the</strong> fact that one<br />
railroad handles 95% of <strong>the</strong> rail movements of grain.<br />
Not only are rail rates for agricultural products higher than those for o<strong>the</strong>r commodities, but <strong>the</strong><br />
rates have increased more rapidly from 2004 to 2008. Rail rates for grain and oilseeds increased to<br />
$2,809 per carload in 2008, up 73% from 2003; rates for all o<strong>the</strong>r commodities increased to $1,556<br />
per carload, up 50%.<br />
Railroad rate structures favor large movements due to cost and operational efficiencies. There is<br />
a significant rate advantage for <strong>the</strong> largest trainload shipments of grain and oilseeds. Rates are 30%<br />
lower for shipments of more than 50 cars; rates for large shipments are about 2.1 cents per ton-mile,<br />
contrasted to about 3.0 cents for smaller movements. The rates for larger sized shipments have<br />
increased relatively more than for smaller shipments over <strong>the</strong> entire period, thus, factors o<strong>the</strong>r than<br />
cost efficiencies may be driving <strong>the</strong> rate changes.<br />
Rates for long hauls have a similar structure; movements less than 500 miles are about twice <strong>the</strong><br />
rates for movements over 751 miles, 4.6 cents versus 2.15 cents per ton-mile in 2007. As railroads<br />
seek to increase <strong>the</strong> usage and revenue generation of <strong>the</strong>ir rolling stock, it is often in <strong>the</strong>ir best<br />
interest to give price/rate incentives to shippers with long hauls. Also, <strong>the</strong> cost disadvantages in<br />
equipment utilization make <strong>the</strong> short hauls more expensive for <strong>the</strong> carriers.<br />
Shippers bear increasing responsibility for car supply and o<strong>the</strong>r functions historically provided<br />
by <strong>the</strong> railroads. The costs of railcar ownership have shifted from railroads to shippers, adding<br />
fur<strong>the</strong>r to costs not reflected in tariff rates. Private ownership has been <strong>the</strong> source of new covered<br />
hopper railcar capacity; by 2008, hopper car ownership was 70% private, 26% Class I railroad, and<br />
4% smaller railroads. From 1981 to 2008, privately owned cars increased from 128,394 to 290,176,<br />
or 126%, as Class I railroads decreased <strong>the</strong>ir ownership by 37%.<br />
Fuel surcharges should reimburse railroads for only <strong>the</strong> incremental increase in fuel costs, not<br />
<strong>the</strong> base fuel costs that are already included in <strong>the</strong> rate. The average growth in fuel surcharge per<br />
grain carload during <strong>the</strong> 3 rd quarter of 2008 was $650.77, contrasted to <strong>the</strong> growth in railroad fuel<br />
costs of $286.46, a difference of 127% over <strong>the</strong> incremental increase in <strong>the</strong> cost of fuel. Fur<strong>the</strong>rmore,<br />
72
JTRF Volume 50 No. 1, Spring 2011<br />
as fuel costs increase, <strong>the</strong> difference between <strong>the</strong> quarterly growth in grain fuel surcharges and <strong>the</strong><br />
growth in railroad fuel costs tends to increase.<br />
This study also reports that billions of dollars in premiums paid as part of mergers are included<br />
in <strong>the</strong> determination of railroad revenue adequacy, which is likely to result in higher rail rates for<br />
shippers than o<strong>the</strong>rwise would be <strong>the</strong> case.<br />
Rail rates have increased rapidly since 2004, resulting in a surge of railroad profitability. The<br />
increase in rail rates is <strong>the</strong> result of aggressive pricing as rail capacity constraints appeared, and <strong>the</strong><br />
over-recovery of fuel costs. The higher rail rates also reflect higher rail costs since 2004.<br />
Railroad financial measures of profitability increased at a moderate rate through 2004, and<br />
<strong>the</strong>n surged from 2005 through 2007. Net income, earnings before interest and taxes (EBIT), and<br />
earnings before interest, taxes, depreciation, and amortization (EBITDA) are commonly used<br />
financial measures of profitability. Over <strong>the</strong> four-year period from 2004 to 2008, net profit, EBIT,<br />
and EBITDA increased 183%, 152%, and 102%, respectively.<br />
Endnotes<br />
1. Running directionally occurs when two railroads with parallel rail lines share rail lines, allowing<br />
shared use of one line in each direction. This practice eliminates trains waiting on sidings for<br />
trains moving in <strong>the</strong> opposite direction to pass.<br />
2. Tariff shipments comprise approximately 75% by weight of <strong>the</strong> grain and oilseed movements<br />
while contract shipments comprise approximately 25%.<br />
3. Some movements have enough competition to limit rail rates and are exempt from regulation.<br />
Exemption of particular movements or exempt commodities can be appealed before <strong>the</strong> STB,<br />
and <strong>the</strong> STB may remove <strong>the</strong> exemption if competition no longer adequately constrains rates.<br />
4. A merger premium is <strong>the</strong> amount paid for a firm that exceeds its net book value according<br />
to historical accounting methods. Net book value is <strong>the</strong> historical cost less accumulated<br />
depreciation.<br />
5. As railroad tariff rates are partially deregulated and <strong>the</strong> financial condition of <strong>the</strong> railroad<br />
industry in 1980 was poor, <strong>the</strong> Staggers Act requires <strong>the</strong> regulatory agency (STB) to evaluate<br />
<strong>the</strong> revenue adequacy of <strong>the</strong> major U.S. railroads and <strong>the</strong> railroad industry. The STB calculates<br />
<strong>the</strong> cost of capital (weighted average of <strong>the</strong> cost of debt and cost of capital) for <strong>the</strong> railroad<br />
industry annually. If <strong>the</strong> railroad’s return on net investment exceeds <strong>the</strong> cost of capital, <strong>the</strong><br />
carrier is judged revenue adequate, which means that <strong>the</strong> railroad is able to attract sufficient<br />
capital.<br />
6. Merger premiums add to variable costs when <strong>the</strong> premiums are paid on assets included in <strong>the</strong><br />
calculation of variable costs.<br />
References<br />
Association of American Railroads (AAR). Analysis of Class I Railroads. (1998-2009).<br />
Association of American Railroads (AAR). Freight Commodity Statistics. (1997-2008).<br />
Association of American Railroads (AAR). Railroad Equipment Report. (1982-2008).<br />
Association of American Railroads (AAR). Railroad Facts. (2009): 18-19.<br />
73
Rail Rate and Revenue Changes<br />
Association of American Railroads (AAR). The Rail <strong>Transportation</strong> of Grain. (2009): 62.<br />
Babcock, Michael W., L. Orlo Sorenson, Ming H. Chow, and Keith Klindworth. “Impact of Staggers<br />
Rail Act on Agriculture: A Kansas Case Study.” Proceedings of <strong>the</strong> <strong>Transportation</strong> <strong>Research</strong> <strong>Forum</strong><br />
26 (1), (1985): 364-372.<br />
Bereskin, C. Gregory. Railroad Cost Curves Over Thirty Years: What Can They Tell Us? presentation<br />
at <strong>the</strong> <strong>Transportation</strong> <strong>Research</strong> <strong>Forum</strong>, Fort Worth, Texas, March 18, 2008.<br />
Chow, Ming H. “Interrail Competition in Rail Grain Rates on <strong>the</strong> Central Plains.” Proceedings of<br />
<strong>the</strong> <strong>Transportation</strong> <strong>Research</strong> <strong>Forum</strong> 27(1), (1986): 164-171.<br />
Christensen, Laurits R. Associates, Inc. A Study of Competition in <strong>the</strong> U.S. Freight Railroad Industry<br />
and Analysis of Proposals That Might Enhance Competition. 2008, 5-14, 5-15, 8-41, 8-46.<br />
CSX <strong>Transportation</strong>. Webpage several months after Hurricane Katrina (2006).<br />
Fuller, Stephen, David Bessler, James MacDonald, and Michael Wohlgenant. “Effects of Deregulation<br />
on Export-Grain Rail Rates in <strong>the</strong> Plains and Corn Belt.” Proceedings of <strong>the</strong> <strong>Transportation</strong> <strong>Research</strong><br />
<strong>Forum</strong> 28 (1), (1987): 160-167.<br />
Gallamore, Robert E. “Regulation and Innovation: Lessons from <strong>the</strong> American Railroad Industry.”<br />
José Gómez-Ibáñez, William B. Tye, and Clifford Winston eds. Essays in <strong>Transportation</strong> Economics<br />
and Policy. Washington, D.C.: Brookings Institution (1999): 493-529.<br />
Government Accountability Office (GAO). Railroad Regulation: Economic and Financial Impacts<br />
of <strong>the</strong> Staggers Rail Act of 1980. 1990.<br />
Government Accountability Office (GAO). Freight Railroads: Industry Health Has Improved, but<br />
Concerns about Competition and Capacity Should Be Addressed. 2006, 3.<br />
Government Accountability Office (GAO). Freight Railroads: Updated Information on Rates and<br />
O<strong>the</strong>r Industry Trends. 2007, 12.<br />
Kohls, Richard L. Marketing of Agricultural Products. The Macmillan Company, New York, 1967:<br />
147, 153, 305.<br />
Koo, Won W., Denver D. Tolliver, and John D. Bitzan. “Railroad Pricing in Captive Markets: An<br />
Empirical Study of North Dakota.” The Logistics and <strong>Transportation</strong> Review 29 (2), (1993): 123-<br />
137.<br />
Kwon, Y.W., Michael W. Babcock, and Orlo L. Sorenson. “Railroad Differential Pricing in<br />
Unregulated <strong>Transportation</strong> Markets: A Kansas Case Study.” The Logistics and <strong>Transportation</strong><br />
Review 30 (3), (1994): 223-244.<br />
MacDonald, James M. “Competition and Rail Rates for <strong>the</strong> Shipment of Corn, Soybeans and<br />
Wheat.” Rand <strong>Journal</strong> of Economics 18 (1), (1987):151-163.<br />
MacDonald, James M. Effects of Railroad Deregulation on Grain <strong>Transportation</strong>. U.S. Department<br />
of Agriculture, ERS Technical Bulletin No. 1759, Washington, D.C., 1987.<br />
MacDonald, James M. “Railroad Deregulation, Innovation, and Competition: Effects of <strong>the</strong><br />
Staggers Act on Grain <strong>Transportation</strong>.” <strong>Journal</strong> of Law and Economics 32, (1989): 63-95.<br />
74
JTRF Volume 50 No. 1, Spring 2011<br />
Montana Wheat & Barley Committee, et al. STB Ex Parte No. 658, The 25 th Anniversary of <strong>the</strong><br />
Staggers Rail Act of 1980: A Review and Look Ahead. October 19, 2005.<br />
Montana Wheat & Barley Committee, et al. STB Ex Parte No. 665, Rail <strong>Transportation</strong> of Grain.<br />
October 30, 2006.<br />
National Grain and Feed Association (NGFA). STB Ex Parte No. 658, The 25 th Anniversary of <strong>the</strong><br />
Staggers Rail Act of 1980: A Review and Look Ahead. October 19, 2005.<br />
Prater, Marvin and Keith Klindworth. Long-Term Trends in Railroad Service and Capacity for U.S.<br />
Agriculture. USDA/Agricultural Marketing Service, 2000.<br />
Security and Exchange Commission. Class I railroad quarterly filings. (2001-2007).<br />
Surface <strong>Transportation</strong> Board (STB). Confidential Waybill Sample. (1985-2007).<br />
Surface <strong>Transportation</strong> Board (STB). Decisions in STB Ex Parte No. 558, Railroad Cost of Capital.<br />
(1998-2009).<br />
Surface <strong>Transportation</strong> Board (STB). STB Ex Parte No. 661, Rail Fuel Surcharges. Decision<br />
37341, January 25, 2007.<br />
Surface <strong>Transportation</strong> Board (STB). Study of Railroad Rates: 1985-2007. 2009.<br />
Thompson, S.R., R.J. Hauser, and B.A. Coughlin. “The Competitiveness of Rail Rates for Export-<br />
Bound Grain.” The Logistics and <strong>Transportation</strong> Review 26 (1), (1990): 35-53.<br />
Union Pacific Railroad. Letter from Jack Koraleski, www.uprr.com. 2008.<br />
U.S. Department of Agriculture (USDA). Comments to <strong>the</strong> STB during Ex Parte No. 658, The 25 th<br />
Anniversary of <strong>the</strong> Staggers Rail Act of 1980: A Review and Look Ahead. October 19, 2005.<br />
U.S. Department of Agriculture (USDA). STB Ex Parte No. 665, Rail <strong>Transportation</strong> of Grain.<br />
http://www.ams.usda.gov/AMSv1.0/getfile?dDocName=STELPRDC5049155&acct=atpub,<br />
November 2, 2006.<br />
U.S. Department of Agriculture (USDA). STB Ex Parte No. 646 (Sub-No.1), Simplified Standards<br />
for Rail Rate Cases. http://www.ams.usda.gov/AMSv1.0/getfile?dDocName=STELPRDC5049156<br />
&acct=atpubN, November 7, 2006.<br />
U.S. Department of Agriculture (USDA), National Agricultural Statistical Service (NASS). Crop<br />
Value Summary, 2009.<br />
U.S. Department of Agriculture and <strong>the</strong> U. S. Department of <strong>Transportation</strong> (USDA/DOT). Study<br />
of Rural <strong>Transportation</strong> Issues. http://www.ams.usda.gov/AMSv1.0/Rural <strong>Transportation</strong> Study,<br />
April 2010.<br />
Wilson, Wesley W. and William W. Wilson. “Deregulation, Rate Incentives, and Efficiency in <strong>the</strong><br />
Railroad Market.” B. Starr McMullen ed. <strong>Transportation</strong> After Deregulation. New York: Elsevier<br />
(2001): 1-24.<br />
75
Rail Rate and Revenue Changes<br />
Marvin Prater is a transportation economist specializing in railroad transportation and rural<br />
infrastructure issues and is employed by <strong>the</strong> <strong>Transportation</strong> Services Division, Agricultural<br />
Marketing Service, U.S. Department of Agriculture. Marvin earned a B.S. degree in Horticulture,<br />
a masters in business administration, and a Ph.D. in economics from Kansas State University.<br />
Marvin has been a member of <strong>the</strong> <strong>Transportation</strong> <strong>Research</strong> <strong>Forum</strong> since 1997, presented papers at<br />
<strong>the</strong> annual forum, and authored papers for <strong>the</strong> <strong>Journal</strong> of <strong>the</strong> <strong>Transportation</strong> <strong>Research</strong> <strong>Forum</strong> and<br />
<strong>the</strong> U.S. Department of Agriculture.<br />
Ken Casavant is a professor in <strong>the</strong> School of Economic Sciences and a nationally renowned<br />
transportation economist after spending 35 years at Washington State University. He has received<br />
numerous teaching, research, and service awards throughout his tenure at Washington State<br />
University, including recipient of <strong>the</strong> “Lifetime Achievement Award” from <strong>the</strong> Upper Great Plains<br />
<strong>Transportation</strong> Institute in 2006, <strong>the</strong> “Washington State University Sahlin Faculty Excellence<br />
Award” in 2004, and being named “Distinguished Scholar” by <strong>the</strong> Western Agricultural Economics<br />
Association in 2003. Ken also serves as <strong>the</strong> faculty athletic representative to <strong>the</strong> president for<br />
Washington State University.<br />
Eric Jessup is an associate professor in <strong>the</strong> School of Economic Sciences at Washington State<br />
University. His research focus and area of specialty is transportation economics and freight systems<br />
modeling. He is also co-principal investigator for <strong>the</strong> multi-year, statewide freight research and<br />
implementation project for <strong>the</strong> state of Washington, <strong>the</strong> Strategic Freight <strong>Transportation</strong> Analysis<br />
(SFTA) study.<br />
Bruce Blanton currently serves as director of <strong>the</strong> <strong>Transportation</strong> Services Division with <strong>the</strong> U.S.<br />
Department of Agriculture’s Agricultural Marketing Service. Over <strong>the</strong> years he has served in various<br />
positions in both government and industry. Past positions held at USDA include deputy assistant<br />
secretary for congressional relations, special assistant to <strong>the</strong> Farm Service Agency administrator,<br />
special assistant to <strong>the</strong> Under Secretary for International Affairs and Commodity Programs,<br />
and confidential assistant to <strong>the</strong> Deputy Secretary. Blanton also worked as a senior analyst for<br />
agriculture for <strong>the</strong> United States Senate Committee on <strong>the</strong> Budget. In <strong>the</strong> private sector Blanton<br />
served as executive director of <strong>the</strong> National Renderers Association, vice president of rendering<br />
sales for Moyer Packing Company, and as an economic research associate for <strong>the</strong> American Farm<br />
Bureau Federation. A native of <strong>the</strong> Southwest, Blanton holds a bachelor’s degree in agricultural<br />
business management from New Mexico State University and a master’s degree in agricultural<br />
economics from <strong>the</strong> University of Missouri-Columbia.<br />
Pierre Bahizi is an economist with <strong>the</strong> <strong>Transportation</strong> Services Division at <strong>the</strong> U.S. Department<br />
of Agriculture. Prior to working for USDA, Pierre was an economist in <strong>the</strong> Division of Consumer<br />
Expenditure Surveys at <strong>the</strong> Bureau of Labor Statistics. He has also worked in <strong>the</strong> Travel and<br />
Tours Department at <strong>the</strong> Smithsonian Institution. Pierre graduated from <strong>the</strong> University of Texas at<br />
Arlington with a B.A. in economics.<br />
Daniel Nibarger is an economist with <strong>the</strong> U.S. Department of Agriculture, Foreign Agricultural<br />
Service. Daniel is from Gardner, Kansas, and attended Kansas State University in Manhattan. At<br />
Kansas State, Daniel earned a B.S. degree in economics with an international economics overlay,<br />
and an M.S. in economics with an emphasis in international trade. During his graduate coursework,<br />
Daniel spent a summer in Wuhan, Hubei Province, China, teaching English language courses at<br />
Huazhong University. After completing his M.S., Daniel earned a legislative fellowship with <strong>the</strong><br />
State of Kansas Legislature. He has also served as a labor economist with <strong>the</strong> Kansas Department<br />
of Labor researching ways to project employment and unemployment. Daniel has also served<br />
76
JTRF Volume 50 No. 1, Spring 2011<br />
as an economist for <strong>the</strong> <strong>Transportation</strong> Services Division of <strong>the</strong> U.S. Department of Agriculture.<br />
Daniel has presented his research at <strong>the</strong> 2006 Western Economics Association-International<br />
annual meeting, <strong>the</strong> 2010 <strong>Transportation</strong> <strong>Research</strong> <strong>Forum</strong>, and <strong>the</strong> 2009 Caribbean Conference for<br />
Agricultural Trade.<br />
Johnny Hill is an agricultural economist with <strong>the</strong> <strong>Transportation</strong> Services Division, Agricultural<br />
Marketing Service, U.S. Department of Agriculture, specializing in grain exports and rail<br />
transportation. Johnny earned a B.S. degree in rural development and an M.S. degree in agricultural<br />
science from Tennessee State University. Johnny has worked at USDA since 1988 and prior to this<br />
position, worked as a graduate research assistant and instructor in <strong>the</strong> School of Agriculture at<br />
Tennessee State University.<br />
Isaac Weingram is a research assistant at <strong>the</strong> Federal Reserve Bank of Boston. Previously, Isaac<br />
worked as an agricultural economist assistant in <strong>the</strong> <strong>Transportation</strong> Services Division of <strong>the</strong> U.S.<br />
Department of Agriculture. He graduated from Washington University in Saint Louis with an A.B.<br />
in ma<strong>the</strong>matics and economics.<br />
77
Measuring Bulk Product <strong>Transportation</strong><br />
Fuel Efficiency<br />
by C. Phillip Baumel<br />
This paper reviews <strong>the</strong> literature that compares <strong>the</strong> fuel efficiencies of bulk commodity transportation<br />
modes. Most studies used net-ton-miles per gallon to compare modal fuel efficiencies. Net-tonmiles<br />
per gallon have traditionally been estimated from aggregate industry data of total net-tonmiles<br />
and total fuel consumed. More recent studies have targeted specific origins, destinations,<br />
products hauled, types and sizes of equipment, backhauls, and miles traveled to estimate total fuel<br />
consumption. This paper shows that fuel efficiency estimates based only on net-ton-miles per gallon<br />
can be erroneous. The paper identifies basic variables and measurement methods that can improve<br />
<strong>the</strong> accuracy of modal fuel efficiency comparisons.<br />
INTRODUCTION<br />
In 1971, <strong>the</strong> price of imported petroleum was $2.00 per barrel; it peaked at $147 per barrel in July<br />
2008 and fell to $50 in December 2008 (Baumel 2009). At <strong>the</strong> time of <strong>the</strong> writing of this article,<br />
<strong>the</strong> price of petroleum fluctuated around $90 per barrel. No one knows <strong>the</strong> precise future prices of<br />
petroleum, but few people expect <strong>the</strong> long run price to decline.<br />
Major air pollutants from motorized vehicles include hydrocarbons, carbon monoxide, carbon<br />
dioxide, nitrogen oxides, and particulate matter. The Environmental Protection Agency estimates<br />
emissions of <strong>the</strong>se hazardous air pollutants in grams per vehicle mile traveled (Texas <strong>Transportation</strong><br />
Institute 2009). Thus, fuel consumption and miles traveled are major factors in estimating air<br />
pollution from freight transportation.<br />
Users and operators of <strong>the</strong> three major modes of bulk product transportation call for major<br />
infrastructure upgrading. Bulk products include coal, grains, chemicals, aggregates, and liquid fuels.<br />
Increased traffic congestion is evidence of needed highway upgrading. A 2007 study estimated that<br />
<strong>the</strong> U.S. railroad industry would need to invest $147 billion over <strong>the</strong> next 35 years in infrastructure<br />
expansion to meet <strong>the</strong> U.S. Department of <strong>Transportation</strong> projected 88% increase in rail freight<br />
tonnage by 2035 (Cambridge Systematics Inc. 2007). Barge users and <strong>the</strong> barge industry have been<br />
urging <strong>the</strong> U.S. public to invest in upgrading America’s inland waterway locks and dams to “help<br />
keep America green” (Waterways Council Inc. 2010).<br />
Environmental concerns, increasing fuel costs, and needed infrastructure upgrades suggest<br />
<strong>the</strong> need to improve <strong>the</strong> fuel efficiency of <strong>the</strong> bulk product transportation system. This objective<br />
requires that modal fuel efficiencies should be accurately estimated.<br />
Previous research on measuring bulk product transportation fuel efficiency can be grouped into<br />
five categories:<br />
1. Using aggregate data to estimate net-ton miles per gallon (NTMG) by mode<br />
2. Estimating NTMG by river segment or by direction of rail movement<br />
3. Estimating NTMG by operating characteristic<br />
4. Estimating NTMG by product hauled<br />
5. Estimating total fuel consumption using NTMG and miles traveled by mode from<br />
specific origins to specific final destinations<br />
A review of <strong>the</strong> literature in each of <strong>the</strong>se five categories follows.<br />
79
<strong>Transportation</strong> Fuel Efficiency<br />
Using Aggregate Data to Estimate Modal NTMG<br />
The majority of past fuel efficiency studies and reports used total fuel consumed and total net<br />
ton miles of freight over thousands of commodities and routes to estimate NTMG. A 1975 U.S.<br />
Department of <strong>Transportation</strong> advisory report on <strong>the</strong> replacement of Alton Locks and Dam 26 on<br />
<strong>the</strong> Upper Mississippi River summarized <strong>the</strong> results of 19 energy studies (U.S. Department of<br />
<strong>Transportation</strong> 1975). The 19 studies used aggregate data to estimate rail and/or barge NTMG. The<br />
estimated rail fuel efficiencies ranged from 138.5 to 693.5 NTMG. Barge fuel efficiency ranged<br />
from 243.3 to 639.2 NTMG.<br />
Eastman (1980) estimated <strong>the</strong> following NTMG: barge, 514; rail, 202; and truck, 59. The<br />
Eastman numbers were frequently used in o<strong>the</strong>r reports, i.e., U.S. Department of <strong>Transportation</strong><br />
(1994) and were still being reported 30 years later (Bernert Barge Lines Inc. 2010).<br />
The Texas <strong>Transportation</strong> Institute (TTI) estimated <strong>the</strong> following NTMG: truck, 155; rail, 413;<br />
and barge, 576 (Texas <strong>Transportation</strong> Institute 2009). Some writers and organizations use <strong>the</strong> TTI<br />
estimates to promote barges and short sea shipping as <strong>the</strong> most fuel efficient modes of bulk product<br />
transportation (National Waterways Foundation 2008, Quigley 2009). The Association of American<br />
Railroads (2010) reported a 2009 U.S. Class I railroad NTMG of 480.<br />
Most of <strong>the</strong> above reports used <strong>the</strong>ir estimated NTMG as <strong>the</strong> only basis for comparing <strong>the</strong> fuel<br />
efficiency of <strong>the</strong> three major modes of freight transportation. TTI assumed that since <strong>the</strong> miles<br />
traveled by each mode were similar, NTMG could be used to define <strong>the</strong> fuel efficiency of each of<br />
<strong>the</strong> three modes.<br />
Estimating NTMG by River Segment and Rail Direction<br />
Using data from four barge companies, Baumel, Hauser, and Beaulieu (1982) estimated barge<br />
NTMG for moving grain from several Mississippi River system origins to New Orleans, Louisiana<br />
(NOLA). At a 25% backhaul, NTMG on <strong>the</strong> Lower Mississippi River from Cairo, Illinois, to NOLA<br />
was 525, while barges on <strong>the</strong> Upper Mississippi and Illinois Rivers averaged about 450 NTMG.<br />
Baumel et al. (1985) used daily fuel measurement data from three barge companies to estimate<br />
<strong>the</strong> NTMG of barges on <strong>the</strong> Upper Mississippi and Lower Mississippi Rivers. Calibrated steel tape<br />
measurements were used to estimate daily fuel consumption. Fuel meters were not possible because<br />
when one or more propellers were in reverse, <strong>the</strong> vibrations caused fuel meters to malfunction. At a<br />
35% backhaul, <strong>the</strong> NTMG for barges on <strong>the</strong> Upper Mississippi River was 526, while barges on <strong>the</strong><br />
Lower Mississippi River obtained 548 NTMG.<br />
Burton (1997) used a Tennessee Valley Authority (TVA) Barge Costing Model to estimate barge<br />
NTMG on six rivers. His estimated NTMG was 694 for <strong>the</strong> Upper/Middle Mississippi River and<br />
917 for <strong>the</strong> Lower Mississippi River.<br />
Baumel et al. (1985) used fuel meters to estimate NTMG for three 54-car unit grain trains and<br />
three 75-car unit trains from Iowa to West Coast ports. Four unit grain trains were shipped from<br />
Iowa to NOLA. The four grain trains to NOLA averaged 640 NTMG. This was 46% more than <strong>the</strong><br />
437 average NTMG achieved by <strong>the</strong> six West Coast trains. All West Coast trains had to traverse one<br />
or more mountain ranges to and from <strong>the</strong> West Coast. This explains most of <strong>the</strong> difference in <strong>the</strong><br />
average NTMG of <strong>the</strong> two sets of trips.<br />
Gervais and Baumel (1999) used TVA calculated barge NTMG from three segments of <strong>the</strong><br />
Mississippi River. The TVA estimated total fuel consumption from actual barge fuel tax collections.<br />
The 1995 estimates of NTMG were as follows: Lower Mississippi River, 646: Mouth of <strong>the</strong> Missouri<br />
to <strong>the</strong> Mouth of <strong>the</strong> Ohio River, 595; and Minneapolis to <strong>the</strong> Mouth of <strong>the</strong> Missouri River, 308. All<br />
of <strong>the</strong> locks and dams are located between Minneapolis and <strong>the</strong> Mouth of <strong>the</strong> Missouri River. The<br />
weighted average NTMG of <strong>the</strong> three Mississippi segments was 420 NTMG.<br />
80
Estimating NTMG by Operating Characteristic<br />
JTRF Volume 50 No. 1, Spring 2011<br />
Burton (1997) used TVA data to estimate NTMG for each of 12 railroad companies. The estimated<br />
NTMG ranged from 118 to 374. The highest NTMGs were for <strong>the</strong> four largest railroad companies.<br />
Seven of <strong>the</strong> o<strong>the</strong>r eight companies have ei<strong>the</strong>r merged with <strong>the</strong> four larger companies, or merged<br />
toge<strong>the</strong>r to form new companies.<br />
Baumel et al. (1985) used data from three barge companies to estimate <strong>the</strong> impact of <strong>the</strong> percent<br />
backhaul on barge NTMG on <strong>the</strong> Upper and Lower Mississippi rivers. At zero backhaul, NTMG<br />
were estimated to be 420 on <strong>the</strong> Upper Mississippi and 483 on <strong>the</strong> Lower Mississippi River. At 50%<br />
backhaul, <strong>the</strong> NTMG gap between <strong>the</strong> two rivers narrowed to 578 on <strong>the</strong> Upper Mississippi and 592<br />
on <strong>the</strong> Lower Mississippi River. At 100% backhaul, <strong>the</strong>re was little difference in <strong>the</strong> NTMG on <strong>the</strong><br />
two rivers; those estimates were 756 for <strong>the</strong> Upper Mississippi and 754 for <strong>the</strong> Lower Mississippi<br />
River.<br />
Gervais and Baumel (1999) used data from computer simulations by two railroad companies<br />
to estimate <strong>the</strong> impact of <strong>the</strong> type of locomotive and size of rail car on rail NTMG. Three scenarios<br />
were analyzed. Two were from Central Iowa to NOLA and to Los Angeles. The third was from<br />
western Iowa to Tacoma, Washington. Each trip was simulated with three different locomotives and<br />
two sizes of covered hopper cars. The two types of rail cars were 100-ton and 110-ton capacities.<br />
The 100-ton cars are now 30-40 years old and are being replaced by new 110-ton cars.<br />
The three locomotives were <strong>the</strong> SD40 that was introduced in <strong>the</strong> late 1970s and <strong>the</strong> newer<br />
SD60 and C40-8. Four SD40s are required to pull a 100-car grain train. Only three SD60 or C40-8<br />
locomotives are needed to pull 100-car grain trains. All simulations were at 35 mph.<br />
The SD60s had <strong>the</strong> highest NTMG and <strong>the</strong> older SD40s had <strong>the</strong> lowest. The 110-cars had higher<br />
NTMG than <strong>the</strong> older 100-ton cars. Finally, <strong>the</strong> NTMG for <strong>the</strong> trips to NOLA were 30% higher than<br />
those to Los Angeles and 22% higher than those to Tacoma. The reason for <strong>the</strong> higher NTMG to<br />
NOLA is that <strong>the</strong> terrain to NOLA is relatively flat, while each trip to Los Angeles and Tacoma was<br />
over one or more mountain ranges on <strong>the</strong> loaded and empty legs of each trip.<br />
Gervais and Baumel (1999) also reported computer simulations of state-of-<strong>the</strong> art semi trucks<br />
obtaining 131 NTMG at a speed of 60 MPH. NTMG declined 16% to 110 NTMG at a speed of 70<br />
MPH.<br />
Baumel et al. (1985) used fuel consumption data for 254 grain hauling ocean vessels taken<br />
from The <strong>Journal</strong> of Commerce and Commercial (February 1, to July 31, 1983) to estimate NTMG<br />
for grain carrying ocean vessels. Small vessels (
<strong>Transportation</strong> Fuel Efficiency<br />
a drayage truck, usually older and less fuel efficient than a long-haul truck, operating in congested<br />
conditions.<br />
ICF International (2009) updated <strong>the</strong> Abacus Technology Corporation (1991) study. ICF<br />
International (2009) used computer simulations of rail and truck movements in 23 competitive railtruck<br />
corridors to compare rail and truck fuel efficiencies. Individual rail movements included in <strong>the</strong><br />
analysis were double stack, covered hopper, tank car, trailers on flat cars (TOFC), and automotive<br />
rack trains. Individual truck movements included dry vans, dump, tanker, container, flatbed with<br />
sides and auto haulers. The dominant measure of fuel efficiency was NTMG. The fuel efficiency of<br />
railroads exceeded that of trucks in each of <strong>the</strong> 23 movements. However, <strong>the</strong> difference between rail<br />
and truck fuel efficiencies varied widely among <strong>the</strong> products hauled.<br />
Estimating Total Fuel Consumption Using NTMG and Miles Traveled by Mode from Specific<br />
Origins to Final Destinations<br />
Baumel et al. (1985) estimated total fuel consumption in gallons per short ton (GPT) in shipping<br />
grain from six origins in Iowa to Yokohama, Japan. GPT was estimated by dividing total miles<br />
traveled by each mode by <strong>the</strong> appropriate NTMG for that mode. The NTMG for railroads were<br />
estimated from metered fuel consumption data provided by five railroad companies. The NTMG for<br />
barges were calculated from daily fuel measurement data provided by three Mississippi River barge<br />
companies. The truck NTMG were calculated from three fuel metered trips hauling grain to barge<br />
loading elevators on <strong>the</strong> Mississippi River. The <strong>Journal</strong> of Commerce and Commercial ship fixture<br />
data (February 1-July 31, 1983) on bulk carrier time charters were used to estimate ocean vessel fuel<br />
consumption. Fuel consumed by each mode in each intermodal shipment was added to obtain <strong>the</strong><br />
total GPT for each route. The results for shipments to Japan are ranked below in descending order<br />
of total fuel efficiency when similar sized ocean vessels and typical routes are used:<br />
1. Unit trains direct to West Coast ports<br />
2. Unit trains direct to NOLA and <strong>the</strong> unit train-barge combination with 100% barge<br />
backhaul<br />
3. Unit-train-barge combination with less that 100% backhaul<br />
4. Truck-barge combinations<br />
EVALUATION OF THE ABOVE FUEL EFFICIENCY STUDIES<br />
The major characteristic of <strong>the</strong> above fuel efficiency studies is <strong>the</strong> conflicting results and conclusions<br />
among <strong>the</strong> many studies. There are at least three reasons for <strong>the</strong>se conflicting results. One is <strong>the</strong><br />
50-year span over which <strong>the</strong>se studies were conducted. The earlier studies, based on data from <strong>the</strong><br />
early 1960s, reported smaller NTMG than those based on late 1990s and 2000 data. Technological<br />
improvements and larger vehicle and vessel sizes have greatly increased fuel efficiency and NTMG<br />
in all modes of bulk product transportation. Some of <strong>the</strong>se technological improvements are reflected<br />
in later study results.<br />
A second reason for <strong>the</strong> conflicting results is that most of <strong>the</strong> earlier studies were based on<br />
average data over thousands of commodities and routes for <strong>the</strong> truck and rail industries. Many<br />
of <strong>the</strong> later studies were targeted to specific commodities, specific routes, and even alternative<br />
types and sizes of equipment. The Abacus Technology Corporation (1991) and ICF International<br />
(2009) studies estimated NTMG on trains and trucks, each hauling only automobiles, manufactured<br />
products, and liquid or bulk products. Most of <strong>the</strong> specific product studies focused on <strong>the</strong> types<br />
and sizes of equipment and miles traveled on routes typically used to transport bulk commodities<br />
including grain. These targeted analyses of actual movements generally allowed <strong>the</strong> studies to<br />
focus on larger size shipments such as unit trains and ocean vessels and on specific routes, miles,<br />
and direction of shipments that are typical of bulk commodities. These targeted analyses should<br />
provide more accurate estimates of fuel consumption than average NTMG estimates averaged<br />
82
JTRF Volume 50 No. 1, Spring 2011<br />
over different weights, speeds, transportation equipment, terrain, and distances hauled. Speed is<br />
important because aerodynamic resistance of a train increases with <strong>the</strong> square of <strong>the</strong> speed (Grervais<br />
and Baumel 1999). Ship company executives indicate that, on average, fuel consumption decreases<br />
about 20% with each 10% reduction in speed (Baumel et al. 1985).<br />
A third, and perhaps <strong>the</strong> most important reason for different results, is that some of <strong>the</strong><br />
later studies have focused on estimating total fuel consumption from specific origins to specific<br />
destinations. The TTI (2009) estimated <strong>the</strong> following NTMG as measures of fuel efficiency:<br />
Truck 155<br />
Rail 413<br />
Barge 576<br />
These NTMG suggest that barges are 39% more fuel efficient than railroads and almost four<br />
times more fuel efficient than trucks. However, NTMG alone tells only part of <strong>the</strong> fuel efficiency<br />
story<br />
The following example focuses on grain shipped by railroad and barge from Iowa to export<br />
grain elevators in <strong>the</strong> NOLA area. Almost all grain shipped by barge must be hauled from inland<br />
elevators, or from farms, to barge-loading elevators. Grain shipments from elevators direct to a<br />
final destination are typically by rail or truck. Usually, no o<strong>the</strong>r mode is involved in <strong>the</strong>se transfers.<br />
Similar movements also are typical for coal and some chemicals and liquid fuels. To make correct<br />
comparisons of total fuel consumption of barge versus rail direct to an export port, fuel consumed<br />
by truck or rail to a barge loading facility must be added to <strong>the</strong> barge fuel consumption. Moreover,<br />
NTMG measures only <strong>the</strong> miles that one ton of freight is moved by one gallon of fuel. It fails to<br />
measure <strong>the</strong> total fuel consumed in moving <strong>the</strong> freight from an origin to a destination.<br />
Bruton (1997) makes <strong>the</strong> following argument in his paper (p. 7) prepared for <strong>the</strong> U.S. Army<br />
Corps of Engineers:<br />
“A majority of barge shipments involve a truck movement at one or both ends of <strong>the</strong><br />
line-haul move and in some cases, <strong>the</strong>se truck hauls may be of considerable length.<br />
Anecdotal evidence suggests that some grain shipments may be trucked as much as<br />
300 miles for trans-loading to barge. Alternately, most rail movements can be made<br />
rail direct and where additional truck movements are necessary, <strong>the</strong>y are seldom<br />
more than a few miles. Consequently, <strong>the</strong> appropriate fuel usage comparison is not<br />
between line-haul barge and line-haul rail. Ra<strong>the</strong>r, this comparison must be made<br />
over <strong>the</strong> entire movement. This often means comparing <strong>the</strong> fuel efficiency of an all<br />
rail movement with that of a truck-barge-truck combination. Quite clearly, such cases<br />
tend to diminish <strong>the</strong> aggregate efficiency advantage o<strong>the</strong>rwise attributable to barge.”<br />
Table 1 illustrates <strong>the</strong> impact of distance travelled on total modal fuel consumption. The table<br />
shows <strong>the</strong> total fuel consumed to move one ton of grain from one Iowa origin to a NOLA destination<br />
by rail and by truck-barge. Rail direct versus rail-barge was not evaluated because almost all grain<br />
shipped by barge from Iowa is now delivered by trucks to barge loading elevators (Van Der Kamp<br />
2010).<br />
The NTMG listed in Table 1 are those estimated by TTI. The Association of American Railroads<br />
(2010) reports that <strong>the</strong> average NTMG for Class I railroads for 2009 was 480; this is 16% more<br />
efficient than <strong>the</strong> 413 reported in TTI. Never<strong>the</strong>less, Table 1 uses TTI’s lower rail NTMG of 413.<br />
St. Charles Parish, Louisiana (SCPL), was selected as <strong>the</strong> destination for both <strong>the</strong> rail and barge<br />
delivered grain. Three of <strong>the</strong> 10 grain export elevators in <strong>the</strong> NOLA area are located in SCPL.<br />
Waterloo, Iowa, located near <strong>the</strong> center of Black Hawk County, was chosen as <strong>the</strong> origin of<br />
<strong>the</strong> grain in Table 1. The railroad miles in Table 1 from Waterloo to SCPL are <strong>the</strong> average miles for<br />
typical routes of rail shipments of grain from Black Hawk County, Iowa, to SCPL.<br />
The data in Table 1 show that total fuel consumption per ton of grain shipped by truck-barge<br />
combination from Waterloo to SCPL is 6% greater than for <strong>the</strong> direct rail shipment. If <strong>the</strong> Association<br />
of American Railroads (2010) rail NTMG of 480 was substituted for <strong>the</strong> TTI (2009) rail NTMG<br />
in Table 1 <strong>the</strong> total truck-barge fuel consumption would be 23% greater than for <strong>the</strong> direct rail<br />
83
<strong>Transportation</strong> Fuel Efficiency<br />
Table 1: Estimated Total Fuel Consumption to Ship Grain from Waterloo, Iowa, to<br />
St. Charles Parish in Gallons per Ton of Grain<br />
shipment. These results are <strong>the</strong> opposite of <strong>the</strong> conclusion derived from NTMG alone. The major<br />
reasons for <strong>the</strong> different conclusions are:<br />
1. The truck portion of <strong>the</strong> barge movement adds almost 0.6 gallons to total truck-barge fuel<br />
consumption per ton of grain,<br />
2. The total barge distance from Dubuque to SCPL is 20% longer than <strong>the</strong> average typical rail<br />
distance from Waterloo to SCPL, and<br />
3. The combined truck-barge distance from Waterloo to SCPL is 27% longer than <strong>the</strong> direct<br />
rail shipment from <strong>the</strong> same origin to <strong>the</strong> same destination.<br />
The longer barge distance is caused by <strong>the</strong> meandering of <strong>the</strong> Mississippi River. Figure 1<br />
illustrates <strong>the</strong> impact of this meandering on river distances.<br />
All of <strong>the</strong> NOLA grain export elevators are located within <strong>the</strong> Baton Rouge-Myrtle Grove<br />
section of <strong>the</strong> river. The river distance between <strong>the</strong>se two points is 167 miles (Blue Water Shipping<br />
Company). The MapQuest driving distance between <strong>the</strong>se two points is 107 miles. Thus, <strong>the</strong><br />
meandering of <strong>the</strong> river increases <strong>the</strong> river distance between <strong>the</strong>se two points 56% above <strong>the</strong><br />
driving distance. The entire Mississippi River meanders in a similar fashion up to its source near<br />
Minneapolis.<br />
The total miles to an importing country is even more important for calculating total fuel<br />
consumption for grain destined for export. For example, corn exports to Japan typically move in<br />
two directions. One is by barge, rail, or truck to Gulf of Mexico ports (including NOLA) for ocean<br />
vessel movements through <strong>the</strong> Panama Canal. The second is by rail to <strong>the</strong> West Coast and ocean<br />
vessel to Japan. The rail movement from Iowa to <strong>the</strong> West Coast is longer than to NOLA and it is<br />
over <strong>the</strong> Rocky Mountains. This suggests that fuel consumption would decrease if Iowa corn was<br />
shipped to NOLA ports for export. However, <strong>the</strong> ocean distance from NOLA to Japan is more than<br />
double <strong>the</strong> distance from Seattle–almost 6,000 miles longer (Baumel et al. 1985). The net result is<br />
that corn shipped by rail from western Iowa to Tacoma and ocean vessel to Japan uses less total fuel<br />
than any modal combination through NOLA (Gervais and Baumel 1999).<br />
Barge NTMG are typically calculated by dividing total net-ton miles of freight hauled by<br />
all barges on all navigable rivers, by <strong>the</strong> total number of gallons of fuel consumed. The Lower<br />
Mississippi River–that portion of <strong>the</strong> river south of <strong>the</strong> confluence of <strong>the</strong> Ohio and Mississippi<br />
Rivers–is <strong>the</strong> mostfuel efficient river on <strong>the</strong> Mississippi River system (Gervais and Baumel 1999).<br />
NTMG increase sharply as <strong>the</strong> number of tons increases in barge tows. Barge tows on <strong>the</strong> Lower<br />
Mississippi River can have 50 or more barges. That compares with a maximum of 15 barges on <strong>the</strong><br />
Upper Mississippi River and as few as two on <strong>the</strong> upper Missouri River. Second, <strong>the</strong> river current<br />
on <strong>the</strong> Lower Mississippi River is swift because it is not impeded by dams. The swift current pushes<br />
84<br />
Mode of transport Miles NTMG d<br />
Gallons<br />
per ton<br />
Total<br />
gallons<br />
per ton<br />
Rail direct to St. Charles Parish 1,180 a 413 2.86 2.86<br />
Truck to Dubuque 91b 155 0.59<br />
Barge (Dubuque to St. Charles Parish) 1,413c 576 2.45<br />
Total truck-barge 1,504 3.04<br />
Sources:<br />
a. Association of American Railroads (2010)<br />
b. MapQuest Driving Directions North America<br />
c. Iowa Department of <strong>Transportation</strong> and Blue Water Shipping Company<br />
d. Texas <strong>Transportation</strong> Institute (2009)
JTRF Volume 50 No. 1, Spring 2011<br />
Figure 1: Blue Water Shipping Company Mississippi River Deep Water Corridor Map<br />
<strong>the</strong> loaded barges downstream, fur<strong>the</strong>r reducing fuel consumption. Third, since <strong>the</strong>re are no locks on<br />
<strong>the</strong> Lower Mississippi River, barge tows move nonstop on this river segment. Barge tows on most<br />
o<strong>the</strong>r rivers must stop to transit <strong>the</strong> locks at each dam. This suggests that barge NTMG should be<br />
calculated for individual rivers to generate more accurate NTMG estimates.<br />
Similar issues exist for railroads. The large tonnages and direct shipments of unit-trains make<br />
<strong>the</strong>m more fuel efficient than trains consisting of a mix of different commodities. Trains that cross<br />
mountains consume more fuel than trains that essentially follow, but don’t meander, along <strong>the</strong><br />
Mississippi River (Gervais and Baumel 1999). Finally, new technology locomotives are highly fuel<br />
efficient (ICF International 2009). This suggests that NTMG should be estimated for different types<br />
of rail service.<br />
Burton (1990), using <strong>the</strong> TVA’s Barge Costing Model, estimated that barges operating on <strong>the</strong><br />
Lower Mississippi River obtained 917 NTMG. Yet, TVA estimates, based on 1995-1997 fuel taxes<br />
collected from barge companies, ranged from 604 to 646 NTMG (Gervais and Baumel 1999). If <strong>the</strong><br />
TVA’s Barge Costing Model estimates are correct, barge companies paid taxes on fuel that <strong>the</strong>y did<br />
not consume. This is highly unlikely. Fuel meters and physical measurements may be more accurate<br />
than some computer models not designed specifically to estimate NTMG. However, if fuel meters or<br />
physical measurements are used for barges, <strong>the</strong> fuel consumed by switch boats in switching barges<br />
into and out of tows must be added to <strong>the</strong> total fuel consumption. Moreover, fuel used to generate<br />
electricity on towboats must also be added to total fuel consumption. Only fuel used for propulsion<br />
is counted in waterway fuel tax receipts (IRS 2009).<br />
85
<strong>Transportation</strong> Fuel Efficiency<br />
Finally, backhaul estimates are needed to improve <strong>the</strong> accuracy of fuel consumption estimates.<br />
The backhaul rate for most unit-trains is typically zero. However, barge tows and ocean vessels<br />
typically have some level of backhaul, which increases <strong>the</strong> NTMG. Trucks also have backhauls but<br />
typically at a lower rate than barges and ocean vessels.<br />
How to Measure NTMG<br />
The most common, easiest, and least costly method to estimate NTMG is to divide aggregate data on<br />
ton miles of product hauled by a mode of transport, by <strong>the</strong> total gallons of fuel consumed to move<br />
those ton miles. It is also probably <strong>the</strong> least accurate method of estimation because it averages<br />
NTMG over thousands of products and movements and over many different types of equipment.<br />
Previous studies indicate that NTMG estimates vary substantially among products hauled (ICF<br />
International 2009), type of equipment used (Gervais and Baumel 1999), terrain and river segment<br />
(Baumel et al 1985), speed (ICF International 2009), and distance hauled.<br />
A second method to measure fuel consumption is to install fuel meters on trucks, rail locomotives<br />
and barge tow boats. Fuel meters work well on trucks and railroad locomotives but not on barge<br />
tow boats. An alternative to fuel meters on tow boats is to use Internal Revenue Service excise<br />
fuel tax collections on barge fuel consumption to calculate barge fuel consumption (IRS 2009).<br />
The excise tax is collected on each gallon of fuel used to propel inland waterway and intra coastal<br />
waterway commercial vessels for <strong>the</strong> transport of commercial property. Therefore, fuel used to<br />
generate electricity and heat must be added to <strong>the</strong> estimated fuel used to propel <strong>the</strong> vessel. These<br />
excise tax collection data are available by river segment.<br />
A third method is to develop computer simulation models that incorporate all of <strong>the</strong> major<br />
characteristics of <strong>the</strong> movement being simulated. On railroads, <strong>the</strong>se characteristics include type and<br />
size of train, number and type of locomotive, product mix, distance, grade severity, curvatures, and<br />
speed. Truck characteristics include type and size of truck, road grades, road congestion, tire types,<br />
and speed. Barge characteristics include number and type of barges, size and type of towboat, river<br />
segments, locks traversed by size and congestion, and water levels. Properly constructed simulation<br />
models appear to have <strong>the</strong> potential to estimate total fuel consumption for a larger number of<br />
movements and types of equipment more accurately and cheaper than o<strong>the</strong>r methods that have been<br />
used in past studies.<br />
CONCLUSIONS<br />
1. NTMG, when used alone, is frequently an incomplete and misleading measure for modal<br />
fuel efficiency comparisons. It is an accurate measure of comparative fuel efficiency only if<br />
<strong>the</strong> comparative mode shipments are from <strong>the</strong> same origin to <strong>the</strong> same destination, <strong>the</strong> same<br />
distance from <strong>the</strong> origin to <strong>the</strong> destination, and <strong>the</strong>re are no intermodal movements in each<br />
shipment.<br />
2. A more accurate measure of comparative modal fuel efficiency is <strong>the</strong> total fuel consumed by<br />
each mode over <strong>the</strong> entire movement in <strong>the</strong> transfer of <strong>the</strong> product from <strong>the</strong> origin to <strong>the</strong> final<br />
destination. This measure can be calculated by dividing <strong>the</strong> total miles traveled by each mode<br />
by <strong>the</strong> appropriate NTMG for each mode. Fuel consumption by each mode in <strong>the</strong> transfer<br />
should be added to obtain <strong>the</strong> total fuel consumption for <strong>the</strong> entire multimodal shipment.<br />
3. Appropriate NTMG should be estimated for different products, different rivers, and for different<br />
sizes and types of trains traveling over different terrains and with different types of locomotives.<br />
4. There is no one “greenest” mode of freight transport. The greenest mode or group of modes<br />
depends on several variables. These include <strong>the</strong> origin, final destination, product, type of<br />
shipment, level of backhaul, accuracy of <strong>the</strong> NTMG, and <strong>the</strong> miles traveled by all modes<br />
involved in <strong>the</strong> transfer.<br />
86
JTRF Volume 50 No. 1, Spring 2011<br />
5. The comparisons should be made over actual shipment routes ra<strong>the</strong>r than over routes that may<br />
possibly be used sometime in <strong>the</strong> future.<br />
6. Government officials should carefully examine proposals for public infrastructure investments<br />
that use NTMG alone to justify <strong>the</strong> proposal’s fuel efficiency. These proposals may have <strong>the</strong><br />
unintended consequence of increasing total fuel consumption. Accurate proposals should<br />
provide estimates of total fuel consumption from <strong>the</strong> beginning origin to <strong>the</strong> final destination.<br />
Total fuel consumption should be based on appropriate NTMG measures, routes and total miles<br />
traveled by each mode involved in <strong>the</strong> transfer. These estimates should be compared with <strong>the</strong><br />
next best alternative movement. Table 1 is an example of that type of comparison.<br />
7. The large differences in methodologies and results of previous fuel efficiency studies provide<br />
opportunities for university researchers, in cooperation with transportation organizations<br />
and agencies, to develop simulation models and data to generate unbiased and reliable fuel<br />
efficiency estimates for alternative modes, products, routes, and distances. These models<br />
would be very useful to public and private decision makers in allocating investment funds<br />
among transportation investment alternatives.<br />
References<br />
Abacus Technology Corporation. Rail vs Truck Fuel Efficiency: The Relative Fuel Efficiency of<br />
Truck Competition Rail Freight and Truck Operations Compared in a Range of Corridors. DOT/<br />
FRA-92/2, Federal Railroad Administration, U.S. Department of <strong>Transportation</strong>, Washington D.C.,<br />
1991.<br />
Association of American Railroads. Personal Communication. Washington D.C. July, 2010.<br />
Baumel, C. Phillip. “Is <strong>the</strong> Era of Cheap Barge Rates Over?” Feedstuffs 81 (40), September 28,<br />
2009.<br />
Baumel, C. Phillip, Charles R. Hurburgh, and Tenpao Lee. “Estimates of Total Fuel Consumption<br />
in Transporting Grain from Iowa to Major Grain-Importing Countries by Alternative Modes and<br />
Routes.” Special Report 90, Agriculture and Home Economics Experiment Station, Iowa State<br />
University, Ames, Iowa, August 1985.<br />
Baumel, C. Phillip, Robert J. Hauser and Jeffrey Beaulieu. “Impact of Inland Waterway User<br />
Charges on Corn, Wheat and Soybean Flows: Study of Inland Waterway User Taxes and Charges.”<br />
National Technical Information Service, U.S. Department of Commerce, PB82-196023, Springfield,<br />
Virginia, March, 1982.<br />
Bernert Barge Lines, Inc. “Save Our Dams.” www.gorge.net/digitaldesigner/bbl/dams.htm.<br />
Accessed July 27, 2010.<br />
Blue Water Shipping Company. “Blue Water Mississippi River Deep Water Corridor Map.” Metairie,<br />
Louisiana.<br />
Burton, Mark L. “Missouri River Navigation Benefits: Incorporating <strong>the</strong> Effects of Air Quality<br />
Improvements.” Prepared for <strong>the</strong> U.S. Army Corps of Engineers, Missouri Division, Attachment to<br />
Affidavit of Mark L Burton, Exhibit 28, MO-ARK Association, Motion to Alter Judgment, Case No.<br />
96 4086-CV-C-66BA, Knox County, State of Tennessee, September 5, 1997.<br />
Cambridge Systematics, Inc. “National Rail Freight Infrastructure Capacity and Investment Study.”<br />
Cambridge, Massachusetts, September, 2007.<br />
87
<strong>Transportation</strong> Fuel Efficiency<br />
Eastman, S. E. “Fuel Efficiency in Freight <strong>Transportation</strong>.” American Waterway Operators, Inc.,<br />
Arlington, Virginia, 1980.<br />
Gervais, Jean-Philippe and C. Phillip Baumel. “Fuel Consumption for Shipping Grain Varies by<br />
Origin and Destination.” Feedstuffs 71 (36), August 30, 1999.<br />
ICF International. Comparative Evaluation of Rail and Truck Fuel Efficiency on Competitive<br />
Corridors. Federal Railroad Administration, U.S. Department of <strong>Transportation</strong>, Washington D.C.,<br />
November, 2009.<br />
Iowa Department of <strong>Transportation</strong>. River Barge Terminal Directory, Revised 2005. www.iowadot.<br />
gov.<br />
IRS. Excise Taxes, Publication 510 (04/2009). www.irs.gov/publications/p510.html.<br />
MapQuest Driving Directions North America, www.mapquest.com/directions.<br />
National Waterways Foundation. “New National Study Compares Freight <strong>Transportation</strong> by Barge,<br />
Truck and Train.” News Release, Arlington, Virginia, July 8, 2008.<br />
Quigley, Leo. “Grain <strong>Transportation</strong>’s Green Alternative.” World Grain, October, 2009.<br />
Texas <strong>Transportation</strong> Institute. “A Modal Comparison of Freight <strong>Transportation</strong> Effects on <strong>the</strong><br />
General Public.” Center for Ports and Waterways, Texas A&M University, Houston, Texas,<br />
December, 2007, Amended July, 2009.<br />
The <strong>Journal</strong> of Commerce and Commercial. “Ship Fixture Breakdown.” 110 Wall Street, New York,<br />
N.Y. 10005 (February 1-July 31 1983 and January 1-July 31, 1998).<br />
U.S. Department of <strong>Transportation</strong>. The Replacement of Alton Locks and Dam 26: An Advisory<br />
Report of <strong>the</strong> U.S. Department of <strong>Transportation</strong> to <strong>the</strong> Senate Commerce Committee. Washington,<br />
D.C. September, 1975.<br />
U.S. Department of <strong>Transportation</strong>. Environmental Advantages of Inland Barge <strong>Transportation</strong>.<br />
Maritime Administration, Washington D.C., August, 1994.<br />
Van Der Kamp, Jerry. Personal Communication. President, AGRI Industries, Ankeny, Iowa,<br />
December, 2010.<br />
Waterways Council, Inc. “Keep America Moving.” Video presentation, Arlington, Virginia,<br />
February 25, 2010.<br />
C. Phillip Baumel is a Charles F. Curtiss Distinguished Professor Emeritus of Economics at Iowa<br />
State University. He received <strong>the</strong> <strong>Transportation</strong> <strong>Research</strong> <strong>Forum</strong>’s Distinguished <strong>Transportation</strong><br />
<strong>Research</strong>er Award in 1993, <strong>the</strong> <strong>Transportation</strong> <strong>Research</strong> <strong>Forum</strong>’s Outstanding <strong>Research</strong> Paper<br />
Awards in 1982, 1989, and 1999, and <strong>the</strong> <strong>Transportation</strong> <strong>Research</strong> <strong>Forum</strong>’s Best Agricultural and<br />
Rural <strong>Transportation</strong> Paper Awards in 1989, 1991, and 1995. He is a Fellow in <strong>the</strong> American<br />
Agricultural Economics Association. Baumel pioneered <strong>the</strong> use of economic network models for<br />
analyzing issues of agricultural product transportation by rail, truck, and barge. He retired in 2003<br />
and currently lives in Iowa (summer) and Arizona (winter).<br />
88
Demand Analysis for Coal on <strong>the</strong> United<br />
States Inland Waterway System: Fully-Modified<br />
Cointegration (FM-OLS) Approach<br />
by Junwook Chi and Jungho Baek<br />
The Phillip-Hansen fully-modified cointegration (FM-OLS) approach is applied to examine <strong>the</strong><br />
dynamic relationship between demand for coal barge transportation, and explanatory variables such<br />
as barge and rail rates, domestic coal consumption and production, and coal exports. The results<br />
provide strong evidence that <strong>the</strong>re exists a long-run equilibrium relationship between demand for coal<br />
barge transportation and <strong>the</strong> selected variables. It is also found that, in <strong>the</strong> long-run, <strong>the</strong> domestic<br />
coal consumption and coal exports are more important than o<strong>the</strong>r variables in determining <strong>the</strong><br />
demand for coal barge transportation. In <strong>the</strong> short run, on <strong>the</strong> o<strong>the</strong>r hand, domestic coal production<br />
is found to be <strong>the</strong> only significant determinant of coal demand. This dynamic analysis will shed new<br />
light on <strong>the</strong> dynamic interrelationships between <strong>the</strong> demand for coal barge transportation and its<br />
major determinants, and contribute to <strong>the</strong> empirical literature on transportation economics.<br />
INTRODUCTION<br />
The United States inland waterways consist of over 12,000 miles of navigable waters, including <strong>the</strong><br />
Mississippi, <strong>the</strong> Ohio River Basin, <strong>the</strong> Gulf Intercoastal Waterway, and <strong>the</strong> Pacific Coast systems<br />
(Clark et al. 2005). The inland waterway system plays a crucial role in supporting <strong>the</strong> nation’s<br />
movements of bulk commodities and raw materials, and barge carriers provide economically sound<br />
and efficient services. In 2007, for example, <strong>the</strong> inland waterway system transported 403 million<br />
tons and 157 billion ton-miles of commodities (Bureau of <strong>Transportation</strong> Statistics 2007). Based on<br />
low transportation costs, such large amounts of freight have long served to increase business and<br />
economic activities, <strong>the</strong>reby contributing to regional economic development.<br />
In <strong>the</strong> literature on transportation economics, a number of studies have been conducted to<br />
examine demand for freight transportation on <strong>the</strong> inland waterway system and to evaluate <strong>the</strong><br />
determinants of barge traffic systems. One branch of literature relates to analyses of barge demand<br />
and grain movements forecasts (Tang 2001, Babcock and Lu 2002, Thoma and Wilson 2004a, Yu<br />
and Fuller 2005, DeVuyst et al. 2009). For example, Tang (2001) uses an autoregressive integrated<br />
moving average (ARIMA) model to forecast soybean and wheat tonnage on <strong>the</strong> McClellan-Kerr<br />
Arkansas River Navigation System; <strong>the</strong> results show small differences between <strong>the</strong> actual and<br />
forecasted soybean and wheat tonnage (less than 10%). Thoma and Wilson (2004a) adopt a vector<br />
error-correction (VEC) model to forecast annual tonnages on <strong>the</strong> Mississippi River; <strong>the</strong>y find that<br />
<strong>the</strong> annual growth rates for <strong>the</strong> upper, mid, and lower Mississippi River segments range from 1.45%<br />
to 3.33% (1.68% as a whole). DeVuyst et al. (2009) employ a spatial optimization model to forecast<br />
grain flows on <strong>the</strong> Mississippi River; <strong>the</strong>y provide evidence that longer-term projections have much<br />
larger errors, due mainly to uncertainty.<br />
Ano<strong>the</strong>r group of studies focuses on transportation rates on <strong>the</strong> inland waterway system<br />
(Harnish and Dunn 1996, Miljkovic et al. 2000, Thoma and Wilson 2004b, Yu et al. 2007, Babcock<br />
and Fuller 2007). For example, Harnish and Dunn (1996) use a reduced-form equation to examine<br />
<strong>the</strong> factors determining grain barge rates on <strong>the</strong> Mississippi River; <strong>the</strong>y conclude that in <strong>the</strong> short<br />
run, grain exports, coal barge rates, input costs, and distance are <strong>the</strong> key determinants of barge<br />
rates on <strong>the</strong> Mississippi River. Thoma and Wilson (2004b) employ a vector autoregressive (VAR)<br />
model to characterize short-run grain movements on <strong>the</strong> Mississippi and Illinois Rivers; <strong>the</strong>y show<br />
89
Demand Analysis for Coal<br />
that barge rates are significantly determined by lockages and rail rates. Babcock and Fuller (2007)<br />
estimate demand for corn and soybean shipment on <strong>the</strong> Ohio River using OLS; <strong>the</strong>y show that corn<br />
and soybean shipments in <strong>the</strong> region are mainly determined by lagged shipments, corn and soybean<br />
stocks, and exports.<br />
Until recently, however, empirical studies have mostly concentrated on assessment of <strong>the</strong><br />
demand for grain barge transportation and barge rates to identify factors affecting grain movements<br />
by barge, as well as barge demand and grain movement forecasts. Accordingly, little attention has<br />
been paid to <strong>the</strong> factors affecting coal shipments and <strong>the</strong> substitution effect between water and<br />
rail carriers for coal shipments. 1 Given that coal is one of <strong>the</strong> primary commodities on <strong>the</strong> inland<br />
waterway system, it is important to fully understand <strong>the</strong> determinants of demand for coal barge<br />
transportation. In 2009, for example, coal accounts for approximately 24% of total commodities<br />
shipped on <strong>the</strong> inland waterway system in <strong>the</strong> United States (U.S. Army Corps of Engineers 2010).<br />
Particularly, coal is <strong>the</strong> highest traffic volume moving within and through <strong>the</strong> Ohio River Basin<br />
because of <strong>the</strong> substantial amount of reserves in <strong>the</strong> region (Clark et al. 2005); in 2008, barge<br />
delivered 123 of <strong>the</strong> 744 coal movements, representing 16.5% of <strong>the</strong> total movements (U.S. Energy<br />
Information Administration 2010). Ano<strong>the</strong>r important point frequently overlooked in <strong>the</strong> literature<br />
is that although some analysts use time-series data/methods (Harnish and Dunn 1996, Miljkovic et<br />
al. 2000, Yu and Fuller 2005), <strong>the</strong>y tend to take little cognizance of <strong>the</strong> unit root problems associated<br />
with level variables. In o<strong>the</strong>r words, those studies use <strong>the</strong> level of each variable in <strong>the</strong>ir regression<br />
analysis without taking into account <strong>the</strong> non-stationarity in <strong>the</strong> data. When data are not stationary,<br />
standard critical values used in determining <strong>the</strong> significance of estimated coefficients are not valid<br />
(Wooldridge 2006). 2 Finally, <strong>the</strong> earlier studies have concentrated on <strong>the</strong> short-run movements on<br />
<strong>the</strong> inland waterway system (Tang 2001, Babcock and Lu 2002, Thoma and Wilson 2004b). Since<br />
<strong>the</strong> short-run effects of barge transportation and barge rates could be different from <strong>the</strong> long-run<br />
effects, it is important to include <strong>the</strong> long-run dynamics in a model.<br />
This paper has attempted to expand <strong>the</strong> scope of previous work by assessing determinants of<br />
demand for coal barge transportation in a dynamic framework of cointegration. The empirical focus<br />
is on identifying <strong>the</strong> dynamic effects of transport rates–such as barge and rail rates, coal production,<br />
coal consumption, and coal exports–on <strong>the</strong> quantity of coal shipped by barge. For this purpose, a<br />
fully-modified cointegration (FM-OLS) technique developed by Phillips and Hansen (1990) is used.<br />
The FM-OLS method is a convenient tool to examine dynamic interactions when variables used in<br />
<strong>the</strong> model are non-stationary I(1) processes. In addition, <strong>the</strong> FM-OLS is less sensitive to changes in<br />
lag structure and performs better for small or finite sample sizes than o<strong>the</strong>r cointegration techniques<br />
(Engle and Granger 1987, Johansen 1988). This dynamic analysis could enhance <strong>the</strong> understanding<br />
of demand for coal barge transportation on <strong>the</strong> U.S. inland waterway system and provide vitally<br />
important information for policymakers and shippers. From a policymaker’s perspective, it is<br />
essential to understand <strong>the</strong> determinants of coal movements to build adequate regional planning and<br />
port capacity. Appropriate planning and investment for <strong>the</strong> inland waterway system can increase <strong>the</strong><br />
capacity of <strong>the</strong> waterway system and efficiency of barge movements, and can reduce <strong>the</strong> time and<br />
costs of coal shipments. From a shipper’s perspective, on <strong>the</strong> o<strong>the</strong>r hand, it is necessary to assess<br />
transportation equipment needs and to develop business plans. Shippers can make labor and capital<br />
investment plans based on <strong>the</strong> determining factors for coal shipments.<br />
The remainder of <strong>the</strong> paper is organized as follows. The next section develops an empirical<br />
model, with a discussion of <strong>the</strong> equation being estimated, <strong>the</strong> FM-OLS approach, and data<br />
description. The third section presents <strong>the</strong> empirical results, focusing on key determinants for coal<br />
barge movements and <strong>the</strong> implications of <strong>the</strong> results. The last section summarizes <strong>the</strong> paper with<br />
concluding remarks.<br />
90
EMPIRICAL METHODOLOGY<br />
Equation to be Estimated<br />
JTRF Volume 50 No. 1, Spring 2011<br />
The demand for barge transportation is typically derived from <strong>the</strong> demand for commodities in<br />
origin and destination regions, known as a derived demand. The demand for coal barge service, for<br />
example, is determined by factors shifting <strong>the</strong> supply curve in coal production regions and demand<br />
curve in coal consumption markets (Boyer 1997). If <strong>the</strong> coal production in origin regions or <strong>the</strong> coal<br />
consumption at destination markets increases, <strong>the</strong> demand for coal barge service tends to increase.<br />
In analyzing factors affecting demand for barge transportation in an empirical work, this paper<br />
relies on a <strong>the</strong>oretical framework developed by Tang (2001) and Yu and Fuller (2005). In its general<br />
form this model specifies <strong>the</strong> demand for barge service as a function of <strong>the</strong> supply (production) of<br />
a commodity at origin, <strong>the</strong> demand (consumption) for a commodity at destination, and price and<br />
service characteristics of barge and competing transportation mode (e.g., barge and rail rates) (see<br />
Tang [2001] for an extensive discussion of <strong>the</strong> demand for barge transportation). In <strong>the</strong> empirical<br />
model used here, <strong>the</strong> standard demand model of barge service is modified in order to examine factors<br />
affecting coal barge demand. The reduced-form equation for <strong>the</strong> quantity of coal transportation<br />
service (TV t ) is specified as follows:<br />
(1) TV t = f(BR t , EX t , DD t , DS t , OT t )<br />
where BR t is <strong>the</strong> coal barge rate; EX t is <strong>the</strong> coal export level; DD t is <strong>the</strong> domestic consumption of<br />
coal; DS t is <strong>the</strong> domestic production of coal; OT t is <strong>the</strong> rate proxy of o<strong>the</strong>r transportation modes.<br />
As noted earlier, for <strong>the</strong> competing transportation mode for coal shipment, rail transportation is<br />
considered as a possible substitute of barge service for coal. 3<br />
To illustrate <strong>the</strong> FM-OLS modeling approach, Equation (1) is <strong>the</strong>n expressed in a log linear<br />
form as follows:<br />
(2) ln(TV t ) = α + β 1 ln(BR t ) + β 2 ln(EX t ) + β 3 ln(DD t ) + β 4 ln(DS t ) + β 5 ln(OT t ) + ɛ t<br />
Since an increase in <strong>the</strong> barge transport rate tends to reduce <strong>the</strong> quantity of coal shipped by barge, it<br />
is expected that β 1 < 0. An increase in coal exports and domestic consumption leads to an increase<br />
in demand for coal; hence, it is expected that β 2 > 0 and β 3 > 0, respectively. Because an increase<br />
in <strong>the</strong> production of coal from coal mines causes an increase in coal demand for barge service, it<br />
is expected that β 4 > 0. Unlike <strong>the</strong> four variables, <strong>the</strong> expected sign of rail rates is ambiguous and<br />
uncertain. In general, water and rail services are considered as substitutes for freight shipments in<br />
long hauls, suggesting that an increase in rail rates can be positively associated with barge freight<br />
volume. However, <strong>the</strong> substitutability between water and rail services depends on many factors, such<br />
as <strong>the</strong> type of commodities, <strong>the</strong> location of origin and destination, and <strong>the</strong> availability of loading/<br />
unloading and switching facilities. If a rail service is not physically available or economically viable<br />
for <strong>the</strong> coal barge movements, a shift in rail rates may not lead to a change in <strong>the</strong> quantity of coal for<br />
barge service (i.e., independent service). As such, <strong>the</strong> expected sign of <strong>the</strong> rail rate in Equation (2) is<br />
not predetermined, due mainly to insufficient information on <strong>the</strong> substitutability between <strong>the</strong>se two<br />
modes for coal shipments. 4<br />
The FM-OLS Approach<br />
The fully-modified cointegration (FM-OLS) method developed by Phillips and Hansen (1990) is<br />
used to examine factors affecting coal barge demand. The FM-OLS model is an alternative dynamic<br />
model to obtain an unbiased estimate of <strong>the</strong> long-run relationship when <strong>the</strong> underlying regressors<br />
are nonstationary I(1) processes. 5 Note that, unlike OLS, <strong>the</strong> FM-OLS approach does not require<br />
91
Demand Analysis for Coal<br />
differencing of nonstationary variables to make <strong>the</strong>m stationary; hence, this method keeps valuable<br />
information concerning long-run properties inherent in <strong>the</strong> levels of time-series data (Perman 1991).<br />
The FM-OLS uses an econometric model as follows:<br />
(3)<br />
where y t is I(1) variable (in this paper, y t = TV t , where TV t is <strong>the</strong> quantity of coal transportation<br />
service); and x t is (k×1) vector of I(1) regressors (i.e., x t = BR t , EX t , DD t , DS t , OT t where BR t is<br />
<strong>the</strong> coal barge rate; EX t is <strong>the</strong> coal export level; DD t is <strong>the</strong> domestic consumption of coal; DS t is<br />
<strong>the</strong> domestic production of coal; OT t is <strong>the</strong> rate proxy of o<strong>the</strong>r transportation modes), which are<br />
assumed not to be cointegrated among <strong>the</strong>mselves. Additionally, x t is assumed to have <strong>the</strong> following<br />
first-difference stationary process:<br />
(4) Δ x t = µ + v t<br />
where µ is (k×1) vector of drift parameters; 6 v is (k×1) vector of I(0), or stationary variables. It is<br />
t<br />
also assumed that is strictly stationary with zero mean and a finite positive-definite<br />
covariance matrix, Ʃ.<br />
'<br />
The OLS estimators of α and β 1 in Equation (3) are consistent even if x and ɛ (equivalently v and<br />
t t t<br />
ɛ ) are contemporaneously correlated (Engle and Granger 1987; Stock 1987). t 7 In general, however,<br />
<strong>the</strong> OLS regression involving non-stationary variables no longer provides <strong>the</strong> valid interpretations<br />
of <strong>the</strong> standard statistics such as t- and F-statistics in Equation (3). Fur<strong>the</strong>r, unless non-stationary<br />
variables combine with o<strong>the</strong>r non-stationary variables to form stationary cointegration relationships,<br />
<strong>the</strong> estimation can falsely represent <strong>the</strong> existence of a meaningful economic relationship (i.e.,<br />
spurious regression) (Harris and Sollis 2003). To address <strong>the</strong>se problems adequately, it is necessary<br />
to correct <strong>the</strong> possible correlation between v and ɛ , and <strong>the</strong>ir lagged values. The Phillips-Hansen<br />
t t<br />
FM-OLS estimator takes account of <strong>the</strong>se correlations in a semi-parametric manner. As a result, <strong>the</strong><br />
FM-OLS is an optimal single-equation technique for estimating with I(1) variables (Phillips and<br />
Loretan 1991).<br />
It is worth mentioning that <strong>the</strong> non-stationarity of time-series data can be first-differenced ra<strong>the</strong>r<br />
than in levels in a framework of OLS. First-difference, however, may lose valuable information<br />
concerning long-run properties inherent in <strong>the</strong> levels of time-series data (Perman 1991). Therefore,<br />
with <strong>the</strong> long-run information embedded in <strong>the</strong> levels data <strong>the</strong> cointegration approach (i.e., FM-<br />
OLS) offers a solution to this dilemma.<br />
Data<br />
The U.S. Department of Energy (DOE) is <strong>the</strong> primary data source for this paper. The coal domestic<br />
tonnages by barge (measured in million tons) are obtained from Coal <strong>Transportation</strong>: Rates<br />
and Trends in <strong>the</strong> United States (U.S. Energy Information Administration 2004). Domestic coal<br />
consumption, production, and exports (measured in million tons) are taken from <strong>the</strong> EIA. Average<br />
barge and rail rates (measured in U.S. $ per ton) are also collected from <strong>the</strong> EIA, which are originally<br />
complied by <strong>the</strong> Federal Energy Regulatory Commission (FERC). 8 The GDP deflator (2000=100) is<br />
used to derive real barge and rail rates. The data set contains 23 annual observations for <strong>the</strong> period<br />
1979 to 2001. All variables are in natural logarithms.<br />
It should be pointed out that <strong>the</strong> 1979-2001 period is currently <strong>the</strong> best data available for <strong>the</strong><br />
analysis as <strong>the</strong> EIA has not yet updated <strong>the</strong> relevant dataset. 9 For this reason, <strong>the</strong> sample size could be<br />
a concern for validation of <strong>the</strong> dynamic relationships estimated by our empirical model; <strong>the</strong> findings<br />
should thus be viewed with caution. As Hargreaves (1994) notes, however, <strong>the</strong> FM-OLS procedure<br />
has been proven to have superior small sample properties, which makes it a good choice for our<br />
92
JTRF Volume 50 No. 1, Spring 2011<br />
sample than o<strong>the</strong>r cointegration techniques (e.g., Engle and Granger 1987, Johansen 1988); this<br />
should mitigate <strong>the</strong> concern with <strong>the</strong> relatively short period of data coverage and provide credibility<br />
of our findings.<br />
EMPIRICAL RESULTS<br />
The first requirement for application of <strong>the</strong> FM-OLS cointegration procedure is that <strong>the</strong> variables<br />
in Equation (2) must be non-stationary with I(1) processes. The presence of a unit root in <strong>the</strong> six<br />
variables is determined using <strong>the</strong> Dickey-Fuller generalized least squares (DF-GLS) test (Elliot et<br />
al. 1996). The DF-GLS test optimizes <strong>the</strong> power of <strong>the</strong> ADF test using a form of detrending. As<br />
Elliott et al. (1996, p. 813) note: “Monte Carlo experiments indicate that <strong>the</strong> DF-GLS works well in<br />
small samples and has substantially improved power when an unknown mean or trend is present.”<br />
Recently, Ng and Perron (2001) produced a testing procedure which incorporates both <strong>the</strong> new<br />
information criterion for setting <strong>the</strong> lag length and GLS detrending. The results show that, with <strong>the</strong><br />
level series, <strong>the</strong> null hypo<strong>the</strong>sis of non-stationarity cannot be rejected for all six variables at <strong>the</strong> 5%<br />
level (Table 1). With <strong>the</strong> first-differenced series, on <strong>the</strong> o<strong>the</strong>r hand, all <strong>the</strong> variables are found to be<br />
stationary; hence, this analysis concludes that all <strong>the</strong> variables are non-stationary I(1) processes. The<br />
DF-GLS test statistics are estimated from a model that includes a constant and a trend variable. The<br />
lag lengths are selected using Schwarz criterion (SC).<br />
Table 1: Results of Unit Root Testa Variable Level First difference Decision<br />
ln (TV ) t<br />
-1.910<br />
(1)<br />
-5.701*<br />
(0)<br />
I (1)<br />
ln (BR ) t<br />
-2.516<br />
(0)<br />
-4.960*<br />
(0)<br />
I (1)<br />
ln (EX ) t<br />
-2.405<br />
(0)<br />
-3.941**<br />
(0)<br />
I (1)<br />
ln (DD ) t<br />
-2.777<br />
(0)<br />
-5.913**<br />
(1)<br />
I (1)<br />
ln (DS ) t<br />
-2.604<br />
(1)<br />
-7.455*<br />
(0)<br />
I (1)<br />
ln (OT ) t<br />
-2.666<br />
(1)<br />
-4.603**<br />
(0)<br />
I (1)<br />
a TVt , BR EX , DD , DS , and OT represent <strong>the</strong> total volume of coal, barge rates, quantity of coal exports,<br />
t t t t t<br />
quantity of domestic demand of coal, quantity of domestic supply of coal and rail rates, respectively. * and<br />
** denote <strong>the</strong> rejection of <strong>the</strong> null hypo<strong>the</strong>sis of non-stationarity at <strong>the</strong> 10% and 5% significance levels,<br />
respectively. The 10% and 5% critical values for <strong>the</strong> DF-GLS, including a constant and a trend, are -2.890 and<br />
-3.190, respectively. Paren<strong>the</strong>ses are lag lengths, which are chosen by <strong>the</strong> Schwarz criterion (SC).<br />
With evidence that each of <strong>the</strong> data series is a non-stationary I(1) process, <strong>the</strong> FM-OLS is<br />
applied to estimate <strong>the</strong> long-run relationship in Equation (2). First of all, <strong>the</strong> result of <strong>the</strong> DF-GLS<br />
test performed on <strong>the</strong> residual from <strong>the</strong> estimated Equation (2) shows that <strong>the</strong> null hypo<strong>the</strong>sis can<br />
be rejected at <strong>the</strong> 5% significance level (Table 2), suggesting <strong>the</strong> existence of long-run relationships<br />
between TV t and <strong>the</strong> set of explanatory variables (BR t , EX t , DD t , DS t , and OT t ) in Equation (2). In<br />
o<strong>the</strong>r words, even though individual series may have trends or cyclical or seasonal variations, <strong>the</strong><br />
movements in one variable are matched (at least approximately) by movements in o<strong>the</strong>r variables<br />
(Perman 1991).<br />
93
Additionally, <strong>the</strong> results shows that <strong>the</strong> barge rate is not statistically significant even at <strong>the</strong> 10%<br />
level, indicating that in <strong>the</strong> long run a change in barge rates has little effect on <strong>the</strong> quantity of coal<br />
shipped by barge (Table 2). One plausible explanation for <strong>the</strong> finding is that, since barge rates are<br />
substantially lower than <strong>the</strong> rates of alternative transportation modes (i.e., rail rates), barge is <strong>the</strong><br />
only economically viable transportation option for coal movements in <strong>the</strong> current system of <strong>the</strong><br />
U.S. inland waterways, regardless of barge rate fluctuations. 10 Similarly, <strong>the</strong> rail rate is found to be<br />
statistically insignificant at <strong>the</strong> 10% level, suggesting that rail rates play little role in influencing <strong>the</strong><br />
quantity of coal shipped by barge transportation in <strong>the</strong> long run. One explanation for this finding is<br />
that, while water transportation generally has a service disadvantage (i.e., slow transit time), its better<br />
accessibility from coal mines to coal-fueled power plants tends to reduce <strong>the</strong> substitution effect to<br />
rail service. 11 This may allow <strong>the</strong> demand for coal barge transportation to be highly insensitive to a<br />
change in rail rates. On <strong>the</strong> o<strong>the</strong>r hand, <strong>the</strong> quantity of coal exports is found to have a significantly<br />
positive long-run relationship with <strong>the</strong> volume of coal barge movements; for example, a 1% increase<br />
in exports causes barge shipments of coal to increase by approximately 0.38%. The quantity of<br />
domestic demand for coal is also found to have a significantly positive long-run relationship with<br />
<strong>the</strong> quantity of coal barge service; for example, coal barge shipments increase by approximately<br />
2.14%, given a 1% increase in <strong>the</strong> quantity of domestic demand of coal. However, <strong>the</strong> quantity of<br />
domestic supply of coal has little effect on <strong>the</strong> demand for coal barge service. Hence, <strong>the</strong> findings<br />
show that <strong>the</strong> demand for coal barge transportation is mostly determined by demand for coal at<br />
domestic and international destinations, ra<strong>the</strong>r than <strong>the</strong> supply of coal or barge and rail rates.<br />
Table 2: Result of <strong>the</strong> Fully-Modified OLS (FM-OLS) Estimationa Variable<br />
Coefficient<br />
ln (TV ) t<br />
-statistic<br />
ln (BR ) t 0.084 0.536<br />
ln (EX ) t 0.381 2.137**<br />
ln (DD ) t 2.137 2.175**<br />
ln (DS ) t -0.037 -0.045<br />
ln (OT ) t 0.001 0.003<br />
Constant -12.573 -2.796**<br />
DF-GLS statistic -4.699 [0]**<br />
a TVt , BR t EX t , DD t , DS t , and OT t represent <strong>the</strong> total volume of coal, barge rates, quantity of coal exports,<br />
quantity of domestic demand of coal, quantity of domestic supply of coal and rail rates, respectively. * and<br />
** denote significance at <strong>the</strong> 10% and 5% levels, respectively. A bracket in <strong>the</strong> DF-GLS statistic is lag length.<br />
The 10% and 5% critical values for <strong>the</strong> DF-GLS, including a constant and a trend, are -2.890 and -3.190,<br />
respectively.<br />
For completeness, <strong>the</strong> error-correction model (ECM) is also estimated using <strong>the</strong> residual<br />
obtained from Equation (2) in order to examine <strong>the</strong> short-run adjustment to <strong>the</strong> long-run steady<br />
state, as well as to confirm <strong>the</strong> existence of <strong>the</strong> cointegration relationship (Table 3). The results show<br />
that <strong>the</strong> coefficient of <strong>the</strong> error-correction term (ec t‒1 ) is negative and statistically significant at <strong>the</strong><br />
5% level. The negatively significant coefficient of ec t‒1 implies that <strong>the</strong> equilibrium relationship will<br />
hold in <strong>the</strong> long run, even with shocks to <strong>the</strong> system. Additionally, <strong>the</strong> statistically significant ec t‒1<br />
fur<strong>the</strong>r supports <strong>the</strong> validity of cointegrating relationship in Equation (2). The multivariate diagnostic<br />
tests on <strong>the</strong> estimated model as a system indicate no serious problems with serial correlation,<br />
heteroskedasticity, and normality; hence, <strong>the</strong> model is well defined. Notice that <strong>the</strong> domestic supply<br />
of coal is only found to have a significantly positive effect on <strong>the</strong> demand, indicating that <strong>the</strong> supply<br />
of coal is a crucial determinant of <strong>the</strong> demand for coal barge transportation in <strong>the</strong> short run.<br />
94
Table 3: Result of Error-Correction Model (ECM) a<br />
Variable<br />
JTRF Volume 50 No. 1, Spring 2011<br />
Δln (TV t )<br />
Coefficient -statistic<br />
Δln (BR t ) 0.312 1.46<br />
Δln (EX t ) -0.071 -0.29<br />
Δln (DD t ) -1.286 -0.78<br />
Δln (DS t ) 1.831 2.31**<br />
Δln (OT t ) 0.861 1.13<br />
Constant<br />
ec t-1<br />
Serial correlation<br />
Heteroskedasticity<br />
Normality<br />
RESET<br />
0.033<br />
-0.989<br />
0.444 [0.652]<br />
0.003 [0.954]<br />
0.741 [0.954]<br />
0.894 [0.362]<br />
0.586<br />
-3.31**<br />
a TVt , BR t EX t , DD t , DS t , and OT t represent <strong>the</strong> total volume of coal, barge rates, quantity of coal exports,<br />
quantity of domestic demand of coal, quantity of domestic supply of coal and rail rates, respectively. * and **<br />
denote significance at <strong>the</strong> 10% and 5% levels, respectively. A bracket in <strong>the</strong> DF-GLS statistic is lag length. The<br />
10% and 5% critical values for <strong>the</strong> DF-GLS, including a constant and a trend, are -2.890 and -3.190, respectively.<br />
Serial correlation of <strong>the</strong> residuals of a whole system is examined using <strong>the</strong> F -form of <strong>the</strong> Lagrange-Multiplier<br />
(LM) test. Heteroskedasticity is tested using <strong>the</strong> F -form of <strong>the</strong> LM test. Normality of <strong>the</strong> residuals is tested<br />
with <strong>the</strong> Doornik-Hansen test (Doornik and Hendry 1994). Statistics in brackets are p -values.<br />
CONCLUDING REMARKS<br />
This paper explores <strong>the</strong> demand for coal barge transportation on <strong>the</strong> U.S. inland waterway system<br />
in a cointegration framework. Previous studies have mostly examined <strong>the</strong> demand for grain barge<br />
transportation and barge rates, but little attention has been given to factors determining coal barge<br />
shipments and <strong>the</strong> substitution effect between water and rail services for coal shipments. Using a<br />
FM-OLS approach, this paper examines <strong>the</strong> dynamic interrelationships between <strong>the</strong> demand for<br />
coal barge transportation and barge rates, rail rates, domestic coal consumption, domestic coal<br />
production, and coal exports. The results of <strong>the</strong> FM-OLS suggest that <strong>the</strong>re is one stable long-run<br />
equilibrium relationship between <strong>the</strong> demand for coal barge transportation and <strong>the</strong> selected variables.<br />
The negatively significant coefficient of <strong>the</strong> error-correction term in <strong>the</strong> vector error-correction<br />
model fur<strong>the</strong>r validates <strong>the</strong> existence of an equilibrium relationship among <strong>the</strong> variables. The results<br />
also show that, in <strong>the</strong> long run, <strong>the</strong> demand for coal barge transportation is mostly responsive to <strong>the</strong><br />
domestic coal exports and domestic coal consumption, ra<strong>the</strong>r than barge and rail rates. In <strong>the</strong> short<br />
run, on <strong>the</strong> o<strong>the</strong>r hand, domestic coal production is <strong>the</strong> only significant determinant of <strong>the</strong> demand<br />
for coal barge transportation.<br />
Currently, <strong>the</strong> U.S. Army Corps of Engineers (USACE) builds, maintains, and plans all<br />
infrastructure needs for <strong>the</strong> inland waterway system, yet insufficient information hinders its ability<br />
to develop <strong>the</strong> comprehensive regional investment plans to support freight movements and energize<br />
<strong>the</strong> economy. The information derived from this paper may help policymakers develop better<br />
infrastructure strategies and improve investment decisions for <strong>the</strong> inland waterway system. The<br />
U.S. inland waterway system has 230 lock sites, which include 275 lock chambers that support coal<br />
shipments. The crucial factors identified in this paper can be used to help predict coal traffic at lock<br />
sites in <strong>the</strong> short and long run and assess <strong>the</strong> lock investment projects. For barge carriers, on <strong>the</strong><br />
o<strong>the</strong>r hand, <strong>the</strong> information obtained from this paper will be valuable in implementing <strong>the</strong>ir labor<br />
and capital investment plans.<br />
95
Demand Analysis for Coal<br />
Finally, it should be pointed out that, although this study conjectures that more disaggregated<br />
demand structures (data) is both desirable and necessary to provide more useful information about<br />
investment decisions for <strong>the</strong> inland waterway system, limited data availability does not allow<br />
making future analysis to examine <strong>the</strong> validity of this conjecture. In addition, this paper does not<br />
consider major policy and market shocks in <strong>the</strong> model that may result in a significant change in<br />
<strong>the</strong> demand for coal barge transportation. For example, does <strong>the</strong> partial deregulation (or mergers)<br />
of railroad companies in <strong>the</strong> United States affect demand for barge transportation? How does <strong>the</strong><br />
Clean Air Act Amendment of 1990 influence shipments of coal volumes transported via <strong>the</strong> inland<br />
waterway system? All <strong>the</strong>se issues should be addressed in future research.<br />
Endnotes<br />
1. Water carriers are known to compete with rail carriers for <strong>the</strong> shipments of bulk commodities<br />
for long hauls. While water and rail transportation modes are empirically found to be partial<br />
substitutes for grain movements (e.g., Miljkovic et al. 2000), <strong>the</strong> substitution effects between<br />
<strong>the</strong>se two modes have not been investigated for coal barge shipments.<br />
2. Some of <strong>the</strong> previous literature has indeed investigated <strong>the</strong> presence of a unit root in <strong>the</strong>ir timeseries<br />
variables using <strong>the</strong> augmented Dickey-Fuller (ADF) test (Thoma and Wilson 2004a, Yu<br />
et al. 2007). However, when dealing with finite samples, <strong>the</strong> power of <strong>the</strong> standard ADF test is<br />
known to be notoriously low (Maddala and Kim 1998, Harris and Sollis 2003). In o<strong>the</strong>r words,<br />
<strong>the</strong> ADF test has high probability of accepting <strong>the</strong> null hypo<strong>the</strong>sis of non-stationarity when <strong>the</strong><br />
true data-generating process is, in fact, stationary. Therefore, to overcome <strong>the</strong> shortcoming of<br />
<strong>the</strong> ADF, this paper adopts a more powerful test known as <strong>the</strong> Dickey-Fuller generalized least<br />
squares (DF-GLS) detrended test.<br />
3. In this paper, truck transportation is not considered as a substitute of barge service for coal<br />
shipments, because truck transportation is not an economical transportation option for bulk<br />
commodities and raw materials for long hauls.<br />
4. It is worth mentioning that <strong>the</strong> FM-OLS uses a cointegration framework to take into account <strong>the</strong><br />
non-stationarity in <strong>the</strong> series as well as potential endogeneity of <strong>the</strong> explanatory variables and<br />
serial correlation of <strong>the</strong> error term. More specifically, in general, TV t and BR t are endogenously<br />
determined in equation (2); by definition, BR t in this case is likely to be correlated with <strong>the</strong><br />
error term ɛ t , which causes <strong>the</strong> OLS estimators to be biased. Additionally, when using <strong>the</strong><br />
traditional OLS, <strong>the</strong> Durbin-Watson (D-W) test shows that equation (2) is suffering from AR(1)<br />
serial correlation at <strong>the</strong> 5% level. To solve <strong>the</strong>se problems, this paper uses <strong>the</strong> FM-OLS to<br />
estimate equation (2). Hargreaves (1994) demonstrates that, particularly in small samples, <strong>the</strong><br />
FM-OLS has been proven to be a fully efficient method of estimating <strong>the</strong> long-run equilibrium<br />
(cointegration) relationship.<br />
5. A stationary series, or integrated of order zero (I(0)) is defined as a series that tends to return<br />
to its mean value and fluctuate around it within a more or less constant range. A non-stationary<br />
series (unit roots), on <strong>the</strong> o<strong>the</strong>r hand, is defined as a series that has a different mean at different<br />
points in time and its variance increases with <strong>the</strong> sample size (Harris and Sollis 2003). Since<br />
OLS regression with non-stationary series no longer provides <strong>the</strong> valid interpretations of <strong>the</strong><br />
standard statistics (i.e., t - and F -statistics), non-stationary variables should be differentiated<br />
to make <strong>the</strong>m stationary. Integrated of order one, I(1), is a time-series process that needs to<br />
be first-differenced to produce a stationary series, or I(0), which is often said to be a (first)<br />
difference-stationary process (Wooldridge 2006). The first difference of a time series means <strong>the</strong><br />
series of changes from one period to <strong>the</strong> next. However, Engle and Granger (1987) show that,<br />
96
JTRF Volume 50 No. 1, Spring 2011<br />
even in <strong>the</strong> case that all <strong>the</strong> variables in a model are non-stationary (i.e., I(1)), it is possible for a<br />
linear combination of integrated variables to be stationary (i.e., I(0)); in this case, <strong>the</strong> variables<br />
are said to be cointegrated.<br />
6. A drift parameter is usually said to be a random walk with drift. A random walk means a<br />
time series process where next period’s value is obtained as current period’s value, plus an<br />
independent error term. A random walk with drift means a random walk that has a constant (or<br />
trend) added in each period (Wooldridge 2006).<br />
7. The explanatory (independent) variables and error terms are correlated in <strong>the</strong> same time period<br />
(Woodridge 2006). An explanatory variable is a variable that is used to explain variation in <strong>the</strong><br />
dependent variable. An error term means a variable that contains unobserved factors that affect<br />
<strong>the</strong> dependent variable.<br />
8. EIA collected coal transportation rates primarily from coal burning utilities and <strong>the</strong>y are not<br />
necessarily available to industrial customers that tend to purchase coal under smaller supply<br />
contracts. According to EIA (2004), <strong>the</strong> weighted average rates are actual averages as individual<br />
rates and mine price outliers are not included. The rates represent coal delivered under contract<br />
and excludes coal deliveries scheduled for 12 or fewer months, commonly referred to as spot<br />
coal purchases.<br />
9. River Transport News (1993-current) could be used as an alternative rate data source but it is<br />
difficult to estimate <strong>the</strong> annual average rates from <strong>the</strong> insufficient number of <strong>the</strong> samples.<br />
10. In 2000, for example, <strong>the</strong> average domestic barge rates for coal and rail per ton are $2.26 and<br />
$10.30, respectively (U.S. Energy Information Administration 2004).<br />
11. U.S. Army Corps of Engineers (2005) reports that in <strong>the</strong> case of lock closure at McAlpine on<br />
<strong>the</strong> Ohio River in Louisville, Kentucky, <strong>the</strong> most frequent response from survey respondents<br />
is to wait until lock operation resumes and do not switch to rail service. High rail rates and<br />
inaccessibility to loading/unloading rail facilities restrain <strong>the</strong> shippers’ ability to switch <strong>the</strong>ir<br />
transportation modes.<br />
References<br />
Babcock, M.W. and X. Lu. “Forecasting Inland Waterway Grain Traffic.” <strong>Transportation</strong> <strong>Research</strong><br />
Part E 38 (1), (2002): 65-74.<br />
Babcock, M.W. and S. Fuller. “A Model of Corn and Soybean Shipments on <strong>the</strong> Ohio River.”<br />
<strong>Journal</strong> of <strong>the</strong> <strong>Transportation</strong> <strong>Research</strong> <strong>Forum</strong> 46 (2), (2007): 21-34.<br />
Boyer, K.D. Principles of <strong>Transportation</strong> Economics. Addison Wesley, Reading, MA, 1997.<br />
Bureau of <strong>Transportation</strong> Statistics. Shipment Characteristics by Mode of <strong>Transportation</strong> for <strong>the</strong><br />
United States: 2007. U.S. Department of <strong>Transportation</strong>. www.bts.gov. 2007.<br />
Clark, C., K.E. Henrickson, and P. Thoma. An Overview of <strong>the</strong> U.S. Inland Waterway System. U.S.<br />
Army Corp of Engineers, Alexandria, VA, 2005.<br />
DeVuyst, E., W.W. Wilson, and B. Dahl. “Longer-term Forecasting and Risks in Spatial Optimization<br />
Models: <strong>the</strong> World Grain Trade.” <strong>Transportation</strong> <strong>Research</strong> Part E 45, (2009): 472-485.<br />
97
Demand Analysis for Coal<br />
Doornik, J. and D. Hendry. Interactive Econometric Modeling of Dynamic System (PcFiml 8.0).<br />
International Thomson Publishing, London, UK, 1994.<br />
Elliott, G., T. Ro<strong>the</strong>nberg, and J. Stock, “Efficient Tests for an Autoregressive Unit Root.”<br />
Econometrica 64, (1996): 813–836.<br />
Engle, R.F. and C.W.J. Granger. “Co-Integration and Error Correction: Representation, Estimation,<br />
and Testing.” Econometrica 55, (1987): 251-276.<br />
Hargreaves, C.P. Non-stationarity Time-Series Analysis and Cointegration. Oxford University<br />
Press, Oxford, UK, 1994.<br />
Harnish, G.L. and J.W. Dunn. “A Short-Run Analysis of Grain Barge Rates on <strong>the</strong> Mississippi<br />
River System.” Proceedings of <strong>the</strong> 38th Annual Meeting of <strong>the</strong> <strong>Transportation</strong> <strong>Research</strong> <strong>Forum</strong>. San<br />
Antonio, Texas, 1996.<br />
Harris, R. and R. Sollis. Applied Time Series Modeling and Forecasting. John Wiley and Sons, Inc.,<br />
West Sussex, England, 2003.<br />
Johansen, S. “Statistical Analysis of Cointegration Vector.” <strong>Journal</strong> of Economic Dynamics and<br />
Control 12, (1988): 231-254.<br />
Maddala, G.S. and I.M. Kim. Unit Roots, Cointegration, and Structural Change. Cambridge<br />
University Press, Cambridge, UK, 1998.<br />
Miljkovic, D., G.K. Price, R.J. Hauser, and K.A. Algozin. “The Barge and Rail Freight Market<br />
for Export-Bound Grain Movement from Midwest to Mexican Gulf: an Econometric Analysis.”<br />
<strong>Transportation</strong> <strong>Research</strong> Part E 36 (2), (2000): 127-137.<br />
Ng, S. and P. Perron. “Lag Length Selection and <strong>the</strong> Construction of Unit Root Tests With Good Size<br />
and Power.” Econometrica 69, (2001): 1519-1554.<br />
Perman, R. “Cointegration: An Introduction to <strong>the</strong> Literature.” <strong>Journal</strong> of Economic Studies 18,<br />
(1991): 3-30.<br />
Philips, P.C.B. and B.E. Hansen. “Statistical Inference in Instrumental Variables Regressions with<br />
I(1) Processes.” The Review of Economic Studies 57, (1990): 99-125.<br />
Philips, P.C.B. and M. Loretan. “Estimating Long-run Economic Equilibria.” The Review of<br />
Economic Studies 58, (1991): 407-436.<br />
Stock, J.H. “Asymptotic Properties of Least Squares Estimators of Cointegrating Vectors.”<br />
Econometrica 55, (1987): 1035-1056.<br />
Tang, X. “Time Series Forecasting of Quarterly Barge Grain Tonnage on <strong>the</strong> McClellan-Kerr<br />
Arkansas River Navigation System.” <strong>Transportation</strong> Quarterly 40, (2001): 91-108.<br />
Thoma, M. and W.W. Wilson. Long-Run Forecasts of River Traffic on <strong>the</strong> Inland Waterway System.<br />
U.S. Army Corps of Engineers, Alexandria, VA, 2004a.<br />
Thoma, M. and W.W. Wilson. A Study of Short-Run Grain Movements on <strong>the</strong> Inland Waterway<br />
System. U.S. Army Corps of Engineers, Alexandria, VA, 2004b.<br />
U.S. Army Corps of Engineers. McAlpine Lock Closure in August 2004: Shipper and Carrier<br />
Response. U.S. Army Corps of Engineers, Alexandria, VA, 2005.<br />
98
JTRF Volume 50 No. 1, Spring 2011<br />
U.S. Army Corps of Engineers. The U.S. Waterway System <strong>Transportation</strong> Facts & Information.<br />
U.S. Army Corps of Engineers, Waterborne Commerce Statistics Center, New Orleans, LA, 2010.<br />
U.S. Energy Information Administration. Coal <strong>Transportation</strong> Rates and Trends in <strong>the</strong> United<br />
States. U.S. Department of Energy. www.eia.doe.gov., 2004.<br />
U.S. Energy Information Administration. Annual Coal Distribution. U.S. Department of Energy.<br />
www.eia.doe.gov., 2010.<br />
Woodridge, J.M. Introductory Econometrics: A Modern Approach. South-Western College<br />
Publishing, Mason, OH, 2006.<br />
Yu, T. and S.W. Fuller. “The Measurement of Grain Barge Demand on Inland Waterways: a Study<br />
of <strong>the</strong> Mississippi River.” <strong>Journal</strong> of <strong>the</strong> <strong>Transportation</strong> <strong>Research</strong> <strong>Forum</strong> 44 (1), (2005): 27-39.<br />
Yu, T.H., D.A. Bessler, and S.W. Fuller. “Price Dynamics in U.S. Grain and Freight Markets.”<br />
Canadian <strong>Journal</strong> of Agricultural Economics 55, (2007): 381-397.<br />
Junwook Chi is a transportation economist in Nick J. Rahall, II Appalachian <strong>Transportation</strong><br />
Institute and Center for Business and Economic <strong>Research</strong> at Marshall University. He received his<br />
Ph.D. in transportation and logistics from North Dakota State University. His specialty area of<br />
research is transportation economics and regional economic development. He currently manages<br />
<strong>the</strong> multi-year transportation research and economic development projects for <strong>the</strong> U.S. Army Corps<br />
of Engineers and West Virginia Department of <strong>Transportation</strong>. He is also an instructor in Lewis<br />
College of Business at Marshall University and teaches an Economics of <strong>Transportation</strong> course.<br />
He received <strong>the</strong> awards for “2008 Best Graduate Student Paper” from <strong>the</strong> <strong>Transportation</strong> <strong>Research</strong><br />
<strong>Forum</strong> and “2002 Outstanding Master’s Thesis” from <strong>the</strong> Canadian Agricultural Economics<br />
Association.<br />
Jungho Baek is an assistant professor of economics in School of Management at University of<br />
Alaska Fairbanks (UAF). He received his Ph.D. from Michigan State University in 2004. Prior to<br />
UAF, he has conducted research for <strong>the</strong> Korea Institute for International Economic Policy (KIEP),<br />
in South Korea, and <strong>the</strong> Center for Agricultural Policy and Trade Studies (CAPTS), at North Dakota<br />
State University. His principal areas of research are international trade and policies, transportation<br />
economics, environmental economics, and econometric modeling. His work in <strong>the</strong>se areas has been<br />
presented at various professional conferences and published in international refereed journals.<br />
99
100
State-of-<strong>the</strong>-Art: Centerline Rumble Strips<br />
Usage in <strong>the</strong> United States<br />
by Daniel E. Karkle , Margaret J. Rys, and Eugene R. Russell<br />
Centerline Rumble Strips (CLRS) are used to avoid cross-over roadway departures, making rural<br />
highways safer. The objectives of this study were to obtain nationwide, updated information about<br />
states’ policies and guidelines for utilization of CLRS and to provide a list of gaps in research<br />
along with good practices. Results indicate that 36 states reported <strong>the</strong> use of CLRS. The total CLRS<br />
approximate mileage is 11,333 miles. The predominant CLRS pattern is: milled, length 16”, width<br />
7”, depth 0.5”, spacing 12”, continuous. This survey reported that 17 states have written policies<br />
or guidelines. A list of good practices used by <strong>the</strong> states is presented.<br />
INTRODUCTION<br />
Roadway departure fatalities are a serious problem in <strong>the</strong> United States. A roadway departure crash<br />
is defined as a non-intersection crash which occurs after a vehicle leaves <strong>the</strong> traveled way, crossing<br />
<strong>the</strong> center line of undivided highways, or crossing an edge line (longitudinal pavement marking<br />
located at <strong>the</strong> edge of <strong>the</strong> traveled lane and <strong>the</strong> shoulder) of <strong>the</strong> roadway. Roadway departures<br />
are usually severe and involve run-off-<strong>the</strong>-road (ROR), sideswipes, and head-on crashes. There<br />
are many contributing factors for <strong>the</strong> occurrence of roadway departures, and <strong>the</strong> principal of <strong>the</strong>m<br />
are driver drowsiness, fatigue, alcohol/drug impairment, and inattention, along with poor visibility<br />
caused by inclement wea<strong>the</strong>r. Roadway departure crashes account for <strong>the</strong> majority of rural highway<br />
fatalities. According to data from <strong>the</strong> Fatality Analysis Reporting System (FARS), in 2009 <strong>the</strong>re<br />
were 11,185 fatal roadway departure crashes on rural highways, resulting in 23,169 fatalities<br />
(NHTSA 2009). Fur<strong>the</strong>rmore, roadway departure crashes correspond to approximately 40% of all<br />
crashes in <strong>the</strong> United States, and <strong>the</strong> estimated annual cost of roadway departure crashes is $100<br />
billion (FWHA 2003).<br />
In order to reduce <strong>the</strong> number of roadway departure crashes, since 1955, several state<br />
departments of transportation have installed rumble strips and o<strong>the</strong>r accidents countermeasures on<br />
U.S. highways (Carlson and Miles 2003).<br />
Rumble strips are raised or indented patterns utilized to alert drivers that <strong>the</strong>y are moving out of<br />
<strong>the</strong> travel lane. When vehicles’ tires pass over <strong>the</strong> rumble strips, noise and vibration are produced by<br />
this contact, which provides motorists with a warning that <strong>the</strong>y are leaving <strong>the</strong> travel lane. Rumble<br />
strips are designed to alert drowsy and inattentive motorists and can generally be classified by<br />
<strong>the</strong>ir position in relation to <strong>the</strong> travel lane as: a) shoulder rumble strips (including edgeline rumble<br />
strips), b) centerline rumble strips, c) midlane rumble strips, and d) transverse rumble strips. Figure<br />
1 illustrates <strong>the</strong> position of each type of rumble strips in relation to <strong>the</strong> travel lane. The commonly<br />
referred dimensions of rumble strips are: length, normally defined as <strong>the</strong> dimension perpendicular<br />
to <strong>the</strong> traffic direction; width, usually defined as <strong>the</strong> dimension parallel to <strong>the</strong> traffic direction;<br />
depth of height; and spacing, usually measured from center to center of rumble strip patterns. The<br />
spacing can be continuous, if <strong>the</strong> rumble strips are placed with constant spacing along <strong>the</strong> roadway,<br />
or alternatively, if <strong>the</strong> spacing changes along <strong>the</strong> roadway (for example: 12 in., followed by 24 in.,<br />
spacing).<br />
101
Centerline Rumble Strips<br />
Figure 1: Placement of Rumble Strips in a Roadway<br />
102<br />
2<br />
Travel Lane<br />
1<br />
Shoulder<br />
Shoulder<br />
Travel Lane<br />
3<br />
4<br />
Center Line<br />
Note: (1) Shoulder Rumble Strips, (2) Centerline Rumble Strips, (3) Midlane Rumble Strips,<br />
(4) Transverse Rumble Strips<br />
Shoulder rumble strips (SRS) are placed on <strong>the</strong> shoulders or on <strong>the</strong> edge line (along <strong>the</strong><br />
longitudinal pavement marking located at <strong>the</strong> edge of <strong>the</strong> travel lane and <strong>the</strong> shoulder) of <strong>the</strong> roadway<br />
and are a countermeasure for ROR type crashes. On divided highways, SRS may be installed on<br />
both <strong>the</strong> outside and median shoulders. When installed along <strong>the</strong> edge lines, <strong>the</strong>y are commonly<br />
referred to as “rumble stripes” or edgeline rumble strips. The benefits of rumble strips are <strong>the</strong><br />
greater free space allowed on <strong>the</strong> shoulders for motorists to perform corrective maneuvers, for o<strong>the</strong>r<br />
users such as bicyclists to use <strong>the</strong> shoulders, and that <strong>the</strong>y can be installed on roadways with narrow<br />
or nonexistent shoulders. Centerline rumble strips are placed on <strong>the</strong> center of <strong>the</strong> roadway and are<br />
designed to mitigate cross-over crashes.<br />
Midlane rumble strips is a concept with no actual installations known. Their <strong>the</strong>oretical<br />
placement would be in <strong>the</strong> center of <strong>the</strong> travel lane, serving to potentially prevent both cross-over<br />
and ROR crashes.<br />
Transverse rumble strips are usually placed across <strong>the</strong> full width of <strong>the</strong> travel lanes. They are<br />
designed to alert motorists of approaching roundabouts, intersections, and toll plazas.<br />
According to Elefteriaou et al. (2000), <strong>the</strong>re are four types of rumble strips classified by <strong>the</strong>ir<br />
installation process: a) raised, b) milled, c) rolled, and d) formed, as presented in Figure 2. The<br />
milled is <strong>the</strong> most common type of rumble strip in <strong>the</strong> United States. They can be installed on<br />
new or existing asphalt and Portland cement concrete (PCC) pavements. This type of rumble strip<br />
is produced by a machine, which cuts a groove in <strong>the</strong> pavement. Raised rumble strips are made<br />
by adherence of proper material to new or existing pavement surfaces. Formed rumble strips are<br />
installed on PCC surfaces by forming grooves or indentations into <strong>the</strong> concrete during its finishing<br />
process. Rolled rumble strips are installed only on asphalt surfaces by a roller that presses grooves<br />
into <strong>the</strong> hot surfaces when <strong>the</strong> asphalt is being compacted.<br />
Figure 2: Types of Rumble Strips<br />
a) Raised b) Milled c) Rolled d) Formed<br />
Source: Richards and Saito (2005)
Centerline Rumble Strips<br />
JTRF Volume 50 No. 1, Spring 2011<br />
This study focuses on <strong>the</strong> applications of CLRS. Centerline rumble strips are primarily installed on<br />
<strong>the</strong> center line of undivided two-lane highways, and <strong>the</strong>ir main purpose is reduction of cross-over<br />
crashes, more specifically, head-on and opposite direction sideswipe and front-to-side type crashes,<br />
which are usually caused by driver inattention and drowsiness. The data available on <strong>the</strong> FARS<br />
database reveal that in 2009, 56% of <strong>the</strong> fatal crashes occurred on rural roads. Among <strong>the</strong>se, 74%<br />
occurred on undivided two-lane roads, and 20% of <strong>the</strong>se accidents involved two vehicles traveling<br />
in opposite directions, totaling 2,579 cross-over fatal crashes per year (NHTSA 2009). CLRS are<br />
accepted as a countermeasure that reduces approximately 25% of cross-over crashes, making twolane<br />
rural roads safer. Therefore, <strong>the</strong> use of <strong>the</strong>m in <strong>the</strong> United States has increased over <strong>the</strong> years.<br />
Several authors have reported advantages o<strong>the</strong>r than crash reduction in installing CLRS, such<br />
as low interference in passing maneuvers, versatile installation conditions, and public approval<br />
(Miles et al. 2005; Richards and Saito 2007). Due to <strong>the</strong>ir associated low costs of installation<br />
and maintenance, CLRS provide high benefit-cost ratios. For instance, Carlson and Miles (2003)<br />
reported estimated benefit-cost ratio associated with CLRS in <strong>the</strong> range of 0.17 to 39.16 (<strong>the</strong> higher<br />
<strong>the</strong> roadway traffic volume, <strong>the</strong> greater <strong>the</strong> benefit), considering five states and assuming cross-over<br />
crash reduction of 20%. However, some concerns involving CLRS, such as <strong>the</strong> levels of exterior<br />
noise, potential decreased visibility of <strong>the</strong> painted strips, potential tendency to speed up pavement<br />
deterioration, possibility of causing driver erratic maneuvers, and ice formation in <strong>the</strong> grooves,<br />
have been cited in <strong>the</strong> current literature (Russell and Rys, 2005). The policies and guidelines for<br />
CLRS installation are very distinct among <strong>the</strong> states using <strong>the</strong>m. A better understanding of good<br />
practices and gaps in research about <strong>the</strong> use of CLRS would contribute to future enhancement<br />
of <strong>the</strong>ir associated advantages and reduction of <strong>the</strong>ir potential weaknesses. For <strong>the</strong>se reasons, <strong>the</strong><br />
objectives of this study are to obtain nationwide, updated information about states’ policies and<br />
guidelines for utilization of CLRS and to provide a list of gaps in research along with good practices<br />
in <strong>the</strong> country. It is expected that <strong>the</strong> information from this study will be useful for planners and<br />
policy makers, providing guidance for future applications of CLRS.<br />
LITERATURE REVIEW<br />
This section presents a review of <strong>the</strong> pertinent studies that focus on <strong>the</strong> different effects of CLRS<br />
and <strong>the</strong> previous national surveys on CLRS policies. Studies of o<strong>the</strong>r types of rumble strips, for<br />
example, shoulder rumble strips, are not part of <strong>the</strong> scope of this work.<br />
Safety Effectiveness of CLRS<br />
There are several published and unpublished studies revealing that CLRS reduces cross-over crashes.<br />
Generally, <strong>the</strong> methods utilized in <strong>the</strong>se studies are <strong>the</strong> Naïve before-and-after, which just compares<br />
<strong>the</strong> before and after numbers with no adjustments, and <strong>the</strong> Empirical Bayes method, which uses<br />
more sophisticated, state-of-<strong>the</strong>-art statistics. Some of <strong>the</strong>se studies are summarized in Table 1.<br />
The results of <strong>the</strong>se studies are not uniform. The differences in <strong>the</strong> crash reduction effects may be<br />
partially attributed to differences of <strong>the</strong> CLRS applications, since different patterns of rumble strips<br />
have proven to generate different levels of noise and vibration stimuli for drivers. The best pattern<br />
and application of CLRS along <strong>the</strong> roadway can be considered a gap in research since it remains<br />
unknown. Chen et al. (2003) claim that <strong>the</strong> performance of rumble strips should be a function of<br />
<strong>the</strong> difference between noise and vibration stimuli over rumble strips and over smooth pavement<br />
conditions (<strong>the</strong> best pattern would be <strong>the</strong> one that produces <strong>the</strong> largest differences). In addition, an<br />
increase in order of 9 to 10 dBA (dBA corresponds to <strong>the</strong> unit of <strong>the</strong> A-scale on a sound-level meter,<br />
which is <strong>the</strong> scale that best approximates <strong>the</strong> frequency to which that human ear can respond) in<br />
<strong>the</strong> level of sound is necessary for a person to be alerted by <strong>the</strong> presence of that sound (Lipscomb<br />
103
Centerline Rumble Strips<br />
1995, cited by Rys et al. 2008). Therefore, CLRS should raise <strong>the</strong> levels of sound by at least 10 dBA.<br />
Miles and Finley (2007) stated that <strong>the</strong> “standard” rumble strips dimensions (milled, length equal or<br />
greater than 12 in., width of 7 in., depth of 0.5 in., and spacing of 12 to 24 in.) in <strong>the</strong> United States<br />
provide adequate increase in <strong>the</strong> sound level to alert all drivers, regardless of <strong>the</strong> speed or <strong>the</strong> type<br />
of pavement.<br />
Table 1: Safety Effectiveness of CLRS<br />
104<br />
State Study Statistical Method<br />
Arizona<br />
AECOM (2008) Comparison Group<br />
Kar and Weeks (2009) Naïve Before-and-After<br />
Type of Crash<br />
Studied<br />
Fatal and serious<br />
injury cross-over<br />
Fatal and serious<br />
injury cross-over<br />
Crash<br />
Reduction<br />
61.0%<br />
56.0%<br />
California<br />
Fitspatrick et al. (2000)<br />
Persaud et al. (2003)<br />
Naïve Before-and-After<br />
Empirical Bayes<br />
Fatal head-on<br />
Total head-on<br />
Cross-over<br />
All types<br />
90.0%<br />
42.0%<br />
12.0%<br />
14.0%<br />
Colorado<br />
Outcalt (2001)<br />
Persaud et al. (2003)<br />
Naïve Before-and-After<br />
Empirical Bayes<br />
Head-on<br />
Sideswipe<br />
Cross-over<br />
All types<br />
34.0%<br />
36.5%<br />
31.0%<br />
11.0%<br />
Head-on 95.0%<br />
Drove left to <strong>the</strong><br />
center<br />
60.0%<br />
Delaware DOT (2003) Naïve Before-and-After<br />
PDO Increase 13%<br />
Delaware<br />
Injury Increase 4%<br />
All Types 8.0%<br />
Persaud et al. (2003) Empirical Bayes<br />
Cross-over<br />
All types<br />
81.0%<br />
23.0%<br />
Fatal head-on 80.0%<br />
Head-on 81.0%<br />
Naïve Before-and-After<br />
Sideswipe 78.0%<br />
Kansas Karkle et. al (2009)<br />
Cross-over 80.0%<br />
Fatal and serious<br />
injury cross-over<br />
59.0%<br />
Empirical Bayes<br />
Cross-over<br />
All types<br />
85.0%<br />
33.0%<br />
Maine Unpublished Maine DOT Naïve Before-and-After<br />
Head-on<br />
ROR<br />
91.7%<br />
28.9%<br />
Maryland Persaud et al. (2003) Empirical Bayes All types 19.0%<br />
Massachusetts Noyce and Elango (2004) Comparison Group Several Inconclusive
Table 1: Safety Effectiveness of CLRS (continued)<br />
State Study Statistical Method<br />
Minnesota<br />
Persaud et al. (2003) Empirical Bayes<br />
Briese (2006)<br />
Knapp and Schmit (2009)<br />
Cross-Sectional<br />
Comparison<br />
Cross-Sectional<br />
Comparison<br />
Torbic et. al (2009) Empirical Bayes<br />
Missouri Unpublished Missouri DOT<br />
Naïve Before-and-After<br />
Empirical Bayes<br />
JTRF Volume 50 No. 1, Spring 2011<br />
Type of Crash<br />
Studied<br />
Crash<br />
Reduction<br />
Cross-over Increase 12%<br />
All types 0.0%<br />
Cross-over 43.0%<br />
All types 42.0%<br />
Cross-over - Fatal and<br />
severe injury<br />
All types - Fatal and<br />
severe injury<br />
Cross-over - Fatal and<br />
severe injury<br />
All types - Fatal and<br />
severe injury<br />
Increase 13%<br />
73.0%<br />
47.0%<br />
40.0%<br />
All Types 11.1%<br />
Fatal and injury 21.8%<br />
Cross-over 48.9%<br />
Fatal and injury crossover<br />
44.7%<br />
Head-on 29.0%<br />
Sideswipe 61.0%<br />
Head-on 53.0%<br />
Sideswipe 62.0%<br />
Nebraska Unpublished Nebraska DOT Naïve Before-and-After Cross-over 64.0%<br />
Oregon<br />
Pennsylvania<br />
Washington<br />
Monsere (2002) cited by<br />
Russell and Rys (2005)<br />
Naïve Before-and-After Cross-over 69.5%<br />
Comparison Group Cross-over 79.6%<br />
Persaud et al. (2003) Empirical Bayes All Types 46.0%<br />
Galenabiewski et al. (2008) Naïve Before-and-After Cross-over 48.0%<br />
Torbic et. al (2009) Empirical Bayes<br />
Persaud et al. (2003) Empirical Bayes<br />
Torbic et. al (2009) Empirical Bayes<br />
All Types 1.6%<br />
Fatal and injury 6.2%<br />
Cross-over 25.8%<br />
Fatal and injury crossover<br />
44.4%<br />
Cross-over 21.0%<br />
All types 25.0%<br />
All Types Increase 2.3%<br />
Fatal and injury Increase 4.1%<br />
Cross-over 35.4<br />
Fatal and injury crossover<br />
35.4<br />
105
Centerline Rumble Strips<br />
Pavement Deterioration Due to Water/Ice Accumulation, and Winter Maintenance Issues<br />
Water and ice accumulation in CLRS grooves may or may not cause accelerated pavement<br />
degradation. Torbic et al. (2009) claimed that several DOTs’ maintenance crews have reported that<br />
heavy traffic would speed pavement deterioration due to <strong>the</strong> presence of rumble strips and that <strong>the</strong><br />
water and ice accumulated in <strong>the</strong> grooves would crack <strong>the</strong> pavement. The authors state that <strong>the</strong>se<br />
concerns have not been validated. Moreover, in a survey conducted in 2005, 15 DOTs did not believe<br />
that CLRS cause pavement deterioration due to ice or water accumulation in <strong>the</strong> grooves (Russell<br />
and Rys 2005). However, a Virginia inspection on <strong>the</strong> milled CLRS found that approximately 1%<br />
of <strong>the</strong> strips inspected were deteriorating (Torbic et al. 2009). The reason for <strong>the</strong> deterioration may<br />
be poor pavement conditions before <strong>the</strong> installation of CLRS, as found by <strong>the</strong> following studies.<br />
According to Kirk (2008), <strong>the</strong> Kentucky <strong>Transportation</strong> Center (KYTC) held a meeting with<br />
personnel from <strong>the</strong> Kentucky DOT to investigate if <strong>the</strong> joint deterioration found on Daniel Boone<br />
Parkway and Mountain Parkway in Kentucky was caused by CLRS. The conclusion was that <strong>the</strong>se<br />
roads had poor pavement performance even before <strong>the</strong> rumble strip installation. In addition, <strong>the</strong><br />
conclusion was that water and ice accumulation in <strong>the</strong> centerline rumble strip is a non issue. Ano<strong>the</strong>r<br />
study also suggests that <strong>the</strong> center joint degradation promoted by CLRS only appears to occur when<br />
<strong>the</strong> pavement condition is not adequate before <strong>the</strong> CLRS installation (Knapp and Schmit 2009). The<br />
same authors also conducted a survey about winter maintenance problems caused by CLRS. Seven<br />
of <strong>the</strong> nine surveyed states indicated that <strong>the</strong>y were not aware of any maintenance problems. Two<br />
states responded that <strong>the</strong> snow/ice in <strong>the</strong> CLRS may melt and <strong>the</strong>n refreeze at a time when winter<br />
maintenance activities are no longer occurring. Minnesota DOT engineers anecdotally noted that<br />
more salt appears to be needed along roadway sections with CLRS, which might suggest <strong>the</strong> need<br />
to reconsider CLRS designs and/or winter maintenance practices.<br />
Regarding <strong>the</strong> effect of CLRS on winter maintenance and operation activities, additional passes<br />
of snowplow appeared to be needed in Alaska due to <strong>the</strong> presence of milled CLRS. However, CLRS<br />
may be beneficial because <strong>the</strong>y provide guidance for snowplow drivers (Russell and Rys 2005). In<br />
addition, Hirasawa et al. (2005) claimed that <strong>the</strong> Japanese CLRS pattern produces sufficient warning<br />
(sound and vibration) for drivers on slushy winter roads, even when <strong>the</strong> center line was invisible.<br />
The concerns reviewed in this section can be qualified as gaps in research because <strong>the</strong>re is<br />
limited literature about <strong>the</strong>se topics, and a specific scientific investigation is yet to be done in order<br />
to prove or disprove any hypo<strong>the</strong>sis. Results available and presented in this section were obtained<br />
mainly from questionnaires.<br />
O<strong>the</strong>r Users of <strong>the</strong> Highways<br />
The noise and vibration caused by CLRS may affect bicyclists, motorcyclists, and residents near<br />
highways. The policies on CLRS can play a role to equilibrate <strong>the</strong> trade-off between safety and<br />
o<strong>the</strong>r aspects. Three studies are consistent with <strong>the</strong> conclusion that CLRS did not appear to be a<br />
safety hazard to motorcyclists (Miller 2008, Hirasawa et al. 2005, Bucko and Khorashadi 2001).<br />
Only one study evaluated <strong>the</strong> safety effectiveness of CLRS. Miller (2008) investigated 26 of <strong>the</strong> 29<br />
motorcyclist crashes that occurred in Minnesota after <strong>the</strong> installation of CLRS and concluded that<br />
those crashes were unrelated to CLRS. An estimate of <strong>the</strong> safety effectiveness of CLRS regarding<br />
motorcyclists remains a gap in research.<br />
Three studies concluded that <strong>the</strong> patterns of rumble strips that produce <strong>the</strong> greatest levels of<br />
noise and vibration for drivers are <strong>the</strong> least comfortable for bicyclists (Bucko and Khorashadi 2001,<br />
Outcalt 2001, and Elefteriadou et al. 2000). In addition, Torbic (2001) concluded that <strong>the</strong>re is a<br />
linear relationship between bicyclists’ whole-body vibration and comfort. Ano<strong>the</strong>r study found that<br />
<strong>the</strong> space that drivers leave between <strong>the</strong>ir vehicles and bicyclists is greater along roadway sections<br />
with CLRS as compared with similar situations without CLRS (Zebauers 2005 cited by Knapp and<br />
Schmit 2009).<br />
106
JTRF Volume 50 No. 1, Spring 2011<br />
Several studies have found that rumble strips increase <strong>the</strong> level of external noise, which may<br />
affect roadside residents. Finley and Miles (2007) concluded that pavement type and rumble strip<br />
dimensions affect <strong>the</strong> levels of exterior noise. Karkle et al. (in press) concluded that distance, type<br />
of vehicle, and speed of vehicles affect <strong>the</strong> levels of exterior noise and that at <strong>the</strong> studied distances<br />
up to 150 ft., <strong>the</strong> noise caused by a 15-passenger van and a sedan hitting CLRS could disturb<br />
residents. The authors recommended that a minimum distance from houses and businesses should<br />
be considered for installation of CLRS and suggested that 200 ft. of distance from <strong>the</strong> center of <strong>the</strong><br />
roadway should be considered as <strong>the</strong> minimum. Makarla (2009), based on a survey with a limited<br />
number of roadside residents, suggests that <strong>the</strong> respondents were willing to accept <strong>the</strong> levels of noise<br />
generated by <strong>the</strong> CLRS due to <strong>the</strong> increase in safety aspects.<br />
The Operational Usage of <strong>the</strong> Travel Lane by Drivers<br />
CLRS may affect <strong>the</strong> lateral position, i.e. may cause vehicles to operate closer to <strong>the</strong> shoulders, <strong>the</strong><br />
speed at which <strong>the</strong> drivers travel and o<strong>the</strong>r operational aspects. Several studies found that CLRS<br />
cause drivers to move to <strong>the</strong> right, far<strong>the</strong>r away from <strong>the</strong> center line (Torbic et al. 2009). If installed<br />
in conjunction with rumble stripes, drivers appear to position <strong>the</strong> vehicle closer to <strong>the</strong> center of lanes<br />
at locations with lane widths as narrow as 11 ft. and shoulder widths of 3 ft. (Finley et al. 2008).<br />
Moreover, <strong>the</strong> vehicle travel speed does not appear to be changed much by <strong>the</strong> presence of CLRS<br />
and <strong>the</strong> passing opportunity maneuvers seems to be unchanged by <strong>the</strong> presence of CLRS (Miles et<br />
al. 2005).<br />
In addition, CLRS may influence o<strong>the</strong>r operational aspects, such as: a) <strong>the</strong> presence of both CLRS<br />
and shoulder rumble strips on <strong>the</strong> same roadway may cause drivers to react to <strong>the</strong> left after hitting<br />
CLRS under drowsiness or inattention condition. (Noyce and Elango [2004]), using a simulated<br />
environment, reported that 27% of <strong>the</strong> participants initially reacted leftward after encountering<br />
CLRS; and b) CLRS may affect operational aspects of emergency vehicles. This result was not<br />
confirmed in a survey conducted in 2005, which revealed that 17 DOTs had no evidence or opinion<br />
of CLRS causing people to react to <strong>the</strong> left (Russell and Rys 2005).<br />
The Visibility of Pavement Markings<br />
It is controversial how CLRS affect <strong>the</strong> visibility of pavement markings. According to Bahar and<br />
Parkhill (2005), <strong>the</strong>re is a debate whe<strong>the</strong>r <strong>the</strong> degradation of <strong>the</strong> pavement marking visibility occurs<br />
faster if <strong>the</strong> markings are painted on top of <strong>the</strong> rumble strips. However, several authors reported that<br />
<strong>the</strong> visibility of pavement markings placed over rumble strips is higher than over smooth pavement,<br />
especially during wet-night situations (Torbic et al. 2009). The current belief is that CLRS improve<br />
<strong>the</strong> night visibility of <strong>the</strong> pavement markings.<br />
METHODOLOGY<br />
A survey was emailed to <strong>the</strong> 50 state DOTs between April and May 2010, and consisted of 17<br />
questions regarding <strong>the</strong> following topics: use of CLRS, type of construction and pattern dimensions,<br />
total mileage, placement of CLRS in relation to <strong>the</strong> longitudinal joint and center line, type of<br />
CLRS application along <strong>the</strong> longitudinal roadway, type of pavement and policy on depth and age<br />
of pavement, minimum lane and shoulder width requirements for CLRS installation, and concerns<br />
from <strong>the</strong> public about CLRS.<br />
107
Centerline Rumble Strips<br />
RESULTS AND DISCUSSION<br />
The total response rate of this survey was 60%, or 30 state DOTs. The results are summarized below.<br />
1. Are <strong>the</strong>re any centerline rumble strips installed on your highways (yes or no)?<br />
Among <strong>the</strong> total of 30 respondents, 90% (n=27) answered “Yes” and 10% (n = three) answered<br />
“No” to this question.<br />
Combining <strong>the</strong> information from three previous state-of-<strong>the</strong>-art studies (Russell and Rys 2005,<br />
Richards and Saito 2007, Torbic et al. 2009) with this current survey, <strong>the</strong> number of state agencies<br />
that have at least once reported <strong>the</strong> use of CLRS is 36.<br />
2. What is <strong>the</strong> type of construction used by your agency (milled, rolled, raised, or combination)?<br />
Among <strong>the</strong> 27 respondents that have reported <strong>the</strong> use of CLRS, only one state (Florida) does not use<br />
<strong>the</strong> milled type. Florida has reported <strong>the</strong> use of only <strong>the</strong> raised type of CLRS. Two states (Texas and<br />
North Carolina) reported <strong>the</strong> use of a combination, i.e., both raised and milled types. The o<strong>the</strong>r 24<br />
states reported <strong>the</strong> use of <strong>the</strong> milled type of CLRS.<br />
3. What are <strong>the</strong> strip dimensions used by your agency? The length refers as <strong>the</strong> dimension<br />
perpendicular to <strong>the</strong> center line and spacing is measured from center to center.<br />
Florida uses a continuous raised pattern with length and width of 2.5 in., height of 0.5 in. and<br />
spacing of 30 in.<br />
Among <strong>the</strong> states that use <strong>the</strong> milled CLRS type, <strong>the</strong> dimensions varied as follows:<br />
• Length: <strong>the</strong> range was 6 to 24 in., with 16 in. <strong>the</strong> predominant value used by about 42% (n<br />
= 11) of <strong>the</strong> respondents.<br />
• Width: <strong>the</strong> range was 5 to 9 in., with 7 in. <strong>the</strong> predominant width used by about 85% (n =<br />
22) of <strong>the</strong> respondents.<br />
• Depth: <strong>the</strong> range was 0.375 – 0.625 in., with 0.5 in. <strong>the</strong> predominant depth used by about<br />
73% (n = 19) of <strong>the</strong> respondents.<br />
• Spacing: <strong>the</strong> range was 5 to 48 in., with12 in. <strong>the</strong> predominant spacing used by about 77%<br />
(n = 20) of <strong>the</strong> respondents.<br />
• Continuous or Alternating: About 65% (n=17) answered continuous, about 19% (n =<br />
five) reported <strong>the</strong> use of alternating pattern, and about 12% of <strong>the</strong> respondents use both<br />
continuous and alternating patterns.<br />
• Class of Highway: <strong>the</strong> answers for this topic varied. Some of <strong>the</strong> reported classes of<br />
highways were all classes, rural undivided and rural two-lane arterial.<br />
4. How many miles are <strong>the</strong>re installed by type of highway and dimensions?<br />
Responses varied from three miles (Delaware) to 3,200 miles (Pennsylvania) as shown in Table 2.<br />
The total mileage reported was approximately 11,333. This number does not include <strong>the</strong> states of<br />
Colorado and Texas that did not report <strong>the</strong> number of CLRS miles installed.<br />
5. Where are <strong>the</strong> rumble strips installed in relation to <strong>the</strong> longitudinal joint and centerline (CLRS<br />
completely within pavement markings, CLRS extended into <strong>the</strong> travel lane, CLRS on ei<strong>the</strong>r side<br />
of pavement markings)?<br />
Among <strong>the</strong> 27 states using CLRS, about 67% (n=18) answered that CLRS are installed completely<br />
within pavement markings. About 45% (n=12) answered CLRS extended into <strong>the</strong> travel lane and<br />
about 15% answered CLRS on ei<strong>the</strong>r side of pavement markings. Some of <strong>the</strong> states reported more<br />
than one type of CLRS placement.<br />
108
Table 2: Number of Miles of CLRS per State<br />
State # Miles State # Miles<br />
AK 118 MI 3,000<br />
AR 74 MN 30<br />
AZ 174 MS 400<br />
CO Unknown MO 700<br />
DE 3 NE 300<br />
FL 68 NC 32<br />
HI 10 NH < 100<br />
ID 268.28 OK 9.25<br />
IA 60 OR 93<br />
KS 232 PA 3,200<br />
KY 190 TX Unknown<br />
LA 408 VA 18.5<br />
MD 412 WA 1,425<br />
ME 7 - 8 Total Approx. 11,333<br />
JTRF Volume 50 No. 1, Spring 2011<br />
6. Where are <strong>the</strong> CLRS installed in relation to longitudinal roadway (continuous or specific<br />
locations)?<br />
Among <strong>the</strong> states using CLRS, about 89% (n=24) install <strong>the</strong>m in a continuous manner. Only 18.5%<br />
(n = five) of <strong>the</strong> states reported <strong>the</strong> use of CLRS at specific locations such as curves and no passing<br />
zones. Some of <strong>the</strong> states reported both alternatives.<br />
7. In what type of pavement has your agency installed centerline rumble strips (only asphalt, only<br />
concrete, or both)? Do you have any policy regarding depth and age of <strong>the</strong> pavement?<br />
About 74% (n=20) of <strong>the</strong> respondents reported <strong>the</strong> use of CLRS only on asphalt pavements. About<br />
26% (n = seven) reported <strong>the</strong> use of CLRS on both asphalt and concrete pavements. The guidelines<br />
regarding <strong>the</strong> age and minimum depth of <strong>the</strong> pavement for installation of CLRS are summarized in<br />
Table 3. Examples of guidelines are given below.<br />
• Kansas: CLRS are installed in asphalt pavement surfaces 1.5 in. or more in depth. Age of<br />
pavement is not addressed in <strong>the</strong> policy. However, <strong>the</strong>y are typically installed as part of<br />
resurfacing projects.<br />
• Pennsylvania: CLRS should not be installed on existing concrete pavements with overlay<br />
less than 2 ½ in. depth. New pavements (less than one-year-old) should present a minimum<br />
1½ in. depth and existing concrete pavements should not have overlays less than 2.5 in. in<br />
depth for installation of CLRS. The pavement should be in sufficiently good condition, as<br />
determined by <strong>the</strong> district, to effectively accept <strong>the</strong> milling process without deteriorating.<br />
O<strong>the</strong>rwise <strong>the</strong> pavement needs to be upgraded prior to milling.<br />
• Washington has no specific policy. However, <strong>the</strong> policy reads: “Ensure that <strong>the</strong> pavement<br />
is structurally adequate to support milled rumble strips. Consult <strong>the</strong> Region Materials<br />
Engineer to verify pavement adequacies.”<br />
109
Centerline Rumble Strips<br />
Table 3: Guidelines Regarding Age and Depth of Pavement<br />
State Min. Pavement Depth (in.) Min. Pavement Age (years)<br />
AK 2 No<br />
DE Requires consultation of pavement management section<br />
IA 2.5 7<br />
KS 1.5 No<br />
KY Pavement in good condition<br />
LA 2 ≥ 10<br />
MD Pavement in good condition<br />
MI Engineering judgment<br />
MN Engineering judgment<br />
MS Considering for new pavement in future<br />
MO 1.75 New overlays<br />
NE No New Pavement<br />
OR Pavement in good condition<br />
PA 1.5 Older than 1 year<br />
TX 2 No<br />
WA Pavement is structurally adequate<br />
A supplementary question was sent to <strong>the</strong> seven state DOTs that reported <strong>the</strong> installation of<br />
CLRS on concrete pavement. This question asked <strong>the</strong> state DOTs about <strong>the</strong>ir experience and if <strong>the</strong>y<br />
have any center joint deterioration caused by CLRS on concrete pavements. The answers are given<br />
below.<br />
• Texas: “I have not heard of any reports of pavement deterioration caused by CLRS. Most<br />
of our centerline rumble strips are installed on hot mixed asphaltic surfaces and we have<br />
also not had any negative pavement reports.”<br />
• Nebraska: “We do not place rumble strips on <strong>the</strong> joint. We place <strong>the</strong>m on <strong>the</strong> south side of<br />
east-west highways and <strong>the</strong> east side of north south highways to match our paint striping.”<br />
• Iowa: “We have yet to install any on PCC pavement.”<br />
• Idaho: “I haven’t heard of any deterioration yet, but we are fairly new to <strong>the</strong> installations. We<br />
may know more in a few years.”<br />
• Missouri: “To date, I am not aware of joint deterioration due to <strong>the</strong> CLRS with our concrete<br />
pavements. As I indicated previously, we have installed <strong>the</strong> CLRS more in <strong>the</strong> last year<br />
or two. This may be an issue more after a few years, but currently we do not seem to be<br />
having issues.”<br />
• Colorado: “I have not seen or heard of any deterioration of <strong>the</strong> concrete joints, but I have<br />
not inspected <strong>the</strong>m for such an occurrence.”<br />
• Michigan: “I can tell you that we have very little experience with CLRS on concrete, but<br />
what I heard recently from two of our regions is that milling on <strong>the</strong> CL joint on an old PCC<br />
pavement is a bad idea. We will be changing our specifications to reflect that.”<br />
8. Is <strong>the</strong>re a minimum lane width requirement for <strong>the</strong> installation of centerline rumble strips (yes<br />
or no, elaborate)?<br />
About 67% (n=18) of <strong>the</strong> respondents answered “Yes” to this question and about 33% (n = nine)<br />
did not report a lane width requirement. Some states have suggestions or guidelines ra<strong>the</strong>r than<br />
requirements. Table 4 shows <strong>the</strong> lane width values reported by <strong>the</strong> respondents.<br />
110
Table 4: Minimum Lane Width for Installation of CLRS<br />
State Min. Lane Width (feet)<br />
AK Requires Lane + Shoulder ≥ 14<br />
WA Requires Lane + Shoulder ≥ 12<br />
MI, MO, PA Require Roadway ≥ 20<br />
DE, MD Require 10<br />
HI, KY, LA Require 11<br />
NE Requires 12<br />
MN Proposal to Require 12<br />
NC Suggests 10<br />
IA, TX Suggest 11<br />
AZ Suggests 12<br />
OK Experimented 12<br />
JTRF Volume 50 No. 1, Spring 2011<br />
9. Is <strong>the</strong>re a minimum shoulder width requirement for installation of centerline rumble strips (yes<br />
or no, elaborate)?<br />
About 70% (n=19) answered “No” to this question. About 30% (n = eight) of <strong>the</strong> respondents<br />
have a minimum shoulder width requirement for <strong>the</strong> installation of CLRS. Some states have a<br />
suggested value ra<strong>the</strong>r than a requirement. Table 5 shows <strong>the</strong> shoulder width values reported by <strong>the</strong><br />
respondents.<br />
Table 5: Minimum Shoulder Width for Installation of CLRS<br />
State Min. Shoulder Width (feet)<br />
WA Requires Lane + Shoulder ≥ 12<br />
AK Requires Lane + Shoulder ≥ 14<br />
KS Requires 3. Less is allowed to provide continuity<br />
MN Proposal to require 2<br />
AZ Suggests 4<br />
MO Suggests 4<br />
IA Eng. Judgment<br />
OK Experimental sites with 8 shoulder<br />
10. Are <strong>the</strong>re both centerline rumble strips and shoulder rumble strips along <strong>the</strong> same roadway?<br />
(yes or no, number of miles)?<br />
About 74% of <strong>the</strong> respondents have installed both CLRS and SRS along <strong>the</strong> same roadway. The total<br />
number of miles reported for this dual application was approximately 1,600. Some states answered<br />
“Yes” to this question, but did not report <strong>the</strong> number of miles. Seven states answered “No” to this<br />
question.<br />
11. Are <strong>the</strong>re both centerline rumble strips and edge line rumble strips (also referred as rumble<br />
stripes) along <strong>the</strong> same roadway (yes or no, number of miles)?<br />
About 33% (n = nine) of <strong>the</strong> respondents answered “Yes” to this question. The total number of miles<br />
for this type of dual application was 722. The o<strong>the</strong>r 18 states answered “No” to this question.<br />
111
Centerline Rumble Strips<br />
12. If you have answered yes on <strong>the</strong> previous question, has your agency installed both centerline<br />
rumble strips and edge line rumble strips in sections of highway with narrow (width less than<br />
3 feet) or no shoulder?<br />
Only three states (MS, OK, and WA) reported that <strong>the</strong>y have installed dual application on sections<br />
of highways with narrow or no shoulder. Only Washington reported <strong>the</strong> number of miles (less than<br />
one mile for this case).<br />
13. Are <strong>the</strong>re o<strong>the</strong>r requirements for installation of centerline rumble strips (traffic volume, crash<br />
rate, traffic volume, etc)?<br />
About 52% (n=14) of <strong>the</strong> respondents have o<strong>the</strong>r requirements such as crash rates, minimum AADT,<br />
and speed limit for installation of CLRS. For instance, Texas has <strong>the</strong> following requirements:<br />
“Apply CLRS in roadways with high-incidence crash rate with regard to head-on, opposite direction<br />
sideswipe and/or single vehicle cross-over crashes as a result of inattentive drivers or impaired<br />
visibility of pavement markings during adverse wea<strong>the</strong>r; CLRS shall not be milled or rolled into<br />
bridge decks; breaks in <strong>the</strong> CLRS will start at least 50 ft. and no more than 150 ft. prior to each<br />
approach for <strong>the</strong> following instances: bridges, intersections, and driveways with high usage or large<br />
trucks; CLRS may be installed along <strong>the</strong> edge line delineating pavement stripes for two-way left<br />
turn lanes (TWLTL). The TWLTL should have at least a 14-ft. width from <strong>the</strong> outside edges of <strong>the</strong><br />
solid edge lines, and <strong>the</strong> CLRS will be reduced to 12 in. in width for each edge line. Consider noise<br />
impacts when <strong>the</strong> installation is near residential areas, schools, and churches. A minimum of 3/18 in.<br />
depth of milled CLRS or rolled CLRS may be considered in <strong>the</strong>se areas. Posted speed limit should<br />
be greater or equal to 45 mph.”<br />
14. Does your agency have a written policy or guidelines for <strong>the</strong> installation of centerline rumble<br />
strips (yes or no)?<br />
About 63% (n = 17) of <strong>the</strong> respondents reported that <strong>the</strong>y have some type of written policy or<br />
guidelines for <strong>the</strong> installation of CLRS. About 37% (n = 10) of <strong>the</strong> respondents answered “No” to<br />
this question.<br />
15. Has your agency performed a before-and-after study to evaluate <strong>the</strong> effectiveness of centerline<br />
rumble strips and/or edge line rumble strips (yes or no)?<br />
About 52% (n=14) of <strong>the</strong> respondents reported that <strong>the</strong>y have, at least anecdotally, performed a<br />
before-and-after safety evaluation of CLRS. About 48% (n=13) of <strong>the</strong> respondents answered “No”<br />
to this question.<br />
16. Has your agency received any concerns from <strong>the</strong> public about vehicles hydroplaning due to <strong>the</strong><br />
contact with rumble strips?<br />
Only one state (Kansas) reported that only one person has presented a concern about vehicles<br />
hydroplaning after hitting CLRS.<br />
17. Has your agency received o<strong>the</strong>r type of concerns from <strong>the</strong> public about centerline rumble strips<br />
(yes or no, elaborate)?<br />
About 70% (n=19) of <strong>the</strong> respondents have received concerns from <strong>the</strong> public regarding CLRS. The<br />
causes of concerns cited were: roadside residents about external noise (n=11), motorcyclists (n=11),<br />
bicyclists (n = three), pavement deterioration (n = two), lack of advance signing of treated sections<br />
(n = one), and snow and ice removal maintenance issues (n = one). O<strong>the</strong>r eight states did not report<br />
any kind of concern received from <strong>the</strong> public.<br />
Based on <strong>the</strong> results found in this current survey and in <strong>the</strong> literature review, it is possible to<br />
summarize <strong>the</strong> gaps in research and good practices involving <strong>the</strong> use of CLRS. Good practices are<br />
given below.<br />
• For enhancing <strong>the</strong> safety effectiveness of CLRS: adopt a minimum AADT (DOTs responses<br />
ranged between 1500 and 3000), a minimum speed (DOTs responses ranged between 40<br />
112
JTRF Volume 50 No. 1, Spring 2011<br />
and 55 mph), a minimum crash rate for <strong>the</strong> installation of CLRS, a minimum lane width<br />
(DOTs responses ranged between 10 and 12 ft.), and a minimum shoulder width (DOTs<br />
reported two to four feet). In addition, install CLRS in roadways continuously in nopassing<br />
and passing zones, but discontinue <strong>the</strong> use of CLRS at intersections and at bridge<br />
decks, and adopt a pattern that is able to generate approximately 10 dBA above <strong>the</strong> ambient<br />
in-vehicle sound level. The predominant pattern in <strong>the</strong> country (length=16 in., width=7 in.,<br />
depth=0.5 in. and spacing=12 in.) has this characteristic (Miles and Finley 2007). Thus,<br />
this pattern is recommended.<br />
• To avoid potential pavement deterioration caused by CLRS, good practices include: install<br />
CLRS only on new construction or overlays; adopt a minimum pavement depth to install<br />
CLRS (DOTs responses ranged between 1.5 and 2.5 in.). Do not install CLRS if <strong>the</strong> center<br />
joint is not in good condition (use engineering judgment).<br />
• A widely applied practice to reduce <strong>the</strong> impact of CLRS on winter maintenance activities<br />
is to avoid <strong>the</strong> raised type of CLRS in areas where snow is frequent.<br />
• Bicyclists are not expected to hit CLRS very often. However, an intermittent gap in <strong>the</strong><br />
spacing of CLRS may help bicyclists to cross <strong>the</strong> travel lane when needed.<br />
• External noise issues may be addressed by <strong>the</strong> adoption of a minimum distance from houses<br />
or businesses to install CLRS. Karkle et al. (in press) recommended 200 ft. of distance, but<br />
semi-trucks were not considered in <strong>the</strong> study.<br />
• To reduce <strong>the</strong> potential impact of CLRS on vehicles’ position on <strong>the</strong> travel lane, good<br />
practices include: adopt a minimum shoulder and lane width for installation of CLRS<br />
(DOTs reported lane widths ranging from 10 to 12 ft. and shoulder widths ranging from<br />
two to 4 ft.). Utilize CLRS in conjunction with “rumble stripes” when technically feasible,<br />
since one study showed that CLRS in conjunction with “rumble stripes” resulted in drivers<br />
positioning <strong>the</strong> vehicle closer to <strong>the</strong> center of lanes (safer condition) at locations with lane<br />
widths as narrow as 11 ft. and shoulder widths of 3 ft. (Finley et al. 2008).<br />
• In order to avoid potential drivers’ mistakes on initial reactions after hitting CLRS, when<br />
CLRS are installed in conjunction with shoulder rumble strips (SRS) on <strong>the</strong> same roadway,<br />
different patterns of CLRS and SRS should be used.<br />
• O<strong>the</strong>r factors suggested for inclusion in CLRS installation guidance found in <strong>the</strong> reviewed<br />
literature were: type of roadway, location of roadway, local and regional conditions,<br />
roadway alignment, consistency within a state, and experience of o<strong>the</strong>rs (Russell and Rys,<br />
2005). Fur<strong>the</strong>rmore, Carlson and Miles (2003) recommended that CRLS may be installed<br />
along <strong>the</strong> edge line delineating pavement stripes for two-way left turn lanes.<br />
The gaps in knowledge associated with CLRS are: to determine <strong>the</strong> optimum dimensions for<br />
CLRS pattern, to determine <strong>the</strong> effects of CLRS on <strong>the</strong> visibility of pavement markings, to estimate<br />
<strong>the</strong> safety effectiveness of CLRS regarding motorcyclists, and to verify <strong>the</strong> effects of CLRS on<br />
pavement deterioration rates.<br />
CONCLUSIONS<br />
This paper presented <strong>the</strong> most recent survey about <strong>the</strong> DOT policies and practices regarding CLRS.<br />
The use of CLRS has grown over <strong>the</strong> years. In 2005, <strong>the</strong> total mileage of CLRS installed in <strong>the</strong><br />
United States was 2,403 miles (Richards and Saito 2007). This current survey found a total mileage<br />
of approximately 11,333 miles (not including <strong>the</strong> states of Texas and Colorado), which represents<br />
an increase of about 372% over five years. The state DOTs are in <strong>the</strong> process of implementing<br />
written policies or guidelines for installation of CLRS. In 2006 only seven U.S. states had written<br />
policies or guidelines (Torbic et al. 2009). This survey reported that 17 states have written policies<br />
or guidelines. According to survey results, <strong>the</strong> milled type of CLRS construction is <strong>the</strong> predominant<br />
type, and <strong>the</strong> CLRS predominant pattern dimensions are: length 16 in., width 7 in., depth 0.5 in.,<br />
spacing 12 in., continuous. This pattern is recommended since it produces sufficient amount of<br />
113
Centerline Rumble Strips<br />
noise to alert drivers. Moreover, <strong>the</strong> installation of CLRS on only asphalt pavement is predominant.<br />
Among <strong>the</strong> states that use CLRS on concrete pavements, <strong>the</strong> center joint deterioration appears not<br />
to be an important issue. This result is consistent with <strong>the</strong> literature review. Some previously cited<br />
studies have reported that pavement deterioration after <strong>the</strong> installation of CLRS seems to occur on<br />
roads that had poor pavement conditions before <strong>the</strong> CLRS application. Several state DOTs made <strong>the</strong><br />
recommendation to investigate <strong>the</strong> condition of <strong>the</strong> pavement and to install CLRS only on sections<br />
with pavement in good condition.<br />
The combination of CLRS and rumble strips is rarely used on sections of highways with narrow<br />
or no shoulder, despite <strong>the</strong> results that drivers appear to position <strong>the</strong> vehicle closer to <strong>the</strong> center of<br />
lanes at locations with lane widths as narrow as 11 ft. and shoulder width of 3 ft. (Finley et al. 2008).<br />
The main causes of concerns received from <strong>the</strong> public regarding CLRS are <strong>the</strong> external noise<br />
produced by <strong>the</strong>m that may disturb roadside residents and from motorcyclists, although some<br />
published results from <strong>the</strong> literature state that CLRS do not have a negative effect on motorcyclists.<br />
Centerline rumble strips are an efficient countermeasure to reduce cross-over crashes. The<br />
policies and guidelines for CLRS installation are not very consistent among <strong>the</strong> states using <strong>the</strong>m.<br />
Therefore, a list of good practices was given in this study. It can be useful in providing guidance for<br />
future applications of CLRS.<br />
Future research may be performed on <strong>the</strong> gaps in research topics summarized by this study,<br />
which includes: to determine <strong>the</strong> optimum dimensions for CLRS pattern, to determine <strong>the</strong> effects<br />
of CLRS on <strong>the</strong> visibility of pavement markings, to estimate <strong>the</strong> safety effectiveness of CLRS<br />
regarding motorcyclists, and to verify <strong>the</strong> effects of CLRS on pavement deterioration rates.<br />
References<br />
AECOM <strong>Transportation</strong>. Safety Enhancement Evaluation of Ground-in Centerline Rumble Strips.<br />
Report to Arizona Department of <strong>Transportation</strong>, Phoenix, AZ, 2008.<br />
Briese, M. Safety Effects of Centerline Rumble Strips in Minnesota. Report Number MN/RC-2008-<br />
44, Minnesota Department of <strong>Transportation</strong>, St. Paul, MN, 2006.<br />
Bahar, G.J. and M. Parkhill. Syn<strong>the</strong>sis of Practices for <strong>the</strong> Implementation of Centerline Rumble<br />
Strips. <strong>Transportation</strong> Association of Canada (TAC), 2005.<br />
Bucko, T.R. and A. Khorashadi. Evaluation of Milled-In Rumble Strips, Rolled-In Rumble Strips<br />
and Audible Edge Stripe. Office of <strong>Transportation</strong> Safety and <strong>Research</strong>, California Department of<br />
<strong>Transportation</strong>, 2001.<br />
Carlson, P.J. and J.D. Miles. Effectiveness of Rumble Strips on Texas Highways: First Year Report.<br />
Report FHWA/TX-05/0-4472-1, Texas Department of <strong>Transportation</strong>, Austin, TX, 2003.<br />
Delaware Department of <strong>Transportation</strong>. Centerline Rumble Strips: The Delaware Experience.<br />
http://www.deldot.gov; accessed in July 2008.<br />
Chen, C., E.O. Darko, and T.N. Richardson. “Optimal Continuous Shoulder Rumble Strips and <strong>the</strong><br />
Effects on Highway Safety and <strong>the</strong> Economy.” ITE <strong>Journal</strong> 5 (73), (2003): 30-41. http://www.ite.<br />
org/itejournal/journalsearch.cfm.<br />
Elefteriadou, L., M. El-Gindy, D. Torbic, P. Garvey, A. Homan, Z. Jiang, B. Pecheux, and R. Tallon.<br />
Bicycle-Tolerable Shoulder Rumble Strip. The Pennsylvania State University, The Pennsylvania<br />
<strong>Transportation</strong> Institute, Report Number: PTI 2K15, 2000.<br />
114
JTRF Volume 50 No. 1, Spring 2011<br />
Federal Highway Administration. Rumble Strips. FHWA Publication No: FHWA-RC-BAL-04-0015,<br />
Washington, D.C., 2003.<br />
Finley, M.D. and J.D. Miles. Exterior Noise Created by Vehicles Traveling over Rumble Strips.<br />
<strong>Transportation</strong> <strong>Research</strong> Board 86 th Annual Meeting, <strong>Transportation</strong> <strong>Research</strong> Board, National<br />
<strong>Research</strong> Council, Washington, D.C., 2007.<br />
Finley, M.D., D.S. Funkhouser, and M.A. Brewer. Studies to Determine <strong>the</strong> Operational Effects of<br />
Shoulder and Centerline Rumble Strips on Two- Lane Undivided Roadways. Report 0-5577-1, Texas<br />
Department of <strong>Transportation</strong>, Austin, TX, 2008.<br />
Fitzpatrick, K., K. Balke, D.W. Harwood, and I.B. Anderson. Accident Mitigation Guide for<br />
Congested Rural Two-Lane Highways. NCHRP Report 440, <strong>Transportation</strong> <strong>Research</strong> Board,<br />
National <strong>Research</strong> Council, Washington, D.C., 2000.<br />
Golembiewski, G., R. Haas, B. Katz, and T. Bryer. Evaluation of <strong>the</strong> Effectiveness of PennDOT’s Low<br />
Cost Safety Improvement Program (LCSIP). Publication FHWA-PA-2008-16-070308. Pennsylvania<br />
Department of <strong>Transportation</strong>, 2008.<br />
Hirasawa, M., K. Saito, and M. Asano. “Study on Development and Practical Use of Rumble Strips<br />
as a New Measure for Highway Safety.” <strong>Journal</strong> of <strong>the</strong> Eastern Asia Society for <strong>Transportation</strong><br />
Studies (6), (2005): 3697–3712. http://www.easts.info/on-line/journal_06/3697.pdf.<br />
Kar, K. and R.S. Weeks. “The Sound of Safety.” Public Roads 4 (72), (2009): 10–16.<br />
Karkle, D.E., M.J. Rys, and E.R. Russell. Evaluation of Centerline Rumble Strips for Prevention of<br />
Highway Cross-over Accidents in Kansas. Proceedings of <strong>the</strong> 2009 Mid-Continent <strong>Transportation</strong><br />
<strong>Research</strong> Symposium, Ames, IA, 2009.<br />
Karkle, D.E., M.J. Rys, and E.R. Russell. “Centerline Rumble Strips: A Study of Exterior Noise.”<br />
<strong>Journal</strong> of <strong>Transportation</strong> Engineering. (in press). http://scitation.aip.org/getpdf/servlet/GetPDFSer<br />
vlet?filetype=pdf&id=JTPEXX000001000001000162000001&idtype=cvips&prog=normal<br />
Kirk, A. Evaluation of <strong>the</strong> Effectiveness of Pavement Rumble Strips. <strong>Research</strong> Report KTC-08-04/<br />
SPR319-06-1F, Kentucky <strong>Transportation</strong> Center, University of Kentucky, Lexington, KY, 2008.<br />
Knapp, K.K. and M. Schmit. Assessment of Centerline Rumble Strips in Minnesota: Executive<br />
Summary and Project Task Summary Attachments. Center for Excellence in Rural Safety, State and<br />
Local Policy Program, Hubert H. Humphrey Institute of Public Affairs, University of Minnesota,<br />
Minneapolis, MN, 2009.<br />
Lipscomb, D.M. Auditory Perceptual Factors Influencing <strong>the</strong> Ability of Train Horns. Third<br />
International Symposium on Railroad-Highway Grade Crossing <strong>Research</strong> and Safety, 1995: 195.<br />
Makarla, R. “Evaluation of External Noise Produced by Vehicles Crossing Over Centerline Rumble<br />
Strips on Undivided Highways in Kansas.” Thesis (M.S.), Kansas State University, 2009.<br />
Miles, J. D., P. J. Carlson, M.P. Pratt, and T.D. Thompson. Traffic Operational Impacts of Transverse,<br />
Centerline, and Edgeline Rumble Strips. Report No. FHWA/TX-05/0-4472-2. Texas Department of<br />
<strong>Transportation</strong>, 2005.<br />
Miles, J.D. and M.D. Finley. Evaluation of Factors that Impact <strong>the</strong> Effectiveness of Rumble Strip<br />
Design. Presented at <strong>the</strong> 86 th Annual Meeting of <strong>the</strong> <strong>Transportation</strong> <strong>Research</strong> Board, Washington<br />
D.C., 2007.<br />
115
Centerline Rumble Strips<br />
Miller, K.W. Effects of Center-Line Rumble Strips on Non-Conventional Vehicles. Minnesota<br />
Department of <strong>Transportation</strong>, 2008.<br />
Monsere, C.M. Preliminary Evaluation of <strong>the</strong> Safety Effectiveness of Centerline (Median) Rumble<br />
Strips in Oregon. Presented at <strong>the</strong> Institute of <strong>Transportation</strong> Engineers Quad Conference, Seattle,<br />
WA, 2002.<br />
National Highway Administration (NHTSA). “FARS Database.” Accessed January 25, 2011. http://<br />
www-fars.nhtsa.dot.gov, 2009.<br />
Noyce, D.A. and V.V. Elango. “Safety Evaluation of Centerline Rumble Strips: Crash and Driver<br />
Behavior Analysis.” <strong>Transportation</strong> <strong>Research</strong> Record: <strong>Journal</strong> of <strong>the</strong> <strong>Transportation</strong> <strong>Research</strong><br />
Board 1862, (2004): 44-53.<br />
Outcalt, W. Centerline Rumble Strips. Report No. CDOT-DTD-R-2001-8, Colorado Department of<br />
<strong>Transportation</strong>, Denver, CO., 2001.<br />
Persaud, B.N., R.A. Retting, and C. Lyon. Crash Reduction Following Installation of Centerline<br />
Rumble Strips on Rural Two-Lane Roads. Insurance Institute for Highway Safety, Arlington, VA,<br />
2003.<br />
Richards, S.J.N. and M. Saito. “State-of-<strong>the</strong>-Practice and Issues Surrounding Centerline Rumble<br />
Strips.” WIT Transactions on <strong>the</strong> Built Environment (94), (2007): 36-45.<br />
Russell, E.R. and M.J. Rys. Centerline Rumble Strips. NCHRP Syn<strong>the</strong>sis 339, <strong>Transportation</strong><br />
<strong>Research</strong> Board, National <strong>Research</strong> Council, Washington, D.C., 2005.<br />
Rys, M.J., L. Gardner and E.R. Russell. “Evaluation of Football Shaped Rumble Strips Versus<br />
Rectangular Rumble Strips.” <strong>Journal</strong> of <strong>the</strong> <strong>Transportation</strong> <strong>Research</strong> <strong>Forum</strong>, 47 (2), (2008): 41-54.<br />
Torbic, D. J. “Comfort and Controllability of Bicycles as a Function of Rumble Strip Design.”<br />
Dissertation (Ph.D). The Pennsylvania State University, 2001.<br />
Torbic, D.J., J.M. Hutton, C.D. Bokenkroger, K.M. Bauer, D.W. Harwood, D.K. Gilmore, J.M.<br />
Dunn, J.J. Ronchetto, E.T. Donnell, H.J. Sommer III, P. Garvey, B. Persaud, and C. Lyon. Guidance<br />
for <strong>the</strong> Design and Application of Shoulder and Centerline Rumble Strips. NCHRP Report 641,<br />
<strong>Transportation</strong> <strong>Research</strong> Board, National <strong>Research</strong> Council, Washington, D.C., 2009.<br />
Zebauers, V. Centerline Rumble Strips Help Cars and Bicyclists. In <strong>the</strong> 2005 Annual Meeting and<br />
Exhibit Compendium of Technical Papers, Institute of <strong>Transportation</strong> Engineers, Washington, D.C.,<br />
2005.<br />
116
JTRF Volume 50 No. 1, Spring 2011<br />
Daniel E. Karkle is a Ph.D. student in <strong>the</strong> Department of Industrial and Manufacturing Systems<br />
Engineering at Kansas State University. He received his B.S. degree in civil production engineering<br />
in Brazil.<br />
Margaret J. Rys is an associate professor in <strong>the</strong> Department of Industrial and Manufacturing<br />
Systems Engineering at Kansas State University. She obtained her integrated B.S/M.S degree<br />
from <strong>the</strong> Technical University of Wroclaw, Poland, in 1979 and M.S. (1986) and Ph.D. (1989)<br />
from Kansas State University, all in industrial engineering. She has almost 20 years of experience<br />
conducting research and teaching courses in human factors engineering, quality, engineering<br />
economy, statistics, and safety. During <strong>the</strong> past 20 years she has been principal or co-principal<br />
investigator on more than 40 projects and authored and co-authored more than 50 journal papers.<br />
Eugene R. Russell, PE, is a professor emeritus of civil engineering at Kansas State University and<br />
still conducts research on a part-time basis. He has 50 years of transportation and traffic engineering<br />
experience, including 42 in academia. He has directed more than 80 research projects covering a<br />
wide range of highway engineering and highway safety issues, authored or co-authored more than<br />
100 technical papers, and more than 100 presentations at U.S. and international conferences.<br />
117
118
Book Review<br />
Wilner, Frank N. Understanding <strong>the</strong> Railway Labor Act. Omaha: NE: Simmons Boardman<br />
Books, Inc., 2009. ISBN 978-0911382594.<br />
Understanding <strong>the</strong> Railway Labor Act<br />
by Gordon P. MacDougall<br />
This is <strong>the</strong> author’s second book on <strong>the</strong> subject of <strong>the</strong> Railway Labor Act (1926), 45 U.S.C. 151,<br />
et seq. The earlier book (Wilner 1991), referred to below as RLA-Dilemma, was <strong>the</strong> subject of<br />
comment by this reviewer in this <strong>Journal</strong> (MacDougall 1993).<br />
Mr. Wilner’s latest 172-page textual effort, Understanding <strong>the</strong> Railway Labor Act (RLA-<br />
Understanding), is preceded (after his 5-page preface), by a 10-page introduction from Lawrence H.<br />
Kaufman, a long-time public relations (public affairs) spokesman for <strong>the</strong> Association of American<br />
Railroads, and several individual major rail carriers. Following <strong>the</strong> end of <strong>the</strong> Wilner text are four<br />
invited essays “In Defense of <strong>the</strong> RLA,” from RLA sympathizers with a recognized background in<br />
railroad labor-management negotiations or litigation under <strong>the</strong> RLA. 1<br />
The author’s preface and 11 chapters text of RLA-Understanding are accompanied by 58 pages<br />
of endnotes, bearing no less than 1,018 small-type size entries, 2 directing <strong>the</strong> reader to source<br />
material, chiefly newspaper or o<strong>the</strong>r press accounts, but also to some published books and treatises. 3<br />
What does Wilner’s second effort on <strong>the</strong> Railway Labor Act, RLA-Understanding, add to or<br />
change in his RLA-Dilemma, written some 18 years earlier? The author is a prolific writer and a very<br />
hard worker on <strong>the</strong> computer. He is a known entity in <strong>the</strong> transportation field, but perhaps more as a<br />
journalist or publicist ra<strong>the</strong>r than as an expert or authority in <strong>the</strong> field of labor relations. Mr. Wilner’s<br />
approach is not necessarily favored by some practitioners on <strong>the</strong> labor side, 4 and this reviewer<br />
opined (MacDougall 1993) RLA-Dilemma takes a partisan view of some features of managementlabor<br />
relations in <strong>the</strong> railroad industry. The author does not appear to have changed his views in <strong>the</strong><br />
intervening years, but <strong>the</strong> current RLA-Understanding, unlike RLA-Dilemma, does not take sides on<br />
sensitive subjects, such as secondary boycotts, leng<strong>the</strong>ning <strong>the</strong> terms of National Mediation Board<br />
members, or forcing single representation for each craft or class on a merged rail system. Moreover,<br />
Wilner, in his current book, does not advance recommendations for “improving” <strong>the</strong> RLA. However,<br />
<strong>the</strong> author does mention some additional developments such as “interest” bargaining in his preface, 5<br />
and includes a more comprehensive discussion of <strong>the</strong> railroad strike insurance plan history, among<br />
o<strong>the</strong>r embellishments not developed in his earlier work.<br />
I suggest RLA-Understanding does have considerable value, with <strong>the</strong> Lawrence Kaufman<br />
introduction and <strong>the</strong> four essays, and a thorough compendium of reference citations for those readers<br />
seeking source material on various aspects of <strong>the</strong> Railway Labor Act and its workings.<br />
The four invited essays, <strong>the</strong>mselves, are of great value to an understanding of <strong>the</strong> RLA,<br />
particularly in dealing not only with its origins and history, but also with <strong>the</strong> practical mechanics of<br />
implementation on individual properties and with national handling. The four presenters have wide<br />
and varied backgrounds in rail labor-management relations. The four essays are ably written, short<br />
and precise, and should be easily understandable even for those with limited prior background in rail<br />
labor relations. Mr. Wilner is to be commended for his ability to ga<strong>the</strong>r <strong>the</strong>se four authors, each with<br />
substantial background and standing in <strong>the</strong> rail industry, under one book cover.<br />
119
Railway Labor Act<br />
Endnotes<br />
1. Harry R. Hoglander (Member & Former Chmn., National Mediation Board), pp. 173-78;<br />
Francis X. Quinn (Arbitrator), pp. 179-82 & App. 183-84; Kenneth R. Peifer (Ret. V.P., Labor<br />
Relations, CSX), pp. 185-91; Clinton J. Miller (Gen. Counsel, UTU), pp. 192-94.<br />
2. An additional 15 endnotes cover <strong>the</strong> Kaufman introduction and <strong>the</strong> four outside essays.<br />
3. The author's earlier RLA-Dilemma 118-page book is also replete with footnotes–some 436 in<br />
number.<br />
4. See reviews by William G. Mahoney, longtime counsel for Railway Labor Executives Assn.<br />
and o<strong>the</strong>r labor organizations (Mahoney, 1991, and Mahoney, 2010).<br />
5. See pp. ix-xi of RLA-Understanding. Interest-bargaining puts into play legislative support for<br />
carrier objectives, which Wilner says UTU has engaged in, in <strong>the</strong> trade-off of economic benefits<br />
between carriers and unions. It should not be confused with “interest-arbitration.” See Elkouri<br />
and Elkouri, 2002 (p. 1348), 2008 (p. 511), and 2010 (p. 533).<br />
References<br />
Elkouri, Frank and Edna Asper Elkouri. How Arbitration Works. 6th ed. A.M. Rubin, Ed. Bureau of<br />
National Affairs, 2002.<br />
Elkouri, Frank and Edna Asper Elkouri. How Arbitration Works. Supplement. Bureau of National<br />
Affairs, 2008.<br />
Elkouri, Frank and Edna Asper Elkouri. How Arbitration Works. Supplement. Bureau of National<br />
Affairs, 2010.<br />
MacDougall, Gordon. “Book Review.” <strong>Journal</strong> of <strong>the</strong> <strong>Transportation</strong> <strong>Research</strong> <strong>Forum</strong> 33, (1993):<br />
135 ff.<br />
Mahoney, William G. “Book Review.” ICC Practitioners <strong>Journal</strong> 59, (1991): 67.<br />
Mahoney, William G. “Book Review.” <strong>Journal</strong> of <strong>Transportation</strong> Law, Logistics, and Policy 77,<br />
(2010): 181.<br />
Wilner, Frank N. The Railway Labor Act and <strong>the</strong> Dilemma of Labor Relations. Simmons-Boardman,<br />
Omaha, NE, 1991.<br />
Gordon MacDougall is a transportation attorney practicing in Washington, D.C., and a member of<br />
<strong>the</strong> Wisconsin, D.C., and New York bars. He is a founding member of TRF and serves at present as<br />
Counsel for <strong>the</strong> TRF Foundation.<br />
120
<strong>Transportation</strong> <strong>Research</strong> <strong>Forum</strong><br />
Statement of Purpose<br />
The <strong>Transportation</strong> <strong>Research</strong> <strong>Forum</strong> is an independent organization of transportation professionals.<br />
Its purpose is to provide an impartial meeting ground for carriers, shippers, government officials,<br />
consultants, university researchers, suppliers, and o<strong>the</strong>rs seeking an exchange of information and<br />
ideas related to both passenger and freight transportation. The <strong>Forum</strong> provides pertinent and timely<br />
information to those who conduct research and those who use and benefit from research.<br />
The exchange of information and ideas is accomplished through international, national, and<br />
local TRF meetings and by publication of professional papers related to numerous transportation<br />
topics.<br />
The TRF encompasses all modes of transport and <strong>the</strong> entire range of disciplines relevant to<br />
transportation, including:<br />
Economics Urban <strong>Transportation</strong> and Planning<br />
Marketing and Pricing Government Policy<br />
Financial Controls and Analysis Equipment Supply<br />
Labor and Employee Relations Regulation<br />
Carrier Management Safety<br />
Organization and Planning Environment and Energy<br />
Technology and Engineering Intermodal <strong>Transportation</strong><br />
<strong>Transportation</strong> and Supply Chain Management<br />
History and Organization<br />
A small group of transportation researchers in New York started <strong>the</strong> <strong>Transportation</strong> <strong>Research</strong> <strong>Forum</strong><br />
in March 1958. Monthly luncheon meetings were established at that time and still continue. The<br />
first organizing meeting of <strong>the</strong> American <strong>Transportation</strong> <strong>Research</strong> <strong>Forum</strong> was held in St. Louis,<br />
Missouri, in December 1960. The New York <strong>Transportation</strong> <strong>Research</strong> <strong>Forum</strong> sponsored <strong>the</strong> meeting<br />
and became <strong>the</strong> founding chapter of <strong>the</strong> ATRF. The Lake Erie, Washington D.C., and Chicago<br />
chapters were organized soon after and were later joined by chapters in o<strong>the</strong>r cities around <strong>the</strong><br />
United States. TRF currently has about 300 members.<br />
With <strong>the</strong> expansion of <strong>the</strong> organization in Canada, <strong>the</strong> name was shortened to <strong>Transportation</strong><br />
<strong>Research</strong> <strong>Forum</strong>. The Canadian <strong>Transportation</strong> <strong>Forum</strong> now has approximately 300 members.<br />
TRF organizations have also been established in Australia and Israel. In addition, an International<br />
Chapter was organized for TRF members interested particularly in international transportation and<br />
transportation in countries o<strong>the</strong>r than <strong>the</strong> United States and Canada.<br />
Interest in specific transportation-related areas has recently encouraged some members of TRF<br />
to form o<strong>the</strong>r special interest chapters, which do not have geographical boundaries – Agricultural<br />
and Rural <strong>Transportation</strong>, High-Speed Ground <strong>Transportation</strong>, and Aviation. TRF members may<br />
belong to as many geographical and special interest chapters as <strong>the</strong>y wish.<br />
A student membership category is provided for undergraduate and graduate students who are<br />
interested in <strong>the</strong> field of transportation. Student members receive <strong>the</strong> same publications and services<br />
as o<strong>the</strong>r TRF members.<br />
121
Annual Meetings<br />
In addition to monthly meetings of <strong>the</strong> local chapters, national meetings have been held every year<br />
since TRF’s first meeting in 1960. Annual meetings generally last three days with 25 to 35 sessions.<br />
They are held in various locations in <strong>the</strong> United States and Canada, usually in <strong>the</strong> spring. The<br />
Canadian TRF also holds an annual meeting, usually in <strong>the</strong> spring.<br />
Each year at its annual meeting <strong>the</strong> TRF presents an award for <strong>the</strong> best graduate student paper.<br />
Recognition is also given by TRF annually to an individual for Distinguished <strong>Transportation</strong><br />
<strong>Research</strong> and to <strong>the</strong> best paper in agriculture and rural transportation.<br />
Annual TRF meetings generally include <strong>the</strong> following features:<br />
• Members are addressed by prominent speakers from government, industry, and<br />
academia.<br />
• Speakers typically summarize (not read) <strong>the</strong>ir papers, <strong>the</strong>n discuss <strong>the</strong> principal<br />
points with <strong>the</strong> members.<br />
• Members are encouraged to participate actively in any session; sufficient time is<br />
allotted for discussion of each paper.<br />
• Some sessions are organized as debates or panel discussions.<br />
122
TRF Council<br />
President<br />
Alan R. Bender<br />
Embry-Riddle Aeronautical University<br />
Executive Vice President<br />
Kristen Monaco<br />
California State University (Long Beach)<br />
Vice President – Program<br />
Jack Ventura<br />
Retired, Surface <strong>Transportation</strong> Board<br />
Vice President-Elect – Program<br />
Art Guzetti<br />
American Public <strong>Transportation</strong> Association<br />
Vice President – Chapter Relations<br />
Joe Schwieterman<br />
DePaul University<br />
Vice President – Membership<br />
David Ripplinger<br />
North Dakota State University<br />
Vice President – Academic Affairs<br />
Eric Jessup<br />
Washington State University<br />
Vice President – Public Relations<br />
Joshua Schank<br />
Eno <strong>Transportation</strong> Foundation<br />
Vice President – International Affairs<br />
Paul Bingham<br />
Wilbur Smith Associates<br />
Secretary<br />
Paul K. Gessner<br />
Gessner <strong>Transportation</strong> Consulting LLC<br />
Treasurer<br />
Carl Scheraga<br />
Fairfield University<br />
Counsel<br />
John A. DeVierno<br />
Attorney at Law, Washington, D.C<br />
Immediate Past President<br />
B. Starr McMullen<br />
Oregon State University<br />
Chicago Chapter President<br />
Joe Schwieterman<br />
DePaul University<br />
New York Chapter President<br />
Robert L. James<br />
Port Authority of NY & NJ<br />
Washington, D.C. Chapter President<br />
Stephen J. Thompson<br />
Michael Babcock<br />
JTRF Co-Editor<br />
Kansas State University<br />
Kofi Obeng<br />
JTRF Co-Editor<br />
North Carolina A&T State University<br />
TRF Foundation Officers<br />
President<br />
Jack S. Ventura<br />
Retired, Surface <strong>Transportation</strong> Board<br />
Vice President<br />
Aaron J. Gellman<br />
Northwestern University<br />
Secretary<br />
Tillman H. Neuner<br />
Consultant<br />
Treasurer<br />
Marcin Skomial<br />
Surface <strong>Transportation</strong> Board<br />
General Counsel<br />
Gordon MacDougall<br />
Attorney<br />
TRF Office<br />
www.trforum.org<br />
123
Past Presidents<br />
2010 B. Starr McMullen<br />
2009 Richard Gritta<br />
2008 Kenneth Button<br />
2007 John (Jack) V. Wells<br />
2006 Anthony M. Pagano<br />
2005 Scott E. Tarry<br />
2004 John S. Strong<br />
2003 C. Gregory Bereskin<br />
2002 Martin Dresner<br />
2001 Mark R. Dayton<br />
2000 Richard S. Golaszewski<br />
1999 Aaron J. Gellman<br />
1998 Richard Beilock<br />
1997 Robert Harrison<br />
1996 Clinton V. Oster, Jr.<br />
1995 Paul K. Gessner<br />
1994 Russell B. Capelle, Jr.<br />
1993 Louis A. LeBlanc<br />
1992 Stephen J. Thompson<br />
1991 Joanne F. Casey<br />
1990 Frederick J. Beier<br />
1989 Thomas N. Harvey<br />
1988 Joedy W. Cambridge<br />
1987 Frederick C. Dunbar<br />
1986 Carl D. Martland<br />
1985 Allan D. Schuster<br />
1984 Douglas McKelvey<br />
1983 William B. Tye<br />
1982 Michael S. Bronzini<br />
1981 Jay A. Smith, Jr.<br />
1980 Samual E. Eastman<br />
1979 Lana R. Batts<br />
1978 Carl J. Liba<br />
1977 Gerald Kraft<br />
1976 Edward Morlok<br />
1975 Barry A. Brune<br />
1974 Richard Shackson<br />
1973 Harvey M. Romoff<br />
1972 Arthur Todd<br />
1971 Herbert E. Bixler<br />
1970 Paul H. Banner<br />
1969 George W. Wilson<br />
1968 Donald P. MacKinnon<br />
1967 David L. Glickman<br />
1966 Edward Margolin<br />
1965 Robert A. Bandeen<br />
1964 Gayton Germane<br />
1963 Herbert O. Whitten<br />
1962 Herbert O. Whitten<br />
1961 Herbert O. Whitten<br />
1960 Herbert O. Whitten<br />
1959 John Ingram (TRF of NY)<br />
1958 Herbert O. Whitten (TRF of NY)<br />
124<br />
Recipients of <strong>the</strong> TRF Distinguished<br />
<strong>Transportation</strong> <strong>Research</strong>er Award<br />
2011 Martin Wachs<br />
2010 Clifford Winston<br />
2009 Daniel McFadden<br />
2008 Steven A. Morrison<br />
2007 José A. Gomez-Ibanez<br />
2006 Tae H. Oum<br />
2005 Kenneth Button<br />
2004 Kenneth Small<br />
2000 Michael E. Levine<br />
1998 Edward K. Morlok<br />
1997 Carl D. Martland<br />
1996 Benjamin J. Allen<br />
1995 D. Philip Locklin<br />
1994 Martin T. Farris<br />
1993 C. Phillip Baumel<br />
1992 Alan A. Altshuler<br />
1990 George W. Wilson, Ph.D.<br />
1989 Sir Alan Arthur Walters, B. Sci., Hon.<br />
D. Soc. Sci.<br />
1988 Karl M. Ruppenthal, Ph.D.<br />
1987 William S. Vickrey, Ph.D.<br />
1986 William J. Harris, D. Sci., Hon. D.<br />
Eng.<br />
1985 John R. Meyer, Ph.D.<br />
1984 Alfred E. Kahn, Ph.D.<br />
1982 W. Edwards Deming, Ph.D.<br />
1979 James C. Nelson, Ph.D.<br />
1978 James R. Nelson, Ph.D.<br />
1977 Lewis K. Sillcox, D. Sci., D. Eng.,<br />
LL.D., D.H.L.<br />
Recipients of <strong>the</strong> Herbert O. Whitten<br />
TRF Service Award<br />
2011 Anthony Pagano<br />
2010 Captain James R. Carman<br />
2009 John (Jack) Wells<br />
2008 Gordon MacDougall<br />
2007 Robert T. Beard<br />
2006 Gene C. Griffin<br />
2005 Michael W. Babcock<br />
2004 Jack S. Ventura<br />
2000 Paul K. Gessner<br />
1998 Arthur W. Todd<br />
1996 Stephen J. Thompson<br />
1994 Samuel Ewer Eastman<br />
1991 Carl D. Martland, C.E.<br />
1990 Herbert O. Whitten, M.B.A.
Past Editors of JTRF<br />
Wayne K. Talley (1998-2000)<br />
K. Eric Wolfe (1993-1998)<br />
Kevin H. Horn (1993-1998)<br />
Anthony M. Pagano (1987-1993)<br />
Richard Beilock (1987-1993)<br />
Recipients of <strong>the</strong> TRF Best Paper Award<br />
2011 Alexander Bigazzi and Miguel Figliozzi, A Model and Case Study of <strong>the</strong> Impacts of<br />
Stochastic Capacity on Freeway Traffic Flow and Benefits Costs<br />
2010 Tony Diana, Predicting Arrival Delays: An Application of Spatial Analysis<br />
2009 Tae H. Oum, Jia Yan, and Chunyan Yu, Ownership Forms Matter for Airport Efficiency:<br />
A Stochastic Frontier Investigation of Worldwide Airports<br />
2008 C. Gregory Bereskin, Railroad Cost Curves Over Thirty Years – What Can They Tell Us?<br />
2007 Rob Konings, Ben-Jaap Pielage, Johan Visser, Bart Wiegmans, “Container Ports and<br />
Their Hinterland: Multimodal Access and Satellite Terminals within <strong>the</strong> Extended<br />
Gateway Concept”<br />
2006 Ian Savage, Trespassing on <strong>the</strong> Railroad.<br />
2005 Patrick DeCorla-Souza, A New Public-Private Partnership Model for Road Pricing<br />
Implementation.<br />
2004 Ian Savage and Shannon Mok, Why Has Safety Improved at Rail-Highway Crossings?<br />
2000 Ian Savage, Management Objectives and <strong>the</strong> Causes of Mass <strong>Transportation</strong>.<br />
1999 C. Phillip Baumel, Jean-Philippe Gervais, Marty J. McVey, and Takehiro Misawa,<br />
Evaluating <strong>the</strong> Logistics Economic Impacts of Extending Six Hundred Foot Locks on <strong>the</strong><br />
Upper Mississippi River: A Linear Programming Approach.<br />
1998 Carl Scheraga and Patricia M. Poli, Assessing <strong>the</strong> Relative Efficiency and Quality of<br />
Motor Carrier Maintenance Strategies: An Application of Data Entry Envelopment<br />
Analysis.<br />
1997 Wayne K. Talley and Ann Schwarz-Miller, Motor Bus Deregulation and Racial/Gender<br />
Effects: Earnings and Employment.<br />
1996 Todd Litman, Full Cost Accounting for <strong>Transportation</strong> Decision Making: Estimates,<br />
Implications and Applications.<br />
1995 Leon N. Moses and Ian Savage, A Cost-Benefit Analysis of United States Motor Carrier<br />
Safety Programs.<br />
1994 Brian Shaffer and James Freeman, Variation in Producer Responses to Automobile Fuel<br />
Economy Mandates.<br />
1993 W. Bruce Allen and Dong Liu, Service Quality and Motor Carrier Costs: An Empirical<br />
Analysis.<br />
1992 Victor E. Eusebio, Stephen J. Rindom, Ali Abderrezak, and John Jay Rosacker, Rail<br />
Branch Lines at Risk: An Application of <strong>the</strong> Exponential Survival Model on Kansas<br />
Duration Data.<br />
1991 Patrick Little, Joseph M. Sussman, and Carl Martland, Alternative Freight Car<br />
Maintenance Policies with Attractive Reliability/Cost Relationships.<br />
1990 James A. Kling, Curtis M. Grimm, and Thomas M. Corsi, Strategies of Challenging<br />
Airlines at Hub-Dominated Airports.<br />
125
1989 Cathy A. Hamlett, Sherry Brennan, and C. Phillip Baumel, Local Rural Roads: A Policy<br />
Analysis.<br />
1988 John R. Brander, B. A. Cook, and John Rowcroft, Auctioning Runway Slots: Long Term<br />
Implications.<br />
1987 Clinton V. Oster, Jr. and C. Kurt Zorn, Deregulation’s Impact on Airline Safety.<br />
1986 Chulam Sarwar and Dale G. Anderson, Impact of <strong>the</strong> Staggers Act on Variability and<br />
Uncertainty of Farm Product Prices.<br />
1985 Brian D. Adam and Dale G. Anderson, Implications of <strong>the</strong> Staggers Rail Act of 1980 for<br />
Level and Variability of Country Elevator Bid Prices.<br />
Donald J. Harmatuck, Back Haul Pricing: Ma<strong>the</strong>matical Programming and Game<br />
Theory Approaches to Allocating Joint Costs.<br />
Jeffrey L. Jordan, Dieudonne Mann, S. E. Pressia, and C. Thai, Managing <strong>the</strong><br />
<strong>Transportation</strong> of Perishable Commodities: Temperature Control and Stacking Patterns.<br />
1984 K. Eric Wolfe, An Examination of Risk Costs Associated with <strong>the</strong> Movement of Hazardous<br />
Materials.<br />
1983 Denver D. Tolliver, Economics of Density in Railroad Cost-Finding: Applications to Rail<br />
Form A.<br />
1982 Jeffrey Beaulieu, Robert J. Hauser, and C. Phillip Baumel, Inland Waterway User Taxes:<br />
Their Impacts on Corn, Wheat and Soybean Flows and Transport Costs.<br />
126
<strong>Journal</strong> of <strong>the</strong> <strong>Transportation</strong> <strong>Research</strong> <strong>Forum</strong><br />
Guidelines for Manuscript Submission<br />
1. Submit manuscripts by e-mail or hardcopy to ei<strong>the</strong>r General Editor at:<br />
Michael W. Babcock Kofi Obeng<br />
Co-General Editor, JTRF Co-General Editor, JTRF<br />
Department of Economics Dept. of Economics & <strong>Transportation</strong>/Logistics<br />
Kansas State University School of Business and Economics<br />
Manhattan, KS 66506 U.S.A. North Carolina A&T University<br />
Phone: (785) 532-4571 Greensboro, NC 27411 U.S.A.<br />
Fax: (785) 532-6919 Phone: (336) 334-7231<br />
Email: mwb@ksu.edu Fax: (336) 334-7093<br />
E-mail: obengk@ncat.edu<br />
2. E-mail submissions must be in MS WORD.<br />
3. Final manuscript and abstract (hard or e-mail copy) must be received as soon as possible.<br />
4. The text of manuscripts is to be double-spaced. Use one side of each page only. Articles are limited<br />
to a maximum length of 30 pages; industry issue papers and comments are limited to a maximum<br />
of 15 pages.<br />
5. The manuscript should have a title page which includes <strong>the</strong> names, affiliations, address (mailing<br />
and e-mail) and phone numbers of all authors. Brief biographical sketches for all authors should be<br />
included with <strong>the</strong> manuscript.<br />
6. The abstract should briefly describe <strong>the</strong> contents, procedures and results of <strong>the</strong> manuscript, not its<br />
motivation, and should not exceed 100 words.<br />
7. Endnotes are to be used ra<strong>the</strong>r than footnotes, used sparingly and placed at <strong>the</strong> end of <strong>the</strong><br />
manuscript. Do NOT use <strong>the</strong> endnote feature of <strong>the</strong> word processing software.<br />
8. The Chicago Manual of Style is to be used for endnotes and references. At <strong>the</strong> end of <strong>the</strong><br />
manuscript, complete references are listed alphabetically (not by number) by author surname,<br />
government agency, or association name. Use <strong>the</strong> following examples.<br />
Book:<br />
Jones, Robert T. Improving Airline <strong>Transportation</strong>. General Publishing Company, Washington,<br />
D.C., 2002.<br />
Chapter in a Book:<br />
Bresnahan, T.F. “Empirical Studies of Industries with Market Power.” R. Schmalensee and R.<br />
Williq eds. Handbook of Industrial Organization. Amsterdam: North Holland (1989): 1011-<br />
1057.<br />
<strong>Journal</strong> Article:<br />
Kane, Louis R. “Grain Transport Rate Projections.” <strong>Transportation</strong> <strong>Journal</strong> 2, (1999): 20-40.<br />
<strong>Journal</strong> Article with Multiple Authors:<br />
Chow, G., R. Gritta, and E. Leung. “A Multiple Discriminant Analysis Approach to Gauging<br />
Air Carrier Bankruptcy Propensities: The AIRSCORE Model.” <strong>Journal</strong> of <strong>the</strong> <strong>Transportation</strong><br />
<strong>Research</strong> <strong>Forum</strong> 31 (2), (1991): 371-377.<br />
127
128<br />
Ph.D Dissertation:<br />
Jessup, E.L. “<strong>Transportation</strong> Optimization Marketing for Commodity Flow, Private Shipper Costs,<br />
and Highway Infrastructure, Impact Analysis.” Dissertation (Ph.D). Washington State University,<br />
1998.<br />
Government Document:<br />
U.S. Senate. Committee on Foreign Relations, Investigations of Mexican Affairs. 2 vols. 66th<br />
Cong., 2nd session, 1919-20.<br />
9. Tables, figures, graphs, and charts should be titled and numbered by an Arabic numeral (e.g.,<br />
Figure 2). All figures and charts should be submitted as separate files. Any graphics or photos must<br />
be 300 dpi and submitted as a separate .tif or .eps file.<br />
10. Headings should adhere to <strong>the</strong> following style. Place <strong>the</strong> abstract below <strong>the</strong> title of <strong>the</strong> manuscript.<br />
• First level headings should be all caps, left justified.<br />
• Second level headings should be initial caps, left justified.<br />
• Third level headings should be initial caps on <strong>the</strong> same line as <strong>the</strong> first paragraph which it heads.<br />
• Do not number <strong>the</strong> headings.<br />
11. Submit your final copy in “MS WORD” only.<br />
12. For proper preparation of all charts, figures, maps and photos call Beverly Trittin, North Dakota<br />
State University, at (701) 231-7137 or bev.trittin@ndsu.edu prior to submitting <strong>the</strong> final version of<br />
your paper. The journal is printed in black and white, <strong>the</strong>refore, all graphics must be submitted in<br />
black and white, or grayscale.<br />
TIPS:<br />
• Photographs to be submitted as 200 dpi or higher resolution (.jpg, .tif , .eps format).<br />
• Images taken from <strong>the</strong> web are 72 dpi and not print quality. Secure high resolution image<br />
if possible.<br />
• Do not embed graphics in Word – submit as individual files (.jpg, .tif, .eps format).<br />
• Improper graphics or images will be returned to author for correct formatting.<br />
Book Review Information<br />
Books for review should be mailed to:<br />
Dr. Jack Ventura<br />
Book Review Editor<br />
1025 Chiswell Lane<br />
Silver Spring, MD 20901<br />
Phone: (301) 593-1872<br />
Email: jack.ventura@verizon.net<br />
JTRF Information<br />
The <strong>Journal</strong> of <strong>the</strong> <strong>Transportation</strong> <strong>Research</strong><br />
<strong>Forum</strong> is distributed to members of <strong>the</strong><br />
<strong>Transportation</strong> <strong>Research</strong> <strong>Forum</strong>.<br />
Copyright 2011<br />
The <strong>Transportation</strong> <strong>Research</strong> <strong>Forum</strong><br />
All Rights Reserved<br />
ISSN 1046-1469
The <strong>Transportation</strong> <strong>Research</strong> <strong>Forum</strong> gratefully acknowledges <strong>the</strong> contributions<br />
of sponsoring and sustaining members.<br />
Supporting Members<br />
Michael Babcock, Kansas State University<br />
Marcus Bowman<br />
Paul K. Gessner, Gessner <strong>Transportation</strong> Consulting LLC<br />
Larry Jenkins, Embry-Riddle Aeronautical University<br />
Jack S. Ventura, Surface <strong>Transportation</strong> Board<br />
John (Jack) V. Wells, U.S. Department of <strong>Transportation</strong>