Connecting Delta Cities (english) - Rotterdam Climate Initiative
Connecting Delta Cities (english) - Rotterdam Climate Initiative
Connecting Delta Cities (english) - Rotterdam Climate Initiative

Create successful ePaper yourself
Turn your PDF publications into a flip-book with our unique Google optimized e-Paper software.
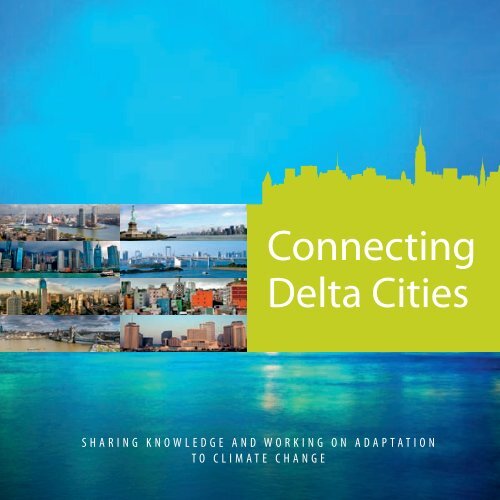
<strong>Connecting</strong><br />
<strong>Delta</strong> <strong>Cities</strong><br />
S H A R I N G K N O W L E D G E A N D W O R K I N G O N A D A P T A T I O N<br />
T O C L I M A T E C H A N G E
SHARING KNOWLEDGE AND WORKING ON ADAPTATION<br />
TO CLIMATE CHANGE
P IET DIRC KE, <strong>Rotterdam</strong> University of Applied Sciences<br />
JEROEN AERTS, VU University Amsterd am<br />
ARNOUD MOLENAAR, City of <strong>Rotterdam</strong><br />
<strong>Connecting</strong><br />
<strong>Delta</strong> <strong>Cities</strong><br />
3
Colophon
Authors<br />
We would like to thank all the authors who<br />
contributed to this second CDC book and others that<br />
helped us to make this a success. In particular we<br />
would like to thank:<br />
Alex Nickson (Greater London Authority), David<br />
Waggonner (Waggonner & Ball Architects), Andy<br />
Sternad (Waggonner & Ball Architects), Philip Ward<br />
(VU University Amsterdam), Muh Aris Marfai (Faculty<br />
of Geography, Gadjah Mada University, Yogyakarta),<br />
Aisa Tobing (Governor’s Offi ce, Jakarta), Pieter<br />
Pauw (VU University Amsterdam), Maria Francesch<br />
(City University of Hong Kong), Bianca Stalenberg<br />
(ARCADIS | Delft Technical University), Yoshito<br />
Kikumori (Japan National Institute for Land<br />
and Infrastructure Management), Philip Bubeck<br />
(VU University Amsterdam) and Professor<br />
Ho Long Phi (HCMC University of Technology<br />
(National University HCMC).<br />
Chapters 1 and 3 of this second CDC book are largely<br />
based on the material on the same topics (climate<br />
adaptation in general and New York City) that were<br />
presented in the fi rst CDC book. Most of the work<br />
on these topics in the fi rst CDC book was carried<br />
out by David Major of Columbia University and<br />
Malcolm Bowman of Stonybrook University. David<br />
and Malcolm as well, and their respective universities,<br />
contributed signifi cantly to the success of the fi rst<br />
CDC book.<br />
Sponsors<br />
This book has been sponsored by the City of<br />
<strong>Rotterdam</strong>, the <strong>Rotterdam</strong> <strong>Climate</strong> Proof <strong>Initiative</strong>,<br />
VU University Amsterdam, <strong>Rotterdam</strong> University of<br />
Applied Sciences and ARCADIS. The <strong>Connecting</strong> <strong>Delta</strong><br />
<strong>Cities</strong> network has been addressed as a joint action<br />
under the C40 initiative, a group of the world’s largest<br />
cities and a number of affi liated cities committed to<br />
taking action on climate change. For more information<br />
on these initiatives and their relation to <strong>Connecting</strong><br />
<strong>Delta</strong> <strong>Cities</strong>, see: www.deltacities.com.<br />
Acknowledgements<br />
We gratefully acknowledge the generous support and<br />
participation of Jim Hall (Tyndall Centre for <strong>Climate</strong><br />
Change Research, Newcastle University), Roger Street<br />
(United Kingdom <strong>Climate</strong> Impacts Programme),<br />
Shoichi Fujita (Nagaoka University of Technology,<br />
Japan), HCMC University of Technology (National<br />
University HCMC) and Darryn McEvoy (Victorian Centre<br />
for <strong>Climate</strong> Change Adaptation Research, Melbourne).<br />
We would also like to thank everyone who contributed<br />
in so many ways to make this second <strong>Connecting</strong><br />
<strong>Delta</strong> <strong>Cities</strong> book a success. In particular we would<br />
like to thank Kim van den Berg, Gertjan Jobse, Jeanna<br />
Blatt, Chantal Oudkerk Pool, Lissy Nijhuis, Liek Voorbij,<br />
Rick Heikoop, Marijn Kuitert and Marco van Bodegom<br />
(Beau-Design) for their support.<br />
Copyright © 2010 City of <strong>Rotterdam</strong> / ISBN 978-90-816067-1-4<br />
All rights reserved. No part of this publication may be reproduced,<br />
stored in a retrieval system or transmitted in any form or by any means,<br />
electronic, mechanical, by photocopying, recording or otherwise<br />
without the prior written permission of the copyright holder.<br />
C O N N E C T I N G D E L T A C I T I E S 5
Contents
Colophon<br />
Preface<br />
1. <strong>Climate</strong> change in delta cities<br />
1.1 Introduction<br />
1.2 A changing global environment<br />
2. Introducing CDC<br />
2.1 Introduction<br />
2.2 The CDC network k in practice<br />
4<br />
10<br />
12<br />
14<br />
16<br />
9<br />
20<br />
21<br />
23<br />
3. <strong>Rotterdam</strong><br />
3.1 Introduction<br />
3.2 Present situation<br />
3.3 <strong>Climate</strong> and flood fl risks<br />
3.4 <strong>Climate</strong> adaptation<br />
3.5 <strong>Rotterdam</strong> adaptation strategy<br />
4. New York<br />
4.1 Introduction<br />
4.2 Present situation<br />
4.3 <strong>Climate</strong> and flood fl risks<br />
4.4 <strong>Climate</strong> adaptation<br />
C O N N E C T I N G D E L T A C I T I E S 7<br />
28<br />
29<br />
31<br />
32<br />
37<br />
44<br />
46<br />
47<br />
50<br />
51<br />
55
5. Jakarta<br />
5.1 Introduction<br />
5.2 Present situation<br />
5.3 <strong>Climate</strong> and fl flood risks<br />
5.4 <strong>Climate</strong> adaptation<br />
6. London<br />
6.1 Introduction<br />
6.2 Present situation<br />
6.3 <strong>Climate</strong> and fl flood risks<br />
6.4 <strong>Climate</strong> adaptation<br />
6.5 From strategy to delivery<br />
60<br />
61<br />
63<br />
65<br />
67<br />
72<br />
73<br />
75<br />
76<br />
79<br />
81<br />
7. New Orleans<br />
7.1 Introduction<br />
7.2 Present situation<br />
7.3 <strong>Climate</strong> and fl flood risks<br />
7.4 <strong>Climate</strong> adaptation<br />
8. Hong Kong<br />
8.1 Introduction<br />
8.2 Present situation<br />
8.3 <strong>Climate</strong> and fl flood risks<br />
8.4 <strong>Climate</strong> adaptation<br />
86<br />
87<br />
89<br />
93<br />
97<br />
100<br />
101<br />
103<br />
105<br />
109
9. Tokyo<br />
9.1 Introduction<br />
9.2 Present situation<br />
9.3 <strong>Climate</strong> and fl ood risks<br />
9.4 <strong>Climate</strong> adaptation<br />
10. Ho Chi Minh City<br />
10.1 Introduction<br />
10.2 Present situation<br />
10.3 <strong>Climate</strong> and fl ood risks<br />
10.4 <strong>Climate</strong> adaptation<br />
114<br />
115<br />
117<br />
119<br />
123<br />
126<br />
127<br />
129<br />
131<br />
135<br />
11. Conclusions on best<br />
CDC practices<br />
11.1 Introduction<br />
11.2 Best practices<br />
11.3 Future outlook<br />
References<br />
C O N N E C T I N G D E L T A C I T I E S 9<br />
138<br />
139<br />
140<br />
146<br />
6<br />
154
D. Miller<br />
Preface<br />
A. Aboutaleb
The world is currently facing a new challenge. <strong>Climate</strong><br />
change will have a severe and inevitable impact, even<br />
if we do succeed in substantially reducing its causes<br />
and mitigating its eff ects. Water levels will rise, both in<br />
the seas and in the rivers that run through our cities.<br />
Precipitation levels will increase, and groundwater<br />
levels will change. Preventing or limiting ensuing<br />
damage will require a great deal of eff ort.<br />
The delta cities described in this book are thoroughly<br />
aware of the necessity to step up these eff orts.<br />
Courage and leadership is required on the part of local<br />
government to make decisions now that will fi ll our<br />
children with pride in the future; and to take measures<br />
to provide safety to our residents and to preserve the<br />
economic appeal of our cities.<br />
Of at least equal importance as decisive management<br />
and leadership is the availability of scientifi c<br />
knowledge. Certain measures that are needed fall<br />
outside the scope of our current technological<br />
ingenuity. Sharing and exchanging insights and<br />
experiences with projects in the area of water<br />
management and delta technology will contribute<br />
to the development of the necessary new expertise.<br />
It gives us great satisfaction to observe that, more<br />
and more, cities are willing and prepared to share<br />
knowledge and opportunities for improvement.<br />
Rather than copying the insights that are gained,<br />
other delta cities subsequently apply adapted versions<br />
according to their own situation. This allows individual<br />
cities to defi ne ambitious goals and actually realize<br />
them. It is for this reason that <strong>Rotterdam</strong> can state with<br />
confi dence that by 2025, the city will be fully climate<br />
proof.<br />
This book is a sequel on the fi rst <strong>Connecting</strong> <strong>Delta</strong><br />
<strong>Cities</strong> book and builds a bridge between delta cities of<br />
global stature: New York, Jakarta, <strong>Rotterdam</strong>, London,<br />
New Orleans, Hong Kong, Tokyo and Ho Chi Minh<br />
City. These are just eight of the dozens of cities on this<br />
earth that are confronted with the major challenge of<br />
developing integrated climate adaptation strategies.<br />
Each of these cities grapples with its own problems<br />
and devises its own solutions. What binds these<br />
cities, however, is their common determination to<br />
win this fi ght and to become delta cities of the future;<br />
sustainable and climate proof.<br />
Hosts of the International Conference ‘<strong>Delta</strong>s in Times<br />
of <strong>Climate</strong> Change’, <strong>Rotterdam</strong>, 29 September 2010:<br />
A. Aboutaleb<br />
Mayor of <strong>Rotterdam</strong>,<br />
The Netherlands<br />
D. Miller<br />
Chairman C40 and Mayor of Toronto,<br />
Canada<br />
11
1<br />
<strong>Climate</strong> change<br />
in delta cities<br />
by Jeroen Aerts and Piet Dircke<br />
13
1<br />
1<br />
Introduction<br />
Currently, more than half of the world’s population<br />
lives in cities, especially in vulnerable delta cities. It<br />
is estimated that more than two thirds of the world’s<br />
large cities will be vulnerable to rising sea levels and<br />
climate change, with millions of people being exposed<br />
to the risk of extreme fl oods and storms. By the middle<br />
of this century, the majority of the world’s population<br />
will live in cities in or near deltas, estuaries or coastal<br />
zones, resulting in even more people living in highly<br />
exposed areas. Such socioeconomic trends further<br />
amplify the possible consequences of future fl oods,<br />
as more people move toward urban delta areas and<br />
capital is continuously invested in ports, industrial<br />
centres and fi nancial businesses in fl ood-prone areas.<br />
It is also expected that the frequency, intensity and<br />
duration of extreme precipitation events will increase,<br />
as well as the frequency and duration of droughts.<br />
At the same time, many delta cities suff er from<br />
severe land subsidence. As a consequence of these<br />
urban developments, trends and projections for land<br />
subsidence and climate change, the vulnerability of<br />
our delta cities is expected to increase in the decades<br />
G1, G2<br />
to come.<br />
The issue of climate adaptation is very complex, and<br />
there is no single readily available adaptation solution<br />
applicable to all delta cities. Adaptation is partly a<br />
matter of learning by doing of allowing experiments<br />
and innovation. On the other hand, there is the need<br />
to keep all options open because of the uncertainty<br />
of future scenarios – one can never predict exactly<br />
how the future will develop and what measures will<br />
be needed. Hence, climate-robust and fl exible, noregret<br />
or low-regret measures should be considered.<br />
In addition, complicated issues like policy making,<br />
stakeholder involvement and fi nancing new measures<br />
may hinder the speedy implementation of adaptation<br />
measures, and may cut ambitious plans to more<br />
modest levels. It is therefore important to consider a<br />
variety of possible measures in the planning process of<br />
climate adaptation, and to learn from the experiences<br />
of other areas and coastal cities.<br />
<strong>Cities</strong> play an important role in the climate adaptation<br />
process since they have already developed the ability<br />
to adapt continuously to change and attract economic<br />
activity and investment. One could say cities have<br />
already been adapting to changing conditions for<br />
many years or even centuries, and climate change is<br />
an additional challenge that needs to be addressed<br />
in cities’ planning, investments and regulations.<br />
Many cities are gradually taking on the issue of<br />
climate adaptation and there is a growing interest in
sharing and exchanging experience and knowledge<br />
between cities. Since the choices made today will<br />
influence fl vulnerability to climate risks in the future, it<br />
is important to link k adaptation measures to ongoing<br />
investments in infrastructure and spatial planning,<br />
and to draw up detailed estimates of f the benefits fi<br />
of f adaptation. In this way, adaptation becomes a<br />
challenge rather than a threat, and climate adaptation<br />
may initiate opportunities and innovations for<br />
investors and spatial planners.<br />
This book k explores the different ff aspects of f climate<br />
adaptation in delta cities. It is an investigation of<br />
comparable adaptation challenges and opportunities<br />
and of f progress in adaptation plans and investments<br />
in the eight <strong>Connecting</strong> <strong>Delta</strong> <strong>Cities</strong> (CDC) cities of<br />
<strong>Rotterdam</strong>, New York, Jakarta, London, New Orleans,<br />
Hong Kong, Tokyo and Ho Chi Minh City. Other climate<br />
adaptation networks like The <strong>Delta</strong> Alliance and recent<br />
climate adaptation initiatives and events such as these<br />
in Melbourne and Shanghai are also described in the<br />
book.<br />
The bookk is second in a series off CDC books. The first fi<br />
CDC book, launched during the Henry Hudson 400<br />
celebrations in New York, was published in 2009 and<br />
described climate adaptation in NewYork, <strong>Rotterdam</strong><br />
and Jakarta. A third CDC book k is expected to cover the<br />
implementation off climate adaptation strategies.<br />
This second book k focuses on the expanding<br />
<strong>Connecting</strong> <strong>Delta</strong> <strong>Cities</strong> network k and the experiences<br />
off coastal cities on the topic of f climate adaptation<br />
and flood fl risk. In this regard, each city faces different ff<br />
challenges. One off the lessons off the <strong>Connecting</strong><br />
<strong>Delta</strong> <strong>Cities</strong> initiative is that while cities will follow<br />
adaptation paths that may diff ffer, sometimes<br />
substantially, each city can learn from other cities.<br />
Moreover, while this book k focuses largerly on coastal<br />
flooding, fl it is important to note that each off the CDC<br />
cities is also affected ff by climate change in other ways,<br />
including impacts that occur away from the coast.<br />
Figure 1.1 The first fi <strong>Connecting</strong> <strong>Delta</strong> <strong>Cities</strong> book.<br />
C L I M A T E C H A N G E I N D E L T A C I T I E S 15
1<br />
2<br />
A changing global<br />
environment<br />
The IPCC fourth Assessment Report states that it is<br />
inevitable that flood fl risks and other climate change<br />
impacts will continue to increase, and that adaptation<br />
measures and policies need to be developed parallel<br />
G3 tomitigation efforts. ff The question is not if, but how<br />
quickly societies and cities will need toadapt.<br />
Adaptation to changing climatic and socioeconomic<br />
conditions is not new; cities have been adapting to<br />
societal and environmental changes for centuries.<br />
However, the world of f today is much more complex<br />
than it was in the past, and interventions taken<br />
to adapt to climate change in one sector have<br />
significant fi impacts on other economic sectors and<br />
on theenvironment. Adaptation toclimate change,<br />
therefore, requires a holistic approach, where all<br />
sectors and stakeholders participate in order to<br />
include long-term adaptation planning in their daily<br />
operations.<br />
Existing climate policy documents statethat longterm<br />
planning is the key to successful adaptation.<br />
Eff ff ective land use planning is crucial for enhancing<br />
the cities’ ’ adaptive capacities to climate change.<br />
The role of f stakeholders in the development<br />
and implementation of f adaptation measures is<br />
a key ingredient. Eff ffective adaptation requires<br />
the local implementation of f measures, and<br />
requires collaborating with NGOs to improve<br />
interrelationships with local institutions.<br />
A participative approach ensures that stakeholders<br />
can express their objectives, concerns and visions,<br />
and stimulates the development and implementation<br />
of f innovative ideas in the adaptation process. An<br />
adaptation process also increases the commitment of<br />
stakeholders to ensure new measures are accepted<br />
and implemented.
The development of f adaptation strategies that focus<br />
on opportunities, and that are based on a holistic<br />
approach, requires strong leadership because it is<br />
about more than just taking measures. It’s about a<br />
long-term strategy as a framework k for short-term<br />
action, a joint approach and vision development.<br />
The significance fi off cities and municipalities in climate<br />
change adaptation is increasing because climate<br />
adaptation requires tailor made local measures<br />
in which urban planning plays an important role.<br />
Coastal mega-cities are influential fl and important for<br />
sustaining the environment in which their citizens<br />
live. Therefore it makes sense to have a CDC network.<br />
In international forums, like the WWF World Water<br />
forum, the cities appear more and more prominently<br />
on the agenda (e.g. the WWF city summit and<br />
champion cities network); not only when it comes to<br />
local water management and climate change issues,<br />
but also in the specific fi approach and steering of<br />
global issues. Think k global and act local is more and<br />
more a reality. Also in this sense, the CDC can become<br />
a powerful network.<br />
Urban development<br />
Population growth and, as a consequence, urban<br />
development, has an enormous impact on land use.<br />
Studies carried out to assess the effects ff off population<br />
growth and land use change in the lower Netherlands<br />
show that flood fl risks have increased by a factor of<br />
seven over the last fi fifty years due to urbanization and<br />
land use change. Thus, even without climate change,<br />
fl flood risk k in urbanized deltas will increase simply<br />
because residents and businesses continue to settle<br />
in vulnerable locations.<br />
Furthermore, research shows that by 2025, loss<br />
potentials among the world’s ten largest cities are<br />
projected to increase by at least 22 percent (Tokyo),<br />
and up to more than 50 percent in Shanghai and<br />
Jakarta. A repeat in the year 2025 of f the fl floods<br />
experienced in Jakarta in 2007 could cause<br />
60 percent higher losses and affect ff 20 percent more<br />
people because of f population and economic growth,<br />
independent of f climate change. Since economic<br />
growth and urban development in these areas is<br />
inevitable, and the economic impacts of f climate<br />
change may not be limited to the city boundaries<br />
alone, rising sea levels could have devastating effects ff<br />
on the worldwide population and economic activity<br />
in the future.<br />
<strong>Climate</strong> change, subsidence and sea levelrise<br />
Sea level rise is a natural phenomenon, and historical<br />
measurements in several delta cities such as New York<br />
C L I M A T E C H A N G E I N D E L T A C I T I E S 17
and <strong>Rotterdam</strong>, show an increase in mean sea level<br />
rise off 17-22 cm over the last hundred years. Prior to<br />
the Industrial Revolution, sea level rise in New York<br />
and <strong>Rotterdam</strong> could be attributed mainly to regional<br />
subsidence of f the Earth’s crust, whichisstill slowly<br />
readjusting to the melting off ice sheets since the end<br />
of f the last Ice Age. G4, G5 For New York k and <strong>Rotterdam</strong>,<br />
land subsidence accounts for 3-4 mm per year, mainly<br />
due to these post-glacial geological processes. But<br />
much higher subsidence rates occur as well. For<br />
example in Jakarta parts of f the city are sinking at a<br />
rate of f 4 cm per year, mainly due to groundwater<br />
extraction.<br />
<strong>Climate</strong> change, however, will accelerate natural<br />
sea level rise through the thermal expansion off the<br />
oceans, melting of f glaciers and ice sheets, changes<br />
in the accumulation of f snow and melting of f the<br />
ice sheets in Antarctica and Greenland. It may also<br />
change the paths and speeds of f major ocean<br />
current systems. The Fourth Assessment Report of<br />
the Intergovernmental Panel on <strong>Climate</strong> Change G6<br />
projected anincrease in global temperature of<br />
between 1.1°C and 6.4°C over the next century.<br />
As a result, average sea levels could rise by up to<br />
59 cm by 2100.<br />
There are regional differences ff in projected sea level<br />
rise, and it is expected that sea levels in the northeast<br />
of f the Atlantic Ocean will rise by 15 cm more than the<br />
world average by 2100. This can be explained through<br />
the weakening of f the warm Gulf f Stream, gravitational<br />
effects ff and the extra warming of f seawater at greater<br />
depths. The projected sea level rise for <strong>Rotterdam</strong><br />
and New York, for instance, is estimated at around<br />
50-85 cm by 2100. The most extreme, low- probability,<br />
scenarios indicate a sea level rise off 108-140 cm. Large<br />
uncertainty exists about the future behaviour of f the<br />
large ice sheets in Greenland and Antarctica. Although<br />
it is not well understood how quickly the ice sheets<br />
will melt, a theoretical collapse of f the Greenland<br />
and West and East Antarctica ice sheets through<br />
accelerated glacier flow fl is expected to lead to a rise in<br />
sea level of f several metres over the coming centuries.<br />
Flood risk k vulnerability<br />
Important elements of f fl flood vulnerability are: (1) the<br />
probability off a fl flood occurring and (2) the possible<br />
consequences off a flood fl in terms of f casualties, direct<br />
economic damage (such as destruction off houses) and<br />
intangible damage (such as production loss and loss<br />
of f natural values). Furthermore, flood fl vulnerability is<br />
also determined by (3) the adaptive capacity of f a city
or system following the event through evacuation,<br />
recovery, fi nancial aid and insurance relief options.<br />
Estimates of fl ood risk and fl ood vulnerability can be<br />
further disaggregated into vulnerability to coastal<br />
fl oods, vulnerability to river fl oods and vulnerability<br />
to extreme rainfall. In all three cases the impact can<br />
be very high with numerous casualties and much<br />
damage to property.<br />
Extreme fl ood events are relatively rare, with typical<br />
return periods of one hundred years and higher.<br />
Extreme precipitation events in non-tropical cities<br />
rarely cause casualties, but do frequently cause<br />
damage to property and infrastructure. Tropical<br />
cities like Hong Kong, however, have interested<br />
historic events recorded where extreme rainfall has<br />
caused fl ash fl ooding and mud fl ows, leading to<br />
casualties and fl ood damage in parts of the cities.<br />
It should be noted that vulnerability is not a static<br />
concept. If fl ood protection is improved or evacuation<br />
plans are developed, vulnerabilities can be reduced;<br />
and, with expected advances in scientifi c modelling<br />
and prediction of storms and storm surges, improved<br />
warnings can be brought to bear in alerting<br />
communities at risk and in managing evacuations.<br />
Sea level rise alone may cause a presently one in a<br />
hundred years fl ood event to occur approximately<br />
four times more often by the end of the century.<br />
Moreover, by the end of the 21 st century, a current<br />
500-year fl ood event may occur approximately once<br />
every 200 years. G4<br />
The amount of damage from a fl ood is dependent on,<br />
among other factors, the size of the fl ooded area and<br />
the water depth. Other factors include the duration<br />
of the fl ood and fl ow velocities. Furthermore, the<br />
rate at which the water rises and the time allowed<br />
for evacuation largely determine the number of<br />
casualties. G7<br />
Flood damage and infrastructure<br />
Looking at the most important consequences of<br />
a fl ood for diff erent economic sectors, it appears<br />
most CDC cities are subject to similar threats from<br />
fl ooding, both from oceanic storm surges and from<br />
inland sources. For most ports, both land-based<br />
transportation and the use of inland waterways<br />
are of importance to connect the port areas with<br />
surrounding regions. These connections may be<br />
threatened as the clearance levels of bridges decrease<br />
during a fl ood. Train and subway stations may be<br />
fl ooded, coastal highways inundated, emergency<br />
and hospital services curtailed and communications<br />
disrupted. Furthermore, fl oods cause direct economic<br />
damage to infrastructure and property, with the<br />
magnitude of the damage depending on the depth<br />
and duration of the fl ood. Most estimates of fl ood<br />
damage rely on studies that quantify the direct<br />
economic damages only. However, other non-fl ooded<br />
areas may also be aff ected, as the supply of goods<br />
and services to the fl ooded area may be hindered.<br />
Production loss due to fl oods, however, is diffi cult to<br />
quantify at present. Indirect fl ood damage may be<br />
twice as high as the direct economic damage.<br />
C L I M A T E C H A N G E I N D E L T A C I T I E S 19
Introducing<br />
CDC<br />
2<br />
by Piet Dircke and Arnoud Molenaar
2<br />
1<br />
Introduction<br />
The <strong>Connecting</strong> <strong>Delta</strong> <strong>Cities</strong> objective is to<br />
establish a network of delta cities that are<br />
active in the fi eld of climate change related<br />
spatial development, water management,<br />
and adaptation, in order to exchange<br />
knowledge about climate adaptation and<br />
share best practices to support cities in<br />
developing their adaptation strategies.<br />
origin of f the CDC initiative<br />
The CDC initiative originates from the C40. The C40 is<br />
a group off the world’s largest cities and a number of<br />
affiliated ffi cities committed to taking action on climate<br />
change. By fostering a sense off shared purpose, the<br />
C40 network k offff<br />
ers cities an effective ff forum in which<br />
to work k together, share information and demonstrate<br />
leadership. Through effective ff partnership working<br />
with the Clinton <strong>Climate</strong> <strong>Initiative</strong>, the C40 helps<br />
cities toreduce their greenhouse gas emissions<br />
through a range of f energy effi ffi ciency and clean energy<br />
programmes (www.c40cities.org).<br />
Many off the world’s major coastal cities are at risk<br />
of f fl ooding from rising sea levels and a changing<br />
climate. Heat-trapping urban landscapes (buildings<br />
and paved surfaces) can raise temperatures – and<br />
lower air quality – dangerously through the Urban<br />
Heat Island effect. ff In cities of f the developing world,<br />
one out of f every three people live in a slum, making<br />
them particularly vulnerable to the health and<br />
environmental risks posed by climate change. The<br />
C40 cities are taking action both tomitigate climate<br />
change by reducing carbon emissions, and by<br />
adapting to the effects ff of f climate change so keenly<br />
felt in cities.<br />
The C40 member cities are:<br />
Addis Ababa, Athens, Bangkok, Beijing, Berlin,<br />
Bogotá, Buenos Aires, Cairo, Caracas, Chicago, Delhi,<br />
Dhaka, Hanoi, Hong Kong, Houston, Istanbul, Jakarta,<br />
Johannesburg, Karachi, Lagos, Lima, London,<br />
Los Angeles, Madrid, Melbourne, Mexico City,<br />
Moscow, Mumbai, New York, Paris, Philadelphia,<br />
Rio de Janeiro, Rome, Sao Paulo, Seoul, Shanghai,<br />
Sydney, Toronto, Tokyo and Warsaw.<br />
I N T R O D U C I N G C O N N E C T I N G D E L T A C I T I E S 21
������������������������<br />
Affi liate C40 cities (19) are:<br />
Amsterdam, Austin, Barcelona, Basel, Changwon,<br />
Copenhagen, Curitiba, Heidelberg, Ho Chi Minh City,<br />
Milan, New Orleans, Portland, <strong>Rotterdam</strong>,<br />
Salt Lake City, San Francisco, Santiago, Seattle,<br />
Stockholm and Yokohama.<br />
Tokyo 2008: the birth of f <strong>Connecting</strong> <strong>Delta</strong> <strong>Cities</strong><br />
In Tokyo in October 2008, a C40 meeting on climate<br />
adaptation offi fficially adopted the <strong>Connecting</strong><br />
<strong>Delta</strong> <strong>Cities</strong> (CDC) <strong>Initiative</strong> proposed by the City of<br />
<strong>Rotterdam</strong>. It was addressed as “Joint Action 8: <strong>Climate</strong><br />
Adaptation <strong>Connecting</strong> <strong>Delta</strong> <strong>Cities</strong>.” ” C40 agreed the<br />
networkk should (initially) consist off a small number of<br />
cities that are frontrunners in climate adaptation, with<br />
the objective of f exchanging knowledge on climate<br />
adaptation and sharing best practices.<br />
��<br />
��<br />
�<br />
���������������<br />
�����������<br />
������������<br />
<strong>Delta</strong> cities can benefit fi from the <strong>Connecting</strong> <strong>Delta</strong><br />
<strong>Cities</strong> (CDC) network k through:<br />
� Exchange of f adaptation strategies and<br />
best practices<br />
� Stimulating adaptation practice and enlarging<br />
operation capacity<br />
� Creating economic spin-offs ff based on the<br />
acquired expertise<br />
� Supporting the inclusion of f climate adaptation in<br />
water management and spatial development<br />
� Contributing to the image off delta cities by<br />
enhancing their vision on the future<br />
� Raising awareness amongst citizens and<br />
local governments.
2<br />
2<br />
The CDC network in<br />
practice<br />
Figure 2.1 The current cities of the CDC initiative (orange squares) and interested cities (yellow squares).<br />
The CDC Network<br />
The CDC network is concerned with solidarity and<br />
cooperation between delta cities, and the issues<br />
addressed in CDC are demanddriven. Based on these<br />
principles, and supported by the commitment of<br />
C40, the City of <strong>Rotterdam</strong> initiated the CDC network<br />
and began to invest in knowledge exchange with<br />
other CDC cities through meetings and workshops,<br />
initiating joint research across diff erent delta cities.<br />
Currently, the CDC network consists of eight C40<br />
cities (see Figure 2.1). These cities all envisage<br />
similar climate related problems, comparable to<br />
those addressed by the <strong>Rotterdam</strong> <strong>Climate</strong> Proof<br />
programme (www.rotterdamclimateinitiative.nl), l<br />
and also envisage related port-specifi c issues. All of<br />
these cities could act, or already do, as frontrunners,<br />
thereby providing an example for other cities. They<br />
I N T R O D U C I N G C O N N E C T I N G D E L T A C I T I E S 23
Figure 2.2 <strong>Connecting</strong> <strong>Delta</strong> <strong>Cities</strong> (CDC) organization.<br />
The CDC secretariat is based in <strong>Rotterdam</strong> as the<br />
international component of its adaptation programme<br />
‘<strong>Rotterdam</strong> <strong>Climate</strong> Proof (RCP)’.<br />
�������������<br />
��������������������<br />
��������������<br />
���������<br />
����<br />
�����������<br />
���<br />
���������<br />
�<br />
�<br />
���������<br />
�������<br />
���������<br />
����������������<br />
������<br />
�����<br />
��������<br />
�����������
are capable of sharing knowledge with other C40<br />
cities and share the same sense of urgency with<br />
regard to climate adaptation.<br />
At present, the following cities are involved:<br />
<strong>Rotterdam</strong>, New York, Jakarta, London, New Orleans,<br />
Ho Chi Minh City, Hong Kong and Tokyo. <strong>Cities</strong><br />
that have shown interest in CDC include Shanghai,<br />
Melbourne, Copenhagen, Lagos, Buenos Aires and<br />
Manila.<br />
The CDC network links cities at the local policy level.<br />
Furthermore, scientifi c networks are enhanced<br />
or developed to support the CDC activities by<br />
providing information on climate trends, impacts and<br />
adaptation options. The CDC involvement of each city<br />
depends on how the individual cities have organized<br />
the development of their adaptation plans.<br />
Generally speaking, each city already has or is in<br />
the initial phase of, however developing a pool of<br />
institutes and experts (policy, scientifi c, business)<br />
who can contribute to developing such an adaptation<br />
plan. For example, the City of <strong>Rotterdam</strong> has<br />
addressed CDC as an integral part of its climate<br />
adaptation programme <strong>Rotterdam</strong> <strong>Climate</strong> Proof<br />
(RCP). The CDC initiative is, hence, the international<br />
component of its adaptation programme. In this way,<br />
<strong>Rotterdam</strong> hopes to inspire and learn from other<br />
delta cities, which may lead to economic spin-off s<br />
and thus contribute to economically strong delta<br />
cities.<br />
In order to manage the fl ow of information between<br />
the CDC cities, a small CDC secretariat has been<br />
installed in <strong>Rotterdam</strong>. This secretariat is supported<br />
by an advisory board to ensure CDC activities fi t the<br />
RCP goals. This committee comprises a mix of Dutch<br />
government bodies, and knowledge institutions and<br />
agencies.<br />
CDC activities, results and initial<br />
The CDC approach follows a ‘minimum eff ort<br />
maximum results’ design, which can be archieved<br />
through the linking of CDC activities to the ongoing<br />
activities of cities (e.g. policy actions related to<br />
climate adaptation) and by linking CDC to larger<br />
conferences on similar topics or networks with related<br />
or comparable objectives. The degree of cooperation<br />
diff ers as each CDC city has diff erent priorities and<br />
interests. The main activities are:<br />
1. Knowledge exchange: Initiating symposia,<br />
workshops, student exchanges, and meetings where<br />
students, scientists, engineers and policymakers can<br />
exchange expertise and ideas<br />
2. Documentation: Supporting the publication of<br />
(media)reports, fi lms, publications and books on<br />
climate adaptation in delta cities<br />
3. Project support: Mobilizing experts for projects<br />
and support the development of projects and<br />
supporting proposals relating to climate adaptation<br />
research and implementation<br />
In 2009 and 2010, CDC organized several expert<br />
workshops, participated in conferences, published<br />
a fi rst CDC book and co-fi nanced a fi lm on climate<br />
adaptation in cities (www.deltacities.com). This<br />
documentary ‘<strong>Connecting</strong> <strong>Delta</strong> <strong>Cities</strong>’ examines<br />
climate adaptation in the cities of New York, Jakarta,<br />
<strong>Rotterdam</strong> and Alexandria. The fi lm was fi rst screened<br />
at the 5 th World Water Forum in Istanbul, Turkey,<br />
in March 2009. Since then, it has been shown at a<br />
number of conferences such as the UNFCCC COP 15<br />
I N T R O D U C I N G C O N N E C T I N G D E L T A C I T I E S 25
in Copenhagen, and it has been shown on national<br />
television in several countries.<br />
The fi rst CDC book, <strong>Connecting</strong> <strong>Delta</strong> <strong>Cities</strong>, described<br />
the potential climate impacts and adaptation options<br />
for the cities of New York, <strong>Rotterdam</strong>, and Jakarta, and<br />
was launched at the US-Dutch H2O9 conference on<br />
climate adaptation and water management during the<br />
Hudson 400 event in New York as part of the Hudson<br />
400 celebrations (www.henryhudson400.com) in New<br />
York. CDC organized and participated in workshops<br />
and conferences in New York City, New Orleans,<br />
<strong>Rotterdam</strong>, Jakarta, Ho Chi Minh City and Hong Kong.<br />
CDC has also participated in major global events such<br />
as the Aquaterra Forum on <strong>Delta</strong>s in Amsterdam, the<br />
UNFCCC COP 15 in Copenhagen, the World Water<br />
Forum in Istanbul, the Dutch Dialogues in New Orleans<br />
and the World Expo (with the launch of the WWF<br />
World Estuary Alliance and the Holland Water Week) in<br />
Shanghai. In Indonesia a fi rst research project was set<br />
up in conjunction with a workshop dialogue.<br />
Network collaboration<br />
<strong>Connecting</strong> <strong>Delta</strong> <strong>Cities</strong> is a fl exible network that<br />
closely collaborates with similar and complementary<br />
initiatives. For example, the Dutch Dialogues program<br />
has proven to be a successful concept for the<br />
dialogue in New Orleans and in New York during the<br />
Henry Hudson 400 celebrations. Furthermore, CDC<br />
collaborates closely with the following worldwide<br />
networks <strong>Delta</strong> Alliance and World Estuary Alliance.<br />
For this, CDC continuously exchanges information<br />
with other networks, shares best practices, cooperates<br />
in case studies and co-organizing events. The related<br />
networks are:<br />
<strong>Delta</strong> Alliance:<br />
“Understanding and improving resilience<br />
across river deltas”<br />
<strong>Delta</strong> Alliance is an alliance of people and<br />
organizations committed to improving the resilience<br />
of the deltas in which they live and work. Members<br />
take part in activities that span the spectrum of<br />
researching, monitoring, reporting, advising, and<br />
implementing projects on resilience-building in deltas.<br />
<strong>Delta</strong> Alliance integrates knowledge and visions on a<br />
river delta as a whole, linking information and people<br />
from across sectors and jurisdictions for the common<br />
goal of improving resilience. Regional Wings of <strong>Delta</strong><br />
Alliance are self-organized and include individuals and<br />
organizations from across all sectors. An international<br />
secretariat coordinates international events and<br />
communications between the Regional Wings.<br />
World Estuary Alliance (WEA):<br />
“Increasing awareness about ecological and economic<br />
value of healthy estuaries”<br />
The WEA aims to raise awareness of the economic and<br />
ecological value of healthy estuaries and to stimulate<br />
exchange of knowledge and implementation of best<br />
practices. Where the rivers meet the sea has always<br />
been one of the most important of habitats for<br />
humanity, but in the past centuries enormous damage<br />
has been done to the vibrant life in estuaries. There is<br />
a need to work together to advance the best thinking<br />
in sustainable estuary development and protection.<br />
The WEA is a living network, with a shared belief that<br />
economic development and nature can go hand in<br />
hand. The growing network includes representatives<br />
from NGOs, business, science and policy makers. The<br />
WEA is currently based in Shanghai.<br />
I N T R O D U C I N G C O N N E C T I N G D E L T A C I T I E S 27
3<br />
<strong>Rotterdam</strong><br />
by Arnoud Molenaar and Piet Dircke
3<br />
1<br />
Introduction<br />
<strong>Rotterdam</strong> is situated in the heart of the<br />
Dutch delta. The city lies largely below<br />
sea level (up to 6 meters) and the city, and<br />
the low lying area around it, is protected<br />
from the sea by a complex and extensive<br />
system of dikes, closure dams and storm<br />
surge barriers, which are all part of the<br />
famous Dutch <strong>Delta</strong> Plan. The <strong>Delta</strong> Works<br />
were established after the disastrous 1953<br />
fl oods, in which over 1,800 Dutch citizens<br />
drowned.<br />
One of f the main aspects of f the <strong>Delta</strong> Plan was to<br />
improve the protection off <strong>Rotterdam</strong> during an extreme<br />
storm surge. It was decided to construct the Maeslant<br />
Storm Surge Barrier, which protects <strong>Rotterdam</strong> in the<br />
case of f an extreme fl flood event but stays open under<br />
normal conditions to allow free access to the older port<br />
areas as well as the inland shipping canals behind the<br />
barrier. Furthermore, as ships must have free access to<br />
the port, the City off <strong>Rotterdam</strong> and the Port Authority<br />
have chosen to develop the port area outside the dike<br />
protection system, at such an elevation that most of<br />
the port area is well protected against floods. fl Hence,<br />
over the last hundred years, 12,000 hectares off land<br />
have been elevated using fill fi materials to several meters<br />
above sea level. Along with the Palm Islands in Dubai,<br />
this is the largest area off human-made land in the world<br />
to be mostly surrounded by water.<br />
R O T T E R D A M 29
“Ourr climate is changing. The consequences off climate<br />
change will l also be felt t in <strong>Rotterdam</strong>. In order r to confront<br />
the challenge off climate change as an opportunity<br />
rather r than a threat, the City y off<br />
<strong>Rotterdam</strong> has sett up<br />
the <strong>Rotterdam</strong> <strong>Climate</strong> Prooff programme thatt willl<br />
make<br />
<strong>Rotterdam</strong> climate change resilientt by y 2025. Permanent<br />
protection and d accessibility y of f the <strong>Rotterdam</strong> region are key<br />
elements. The central l focus off the programme is to create<br />
extra opportunities to make <strong>Rotterdam</strong> a more attractive<br />
city y in which to live, work, relax x – and d invest. Trendsetting<br />
research, innovative knowledge development t and<br />
knowledge exchange with delta cities worldwide will l result<br />
in strong economic c incentives.”<br />
Alexandra van Huffelen, ff Vice Mayorr City y off<br />
<strong>Rotterdam</strong>,<br />
Sustainability, City y Centre andd Public<br />
c<br />
Space<br />
“<strong>Rotterdam</strong> is the perfect t showcase for r climate change<br />
adaptation in the Netherlands andd itt<br />
is an inspiring<br />
example forr delta cities world d wide. <strong>Rotterdam</strong> will l prove<br />
that t dealing with climate change in a pro-active and<br />
smart t wayy<br />
creates opportunities forr an attractive and<br />
economicallyy strong delta cityy off<br />
the future!”<br />
Piet t Dircke, Professor r off<br />
Urban Water r Management<br />
<strong>Rotterdam</strong> University y of f Applied d Sciences, The Netherlands
3<br />
2<br />
Present<br />
situation<br />
<strong>Rotterdam</strong> is considered the marine gateway to<br />
Western Europe in the Dutch delta formed by the<br />
rivers Rhine and Meuse and has a long history as<br />
a port. <strong>Rotterdam</strong> not only serves as port for the<br />
Netherlands but for the whole off Western Europe,<br />
in particular Germany. The rivers provide excellent<br />
means for inland water transport to transport the<br />
goods from the port into the hinterland<br />
An important date in the history of f <strong>Rotterdam</strong> is<br />
May 1940, when large parts off the city centre were<br />
completely destroyed during a bombardment by<br />
the German Air Force. The centre off <strong>Rotterdam</strong>,<br />
therefore, was almost completely rebuilt after the<br />
Second World War.<br />
<strong>Delta</strong>’s in Times of <strong>Climate</strong> Change<br />
29 September r - 1 October r 2010<br />
A major milestone in 2010 is the ‘<strong>Delta</strong>’s<br />
in Times of <strong>Climate</strong> Change’ ’ conference<br />
(www.climatedeltaconference.org)<br />
in <strong>Rotterdam</strong> between 29 September and<br />
1 October 2010. This supported conference<br />
has been organized by the City of f <strong>Rotterdam</strong><br />
and the Dutch National Knowledge for <strong>Climate</strong><br />
Programme and pays special attention tothe<br />
climate proofi fing of f urban areas, providing a<br />
platform for knowledge exchange between<br />
scientists, policymakers, politicians and<br />
practitioners. CDC celebrated its two-year<br />
anniversary at this conference by launching the<br />
book k <strong>Connecting</strong> <strong>Delta</strong> <strong>Cities</strong> 2010 which you are<br />
reading right now.<br />
International conference<br />
<strong>Delta</strong>s in Times of<br />
<strong>Climate</strong> Change<br />
<strong>Rotterdam</strong>, the Netherlands<br />
29 September – 1 October 2010<br />
R O T T E R D A M 31
3<br />
3<br />
<strong>Climate</strong> and<br />
fl ood risks<br />
<strong>Rotterdam</strong> has a temperateclimate infl fluenced by the<br />
North Sea, with moderate temperatures throughout<br />
the year. However, heat waves in which temperatures<br />
rise above 30°C, do occur and will occur more<br />
frequently in the future. Summers are moderately<br />
hot with short wet periods. Rainfall is almost equally<br />
distributed over the year, with an average annual<br />
rainfall of f around 790 mm. A new precipitation record<br />
was set in August 2006, when almost 300 mm of<br />
precipitation fell in one month, causing extensive<br />
flooding fl and damage inthe <strong>Rotterdam</strong> city area.<br />
Winters are relatively wet, with persistent rainfall<br />
periods. These periods of f excessive rainfall can cause<br />
floods fl in the river basins of f the Rhine and Meuse. R1<br />
The low-lying parts of f the Netherlands, including<br />
<strong>Rotterdam</strong>, have been fl ooded many times throughout<br />
history. Inthe Netherlands, 26 percent of f the country<br />
lies below sea level and 29 percent is susceptible to<br />
river fl flooding. Many low-lying parts of f the Netherlands<br />
Figure 3.1 Example off a fl ood risk k map off the port area of f <strong>Rotterdam</strong>.<br />
The colors indicate the potential flood fl losses in euro/m2 . R2
have been reclaimed from former lakes (usually<br />
referred to as ‘polders’) and are protected by so-called<br />
‘dike rings’ ’ along the main rivers and coastal areas.<br />
Two thirds off the Dutch GDP (need to spell out in fi first<br />
reference) is earned in these low-lying polders, and<br />
most Dutch urban development is concentrated here.<br />
For these reasons, the Dutchintend to stay in these<br />
areas and, therefore, continue to invest heavily in<br />
fl ood protection, even though the area is one off the<br />
locations most vulnerable to flood fl risk k in the world.<br />
Dutch fl flood protection standards are currently the<br />
highest in the world. Most off the protection system<br />
around <strong>Rotterdam</strong> is designed to withstand a storm<br />
estimated to occur once in every10,000 years.<br />
The design surge level is determined at 4 m (the 1953<br />
generated a surge height of f 3 m). To protect against<br />
such a storm, taking both surge levels and breaking<br />
wave heights into account,the average dike along<br />
the <strong>Rotterdam</strong> coast is more than 10 m in height.<br />
This protection level reflects fl both the number of<br />
inhabitants and the economic value of f assets within<br />
a dike ring; the more people and economic value to<br />
be protected by levee infrastructure, the higher the<br />
safety standard. As climate change is expected to<br />
increase the frequency and severity of f fl flooding events,<br />
these flood fl probabilities will accordingly increase<br />
rapidly with sea level rise. Therefore, reinforcing flood fl<br />
protection is, and will be, an ongoing concern in<br />
<strong>Rotterdam</strong> and the Netherlands.<br />
Figure 3.2 The potential number off fatalities caused by simultaneous levee breaches at Katwijk, Ter Heijde and The Hague with current land use (left)<br />
and possible future land use according to a high economic growth scenario (GE, right). R3<br />
R O T T E R D A M 33
Socioeconomic eff ects of fl ooding<br />
The Port of <strong>Rotterdam</strong> is of vital economic importance<br />
for <strong>Rotterdam</strong>, the Netherlands and Europe. Large<br />
parts of the port area and the City of <strong>Rotterdam</strong> are<br />
protected by the Maeslant Storm Surge Barrier. This<br />
barrier, however, was designed to cater to a maximum<br />
sea level rise of about half a metre. Both the Port<br />
Authority and the City of <strong>Rotterdam</strong>, together with<br />
national government, are now considering options for<br />
coping with the increasing fl ood risks due to climate<br />
change. The port area, as already mentioned, is safe as<br />
it is located at several metres above sea level. However<br />
the area lies outside the dike protection system, and is<br />
only protected only by the barrier. Occasionally, high<br />
water levels can be problematic.<br />
A large proportion of the Netherlands’ economic<br />
assets are clustered in the port area of <strong>Rotterdam</strong>,<br />
where the estimated potential damage in the event<br />
of fl ooding is in the order of tens of billions of euros<br />
(see Figure 3.1). At risk are port facilities, railroads,<br />
tunnels and container terminals. In addition, a large<br />
section of <strong>Rotterdam</strong>’s working population works in<br />
the port area, and many businesses strongly depend<br />
on activities in the port.<br />
On the other hand, the city is situated inside the dike<br />
protection system and very safe. But, because it is<br />
located below sea level, this high protection level is a<br />
necessity, as a failure of the system can immediately<br />
cause severe danger. The expected number of<br />
casualties as a result of fl ooding in the <strong>Rotterdam</strong><br />
region is regarded as an important indicator of<br />
vulnerability. Figure 3.2 shows the projected eff ects<br />
of the relatively high growth in urban development<br />
in low-lying polders north of <strong>Rotterdam</strong> by 2040 on<br />
Figure 3.3 This picture, based on satellite images taken on clear and<br />
warm days during the last 25 years, shows that the temperature of the<br />
urban environment is signifi cantly higher than in the rural areas.<br />
the potential number of casualties in the province of<br />
South Holland in the event of dike breaches.<br />
The rise in sea level has a relatively small eff ect on the<br />
low-lying polders. For example, a sea level rise of<br />
30 cm could cause an increase in the fatality rate by<br />
as much as 20 percent, while an expected 87 percent<br />
population growth in the area by 2040 is projected to<br />
cause a 156 percent increase in potential fatalities in<br />
the area. The infl uence of the population growth on<br />
the fatality rate is therefore considerably greater than<br />
the eff ect of projected sea level rise.<br />
Veerman Commission:<br />
the second Dutch <strong>Delta</strong> Plan 2008<br />
In the Netherlands, sea levels may rise to 0.59 metres<br />
in the year 2100 according to the IPCC. At the same<br />
time, the Netherlands currently still has dikes that are<br />
R O T T E R D A M 35
elow the Dutch safety standard and that must be<br />
restored. To this end, a new <strong>Delta</strong> Commission, headed<br />
by former Dutch agricultural minister Cees Veerman,<br />
was installed and produced a new Dutch <strong>Delta</strong><br />
Plan. This national commission studied the future<br />
climate change challenges facing the Netherlands<br />
and presented new recommendations on fl flood<br />
R4, R5<br />
management and adaptation toclimate change.<br />
Based on this plan, the Dutch government will spend<br />
over one billion euros a year until 2100 extending and<br />
strengthing the countries dikes and improving fl flood<br />
control.<br />
The new<strong>Delta</strong>Plan also indicates there is a need to<br />
build special flood fl protection around the port and<br />
Figure 3.4 Possible scenarios for the ‘Rhine Estuary Closable but Open’.<br />
the city off <strong>Rotterdam</strong>. An Increasing sea levels lead<br />
to more frequent closures of f the Maeslant Barrier,<br />
which leads to on increased risk k off<br />
fl ooding from the<br />
large rivers flowing fl through <strong>Rotterdam</strong> that cannot<br />
discharge freely into the North Sea under these<br />
conditions. A number of f diff fferent scenarios are under<br />
consideration in an open debate known as ‘Rhine<br />
Estuary Closable but Open’ ’ (see Figure 3.4). Should<br />
<strong>Rotterdam</strong> be protected by an extended and complex<br />
system of f barriers, dams and gates that keep the sea<br />
out, or should <strong>Rotterdam</strong> embrace the sea and opt for<br />
a new balance in the water system and allow the salt<br />
water to flow fl freely in and out off the city?
3<br />
4<br />
<strong>Climate</strong><br />
adaptation<br />
<strong>Rotterdam</strong> is dealing with the consequences of<br />
climate change in a pro-active way by turning climate<br />
challenges into opportunities. <strong>Rotterdam</strong> wants to<br />
protect its citizens against the future impacts, such as<br />
climate change, by making <strong>Rotterdam</strong> ‘climate proof’<br />
by 2025. The city also has the ambition to become<br />
aims a global leader in water management and climate<br />
change adaptation.<br />
For this reason, the ‘<strong>Rotterdam</strong> <strong>Climate</strong> <strong>Initiative</strong>’ ’ (RCI)<br />
was launched to develop <strong>Rotterdam</strong> into a climateneutral<br />
city. R6 The focus of f this plan is on mitigating the<br />
emission of f greenhouse gases and on strengthening<br />
the city’s economy through innovative solutions to<br />
save energy and store CO . The goal is to achieve a<br />
2<br />
50 percent reduction by 2025 (compared to the level<br />
off emissions in 1990); this requires an annualreduction<br />
off 30 megatons in CO emissions, in conjunction with<br />
2<br />
economic growth. The founders off the <strong>Rotterdam</strong><br />
<strong>Climate</strong> <strong>Initiative</strong> are the Port of f <strong>Rotterdam</strong>, the<br />
companies in the industrial port district, the<br />
municipality, and the environmental protection<br />
agency Rijnmond.<br />
The <strong>Rotterdam</strong> <strong>Climate</strong> Proof f (RCP) organization<br />
focuses on climate adaptation, and is the adaptation<br />
programme off the <strong>Rotterdam</strong> <strong>Climate</strong> <strong>Initiative</strong>. R7<br />
Within the RCP, water is not only seen as a threat,<br />
but also as an asset for developing an attractive<br />
and economically strong city.Thereare three main<br />
challenges related to water and climate change<br />
described in the RCP plan: fl flood protection;<br />
architecture and spatial planning; and rainwater<br />
storage and updating the sewerage system.<br />
Flood protection<br />
To protect <strong>Rotterdam</strong> for the future climate and<br />
flood fl conditions, the city is developing innovative,<br />
multifunctional types off urban fl flood protection<br />
that are not only safe but also fi fit optimally into the<br />
Figure 3.5 City Ports off <strong>Rotterdam</strong>, living showcase off adaptive and<br />
sustainable building.<br />
R O T T E R D A M 37
Figure 3.6 A map from the <strong>Rotterdam</strong> Water Plan 2030 as part of the<br />
f adaptation programme initiative ‘<strong>Rotterdam</strong> <strong>Climate</strong> Proof’ (RCP)<br />
’ showing new<br />
perspectives for water management.<br />
dense urban fabric, not creating a barrier disturbing<br />
the urban flow fl but a structure that adds value to it,<br />
with new and attractive parking space, green areas<br />
and pedestrian zones. At the same time, 40,000 of<br />
<strong>Rotterdam</strong>’s inhabitants live outside the dike system,<br />
only protected only by the Maeslant Barrier. For<br />
these citizens, new types of f climate proofi fi ng are<br />
under development, including retrofi fi tting of f existing<br />
buildings and new constructed adaptive housing<br />
types like floating fl homes. However, these citizens will<br />
have to live with a certain risk k off<br />
getting ‘wet feet’ ’ once<br />
in a while.<br />
Architecture and spatial planning<br />
<strong>Rotterdam</strong> is looking for alternative options that<br />
both enhance flflood protection and add value to<br />
the attractiveness of f the city. To achieve this, an<br />
innovative integrated adaptation strategy, combining<br />
spatial planning, architecture and flood fl protection is<br />
being introduced. <strong>Rotterdam</strong> plans to develop 1,600<br />
ha (4.000 acres) of f adaptive waterfront locations in<br />
the old harbour area in the centre off the city. The<br />
‘Stadshavens’ ’ or City Ports project currently is one of<br />
Europe’s largest urban redevelopments (Figure 3.5).<br />
Through adaptive architecture, this neighbourhood<br />
can be made climate proof f and serve as a high quality<br />
waterfront living and working area. This requires new<br />
ways of f developing buildings that, for example, allow<br />
water to move through the neighbourhood in the<br />
event of f a flood fl without causing casualties or damage
to assets. Floating homes may be part of f this new<br />
adaptation strategy.<br />
These newtechnologies are being developed at<br />
knowledge centres like the RDM Campus (Research,<br />
Design and manufacturing), an initiative off the<br />
<strong>Rotterdam</strong> University of f Applied Sciences, the<br />
City of f <strong>Rotterdam</strong>, the Port Authorities and other<br />
private and public parties (Figure 3.7). The RDM is<br />
now a campus at the old RDM shipping wharf f in<br />
the heart of f Stadshavens, where the education of<br />
future generations is combined with innovative and<br />
sustainable development of f businesses and sciences,<br />
and with experiencing best practices.<br />
(www.rdmcampus.nl) l<br />
Figure 3.7 RDM Campus (Research, Design and Manufacturing).<br />
Rainwater storage, updating storm<br />
water sewerage system<br />
For <strong>Rotterdam</strong>, climate change will result in more<br />
prolonged periods of f drought and more heavy<br />
showers, both in the summer and winter periods.<br />
Precipitation is expected to increase by between<br />
7 percent and 28 percent in winter. There is a risk<br />
that the current sewerage system may not be able to<br />
treat and drain the surplus of f water. The <strong>Rotterdam</strong><br />
Water Plan 2030 (Figure 3.6) requires an additional<br />
600,000 m3 of f storm water storage space. At least 80<br />
hectares of f extra lakes and canals would be needed to<br />
providethis storage in open water. Inthe city centre,<br />
open water areas are used forstoring extra water by<br />
retrofitting fi ponds in city parks, or adjusting canals to<br />
store more water, so that in the case of f an extreme<br />
precipitation event, their water levels may rise without<br />
R O T T E R D A M 39
Figure 3.8 Example of a Water Plaza that is used as a playground during normal conditions and as a reservoir in case of extreme precipitation.
inundating surrounding areas. An artist’s impression of<br />
creating more open water is presented in Figure 3.9.<br />
Additionally, especially in densely built areas, water<br />
can also be stored on green roofs, in WaterPlazas or in<br />
underground parking garages. Green roofs slow the<br />
rate of f roof f runoff ff and can retain between 10-20 mm<br />
of f rainwater, which equals an average of f 100 m3 to<br />
200 m3 of f water per roof f in <strong>Rotterdam</strong>. After a rainfall<br />
event, green roofs gradually release water backk into<br />
the atmosphere via evaporation. <strong>Rotterdam</strong>has a<br />
large government support programme in place for the<br />
partial subsidizing of f the development of f green roofs.<br />
Nearly 50.000 m2 off additional green roof f has been<br />
developed so far.<br />
Figure 3.9 Artist’s impression of f creating more open water in the city<br />
for storing excess rainwater in the <strong>Rotterdam</strong> area. R6<br />
Figure 3.10 Reservoir connected to the sewerage and stormwater<br />
system being developed as part off a newly built underground parking<br />
garage R6 .<br />
Furthermore, a Water Plaza in <strong>Rotterdam</strong> can store<br />
water in times of f peakk<br />
rain events but is used as a<br />
playground in normal conditions (Figure 3.8). Another<br />
example is presented in Figure 3.10, showing the<br />
development of f a new underground car park k below<br />
which is the sloping entrance a storm water storage<br />
basin that is connected to the city’sstorm water and<br />
sewerage system. The capacity (10,000 m3 ) off the<br />
reservoir is large enough to store 50 percent of f the<br />
expected volume of f rainwater that falls in one storm<br />
on city centre <strong>Rotterdam</strong>. The construction of f this<br />
basin will be fi nished by the end off 2010.<br />
R O T T E R D A M 41
Smart Flood Control <strong>Rotterdam</strong><br />
<strong>Rotterdam</strong> is currently developing innovative<br />
technologies to become a smart city off the future.<br />
‘Flood Control 2015,’ ’ a Dutch public private consortium<br />
of f nine water specialists and experts in the fi eld of<br />
water management, ICTT and crisis management<br />
(www.fl fl oodcontrol2015.com),<br />
is currently researching<br />
the feasibility off a smart fl ood controlsystem for the<br />
city. Smart gaming, a demonstrator control room,<br />
decision support systems, application of f sensor<br />
technology in dikes, and manyother tools are under<br />
consideration and may be integrated into a new<br />
smart flood fl protection system for <strong>Rotterdam</strong>. At the<br />
<strong>Rotterdam</strong> University of f Applied Sciences, smart fl flood<br />
control is one of f the topics that can be studied on the<br />
new full time Water Management Bachelor Programme.<br />
In collaborationwith private firms, fi students are<br />
currently developing a <strong>Rotterdam</strong> flood fl management<br />
serious game in a so-called ‘Innovation lab’.<br />
Communication aspects<br />
Communication is important and required on different ff<br />
levels and different ff scales. Adequate communication<br />
with local (city council), regional (water boards) and<br />
national government bodies is crucial in to create<br />
awareness and commitment for funding of f research<br />
and measures. At local level, communication with<br />
residents in the early stages off urban planning<br />
processes is essential for the public acceptance,<br />
and a requirement for successful implementation of<br />
innovative solutions such as Water Plazas. These water<br />
storage projects in the city’s public spaces require<br />
sophisticated communication about the risks of<br />
drowning and the possibilities of f mosquito plagues.<br />
In <strong>Rotterdam</strong>, a campaign about green roofs resulted<br />
in public participation. Good communication is also<br />
important for the residents living next to the river. For<br />
these citizens, the City of f <strong>Rotterdam</strong> is developing<br />
practical information about fl ood risks and emergency<br />
situations.<br />
<strong>Rotterdam</strong> NationalWater Centre<br />
As a result of f the successful combination of<br />
climate adaptation implementation and research,<br />
<strong>Rotterdam</strong> will become an innovative center for water<br />
management and climate change; a truly smart delta<br />
city. International collaboration with other delta cities<br />
will be intensified fi and extended, and will definitely fi<br />
gain momentum, creating new opportunities for<br />
businesses and knowledge institutions in, and around,<br />
<strong>Rotterdam</strong>. The leading role off <strong>Rotterdam</strong> in the<br />
Netherlands as an international showcase forwater<br />
management and climate change was underlined by<br />
Figure 3.11 Floating Pavilion in <strong>Rotterdam</strong>.
Figure 3.12 Inside the Floating Pavilion.<br />
the decision off the Dutch Water sector, to establish<br />
a National Water Centre in <strong>Rotterdam</strong>. An important<br />
milestone for the city in 2012 will be the opening of<br />
the National Water Centre in <strong>Rotterdam</strong>, as part of f the<br />
Dutch <strong>Delta</strong> Design 2012 event.<br />
Floating Pavilion<br />
24 June 2010 <strong>Rotterdam</strong> witnessed the official ffi opening<br />
of f its fl oating pavilion (see Figure 3.11 and 3.12). The<br />
pavilion will house the Expo function off the <strong>Rotterdam</strong><br />
National Water Centre.<br />
The launch off the fl oating pavilion attracted massive<br />
public attention both during the trip from the RDM<br />
Campus and during the official ffi opening. Crowds<br />
of f people thronged to the quays to witness this<br />
historic moment. As the water level rises, the floating fl<br />
pavilion, a visible icon and landmark k for the city will<br />
automatically rise accordingly. This makes the pavilion<br />
an example of f climate change resilient building and<br />
of f <strong>Rotterdam</strong>’s commitment to and expertise on<br />
sustainable and climate change resilient construction.<br />
In addition to sustainable technology on the inside,<br />
such as heating and cooling systems that use solar<br />
energy, climatic zones and a separate filter fi installation,<br />
the outside is also sustainable and as the pavilion is<br />
flexible fl and can moor at any location.<br />
R O T T E R D A M 43
3<br />
5<br />
<strong>Rotterdam</strong> Adaptation Strategy (RAS)<br />
Strategy<br />
In order to realize a climate-proof city, <strong>Rotterdam</strong><br />
has developed the RAS strategy, containing the<br />
following elements:<br />
� Focus on 5 topics: Water safety, urban water<br />
management, urban climate, accessibility (in terms<br />
of transport and infrastructure) and adaptive<br />
buildings<br />
� Distinguish three types of adaptation options<br />
(columns in Figure 3.13). 1) Minimizing the<br />
probability of a calamity, 2) minimizing the<br />
consequences and 3) improving the recovery<br />
� Connect potential measures to various spatial<br />
levels: region, city, quarter/street, individual<br />
Challenges for the future<br />
One crucial element is to involve more actors in the<br />
region and to transform the <strong>Rotterdam</strong> Adaptation<br />
Strategy into a Regional Adaptation Strategy. At<br />
the same time, different ff themes must be prioritized<br />
based on progressive insight and the ongoing<br />
development of f the city. Another important action<br />
is to increase awareness among policymakers and<br />
city planners and to integrate the need<br />
building (rows in Figure 3.11). Measures at diff erent<br />
levels are connected and interrelated<br />
� Combine forecasting and backcasting<br />
techniques in order to develop a roadmap which is<br />
to lead each topic to its specifi c goal<br />
� Learning by doing: continuously develop<br />
(scientifi c) knowledge while immediately applying<br />
results to practical situations<br />
� Communicate actions. Firstly to exchange<br />
knowledge and to stimulate cooperation with<br />
universities, companies and other cities and<br />
secondly, to inform the general public and to show<br />
what the city is doing and how we can turn climate<br />
change from a threat into an opportunity.<br />
to strengthen the city’s adaptation capability<br />
into main stream city development planning.<br />
Finally, <strong>Rotterdam</strong> is also working on designing a<br />
monitoring system as well as a climate barometer,<br />
that will translate all its efforts ff and actions into<br />
clear results and which will help to access the<br />
extent of f <strong>Rotterdam</strong>’s in closing the gap between<br />
its ambitions and on ever-changing reality.
<strong>Rotterdam</strong> Adaptation Strategy: examples of potential measures<br />
�� relates to water safety �� relates to management of the urban water system<br />
Region<br />
City<br />
Quarter / street<br />
Building<br />
� improve safety level of<br />
storm surge barrier<br />
Figure 3.13 <strong>Rotterdam</strong> Adaptation Strategy (RAS).<br />
Minimizing chance Minimizing consequences Stimulating recovery<br />
� improve safety level<br />
of dikes<br />
� create space for (innovative)<br />
water storage, e.g.<br />
in underground parkings<br />
� greening the city,<br />
converting paved to<br />
unpaved surfaces<br />
� raising surface level<br />
of public space<br />
� apply permeable paving<br />
� build on mounds and<br />
invest in adaptive<br />
building<br />
� apply less tiles and more<br />
green in gardens<br />
� set up an early warning<br />
system<br />
� design an evacuation<br />
plan<br />
� fl ood proof infrastructure<br />
(utilities)<br />
� raise main roads for<br />
evacuation<br />
� create safe havens<br />
� create shadow<br />
� raise the pavement /<br />
lower the street<br />
� install wet or dry proof<br />
ground fl oor<br />
� promote resilience<br />
� arrange back-up<br />
systems<br />
(e.g. water supply)<br />
� arrange a help desk<br />
for damage-related<br />
questions<br />
� create fl ood damage<br />
insurance fund<br />
� install pumps<br />
� install pumps<br />
R O T T E R D A M 45
4<br />
New York<br />
by Malcolm Bowman and Piet Dircke
4<br />
1<br />
Introduction<br />
With almost 2,400 km of shoreline,<br />
Metropolitan New York’s historical<br />
development has been intimately tied to<br />
the sea. Four out of fi ve of New York City’s<br />
boroughs are located on islands. Many<br />
bridges and tunnels connect these islands<br />
to the New York State and New Jersey<br />
mainland. The boroughs of Brooklyn and<br />
Queens, home to millions of residents,<br />
rests on Long Island’s low-lying terminal<br />
moraine of sand and boulders, left as the<br />
heritage of the last ice age.<br />
its strategic position on the East Coast of f the<br />
United States, and with its well protected harbour<br />
within the Hudson River Estuary, this historic<br />
metropolis has become one of f the most important<br />
cities in the world.<br />
The recently published report of f the New York k City<br />
Panel on <strong>Climate</strong> Change (NPCC) indicates that climate<br />
change poses a challenge for the development and<br />
safety in New York k City, given the uncertain risks of<br />
sea level rise and enhanced fl flooding from extreme<br />
weather events and climate change. The NPCC states<br />
that New York k City is vulnerable to coastal storm<br />
surges,which are mainly associated with either late<br />
summer-autumn hurricanes or extra tropical cyclones<br />
in the winter period (‘nor’easters’).<br />
N E W Y O R K 47
The CDC New York City <strong>Climate</strong> Change<br />
Adaptation workshop<br />
June 2009<br />
On 9 and 10 of June 2009, a group of 75 scientists,<br />
engineers, social scientists, architects, insurance<br />
experts, policymakers and planners gathered<br />
at the Stony Brook Manhattan campus in New<br />
York City to discuss the issue of climate change<br />
adaptation in coastal cities at the <strong>Connecting</strong><br />
<strong>Delta</strong> <strong>Cities</strong> Workshop. The conference was cohosted<br />
by Stony Brook and Columbia Universities.<br />
Representatives from the cities of <strong>Rotterdam</strong>,<br />
New York, Jakarta and London shared their<br />
experiences in adaptation planning. Innovations<br />
and bottlenecks in adaptation policies were<br />
addressed, and areas were explored with<br />
potential for further extended exchange of<br />
experience and expertise.<br />
While New York City, <strong>Rotterdam</strong>, and Jakarta are<br />
each vulnerable to climate change, rising sea<br />
level and storm surges, and each possess unique<br />
physical and geographic features, there was much<br />
common knowledge that could be learned and<br />
shared. During the workshop, it became clear<br />
that the challenges of climate adaptation pose<br />
fundamental and diffi cult questions and hard<br />
choices for research, policy and industry. A clear<br />
need was felt for unprecedented cooperation and<br />
knowledge exchange across all sectors.<br />
The Brooklyn-<strong>Rotterdam</strong><br />
Waterfront exchange<br />
March - November 2010<br />
New York joined forces with <strong>Rotterdam</strong> and<br />
other Dutch partners in the Brooklyn-<strong>Rotterdam</strong><br />
Waterfront Exchange. The 2010 exchange, coorganized<br />
by New York City, the New York and<br />
New Jersey Port Authorities, the City and Port of<br />
<strong>Rotterdam</strong>, the Netherlands Water Partnership and<br />
several other parties. It was a much appreciated<br />
forum for sharing experiences, devise innovative<br />
solutions, new strategies, development models<br />
and best practices for reshaping outdated portrelated<br />
areas. Such factors are necessary elements<br />
contributing to the economic prosperity and<br />
environmental sustainability of the surrounding<br />
metropolitan regions. Well attended and successful<br />
workshops both in New York and <strong>Rotterdam</strong> were<br />
organized.<br />
The Exchange focused on a comparison of plans<br />
and best practices for Brooklyn’s south-western<br />
waterfront, located at the mouth of the New<br />
York Harbour, and <strong>Rotterdam</strong>’s City Ports. The<br />
objective was to select and apply international<br />
best practices for these two locations and<br />
help generate support for long-term decisions<br />
about key challenges, which include economic<br />
development, environmental sustainability,<br />
transportation infrastructure, waterfront uses, and<br />
climate change. Another objective was to share<br />
expertise about eff ective public policies, which are<br />
instrumental in implementing innovative solutions<br />
in both cities.
“<strong>Climate</strong> change is real l and d could d have serious<br />
consequences forr Neww<br />
Yorkk<br />
if f we don’t t take<br />
action,” ” saidd<br />
Mayorr<br />
Michaell<br />
Bloomberg. “Planning<br />
forr climate change todayy is less expensive than<br />
rebuilding an entire networkk afterr<br />
a catastrophe.<br />
We cannot t waitt<br />
untill<br />
afterr<br />
ourr<br />
infrastructure has<br />
been compromisedd to begin to plan forr the effects ff of<br />
climate change.”<br />
Michael l Bloomberg,<br />
Mayor r of New w York k City<br />
“There are many y challenges facing Metropolitan New<br />
York k relatedd<br />
to climate change in the decades ahead. A<br />
significant fi t portion off the landd area off the cityy lies between<br />
0 andd 3 m above sea levell andd<br />
severall<br />
million people,<br />
especiallyy in the outerr boroughs, live in low w lying coastal<br />
terrain exposed d to the ocean. While Neww York k mayy<br />
have<br />
the advantage overr its European counterparts of f having<br />
more time to plan forr future climate change andd dangerous<br />
levels off sea levell rise, the European experience of f coping<br />
with naturall fl ooding disasters tells us thatt manyy<br />
decades<br />
are neededd to arrive at t the best t solutions to protectt the<br />
city’s infrastructure andd the safety y off<br />
its residents. Now w is<br />
the time to start t planning for r the century y ahead.”<br />
Professor r Malcolm Bowman, State University y of f New w York k at<br />
Stony y Brook; Member r of f Mayor r Bloomberg’s New w York k Panel<br />
on <strong>Climate</strong> Change<br />
N E W Y O R K 49
4<br />
2<br />
Present<br />
situation<br />
The Italian explorer Giovanni da Verrazzano, is<br />
believed to have been the fi rst European to explore,<br />
the area now known as the New York k Harbour in<br />
1524. Although Da Verrazzano was the fi rst to visit<br />
the location off present-day New York k City, it was<br />
Henry Hudson who claimed Manhattan for the Dutch<br />
Government in 1609, sailing his ship The Half f Moon<br />
275 km up the river which now bears his name to<br />
the state capital off Albany. Over the next twenty<br />
years, many Dutch and other Europeans settled in<br />
New Amsterdam, the principal city and port off New<br />
Netherlands. Peter Minuit, a Dutch political director,<br />
is credited with making the ‘deal of f the century’,<br />
when he bought Manhattan Island from the Canarsee<br />
Indians for just $24. The Dutch continued to control<br />
New Amsterdam until 1664, when the British took k over<br />
from the Dutch and renamed the city NewYork, after<br />
James, Duke off York. In 1783, New York k became the<br />
first fi capital off the newly independent United States.<br />
New York k City experienced an exceptional period of<br />
growth during the 19th century. In 1800, when the city<br />
still consisted primarily off Manhattan, it had a mere<br />
60,000 inhabitants; by 1890, the population had grown<br />
25-fold to 1.5 million inhabitants, including Brooklyn,<br />
Queens, Staten Island and the West Bronx. The<br />
opening off the Erie Canal in 1826 provided an efficient ffi<br />
transportation network k for Midwestern grain and<br />
other commodities for domestical use and for export<br />
through New York k Harbour. Railways and steamboats<br />
were important elements of f economic development<br />
from the first fi part off the 19th century, and the opening<br />
of f the Croton water system (1842) brought clean water<br />
to the city’s population, for the fi rst time and improved<br />
public health. Since the 1950s, New York’s population<br />
has grown to over 8 million inhabitants. After a decline<br />
in the cily’s population in the 1980s, nearly 1.2 million<br />
immigrants settled in New Yorkk City in the 1990s. The<br />
projected population in Metropolitan New York k (MET)<br />
in 2050 could be as high as 23 million residents.
4<br />
3<br />
<strong>Climate</strong> and<br />
fl ood risks<br />
New York k City has a temperate, continental climate,<br />
with hot and humid summers and cold winters.<br />
Recordsshow an annual average temperature<br />
between 1971 and 2000 of f approximately 12.8°C.<br />
The annual mean temperature in New York k City has<br />
risen by 1.4°C since 1900, although the trendhas varied substantially over the decades. Between 1971<br />
and 2000, New York k City averaged 13 days per year<br />
with 1 inch (25.4 mm) or more of f rain, 3 days per year<br />
with 2 or more inches (50.8 mm) of f rain, and 0.3 days<br />
per year with over 4 inches (101.6 mm) of f rain.<br />
Regional precipitation in New Yorkk may increase by<br />
approximately 5 to 10 percent bythe 2080s. <strong>Climate</strong><br />
models tend to distribute much off this additional<br />
precipitation to the winter months. Because of f the<br />
effects ff of f higher temperatures, New York k also faces on<br />
increased risk k of f drought.<br />
Storm surges,winter storms and hurricanes<br />
Storm surges along the eastern seaboard of f the<br />
United States are associated with either late summerautumn<br />
hurricanes or extratropical cyclones in the<br />
winter period, the so-called nor’easters. The effects ff<br />
of f extratropical cyclones or nor’easters can be large,<br />
in part because off their relatively long durations<br />
(compared to hurricanes) lead to extended periods of<br />
high winds and high water. In the past, New York k has<br />
been hit by many winter storms coinciding with high<br />
tides.<br />
The height of f the hurricane surge is amplified fi if<br />
it coincides with the astronomical high tide and<br />
additionally occurs at the time of f new and full moon<br />
(spring tides). A period characterized by many severe<br />
hurricanes (Saffir-Simpson<br />
ffi categories 3-5) in the<br />
1940s to 1960s was followed by relative quiescence<br />
Figure 4.1 Hurricanes rated category 3 or higher that made<br />
landfall on the US East and Gulff coasts in the period 1900-1999. NY2<br />
N E W Y O R K 51
during the 1970s to the early 1990s.<br />
Again, greater activity has occurred since the late<br />
1990s. Although hurricanes strike New York City<br />
infrequently, when they do, generally between July<br />
and October, they can produce large storm surges<br />
as well as wind and rain damage inland. Atlantic<br />
hurricanes are aff ected by the El Niño-Southern<br />
Oscillation (a warming of the ocean surface off the<br />
western coast of South America that occurs every 4 to<br />
12 years). Figure 4.1 shows all category 3 hurricanes<br />
(or higher) that made landfall on the US coast in<br />
the period 1900-1999. It shows that hurricanes<br />
have struck the coastal New York area six times in<br />
that period, NY1 resulting in severe coastal fl ooding,<br />
damage and destruction of beachfront property,<br />
severe beach erosion, downed power lines, power<br />
outages and disruption of normal transportation.<br />
History of fl ood events<br />
The August 1893 hurricane completely destroyed Hog<br />
Island, a barrier island and popular resort area on the<br />
south coast of Long Island that once existed seaward<br />
of Rockaway Beach.<br />
The worst natural disaster to strike the north-eastern<br />
US was the hurricane of 21 September 1938, the socalled<br />
“Long Island Express” which was estimated to<br />
have killed between 682 and 800 people, damaged or<br />
destroyed over 57,000 homes, and caused property<br />
losses estimated at US$306 million (comparable to<br />
$4.72 billion in 2010). This storm struck with little<br />
warning. A wall of water 7-11 m (25-30 ft) high (surge<br />
plus breaking waves) swept away protective barrier<br />
dunes and buildings on the shores of eastern Long<br />
Island, eastern Connecticut, and Rhode Island.<br />
More recently, the December 1992 storm produced
some off the worst fl ooding seen in Metropolitan<br />
New York k in more than 40 years. The water level at the<br />
Battery in Lower Manhattan peaked at 2.4 m<br />
(8 ft) above mean sea level; spring tides were already<br />
higher than normal due to the full moon. The flooding fl<br />
of f Lower Manhattan, together with heavy winds, led<br />
to the almost complete shutdown off the New York<br />
City transportation system for several days, as well<br />
as evacuation off many seaside communities in New<br />
Jersey, Connecticut and Long Island.<br />
The vulnerability of f the regional transportation system<br />
to flooding fl was demonstrated again on 26 August<br />
1999, after 6.4-10.2 cm off rain fell on the New York<br />
metropolitan area, nearly paralyzing the transport<br />
system. NY3<br />
Storm surge heights and frequency<br />
A large proportion off New York k City and the<br />
surrounding region, lies less than 3 m (10 ft) above<br />
mean sea level, and infrastructure in these areas is<br />
vulnerable to coastal fl flooding. A one in a hundred<br />
years flood fl could produce a 3 m (9 ft) surge in New<br />
York k Harbour and along the south coast of f Long<br />
Island. Such a surge is more likely to be caused by a<br />
hurricane than a winter nor’easter. On the other hand,<br />
hurricanes occur much less frequently than nor’easters.<br />
Nor’easters are dangerous and can cause considerable<br />
damage even though their wind speeds are lower than<br />
those in fast-moving hurricanes, as nor’easters cover<br />
a much greater area and tend to last several days. This<br />
means that sequential high tides will carrythestorm<br />
surges further inland at a particular location.<br />
Storm return frequencies along the US East Coast<br />
over the last 50 years peaked in the late 1960s,<br />
diminished in the1970s, and picked up again inthe<br />
early 1990s. However, there has been no appreciable<br />
increase in either the number or severity off storms<br />
over this period.The increase in coastal flflooding is<br />
largely a consequence off the regional sea level rise<br />
during this period (about 30 cm per century) due to<br />
eustatic adjustment of f the continent since the last<br />
age and not due to recent fossil-fuel-related sea level<br />
rise. It illustrates how rising ocean levels are likely to<br />
exacerbate storm impacts in the future as sea level rise<br />
accelerates. NY4<br />
Socioeconomic effects ff off fl flooding<br />
Many of f the region’s rail, subway (metro) and tunnel<br />
entrance points, as well as some ports off the New<br />
York’s major airports, lie at elevations off 3 m above<br />
sea level or less. Sea level rise and flooding fl levels of<br />
only 65 cm above the level which occurred during<br />
N E W Y O R K 53
the December 1992 winter nor’easter will place<br />
the area’s low-lying transportation infrastructure<br />
NY5 at increased risk k off<br />
fl flooding.<br />
Inthe Metropolitan<br />
East Coast (MEC) region, some beaches and barrier<br />
islands are narrowing or shifting landward, partly<br />
as a result off ongoing sea level rise as well as land<br />
subsidence. Accelerated sea level rise will intensify<br />
the rate and extent of f coastal erosion. While sea level<br />
rise is obviously an important factor, beach erosion<br />
is frequently intensified fi by human activities such as<br />
coastal development and destruction of f wetlands.<br />
The inland sources of f New York k City’s water supply<br />
system (Long Island almost exclusively derives its<br />
water supply from underground aquifers) will be<br />
impacted by higher temperatures and forecast<br />
increased precipitation. It is expected that the<br />
combination of f these two factors, over time, will result<br />
in both increased fl ooding and increased droughts,<br />
with the resulting need toadjust system operating<br />
rules and drought regulations in order to maintain<br />
supply levels NY6 . <strong>Climate</strong> change is also expected<br />
to have many possible impacts on water quality,<br />
human and ecological health, as a result of f increasing<br />
temperatures, changing precipitation patterns and<br />
changes in turbidity, eutrophication and other water<br />
quality parameters. Higher sea levels and storm surges<br />
will also affect ff the operation off existing wastewater<br />
treatment plans and outfalls, with consequent water<br />
quality impacts to receiving water bodies.<br />
Maintenance of f acceptable water quality standards<br />
in New Yorkk Harbour, western Long Island Sound,<br />
the lower Hudson, Passaic and Hackensackk rivers is<br />
dependent on an adequate fl flushing rate driven by<br />
the twice-daily flflood and ebb circulation of f the tides.<br />
Most of f the city’s treated and untreated sewerage is<br />
eventually discharged into the harbour and waterways<br />
surrounding Metropolitan New York. There are ocean<br />
outfalls in sections off Nassau and Suffolk ff k Counties<br />
along the south shore of f Long Island.<br />
Much off New Yorkk City relies on a combined sewer<br />
system, which means that heavy precipitation events<br />
often result in sewage fl ows being routed around<br />
treatment facilities, and stored in temporary holding<br />
tanks or released directly into the receiving water<br />
bodies. Intense precipitation events can lead to<br />
occasional overflowing fl of f the combined sewers into<br />
city streets and subway systems.
4<br />
4<br />
<strong>Climate</strong><br />
adaptation<br />
In December 2006, Mayor Michael R. Bloomberg<br />
challenged New Yorkers to generate ideas for<br />
achieving 10 key goals for the city’s sustainable<br />
future. NY7 New Yorkers in all fi five boroughs responded<br />
positively. The result isthe most sweeping plan<br />
to enhance New York’s urban environment in the<br />
city’s modern history. On Earth Day 2007, the Mayor<br />
released PlaNYC 2030, a comprehensive sustainability<br />
plan for the city’s future. PlaNYC puts forth a strategy<br />
to reduce the city’s carbon footprint, while at the<br />
same time accommodating population growth and<br />
improving the city’s infrastructure and environment.<br />
The combined impact off this plan will not only help<br />
ensure a higher quality of f life for generations of<br />
New Yorkers to come, but will also contribute to a<br />
30 percent reduction in greenhouse gas emissions<br />
compared to 2005 levels.<br />
In recent decades, New York k City has acquired a<br />
substantial history of f effff<br />
orts to assess adaptation<br />
strategies to address climate change. The ‘Metro East<br />
Coast Report’, a report for the National Assessment of<br />
<strong>Climate</strong> Variability and Change, NY5 reviewed climate<br />
change with many regional stakeholders. The New York<br />
City Department of f Environmental Protection’s <strong>Climate</strong><br />
Change Task k Force, initiated in 2004, surveyed the<br />
entire range of f vulnerabilities to climate change of f the<br />
water system. Its most recent report, the ‘Assessment<br />
and Action Plan’, NY6 was published in 2008.<br />
Mayor Bloomberg, in partnership with the Rockefeller<br />
Foundation, convened the New York k City Panel on<br />
<strong>Climate</strong> Change (NPCC). The NPCC, which consists of<br />
climate change and climate impact scientists, as well<br />
as legal, insurance and risk k management experts,<br />
N E W Y O R K 55
serves as the technical advisory body for the Mayor<br />
and the New York City <strong>Climate</strong> Change Adaptation<br />
Task Force on issues related to climate change, impacts<br />
and adaptation. The Task Force has focused its work<br />
on critical infrastructure in the city, and the NPCC has<br />
developed three workbooks to guide adaptation planning;<br />
a full report from the NPCC is forthcoming. NY8<br />
The city has developed a robust, durable framework<br />
for eff ective, fl exible and cost-effi cient adaptation<br />
planning designed to meet the challenges of climate<br />
change in the city. NY9 This framework is based on<br />
IPCC GCM model outputs for climate scenarios,<br />
and carefully developed adaptation assessment<br />
procedures in the context of climate protection levels.<br />
On a statewide level, the ClimAID study, sponsored<br />
by the New York Energy Research and Development<br />
Authority (NYSERDA), includes an assessment of<br />
coastal impacts, as does the New York Commission<br />
on Sea Level Rise and several other studies. There is a<br />
growing awareness that all of these recommendations<br />
will have to be monitored and adjusted, as new<br />
research and observations become available as to the<br />
projected rate of sea level rise.<br />
Land use zoning and fl ood insurance<br />
The development of NYC waterfronts continues<br />
because of the attractiveness of locating near the<br />
water for recreational and economic activities.<br />
Two recent successful examples of waterfront<br />
developments in New York City are Battery Park, on<br />
the south side of Manhattan, and Brooklyn Bridge<br />
Park, on the Brooklyn side of the east River, near the<br />
bridge. The question that arises is how to develop<br />
future areas and control future land use in such a<br />
manner that vulnerability to fl ooding is managed<br />
in a way that limits risks to human life and physical<br />
structures. In this respect, fl ood zoning policies and<br />
building codes can be powerful tools. New York City<br />
waterfronts play a crucial role in this context as a fi rst<br />
line of fl ood defense, protecting New York City for<br />
future challenges. Hence, the way zoning policies<br />
are applied to waterfronts is directly determining<br />
future vulnerability to fl ood risks and new (re-) zoning<br />
policies for waterfronts can be perceived as option for<br />
climate adaptation in New York City.<br />
Examples are to reduce urban density near waterfronts,<br />
allow for additional elevation of buildings near<br />
the waterfronts (‘freeboarding’) and to combine levee<br />
systems with residential housing near the waterfront.<br />
Furthermore, fl ood insurance could be an important<br />
tool for achieving risk reduction, because it imposes<br />
the minimum requirements for local governments’
flood fl zoning and fl ood building codes, and it provides<br />
incentives to homeowners to invest in risk k reduction<br />
beyond these minimum standards.<br />
Wetland restoration<br />
There is an opportunity in NYC for waterfront<br />
development that enhances fl ood protection levels<br />
through applying measures that also enhance<br />
environmental values. Current discussions address<br />
focusing on waterfront areas where coastal fl flood<br />
protection and nature preservation can be codeveloped.<br />
Local government and the state and<br />
federal policies have a mutual interest here. At the<br />
policy level, such an approach could beaddressed<br />
through better integrating Federal and State coastal<br />
zone protection into local Waterfront Revitalization<br />
Programs (LWRP).<br />
Figure 4.2 Paradise Pond in Marshland, preserve Long Island NY.<br />
Such ‘multi functional land use’ ’ developments,<br />
however, need new planning regulations and urban<br />
designs that allow for a less rigid boundary between<br />
land and water. For example, most environmental<br />
values are found creating (shallow-) gradients between<br />
land and water.<br />
The City of f New York k has recently initiated the ‘Staten<br />
Island Bluebelt Programme’ ’ to reduce the risks of<br />
flooding fl on Staten Island from storm water, by<br />
providing and constructing storm water detention<br />
ponds and enhancing or creating streams, ponds<br />
and wetlands. New, separate, storm and sanitary<br />
sewer infrastructure networks are also included in the<br />
programme. The 10,000-acre (4,000 hectare) Bluebelt<br />
Programme, at an estimated cost of f $37 million,<br />
would cost some $39 million less than a conventional<br />
underground networkk off<br />
storm sewers. NY6<br />
Storm surge barriers<br />
One possible long-term measure that might be<br />
considered is storm surge barriers spanning the major<br />
navigation channels connecting New York k Harbour<br />
to the sea. As New York k is generally located on higher<br />
ground than other threatened European delta cities<br />
such as <strong>Rotterdam</strong>, London and St Petersburg, New<br />
York k City planners enjoy the benefit fi off more time<br />
to consider options for future fl ood protection. The<br />
problems off climate change impacts to be faced in<br />
New Yorkk 50 and 100 years from now may be in some<br />
respects similar to those of f the abovementioned<br />
European cities today. Therefore, much can be learned<br />
from the European experiences with storm surge<br />
barriers before making commitments to ambitious<br />
regional solutions.<br />
As with any major engineering works, NewYork<br />
N E W Y O R K 57
arrier design and emplacement would require<br />
comprehensive feasibility/cost/benefit fi analyses,<br />
desired protection level and efficacy ffi studies. NY11<br />
New York k City has high ground inall of f the boroughs<br />
which could protect against some levels off surge<br />
with a combination of f local measures (such as dikes),<br />
resilient housing, enhanced community resiliency and<br />
evacuation plans. Barriers designed to impede oceanic<br />
storm surges obviously would not protect against the<br />
substantial inland damages from wind and rain that<br />
often accompany hurricanes. As with the Dutch <strong>Delta</strong><br />
Plan, careful decisions would need to bemade about<br />
barrier and dyke locations, since all such systems and<br />
also do not protect those infrastructure and residents<br />
who live outside the barrier.<br />
Possible locations for barriers that were considered<br />
at a 2009 ASCE conference ‘Against the deluge: storm<br />
NY12 surge Barriers to protect New Yorkk City’ include<br />
the Verrazano Narrows, which is the main shipping<br />
channel, connecting Upper New Yorkk Bay and Port<br />
Elizabeth, N.J. with the Atlantic Ocean. Other possible<br />
connections include the upper East River to eliminate<br />
surges originating in western Long Island Sound,<br />
the Arthur Kill behind StatenIsland and or a more<br />
ambitious outer barrier system stretching across<br />
from Sandy Hook, N.J. to Far Rockaway, Long Island.<br />
This latter approach follows the <strong>Delta</strong> Works design<br />
by shortening the length of f coastline that needs<br />
to be protected as well as safeguarding JFKK Airport<br />
and densely-populated communities in Brooklyn,<br />
Queens, Jamaica Bay and northern NJ.This barrier<br />
would eliminate the need for both the Verrazano and<br />
the Arthur Kill barriers (but not the upper East River<br />
barrier), provide protection to the outer boroughs<br />
off Brooklyn and Queens, additional northern NJ<br />
communities, Jamaica Bay and JFKK Airport, but would<br />
have significant fi environmental impact, including<br />
augmenting and modifying the Sandy Hook k barrier<br />
dune system of f the nearby Gateway National<br />
Recreational Area.<br />
N E W Y O R K 59
y Philip Ward, Muh Aris Marfai,<br />
Aisa Tobing and Christiaan Elings<br />
5<br />
Jakarta
5<br />
1<br />
Introduction<br />
Flooding and fl ood management are not<br />
new to Jakarta. The region has suff ered<br />
from fl ooding ever since the founding<br />
of Batavia (the colonial name for the<br />
current city of Jakarta) by the Dutch in<br />
1619. Soon after this, a canal system<br />
was constructed and by 1725 a dam had<br />
already been built to divert the waters of<br />
the Ciliwung westwards. Over the course<br />
of the last four centuries, many more<br />
technical fl ood managements strategies<br />
have been designed and implemented,<br />
but reports of fl ooding are prevalent<br />
throughout this long period. J5<br />
The Government of Jakarta is aware<br />
that eff orts to reduce fl oods involve<br />
local, national and global factors and<br />
is determined to achieve its objectives.<br />
This is quite a challenge, but Jakarta is in<br />
the process to develop detailed plans to<br />
accommodate more water and increase<br />
green retention areas in the city.<br />
Figure 5.1 The location of f Jakarta.<br />
J A K A R T A 61
“In Jakarta, we are aiming to reduce flooding fl in the<br />
city y by y 40 percent t by y 2011 and d byy<br />
as much as 75%<br />
byy 2016. Basedd on detailedd calculations modelling,<br />
these ambitious goals are achievable if f we are able to<br />
increase the proportion off green space in the city y and<br />
improve water r catchments and d groundwater r recharge<br />
in accordance with the Jakarta Spatial l Plan forr 2030.<br />
However, itt is importantt to keep in mind d thatt<br />
fl flood<br />
managementt requires not t onlyy<br />
local, butt also regional,<br />
national l andd<br />
globall<br />
effff<br />
orts, andd so we welcome<br />
cooperation in managing watersheds that t transcend<br />
ourr city’s boundaries.”<br />
Fauzi i Bowo, Governor r of f Jakarta, Indonesia<br />
“From the geomorphologic c point t off<br />
view, Jakarta consists of<br />
alluvial l plain and d coastall<br />
landform, where thirteen rivers flow fl<br />
through Jakarta city. This physicall condition increases the flood fl<br />
hazard d and d vulnerability. Rapid d change off land d use on the upper<br />
part t off<br />
Jakarta and d rapidd<br />
industriall<br />
developmentt<br />
contribute<br />
signifi ficantlyy to increasing surface run offff leads to extensive flood fl<br />
inundation. In the future, with scenario of f climate change, fl flood<br />
event t are predictedd to worser. Therefore an integrated d watershed<br />
andd coastall<br />
zone management, using regional, ecological<br />
andd spatiall<br />
approaches, which is also take into account<br />
coordination among the locall governments surrounding Jakarta<br />
(Jabodetabek, Jakarta-Bogor-Depok-Tangerang-Bekasi), is<br />
required.”<br />
Professorr Dr. Suratman, M.Sc, Dean off the Geographyy Faculty,<br />
Gadjah Mada Universityy Y Yogyakarta, Chairman off the<br />
Indonesian Geographers Association
5<br />
2<br />
Jakarta, the capital and largest city off Indonesia, is<br />
located on the northern coast of f the island of f Java, in a<br />
���������� �����<br />
�� � ����������<br />
��� �����<br />
��� ������������<br />
��� ������<br />
��� ������<br />
��� ���� ���<br />
��� ��������<br />
Figure 5.2 Map showing the thirteen rivers flo fl<br />
Present<br />
situation<br />
lowland area with relatively fl flat topography. Jakarta is<br />
located in the delta of f several rivers. Thirteen rivers flow fl<br />
through the region, the main one being the Ciliwung<br />
(Figure 5.2). The Special Capital Region off Jakarta (DKI<br />
Jakarta) covers an area off about 662 km2 . Over the last<br />
half f century the city’s population rose rapidly from<br />
2.7 million in 1960 to 9 million in 2007. J1 GDP projections<br />
for Indonesia as a whole show overall growth rates of<br />
4.5 percent per year between the periods 2005and<br />
2030, and the population of f Jakarta is expected to<br />
grow from 8.8 million to up to 25 million by 2025. This<br />
population growth, combined with rapid economic<br />
development, has caused extensive land use change in<br />
the whole off Java and in Jakarta in particular. During the<br />
past three decades, fringe areas experienced extensive<br />
land conversion from agricultural land to new urban and<br />
industrial areas, J2, J3 former residential areas in the city<br />
centre have been converted into offices ffi and business<br />
spaces, and open green space in Jakarta has greatly<br />
decreased from 28.8 percent of f the total area in 1984 to<br />
an estimated 6.2 percent in 2007. J4<br />
������ ����� �����<br />
������ �����<br />
������ ������������ �����<br />
��� ������<br />
�� � ���� ������<br />
��� ������<br />
��� ������<br />
��� ��������<br />
��� ���� ���<br />
J A K A R T A 63
Figure 5.3 Ciliwung River and adjacent slum settlements.<br />
Figure 5.4 Flood simulation of Ciliwung River for 1.5m and 2m inundation scenarios.
5<br />
3<br />
<strong>Climate</strong> and<br />
fl ood risks<br />
The physical causes of f fl ooding in Jakarta are several and<br />
interlinked and include land subsidence, climate change,<br />
land use change, and clogged-up rivers and drainage<br />
canals. Jakarta is subsiding rapidly, with an average<br />
subsidence rate of f 4 cm per year in northern Jakarta,<br />
and areas where the subsidence rate is even higher. J6 On<br />
top of f this, the climate ischanging, which is expected to<br />
cause an increase in the frequency off both river flooding fl<br />
and coastal flooding. fl <strong>Climate</strong> models project that annual<br />
rainfall will increase across most of f Indonesia in the<br />
future, J7 and that extreme rainfall events will increase<br />
in severity and frequency in South-East Asia in the<br />
21st century. J8 In recent decades, sea level in the Jakarta<br />
Bay has risen by about 0.5 cm per year. J9 Furthermore,<br />
tropical cyclones are predicted of f increased intensities<br />
for South-East Asia, J10 which could lead to increased<br />
storm surge frequencies and heights. J8 Next to these<br />
problems, the rapid deforestation and urbanizationhas<br />
led to increased flood fl peaks and erosion, resulting in<br />
sedimentation in the city’s rivers and drainage canals.<br />
Urbanization has also resulted in the narrowing off river<br />
basins and floodplains,<br />
fl reducing the discharge capacity<br />
off rivers during peakk events. In addition to these<br />
problems, huge amounts of f garbage clog up Jakarta’s<br />
rivers and drainage canals, partly due to the lack k of f a<br />
coordinated refuse collection system for large parts of<br />
the city. Overflo fl wing rivers cause inundation of f adjacent<br />
settlements, especially the slum settlements (Figure 5.3).<br />
Figure 5.4 shows the simulated extent off a flood fl up<br />
to 2 m in the area near the Kampong Melayu due to<br />
overflowing fl waters from the Ciliwung River. J11<br />
J A K A R T A 65
Figure 5.5 Maintaining the drainage system and channels of the<br />
f city’s<br />
waterways. Trash rack at<br />
k Manggarai Flood Gate, Southern Jakarta,<br />
before and after cleaning. J13<br />
Related sustainability and environmental aspects<br />
Several important sustainability and environmental<br />
aspects are related tothe fl flood problem. One of<br />
Jakarta’s major problems is that of f traffi ffi c and chronic<br />
congestion, described by many as the city’s most<br />
significan fi ‘urbannightmare’. J12 During fl floods, this<br />
problem ismadeeven worse: for example, during<br />
the fl floods off 2002 and 2007, massive traffic ffi jams<br />
hampered evacuation, with major thoroughfares being<br />
brought to a complete standstill for days. Train and air<br />
services were badley aff ffected, with around 80 percent<br />
of f fl flights at the Soekarno-Halta Airport being delayed<br />
in 2002.<br />
Solid waste is another related environmental issue in<br />
Jakarta; off the ca. 23,400 m3 of f garbage produced each<br />
day, y only 14,700 are disposed of f by the City Sanitation<br />
Office. ffi J12 Large amounts off this garbage end up in<br />
the city’s waterways, clogging up drainage channels<br />
(Figure 5.5). Poor coverage of f piped clean water<br />
remains a key problem; a mere 40 percent off the<br />
city’s supply is estimated to be piped, with ca.<br />
40 percent coming from bore-holes, and ca. 20 percent<br />
from traditionalwater vendors. The increasing demand<br />
for water has led to the over-utilization of f groundwater<br />
resources, exacerbating the land subsidence (and<br />
therefore fl flood) problem.
5<br />
4<br />
<strong>Climate</strong><br />
adaptation<br />
Figure 5.6 Re-greening of f fl floodplain areas to increase<br />
water retention.<br />
Traditionally, government policies on fl flooding<br />
in Jakarta have emphazised protection based on<br />
technical measures, such as canals, dams, and<br />
sluices. Today, such measures continue to form an<br />
important part of f Jakarta’s adaptation plan. One of<br />
the ways in which fl floods will be reduced by 2011 is<br />
through the dredging off 13 rivers and 56 drainage<br />
canals and the Eastern and Western Canals. By 2016,<br />
several developments are planned: the construction<br />
off channels and tunnels to link k the Western and<br />
Eastern Flood Canals; construction off a polder<br />
system; the rehabilitation of f existing reservoirs and<br />
lakes; construction off a new reservoir; floodplain<br />
fl<br />
conservation and re-greening (Figure 5.6); and<br />
improving the existing breakwater to prevent the<br />
impact of f tide water. The Jakarta Public Works Agency<br />
has also introduced a project to dredge and remove<br />
J A K A R T A 67
Figure 5.7 Flood marker in a settlement area<br />
to preserve fl ood awareness among citizens.
Figure 5.8 Strengthening the capacity of f communities through<br />
training, education, and discussion.<br />
sediments and waste from the city’s rivers and<br />
drainage canals (Figure 5.5). On a less technical level,<br />
people living in informal settlements and inthecity<br />
outskirts have installed simple structural devices such<br />
as small dams to protect their houses from tidal floods, fl<br />
and are building storage areas on the second storey of<br />
houses to avoid fl ood damage (Figure 5.9).<br />
In recent years, there has also been more investment<br />
in non-structural measures such as awarenessraising<br />
programmes; law enforcement and early<br />
warning and emergency assistance systems; upper<br />
watershed planning and management; training for<br />
strengthening community capacity (Figure 5.8);and<br />
installing fl ood signs to preserve citizens awareness<br />
(Figure 5.7). Furthermore, nature restoration schemes<br />
are being heralded as innovative ways to protect<br />
against fl ooding. In Jakarta, mangrove conservation<br />
is considered a good way to protect the coastal<br />
area, not only in terms off fl flood protection, but also<br />
from a sustainability point of f view. The Ministry of<br />
Forestry has developed a programme to increase the<br />
area of f mangroves in the coastal area near Jakarta;<br />
in some areas these had almost disappeared due to<br />
deforestation.<br />
Interaction of f climate and water issues<br />
with spatial planning<br />
At present,Jakarta is working toward the integration<br />
of f spatial planning and flood fl management. These<br />
issues were discussed when policymakers from Jakarta<br />
attended the CDC symposium on flood fl risk k in New<br />
York k City in 2009. In this regard, fl ood risk k management<br />
plays a key role. Two key components to a successful<br />
flood fl risk k management plan are: (a) flood fl risk k maps<br />
showing how risk k will change spatially; and (b)<br />
assessments of f how fl ood risk k mapping can play a role<br />
in the decision-making process and communication<br />
with stakeholders. Both off these issues are to be<br />
covered in an upcoming research programme as part<br />
of f the Dutch programme Knowledge for <strong>Climate</strong>. The<br />
CDC network k will play a role in embedding knowledge<br />
exchange between cities. A preliminary flood fl<br />
damage model has already been set up by Gadjah<br />
Mada University Yogyakarta (Indonesia) and IVM-VU<br />
University Amsterdam (Netherlands). Based on this<br />
model, Figure 5.10 shows the area off northern Jakarta<br />
that would be inundated as a result of f an extreme<br />
coastal flood fl with a return period off one hundred<br />
years under: (a) current conditions; and (b) a future<br />
scenario in 2100 whereby land subsidence continues<br />
J A K A R T A 69
Figure 5.9 Houses with storage areas on second storey<br />
to avoid fl ood damage.
at 4 cm per year and the sea level rises by 59 cm. The<br />
total value of f assets exposed to such a flood fl under<br />
current conditions is estimated at about €4 billion,<br />
whilst the scenario for 2100 estimates an exposure of<br />
almost €17 billion (excluding the effects ff of f changes in<br />
future population and land use, and socioeconomic<br />
developments). In the coming years, more flood fl risk<br />
maps of f this nature will be developed to show how<br />
flood fl inundation and riskk will change over time, and to<br />
assist in the integration of f spatial planning and flood fl<br />
management.<br />
Figure 5.10 Inundation maps of f northern Jakarta for<br />
two coastal fl ood scenarios.<br />
A) Current conditions<br />
Sea and permanent water bodies<br />
B) Includes sea level rise and land subsidence<br />
Inundated area<br />
<strong>Delta</strong> Dialogues<br />
2008 - 2009<br />
In 2008 and 2009, a series off four meetings (<strong>Delta</strong><br />
Dialogues) were held out in which Indonesian<br />
decision makers at national, regional, and local<br />
levels, civil society stakeholders, and experts<br />
from Jakarta and the Netherlands where brought<br />
together. Through a systematic discussion on<br />
fl ood risks in Jakarta, opinions were shared and<br />
people learned about each others’ ’ perceptions<br />
and interests. As no formal agenda or political<br />
decisions were involved, participants could<br />
freely brainstorm and share views. Based on the<br />
Dialogues, a long-term vision was formulated<br />
on how to reduce flood fl risks taking into account<br />
land subsidence, climate change and other<br />
causal mechanisms. Vietnamese specialists<br />
were also involved in the Dialogues, and this<br />
international exchange of f knowledge and<br />
experience led to the beginnings off Indonesian-<br />
Vietnamese collaboration.<br />
J A K A R T A 71
6<br />
London<br />
by Alex Nickson
6<br />
1<br />
“Preparing our r greatt<br />
cityy<br />
forr<br />
the effects ff off climate change<br />
and d adapting our r homes and d workplaces will l improve<br />
Londoners’ ’ quality y off<br />
life, with more trees, and d better<br />
designed, greener r public c spaces. This will l create new w jobs<br />
and d industries and d reinforce the capital’s position as the<br />
numberr one place to do green business.”<br />
Boris Johnson<br />
The Mayor r of f London<br />
Introduction<br />
In the last decade, London has experienced<br />
fl oods that have damaged homes and<br />
infrastructure, a heat wave that killed<br />
600 Londoners and a drought that led to<br />
the construction of a desalination plant.<br />
<strong>Climate</strong> change is expected to increase the<br />
frequency and intensity of these existing<br />
risks, which unless London adapts, will<br />
increasingly aff ect the city’s prosperity,<br />
the quality of life of its inhabitants and<br />
ultimately London’s reputation as a leading<br />
‘world city.’<br />
L O N D O N 73
“We have quantifi ed the synergies and confl icts between<br />
adaptation to climate change and mitigation of carbon<br />
emissions, for example by examining the contribution<br />
that urban energy use makes to the urban heat island.<br />
We are using our integrated systems modelling to<br />
understand how policies can be devised that yield<br />
benefi ts in relation to a number of objectives and avoid<br />
undesirable side-eff ects.”<br />
Professor Jim Hall, Professor of Earth Systems Engineering,<br />
Tyndall Centre for <strong>Climate</strong> Change Research, Newcastle<br />
University
6<br />
2<br />
Present<br />
situation<br />
From a peak k off<br />
8.8 million in 1939, London’s<br />
population steadily declined to 6.7 million in 1988.<br />
Since then, the population has grown steadily to<br />
7.6 million today and is expected to keep growing<br />
to around 8.9 million by 2031. L1 Nearly all off this<br />
growth will be accommodated on brownfield fi sites,<br />
or further densification fi of f development around high<br />
transport accessibility nodes. This approach leads to a<br />
compact, dense city, but also intensifies fi vulnerability<br />
by concentrating a high number of f people and assets<br />
within a relatively small area.<br />
London sits astride the RiverThames. While not a<br />
traditional delta, the capital is further bisected by<br />
12 tributaries and the tidal infl fluence off the North Sea<br />
extends almost entirely through the city.<br />
London, as with much of f the United Kingdom, is<br />
buffered ff from the continental climate by the Gulf<br />
Stream, and thus has a marine climate. This means<br />
that winters are less cold and summers are less hot.<br />
This reduced seasonal variation is one of f the key<br />
reasons why much off the UKK is poorly adapted to<br />
extreme weather, as wide seasonal variations are very<br />
uncommon and generally short-lived.<br />
L O N D O N 75
6<br />
Drought<br />
Eighty percent of f London’s water comes from the River<br />
Thames and River Lea and 20 percent from the confined fi<br />
chalk k aquifer under the city.The Thames Basin is the<br />
largest river basin in the southeast of f England. As such,<br />
it offers ff a more dependable supply of f water during<br />
���<br />
��<br />
��<br />
��<br />
��<br />
��<br />
��<br />
��<br />
��<br />
��<br />
�<br />
3<br />
�����������<br />
��� ���� ��<br />
������� ������<br />
<strong>Climate</strong> and<br />
fl ood risks<br />
�������� �� �������<br />
��� ������� �����������<br />
droughts than other catchments in the Southeast, as it<br />
is able to collect more water.<br />
The Thames Basin receives an average of f 690 mm of<br />
rainfall per year. Of f this, two-thirds is lost to evaporation<br />
or transpired by plants. 55 percent off the remaining<br />
‘effective ff rainfall’ ’ is then abstracted for use, one of<br />
the highest amounts inthe country. 82 percent of<br />
the abstracted water is for public supply, with half<br />
of f this supplied to households and a quarter to non<br />
households. The remainder is lost in leakage. This<br />
sequence is shown diagrammatically in Figure 6.1 below.<br />
The Environment Agency has classified fi the whole<br />
of southeast England as ‘severely water stressed.’<br />
This means that the amount off water abstracted to<br />
meet demands today is causing actual damage to<br />
the environment. Under the EU Water Framework<br />
Directive (WFD), L2 water companies must contribute<br />
to improving the quality of f water bodies, which will in<br />
effect ff limit theabstraction from some watercourses,<br />
meaning that water supply may fall as unmanaged<br />
demand is likely to increase. The Environment Agency<br />
is currently assessing what level of f ‘sustainability<br />
reductions’ ’ will be required to meet the WFD<br />
requirements.<br />
��� �� �����������<br />
�������� ��� ���<br />
����� ��������<br />
���� �� ���������<br />
���������� �������<br />
�������� ��� ��� �����<br />
��������<br />
��������� ��������<br />
����� ��������� ���<br />
������ ������ ������ ��������� ���<br />
�������� ��������� �������� ����� ��������� ������ ������<br />
Figure 6.1 Diagram from draft water strategy.
Catchments<br />
GLA boundary<br />
be affected ff by flooding fl<br />
more seasonal and that all seasons experience a<br />
signifi cant warming.<br />
London is protected from fl ooding by a series of fl ood<br />
defences and the city’s drainage system. 15 percent<br />
of London’s area lies on the former fl oodplains of<br />
London’s rivers. The standard of protection provided<br />
by the fl ood defences and the area they protect can<br />
be mapped and the assets that lie on the protected<br />
fl ood plains plotted. Figure 6.2 shows the standard of<br />
protection provided by the tidal and fl uvial defences.<br />
It can be seen that there is a very variable standard<br />
of protection, with the tidal defences providing a<br />
high standard of defence to the tidal fl oodplain<br />
(green shaded area), but that protection on some of<br />
the tributaries to the Thames having a much lower<br />
standard of defence (red shaded areas). The standard<br />
of protection provided by the drainage system is<br />
much lower, commonly between 3-5 percent annual<br />
expected probability.<br />
An analysis of ‘who and what’ is at fl ood risk today,<br />
shows that a signifi cant proportion of London’s critical<br />
infrastructure lies in areas of fl ood risk and also in<br />
addition that some of the poorest Londoners are living<br />
in areas of tidal fl ood risk. This is important because<br />
it underlines that much of the infrastructure London<br />
would rely on in the event of a fl ood is at risk and that<br />
the most vulnerable part of the population also live in<br />
at risk areas.<br />
Overheating<br />
Summers in London are rarely hot enough to cause<br />
a signifi cant health impact. However, it is this rare<br />
exposure to high temperatures in combination with<br />
the poor ability of much of London’s housing stock<br />
to maintain comfortable temperatures that causes<br />
Londoners’ vulnerability to high temperatures. The<br />
August 2003 heatwave caused the deaths of 600<br />
Londoners. An analysis L3 of the health impact of the<br />
heatwave across all the UK regions showed that while<br />
London did not experience the highest temperatures,<br />
it did result in the highest number of deaths when<br />
averaged over the population. It is proposed that the<br />
urban heat island (UHI) eff ect was a key factor in this<br />
excess mortality, as the UHI prevented the city from<br />
cooling off overnight and maintained temperatures at<br />
a threshold too high for vulnerable people to recover<br />
suffi ciently from the heat of the day.
6<br />
4<br />
<strong>Climate</strong><br />
adaptation<br />
To identify the climate risks andopportunities facing<br />
London, and to providea frameworkk to prepare<br />
London for climate change, the Mayor of f London is<br />
developing a climate change adaptation strategy<br />
for the city. L4 The strategy assesses the climate risks<br />
to London today, and then uses climate projections<br />
to understand how these risks change, or new<br />
opportunities arise, as a result of f climate change.<br />
The London <strong>Climate</strong> Change Adaptation Strategy<br />
(LCCAS) uses the Disaster Risk k Reduction framework<br />
L5 of f ‘prevent, prepare, respond, recover’ ’ to<br />
categorie the actions. This approach encourages<br />
decision makers to undertake some level of<br />
adaptation activity despite the uncertainty of f climate<br />
projections, and also to consider how to manage<br />
the residual risk k that exists even if f the strategy is<br />
to prevent a climate impact (such as a flood) fl from<br />
occurring.<br />
As part off the public consultation on the LCCAS, the<br />
Mayor used digital media channels to ask k Londoners<br />
what they could and should do as individuals, or<br />
neighbourhoods, to adapt. This included using<br />
YouTube to virally disseminate a video L6 off the Mayor<br />
explaining the need to adapt and an interactive<br />
website L7 where Londoners could put forward their<br />
ideas and vote on other peoples’ ’ ideas (see Figure<br />
6.3). This allowed the Greater London Authority<br />
to reach a wider audience than normally engaged<br />
in policy development and helped raise both<br />
awareness off the issue and ownership off the risk.<br />
Figure 6.3 Website: www.london.gov.uk/climatechange<br />
L O N D O N 79
�<br />
�<br />
�<br />
�<br />
�<br />
�<br />
�<br />
�<br />
�<br />
�<br />
�<br />
�<br />
�<br />
�<br />
�<br />
�<br />
�<br />
�<br />
�<br />
�<br />
�<br />
�<br />
�<br />
�<br />
�<br />
�<br />
�<br />
�<br />
�<br />
�<br />
�<br />
�<br />
��<br />
��<br />
��<br />
��<br />
��<br />
��<br />
��<br />
��<br />
��<br />
��<br />
��<br />
��<br />
��<br />
��<br />
��<br />
��<br />
�<br />
�<br />
Average Monthly Rainfall<br />
Medium Emissions Scenario 2040 - 2060s<br />
� � � � � � � � � � � �<br />
��������� �������� ��������<br />
Average Monthly Maximum Temperature<br />
Medium Emissions Scenario 2040 - 2060s<br />
����� ����� �����<br />
� � � � � � � � � � � �<br />
�������� ����������� ����� ����� �����<br />
Figure 6.4 and 6.5 Baseline London climate (grey bars) 1961-1990, and projected future climate (generated using UKCP09 50% projections).
6<br />
5<br />
From strategy<br />
to delivery<br />
London is undertaking a wide range<br />
of adaptation actions, the following examples<br />
of which are transferable and scalable to<br />
other cities.<br />
Thames Estuary 2100 (TE2100)<br />
The UK Environment Agency has undertaken a study<br />
to identify the fl ood risk management options for<br />
protecting London and the Thames Estuary from<br />
tidal fl ooding to the end of the century. L8 The project<br />
has identifi ed a range of possible options – from<br />
raising the height of existing defences to constructing<br />
a second Thames Barrier – and assesses the level<br />
of protection that each option can provide. The<br />
thresholds for protection against rising sea levels<br />
provided by each of the options are then plotted<br />
against sea level rise. This approach helps decision<br />
makers to understand the suite of options open to<br />
them, and how they can be combined into a ‘decision<br />
pathways’ to create a portfolio of measures through<br />
the century.<br />
Figure 6.6 shows the TE2100 ‘decisions pathway.’ Each<br />
box represents a fl ood risk management option or<br />
series of options and the maximum level of water<br />
level rise they can protect against. This approach can<br />
be replicated for managing other impacts, including<br />
droughts and overheating.<br />
Water neutrality<br />
The Greater London Authority has been working with<br />
the Environment Agency to look at how to balance<br />
London’s water supply in the face of increasing<br />
demand and declining supplies. The aim is to improve<br />
the water effi ciency of London’s existing stock of<br />
3 million homes to provide water for the future<br />
growing population – referred to as ‘water neutrality.’<br />
In principle this means no net increase in demand<br />
despite a growth in the number of inhabitants. To<br />
deliver these water savings, the GLA is working with<br />
the 33 London boroughs, the 4 water companies and<br />
the energy companies on a programme to retrofi t<br />
water and energy effi ciency measures into Londoners’<br />
homes at no cost to the householder. The aim is to<br />
retrofi t up to 1.2 million homes by 2015. The ultimate<br />
vision is to expand ‘water neutrality’ to ‘water security,’<br />
where suffi cient savings are made to provide a buff er<br />
against the impact of climate change on water<br />
supplies (including the sustainability reductions<br />
referred to above).<br />
L O N D O N 81
������� ����� ����� �����<br />
0m 1m<br />
2m<br />
3m 4m<br />
�������� ������<br />
����������� ������<br />
������� ��� �������<br />
������� ��������<br />
�����<br />
��������<br />
Figure 6.6 The TE2100 ‘decisions pathway’.<br />
0<br />
0<br />
1<br />
2<br />
a<br />
r<br />
f<br />
e<br />
D<br />
������� ��������<br />
������� ������ ������� ��� ����� ��� �������<br />
����� �������� ���� ������ ������<br />
�������� ����� ��� � ��� ��������<br />
��� �������� ������ ������ �������� ����� ��������<br />
��� �������� ����� ��������<br />
��� �������<br />
����� �������� ������� ������<br />
�������� ����� ��� � ��� ��������<br />
����� �������� �������<br />
������� ��������<br />
��� �������<br />
0<br />
0<br />
1<br />
2<br />
+<br />
+<br />
h<br />
g<br />
i<br />
H<br />
�������� �������
Drain London<br />
Surface water fl flood risk k is considered to be the<br />
most significant fi short-term climate riskk to London.<br />
Modelling L9 suggests that a one in a twohundred<br />
years rainstorm event today would fl ood up to 680,000<br />
properties in London. A study on London’s drainage<br />
system L10 concluded that even a small increase in<br />
rainfall could require the significant fi modification fi of<br />
the drainage system to maintain current levels of<br />
service.<br />
To manage this existing and increasing risk,the<br />
Greater London Authority has brought together all the<br />
organizations with responsibility for, and information<br />
on, surface water fl flood risk k management and created<br />
a framework k to facilitate collaborative action. The<br />
Drain London project will help every London borough<br />
produce its own surface water management plan<br />
(SWMP), but ensures that the individual SWMPs are<br />
created in coherence with the SWMPs of f neighbouring<br />
borough. The project will also identify and prioritize<br />
the regional fl ood risk k hotspots, and work k to develop<br />
more detailed plans for the priority areas.<br />
Urban greening programme<br />
Work k on developing theLCCAS has highlighted that it<br />
is the urban realm and land cover that intensifies fi many<br />
of f the climate impacts. For example, it is the loss of<br />
permeability caused by the traditional construction of<br />
roads and buildings that causes flash fl flooding, fl and the<br />
loss of f vegetation helps create the UHI effect. ff<br />
The Greater London Authority is developing an urban<br />
greening programme to offset ff the loss of f vegetation<br />
and so manage the climate risks. The Mayor has set<br />
a target of f increasing green cover in Central London<br />
by 10 percent by 2050 and increasing London-wide<br />
tree cover by 5 percent (an additional 2 million trees<br />
by 2030). It is anticipated that this urban greening will<br />
help coolthe city in summer and reduce the frequency<br />
and intensity of f fl oods. The Greater London Authority<br />
is also working with the Environment Agency and<br />
the River Restoration Centre to restore 15 kilometres<br />
off London’s rivers, L11 increasing fl flood storage and<br />
improving riparian habitat.<br />
Integrating perspectives on adaptation<br />
The various perspectives on adaptation that are<br />
outlined above cannot be addressed in isolation. They<br />
interact with one another, in particular via urban land<br />
use. Opportunities exist for integrated approaches,<br />
which provide resilience to a number of f climate risks.<br />
However, the interactions between different ff risks and<br />
L O N D O N 83
Figure 6.7
urban functions can be rathercomplex.<br />
In order to understand these interactions and<br />
provide the evidence needed to underpin integrated<br />
adaptation solutions, the Tyndall Centre for <strong>Climate</strong><br />
Change Research has been working with the<br />
Greater London Authority to develop an Urban<br />
Integrated Assessment Facility (UIAF), which simulates<br />
the main processes of f long-term change in London<br />
(see Figure 6.8).<br />
The UIAF couples a series off simulation modules<br />
within a scenario andpolicy analysis framework. The<br />
UIAF is driven by global and national scenarios of<br />
climate and socioeconomic change, which feed into<br />
models off the regional economy and land use change.<br />
Simulations of f climate, land use and socioeconomic<br />
change inform analysis off carbon dioxide emissions<br />
(focussing upon energy, personal transport and<br />
freight transport) and the impacts of f climate change<br />
(focussing on heat waves, droughts and fl floods).<br />
The final fi component of f the UIAF isthe integrated<br />
assessment tool that provides the interface between<br />
the modelling components, the results and the enduser.<br />
This tool has enabled a number of f adaptation and<br />
mitigation options to be explored within an integrated<br />
framework.<br />
Figure 6.8 Tyndall Centre simulations of f land use in East London on<br />
a 100 × 100 m grid showing existing and future developments i under<br />
the baseline land use paradigm, ii under conditions where a policy to<br />
reduce exposure to fl ood risk k has led to a ban on future fl floodplain<br />
development.<br />
Legend<br />
Census CAS Wards<br />
Water<br />
Undeveloped Land<br />
Current Development<br />
Future Development<br />
L O N D O N 85
New Orleans<br />
7<br />
by David Waggonner and Andy Sternad
7<br />
1<br />
Introduction<br />
“The reason we’re here in the fi rst place is because there’s<br />
water here. Instead of turning our backs, barricading<br />
ourselves, and treating the water like an enemy, let’s<br />
treat it like the friend that it can be and should be –<br />
encouraging the beauty, better environmental standards,<br />
and value for the people (that come with that approach).”<br />
Mary Landrieu, United States Senator for the State of<br />
Louisiana, the USA<br />
New Orleans is the present-day test case<br />
for world delta cities. In 2005, Hurricane<br />
Katrina brought about the failure of the<br />
levee system, fl ooding 80 percent of the<br />
city and forcing prolonged evacuation of<br />
almost the entire population. Five years later,<br />
BP’s Deepwater Horizon oil rig exploded<br />
south of the city, unleashing a torrent of oil<br />
from the reservoir beneath the ocean fl oor,<br />
threatening fragile, protective wetlands<br />
critical to the region’s economy, culture<br />
and storm protection. With rising seas and<br />
sinking land, a place integral to American<br />
history and world culture struggling to<br />
reinvent itself and reverse its decline.<br />
N E W O R L E A N S 87
DD3 Workshop<br />
The Dutch Dialogues workshops are the<br />
outgrowth of extended interactions between<br />
Dutch engineers, urban designers, landscape<br />
architects, city planners and soils/hydrology<br />
experts and, primarily, their Louisiana<br />
counterparts. The eff orts of the Dutch Dialogues<br />
derive from the participants’ unwavering belief<br />
that New Orleans can survive and prosper and<br />
grow only when it gets certain fundamentals in<br />
order. Dutch Dialogues exposes and hopefully<br />
addresses some of those fundamentals.<br />
‘Safety First’ is the key to organizing water<br />
management principle in the Netherlands.<br />
History repeatedly shows the folly of living in a<br />
delta where disasters are common. However, to<br />
ignore the water’s magic – the unique, abundant<br />
opportunities that can and should be exploited<br />
for economic, societal and cultural gain – is<br />
equally foolhardy. ‘Living with the water’ has<br />
recently become an ordering, corollary principle<br />
of Dutch policy. Adapting a living with the<br />
water principle is necessary in post-Katrina<br />
New Orleans. The Dutch Dialogues posits that<br />
both safety and amenity from water are crucial to<br />
a future in which New Orleans is robust, vibrant<br />
and secure.<br />
“The Mississippi River stretches north into Canada and<br />
South to the Gulf of Mexico, east into New York and North<br />
Carolina and west to Idaho and New Mexico. It drains 31<br />
states and 2 Canadian provinces. It exceeds by 20 percent<br />
China’s Yellow River, is double that of the Nile and Ganges,<br />
fi fteen times that of the Rhine. In terms of agricultural and<br />
industrial productivity it is by far the most important river<br />
valley in the world. The river system is America. It directed<br />
the nation’s expansion across the continent.<br />
It spurred technological developments in fi elds as diverse<br />
as architecture, experimental physics, and metallurgy.<br />
It created great fortunes. It determined the path of<br />
demographic movement. Through blues and jazz, through<br />
Mark Twain and Richard Wright and William Faulkner, it<br />
created America’s soul.”<br />
John Barry, author of the award-winning book “Rising Tide:<br />
The Great Mississippi Flood of 1927 and How It Changed<br />
America”
7<br />
2<br />
Present<br />
situation<br />
General characteristics<br />
New Orleans is a city on the edge, but it exists for<br />
a reason. Guided by the native inhabitants in 1718,<br />
French colonist Jean-Baptiste Le Moyne de Bienville<br />
founded New Orleans at its present location on the<br />
relatively high natural levee along the Mississippi River.<br />
Convenient and strategic access to the sea through<br />
Bayou St. John and Lake Pontchartrain meant that<br />
New Orleans could receive ocean-going commerce<br />
in addition to the river trade that chugged past its<br />
banks. According to historical geographer Richard<br />
Campanella, ‘the site (Bienville) fi finally selected<br />
represented the best available site within a fantastic<br />
geographical situation’. Although the area was<br />
predominantly marshland and prone toriver flooding fl<br />
and intense storms, a city at the mouth of f the greatest<br />
water highway on the continent was inevitable.<br />
On the delta the Mississippi fl flows higher than its<br />
surroundings on land of f its own creation. The historic<br />
French Quarter sits on the slope of f the Mississippi levee<br />
created as spring fl oods deposited coarse sediments<br />
near its banks. As fl ood water spread out and slowed<br />
down, lighter clays and fine fi silt were loosely deposited<br />
further away. The result is a natural high ground around<br />
15 feet above sea level along the river, that slopes gently<br />
downhill, almost imperceptibly, to the backswamp and<br />
Lake Pontchartrain at sea level a few miles away. Ridges<br />
of f high ground – sometimes only a fewfeet above sea<br />
level – created by former distributary channels off the<br />
river crisscross the landscape. New Orleans originally<br />
developed along these tenuous bands of f elevated earth,<br />
and as evidence of f early inhabitant’s now-forgotten<br />
environmental understanding the historic parts off the<br />
city largely escaped Katrina’s inundation.<br />
Figure 7.1 Mississippi River <strong>Delta</strong>. New Orleans Metro Area at center.<br />
N E W O R L E A N S 89
Figure 7.2 19 th century map of New Orleans. Note the compact city near the river with the backswamp and Lake Pontchartrain behind it.<br />
Culture<br />
New Orleans’ complex identity was formed from<br />
people of diff erent backgrounds sharing slender<br />
dry space alongside the river. With the slaves the<br />
early underpinnings of voodoo, blues and jazz<br />
were imported from Africa. Elaborate Mardi Gras<br />
celebrations grew out of French Catholic and African<br />
traditions. Culinary specialties, then as now, rely<br />
on local seafood bounties. As a growing centre of<br />
world commerce, the city also attracted immigrants<br />
in numbers second only to New York. NO1 Iconoclasts<br />
and slaves lived side by side at the river mouth where<br />
North America met the sea. Europeans 4 (Spanish,<br />
French, Irish and Germans) African slaves and free<br />
people of colour, French Creoles and American<br />
entrepreneurs from across the country coexisted to<br />
take advantage of the city’s promise.<br />
Before the advent of pumping and drainage<br />
technology, the region’s vernacular architecture<br />
blended European styles with practical, climateresponsive<br />
strategies. French and Spanish infl uences
are evident in the scale, streetscape and courtyards<br />
of f the French Quarter. New Orleans’s characteristic<br />
shotgun houses – long and narrow for cross<br />
ventilation – were often constructed using dismantled<br />
river barges. Most structures, especially outside the<br />
city centre, were elevated offff the ground.<br />
At the time of f Katrina in 2005, New Orleans had a<br />
population of f 437,186, down from a peak k of f 626,525<br />
around 1960, a reduction of f approximately 30 percent.<br />
Over the same period, despite population loss, the<br />
city’s area increased from approximately 100 square<br />
miles to its current size off 180 square miles. NO2 Since<br />
Katrina the population has fallen an additional twenty<br />
percent, but even before the storm New Orleans was<br />
facing issues of f contraction, underpopulation and<br />
decline. NO3<br />
Economy<br />
South-eastern Louisiana’s economy is focused around<br />
the oil, gas, and petrochemical industries, shipping<br />
traffi ffi c, seafood and tourism. Petrochemical production<br />
provides over $12 billion annually in household<br />
earnings throughout the state. More than 25 percent<br />
of f the nation’s ocean bound exports pass through<br />
Louisiana’s ports, and a quarter of f all commercial<br />
fishing fi catches in America land in Louisiana.<br />
Additionally, tourism generates $5.2 billion statewide,<br />
mostly in New Orleans, whichwas recently rated<br />
the world’s premier nightlife hotspot. Digital media,<br />
film-making,<br />
fi and the water sector are emerging<br />
NO4, NO5<br />
industries.<br />
N E W O R L E A N S 91
7<br />
3<br />
<strong>Climate</strong> and<br />
fl ood risks<br />
At 30 degrees north latitude, the region is squarely<br />
subtropical. Average annual temperatures fl fluctuate<br />
between 91°F (33°C) in the summer and 43°F (6°C)<br />
in twinter, with annual rainfall totals typically<br />
exceeding 60 inches (152 cm). NO6 In addition to<br />
characteristically hot and humid weather, the Gulf<br />
of f Mexico routinely experiences intense hurricanes.<br />
Hurricane Katrina in 2005 hit New Orleans almost<br />
directly as a massive category three storm with<br />
sustained winds up to 130 mph and a storm surge<br />
approaching twenty feet. NO7 An average of f 11 named<br />
storms pass through the Gulff each year, and over the<br />
next century their frequency and magnitude – and the<br />
sea level itself f – are projected to increase. NO8<br />
Response to Environment<br />
Water is New Orleans’ ’ source off sustenance and<br />
prosperity, yet it also challenges the city’s very<br />
existence. In order to exploit its potential, generations<br />
off New Orleanians have built levees, dug canals,<br />
and pumped, drained and diverted water across the<br />
land to fortify the city against nature’s persistent<br />
threat, defensive strategies that have sometimes<br />
also counteracted natural processes. In 1866, US Civil<br />
War general A.A. Humphreys became chief f of f the<br />
US Army Corps of f Engineers and developed a policy<br />
that predominantly involved the development of f a<br />
levee system. In 1913, highly efficient ffi screw pumps<br />
were invented by Albert Baldwin Wood and installed<br />
at outfall canals that drained the backswamp to the<br />
lake. With the deployment of f these powerful pumps,<br />
the New Orleans drainage system was the most<br />
technologically advanced system in the world. NO9<br />
N E W O R L E A N S 93
With confidence fi in this mastered terrain, post-World<br />
War II development near the lakeshore abandoned<br />
the traditional raised housing type and en-vogue,<br />
ranch-style; slab-on-grade houses dominated the<br />
new landscape. Ironically, the newly available land<br />
was below sea level and continually subsiding due to<br />
the same drainage system off levees and pumps that<br />
permitted its development. Today, pile-supported<br />
box culverts remain high whiletheadjacent land falls<br />
away. Eventually, concrete floodwalls<br />
fl were required<br />
along the outfall canals to prevent lake surges from<br />
flooding fl the city. Despite improvements, street<br />
flooding fl commonly occurs during rain storms due in<br />
part to the system’s inherent lack k off<br />
water storage.<br />
On a macro scale, the flood-proof,<br />
fl leveed river can<br />
no longer rebuild and sustain delta soils. Dams and<br />
reservoirs farupstream trap fifty fi percent of f the river’s<br />
historical sediment load, and much off the remaining<br />
sediment is channelled past wetlands and over<br />
the continental shelf. NO10 The comprehensive levee<br />
and pump system now encircling the city provides<br />
protection but also seals human development into a<br />
slowly subsiding bowl. All of f New Orleans’s 150 cm<br />
of f rainfall per year must be pumped out and the<br />
dried former backswamp continues to compact and<br />
subside at a rate of f anywhere from 5mm to almost<br />
2 cm per year. NO9 At once New Orleans’s lifeblood and<br />
primary historical antagonist, water has been covered<br />
up and walled off. ff<br />
Katrina<br />
Among New Orleans’ lineage of f natural disasters,<br />
Hurricane Katrina in 2005 was not only the worst<br />
in the city’s history but the most costly ever to occur<br />
in the United States. Damage estimates reached<br />
$125 billion in economic losses on the Gulf<br />
Coast, and $30 billion in the city off New Orleans<br />
alone. NO11 The city lost 70 percent off its urban<br />
canopy, NO12 an estimated number of f 100,000 trees. NO13<br />
More than 160,000 homes were destroyed or heavily<br />
damaged and 1,500 lives were lost. Katrina forced<br />
the evacuation of f 1.36 million people, creating a New<br />
Orleans diaspora across the continent. The suburban<br />
developments on former backswamp suffered ff most,<br />
and subsidence of f six to seven feet below sea level<br />
in some places worsened the flood fl ’s effect. ff The older<br />
neighbourhoods on high ground on the river’s edge<br />
NO9<br />
and ridges suffered ff little or minor fl flooding.<br />
In response to the storm, the US Army Corps<br />
redoubled its levee strengthening efforts. ff To date,<br />
the US Congress has released $14.45 billion for the
Louisiana Hurricane Protection System, including<br />
levees and floodwalls;<br />
fl outfall canal repairs and<br />
closure structures; and pump station repairs and<br />
NO14 storm proofing. fi With unprecedented speed the<br />
Corps set a world record in realizing the Hurricane<br />
Protection System within approximately 4 years,<br />
around ten times faster than the Dutch built their<br />
<strong>Delta</strong> Plan in about 40 years after the floods fl of f 1953.<br />
Full protection from a 100-year storm, equating<br />
to a one percent chance of f failure in given year, is<br />
projected by June 2011. The system within the levees<br />
remains unchanged: pumps can handle one inch<br />
of f rainfall in the fi rst hour and 0.5 inches in each<br />
subsequent hour. When combined, Orleans Parish’s<br />
three outfall canals can discharge 16,000 cubic feet<br />
of f water per second, the average fl flow of f the Potomac<br />
River. NO15 Although impressive, this system, practically<br />
devoid of f storage capacity, is overwhelmed by<br />
recurring rainstorms that can produce two to four<br />
inches of f rain anhour.<br />
The use of f engineered solutions for narrowly defined fi<br />
problems has in recent times proven insufficient ffi<br />
to combat the complex, intertwined challenges<br />
confronting modern delta living. Considering the<br />
fact that climate change may increase the challenges<br />
further, New Orleans may need to embrace a more<br />
holistic, ecologically-based thinking, with the<br />
cultivation of f nature’s own lines of f defence, not just<br />
to sustain the city’s future but also to avoid that the<br />
adaptation cost continue to increase and perhaps<br />
eventually outweigh the incredible cultural and<br />
economic value off habitation on the Mississippi <strong>Delta</strong>.<br />
Figure 7.3 Damaged homes in the Lower NinthWard.<br />
N E W O R L E A N S 95
Levee<br />
Pump Station<br />
Orleans Canal<br />
New Pump Station<br />
Bayou<br />
Lake Pontchartrain<br />
London Avenue Canal<br />
Pump Station<br />
New Pump Station<br />
Figure 7.4 Dutch Dialogues proposal for part of a<br />
comprehensive water management system in New Orleans.
7<br />
4<br />
<strong>Climate</strong><br />
adaptation<br />
No place is more in need of f a transformative vision<br />
and process for climate change adaptation and water<br />
management than New Orleans and the Mississippi<br />
<strong>Delta</strong>. After decades of f levees and drainage for<br />
flood fl protection and navigation, with channels cut<br />
through the marsh for commercial purposes, the<br />
wetlands of f south Louisiana are quickly receding. A<br />
shift in paradigms is fortunately underway. Largescale<br />
diversions off the river’s fl flow and sediment<br />
can revive coastal wetlands downstream. Plans and<br />
initiatives to speed and increase these diversions<br />
are in progress. The perimeter defence system built<br />
by the Corps of f Engineers around the city, though<br />
more robust than before Katrina, only provides a one<br />
in a hundred years level of f protection, perhaps less<br />
than the urban area will need for future safety and<br />
reinvestment. It is nonetheless a base line that must<br />
be amplified, fi supplemented and built upon in the<br />
years and decades ahead.<br />
The third component off the storm defence and water<br />
management system is the urban water system. Here<br />
the balances between existing and envisioned, manmade<br />
and natural can be explored.Implementing<br />
the idea of f living with water instead of f fi<br />
ghting<br />
against it, the urbanized settlement can over time<br />
be transformed. A shift to cherishing the earth and<br />
the roots it provides, and revealing and revering,<br />
water is envisioned. Crucial balances in the process of<br />
re-evaluation include land and water; habitation and<br />
infrastructure; buildings and open spaces; hard and<br />
permeable surfaces; fresh and salt water gradients;<br />
levees, perimeter defense structures, and storm surge;<br />
and the effect ff off variable ‘sea level’ ’ and higher limits<br />
on operating levels for theurban water system.<br />
Figure 7.5 GIWW waterway closure structure. Example of f engineering<br />
solutions to complex problems .<br />
N E W O R L E A N S 97
Adaptations are fundamental, but conceivable and<br />
ultimately achievable. The planning time frame for<br />
climate adaptation needs to shift from a fi five-year<br />
horizon to about 50 years. A vision-driven, learningbased<br />
approach is nascent, and with nurture can bear<br />
fruit. A recently commenced consensus-based water<br />
strategy is a key step in this transformative process.<br />
To succeed, an integrated approach developed from<br />
a multi-level perspective is required. Change must<br />
encompass the whole system, with targeted starting<br />
points. To succeed, focus should be on windows<br />
of f opportunity instead of f barriers. Non-interactive<br />
models need to be supplemented and communities<br />
should be engaged and encouraged to participate.<br />
This will also enhance the resiliency off communities.<br />
Ecological memory learning from the past is instructive<br />
and should be recalled.<br />
Several principles and ideas have risen in<br />
consciousness. Lessons have been learned. We must<br />
make space for water. Landscape is not a secondary<br />
idea but a prime contributor to the health and<br />
sustainability of f the settlement. Trees and plant<br />
materials are vital to the liveability off this sub-tropical<br />
area. Specific fi attention must be paid to the underlying<br />
layers of f soil and groundwater. Hydrological units<br />
or sub-basins, perhaps developed into polders, are<br />
the district level structure off the city. Planning for<br />
transportation, infrastructure, and water management<br />
should be integrated with spatial planning. There<br />
is an existing urban form with and from which we<br />
build. On a larger public scale, a circulating water<br />
system is essential, multi-purpose infrastructure.<br />
Private as well as public property must contribute to<br />
the water storage solution. New Orleans is inevitably<br />
Above 15 ft in elevation<br />
10 to 15 ft in elevation<br />
5 to 10 ft in elevation<br />
0 to 5 ft in elevation<br />
Lake Pontchartrain<br />
-5 to 0 ft in elevation<br />
-10 to -5 ft in elevation<br />
Below -10 ft in elevation<br />
Lower Ninth Ward<br />
Figure 7.6 Map of f Greater New Orleans. Figure 7.7 Topographical map off New Orleans. French Quarter in<br />
yellow. All areas in blue are below sea level.<br />
Key
WBV 14f.2 –Hwy 45<br />
Levee<br />
y<br />
WRDA - IEPR Projects<br />
WRDA – IEPR Projects<br />
WBVV 12 Hero<br />
Canal Levee<br />
Reach 1<br />
Canal 100 - Year<br />
Alternatives<br />
PS Fronting Protection<br />
& Modifications<br />
Figure 7.8 US Army Corps map of f 100-year storm protection upgrades around metro New Orleans.<br />
an ecological borderland. With engaged citizens<br />
providing specific fi knowledge, a fl exible planning<br />
culture and a commitment to learning, innovation<br />
and feedback k using a science-based, place-based<br />
I<br />
Loop Caernarvon<br />
Floodwall<br />
L<br />
o<br />
Chalmette Loop<br />
Bayou Dupre to<br />
Hwy 46 Levee<br />
approach, an adaptable and highly desirable water city<br />
of f an expanded, productive garden type is feasible for<br />
the Mississippi <strong>Delta</strong>.<br />
N E W O R L E A N S 99
8<br />
Hong Kong<br />
by Pieter Pauw and Maria Francesch
8<br />
1<br />
Introduction<br />
Since its foundation, Hong Kong has been<br />
dealing with fl oods. As the city grows and<br />
develops, the potential consequences<br />
of fl ooding increase. Simultaneously,<br />
climate change causes sea level rise and<br />
increases the probability of extreme<br />
precipitation. Past, present and planned<br />
adaptation shows how Hong Kong adopted<br />
the challenge of climate change.<br />
Hong Kong is situated at the mouth of f the delta formed<br />
by the Xijiang (West), Beijiang (North) Dongjiang (East)<br />
and Zhujiang (Pearl) rivers as they enter the South<br />
China Sea. The territory consists of f 260 islands spread<br />
around 1,104 square kilometres with a total coastline of<br />
approximately 730 kilometres. Hong Kong’s population<br />
grew at a steady rate from 3 million in 1960 to almost<br />
7 million in 2008. HK2 Its economy is based on trade and<br />
services with people working and living on less than<br />
25 percent of f Hong Kong’s total area. The current gross<br />
national income of f US$ 31.420 per capita (comparable<br />
to Spain) and the average life expectancy of f 82 clearly<br />
HK2 show that Hong Kong is a wealthy part of f China. Hong<br />
Kong has heavy urban development and a very high<br />
population density. Large urbanized areas are located<br />
in low lying areas off the territory, making the city<br />
HK3<br />
vulnerable to sea level rise and fl floods.<br />
Figure 8.1 View from Hong Kong International Airport.<br />
O N G K O N G 101
“The Pearl River <strong>Delta</strong> region is one of the most<br />
economically vibrant parts of the world and is also<br />
vulnerable to the impact of climate change. Hong<br />
Kong has to continue to transform itself into a lowcarbon<br />
economy to strengthen our resilience towards<br />
climate change and adopt a sustainable development<br />
pathway. The key to this is concerted eff orts by Hong<br />
Kong and our partner cities in the region, as well as<br />
cooperation from both the private sector and the<br />
general public.”<br />
Mr Edward Yau, Secretary for the Environment<br />
of Hong Kong<br />
“The rise of multi-level governance, that is, the diff usion<br />
of decision making across multiple levels of government,<br />
off ers two challenges for public administrators. First, is the<br />
allocation of roles to politicians and civil servants in steering<br />
public policy within multilevel regimes – simply put, who<br />
governs what? The second challenge is the management of<br />
interfaces between levels of government and the multitude<br />
of organizations involved in these mediations. How can<br />
policies be implemented in a reasonably uniformed way<br />
when such leeway is left to cities’ governments and to<br />
sectors within them? In analyzing the measures taken so far<br />
in Hong Kong in relation to climate change, one observes<br />
that the transition from a sectoral and technological<br />
governance approach towards an integrated and interactive<br />
approach is being realized as the city benefi ts from<br />
networking with other delta cities.”<br />
Dr. Maria Francesch, City University of Hong Kong
8<br />
2<br />
Present<br />
situation<br />
Natural resources<br />
The territory’s large population and wealth places<br />
high demands on water, energy, food and raw<br />
materials, for which Hong Kong is almost completely<br />
reliant on imports. This makes the coastal city<br />
susceptible to climate stressors hitting these other<br />
areas as well. HK5 Energy and water are of f particular<br />
importance.<br />
Energy<br />
Per-capita energy consumption in has more than<br />
tripled between 1971 and 2006. HK2 Electricity demand<br />
for air-conditioning for example increased to<br />
29 percent off the total electricity use in 2007. HK6<br />
The electricity use is expected to rise further due to the<br />
increasing temperatures in Hong Kong. HK7 In 2007<br />
99.8 percent of f the energy consumed was imported. HK8<br />
This makes Hong Kong dependent on others at times<br />
of f increasing temperatures and electricity use.<br />
Water<br />
Water is threatening Hong Kong from all sides<br />
(precipitation extremes, river discharge, sea level rise,<br />
rising groundwater tables), but at the same time the<br />
city has a long-standing problem of f drinking water<br />
shortages. In 1863 the British already built a fi first<br />
freshwater reservoir as local streams and wells did not<br />
provide sufficient ffi water for the growing population.<br />
Currently the natural storage capacity is limited<br />
and only a quarter off the water supply is provided<br />
locally (Figure 8.5). The water demand is expected to<br />
Figure 8.2 Map of f Hong Kong. HK4<br />
H O N G K O N G 103
continue to rise under the pressures on an increasing<br />
population and increasing temperatures. At the same<br />
time, importing water becomes more difficult, ffi as<br />
Figure 8.3 Resources and freshwater consumption 1997-2008. HK10<br />
Mm 3<br />
climate change and economic development could<br />
also cause a potential water shortage problem in<br />
Guangdong where demand is outstripping supply. HK9<br />
Resources and fresh water annual consumption<br />
1200<br />
1100<br />
1000<br />
900<br />
800<br />
700<br />
600<br />
500<br />
400<br />
300<br />
200<br />
100<br />
0<br />
1997 1998 1999 2000 2001 2002 2003 2004 2005 2006 2007 2008<br />
Year<br />
Local Yield<br />
DongJiang Water Supply from Guangdong<br />
Local Yield + DongJiang Water Supply from Guangdong<br />
Fresh Water Annual Consumption
8<br />
3<br />
<strong>Climate</strong> and<br />
fl ood risks<br />
Hong Kong has a subtropical climate with average<br />
temperatures between 16°C and 28°C over the year,<br />
and average annual precipitation levels of f 1700-2800<br />
mm. HK11 Records show that Hong Kong has been<br />
warming up since measurements started in 1884.<br />
Between1980 and 2009, rural areas warmed up at a<br />
rate of f around 0.2°C per decade. In the heart off urban<br />
Hong Kong, however, the corresponding rise was<br />
muchhigher at around 0.6°C per decade. This 0.4°C<br />
difference ff can be attributed to the heat island effect ff<br />
through which the high density urban area absorbs<br />
and retains heat. HK12 Compared with 1980-1999,<br />
the temperature is projected to increase by +4.4°C<br />
to +5.2°C in 2090-2099 depending on the level of<br />
urbanization. Furthermore, the number off cold days<br />
per year will be virtually nil and the number off hot<br />
days and nights will increase dramatically from<br />
15 and 7 in 1980-1999 to 45 and 17 in 2090-2099 in a<br />
constant urbanization scenario. HK13<br />
It is likely that temperature rise will increase the city’s<br />
energy use. It might also be conducive to extreme<br />
events like heavy precipitation and consequent<br />
flooding. fl Although the number of f tropical cyclones<br />
affecting ff Hong Kong has decreased during the<br />
period 1961 to 2002, the annual rainfall and the<br />
number off heavy rain days have increased during<br />
the period 1947 to 2002. HK12<br />
It is likely that an increase in temperature will<br />
increase the energy use in the city. The rise in<br />
temperature might also be conducive to extreme<br />
events like heavy precipitation and consequent<br />
flooding. fl<br />
Figure 8.4 One off the earliest sketches of f Hong Kong (1842).<br />
The view is from Victoria Harbour looking towards the Victoria<br />
Peak.<br />
H O N G K O N G 105
Figure 8.5 Flooding due to a heavy rainfall event in central Hong<br />
Kong, 1880’s. HK15<br />
Figure 8.6 Parked cars swept away by fl oodwater in 1966.<br />
Figure 8.7 In 1972 a monsoon triggered a landslide of 40.000 cubic<br />
meters in Po Shan Road, Hong Kong Island. HK15
Temperature (˚C)<br />
24.5<br />
24.0<br />
23.5<br />
23.0<br />
22.5<br />
22.0<br />
21.5<br />
1885-2009 +0.12˚C/decade<br />
1947-2009 +0.16˚C/decade<br />
1980-2009 +0.28˚C/decade<br />
21.0<br />
1885 1895 1905 1915 1925 1935 1945 1955 1965 1975 1985 1995 2005<br />
Figure 8.8 Annual mean temperature recorded at the Hong Kong Observatory Headquarters (1885-2009). Data are not available from 1940 to 1946<br />
(Source: Hong Kong Observatory).<br />
Sea level rise<br />
The Guangdong Province, with Hong Kong located<br />
in the middle off its coastline, predicts a sea level rise<br />
between 9 cm and 31 cm by the year 2030. This will<br />
also cause river levels to rise. Rising sea and river<br />
levels reduce the defense capacities against flooding fl<br />
and storms. This could inundate the coastal areas and<br />
cause more sea tidal surges. Exacerbated fl flooding in<br />
its turn would affect ff the economy, public works and<br />
HK5, HK9 promote the spread off disease. Saline water<br />
intrusion is not really an issue in Hong Kong. Most of<br />
the fresh water supply is imported, and the agricultural<br />
and industrial sectors have almost been phased out<br />
throughout Hong Kong.<br />
Year<br />
Flooding<br />
In Hong Kong, typhoons and consequent fl floods have<br />
been a recurring phenomenon through history:<br />
� An unnamed typhoon in 1906 caused vast<br />
damage to Hong Kong and resulted in a death toll<br />
of f around 10,000 (90 percent of f whom were boat<br />
people). A shockingly high figure fi for the community<br />
of f less than 450,000 people at that time. HK14<br />
� The villages along the coast off Tolo Harbour were<br />
severely flooded by the storm surge of the Great<br />
Hong Kong Typhoon in 1937. Over 10.000 lives<br />
were lost. The surge was about 3.8 metres. HK14<br />
H O N G K O N G 107
� Typhoon Wanda (1962) coincided with a high tide,<br />
causing a tidal wave as high as 7 metres high.<br />
The eff ect was disastrous, with over 130 dead<br />
and 72,000 people left homeless. HK15<br />
� Typhoon Rose came with extreme rainfall, with on<br />
17 August 1971, alone 288 mm of rain, resulting in<br />
fl ooding and landslides. 100 people were killed and<br />
5,644 left homeless. HK15<br />
� June 2008 had the heaviest rainfall in Hong Kong<br />
history, with a month total of 1346 mm. A ‘Black<br />
Rainstorm Signal was issued on June 7, when<br />
301 mm fell within a day. The damage of the heavy<br />
rainfall on this day alone was estimated at EUR 55<br />
million (75 million US$). HK5<br />
The present-day risk of fl ooding in Hong Kong is<br />
predominantly determined by intense precipitation<br />
from tropical cyclones and monsoons. Every year, two<br />
to three tropical cyclones pass Hong Kong. During<br />
these rainstorms, the rural low-lying areas and natural<br />
fl ood plains in the northern part of the territory and<br />
some locations in the older urban areas suff er serious<br />
fl ooding. HK9 Residential blocks on higher grounds,<br />
slopes and embankments are vulnerable too. Risks<br />
increased when fl atlands in the rural areas were<br />
converted from fi sh ponds and agricultural land to<br />
built-up areas, eliminating a buff er against fl oods. HK15<br />
Although there is no signifi cant change in the number<br />
of typhoons passing by Hong Kong, HK16 climate change<br />
may increase the rainfall amount during such events<br />
and exacerbate the fl ooding problems. HK9 A rising sea<br />
level makes drainage into the sea more diffi cult, and<br />
can increase the risk of events such as Typhoon Wanda<br />
recurring in 1962. In recent years, Hong Kong has<br />
invested heavily in measures to prevent present and<br />
future fl ooding (see ‘Flood protection’ page 107).<br />
Figure 8.9 The USS REGULUS, a US Navy ship, as a result of<br />
Typhoon Rose (1971).
8<br />
4<br />
In his Policy Address in 1999, the Chieff Executive of<br />
Hong Kong, Tung Chee-hwa made clear the city’s<br />
endeavours to become a clean, comfortable and<br />
pleasant place. Every citizen, business, government<br />
department and bureau is required to start working<br />
in partnership to achieve sustainable development.<br />
Furthermore, alongside twentyother Asia-Pacific fi<br />
Economic Co-operation economies, Hong Kong has<br />
set a target to achieve at least a reduction in energy<br />
intensity of f at least 25 percent by 2030 compared to<br />
2005. HK17<br />
<strong>Climate</strong><br />
adaptation<br />
Flood protection<br />
<strong>Climate</strong> change adaptation is a new issue in Hong<br />
Kong.Flood protection, on the other hand, has always<br />
been an issue and was addressed soon after Hong<br />
Kong Island came under British rule in 1841. Although<br />
the first drainage system was constructed mainly for<br />
health reasons, soon the infrastructure increased, and<br />
drainage (flood fl protection) systems and sewer systems<br />
were explicitly separated. Under the ever-increasing<br />
population, newly built gullies, culverts and streams<br />
could not reduce the fl ood risk. In 1987, the Director of<br />
Civil Engineering became responsible for coordinating<br />
all aspects off fl flooding in Hong Kong. Before that time,<br />
responsibilities where spread between numerous<br />
parties. The new situation led to a drainage and<br />
flood fl control strategy, which was adopted in 1990.<br />
Simultaneously, the Drainage Service department<br />
was established,and since then investment in flflood<br />
protection has increased dramatically. HK15<br />
Figure 8.10 Inflatable fl dam at Kam Tin River. HK15<br />
H O N G K O N G 109
Hong Kong’s painful experiences with storm surges<br />
promoted the adoption of f stringent design standards<br />
for coastal infrastructures. Nowadays, reclaimend<br />
land is always raised +4 m above sea level to cater for<br />
settlement safety and sea level rise. Physical models<br />
and computational models are widely applied for the<br />
design off bridges, coastal infrastructures and drainage.<br />
The drainagesystem that copes with intense (cyclone)<br />
precipitation has a recurrence interval of f fl flooding<br />
prevention of f one in a fi fty to twohundred years in<br />
urban areas (see Figure 8.13). Continued efforts ff made<br />
to separate the sewagesystem from storm water<br />
drainage for health and safety reasons. Important<br />
measures for so doing include infl fl atable dams and<br />
Figure 8.11 Left: the flflood-vulnerable subway system in Hong Kong has lifted entrances.<br />
Right: Nathan Road at its junction with Jordan Road flooded fl in 1997. HK15<br />
dry weather fl ow inceptors that collect polluted water<br />
HK15<br />
in dry times, but allow storm water overflow. fl<br />
Other technological measures for reducing the flood fl<br />
riskk include fl ood storage tanks (for example under<br />
recreation grounds for example), raising the entrances<br />
of f buildings (see Figure 8.11), pumping stations and<br />
drainage tunnel schemes. HK15<br />
A world-class storm warning system has also been<br />
installed to monitor and forecast stormy weather.<br />
In combination with warning services, the building<br />
design of f infrastructures and public awareness have<br />
greatly reduced the threat posed by tropical cyclones<br />
with respect to loss of f life (see Figure 8.12). HK9<br />
H O N G K O N G 111
Number of death<br />
Year<br />
200<br />
180<br />
160<br />
140<br />
120<br />
100<br />
80<br />
60<br />
40<br />
20<br />
0<br />
1960 1965 1970 1975 1980 1985 1990 1995 2000 2005<br />
Figure 8.12 The total number of deaths and missing people reported during tropical cyclone events in Hong Kong from 1960 to 2006. HK14<br />
Types of Drainage Recurrence interval fl ooding prevention (years)<br />
Urban drainage trunk systems 200<br />
Urban drainage branch systems 50<br />
Main rural catchment drainage channels 50<br />
Village drainage 10<br />
Intensively used agricultural land 2-5<br />
Table 8.13. Average recurrence interval of fl ooding prevention in Hong Kong drainage systems. HK9 These are based on land use type, economic<br />
growth, socioeconomic needs, consequences of fl ooding, and cost-benefi t analysis of fl ood mitigation measures.
Reducing resource dependency<br />
In light of its resource dependency, Hong Kong has<br />
also initiated a demand management strategy to<br />
reduce its water and energy usage. The city set a<br />
target of a 25 percent reduction in energy use by<br />
2030 (compared to 2005 levels). Public education<br />
campaigns focusing on water conservation have been<br />
launched. School programmes are being enhanced<br />
with the launch of the ‘Water Conservation Starts from<br />
Home’ campaign. HK15<br />
<strong>Climate</strong> change impact assessment<br />
The Environmental Protection Department started a<br />
comprehensive study in 2008, to conduct an overarching<br />
and up-to-date study to assess the impact<br />
of climate change on Hong Kong. The study reviews<br />
and updates the inventories of greenhouse gas<br />
emissions in Hong Kong; projects local emission trends<br />
under diff erent scenarios; characterizes the impacts<br />
of climate change on Hong Kong; recommends<br />
additional policies and measures to reduce<br />
greenhouse gas emissions and facilitate adaptation to<br />
climate change; and assesses the cost-eff ectiveness of<br />
the proposed measures.<br />
The study’s aim is to provide a solid scientifi c basis for<br />
the government to formulate long-term strategies and<br />
measures for Hong Kong for climate change mitigation<br />
and adaptation. It will also provide useful information<br />
for preparing a submission to the Central People’s<br />
Government to meet the national obligations under<br />
the United Nations Framework Convention on <strong>Climate</strong><br />
HK17, HK18<br />
Change.<br />
<strong>Climate</strong> change governance<br />
in <strong>Delta</strong> Metropolises<br />
July 2010<br />
In July 2010 a two day workshop was held at the<br />
City University of Hong Kong to discuss climate<br />
change governance in <strong>Delta</strong> Metropolises.<br />
Scholars from diff erent research institutes and<br />
universities in the Netherlands, the UK and<br />
Hong Kong gathered to exchange research on<br />
issues related to networking and climate change<br />
adaptation governance.<br />
Figure 8.14 Workshop in <strong>Delta</strong> Metropolises. HK1<br />
H O N G K O N G 113
Tokyo<br />
9
9<br />
1<br />
Introduction<br />
The Japanese settled in alluvial plains,<br />
formed by fl oods, where river water was<br />
easily available for irrigation. Due to the<br />
natural environment of Japan and the<br />
human interventions, the country’s fl ood<br />
plains are nowadays densely populated.<br />
One side-eff ect of living in these alluvial<br />
plains is the constant threat of fl ooding.<br />
Nowadays, the fl ood plains cover less than<br />
10 percent of Japan, but contain 51 percent<br />
of the population and 75 percent of the<br />
country’s assets. T1<br />
Japan consists of many islands and more<br />
than 70 percent of the country is covered<br />
with mountains. T2 Around 65 percent of the<br />
country has slopes steeper than 14 percent.<br />
Japan is subjected to earthquakes which<br />
do not only cause massive destruction<br />
within cities, but can also damage the fl ood<br />
protection structures or can even cause<br />
dike breaches. The Great Kanto earthquake<br />
of 1923, for example, caused a series of<br />
broken and cracked embankments along<br />
the Arakawa fl oodway in Tokyo Metropolis<br />
at 28 locations. T3<br />
T O K Y O 115
“A superr levee is an innovative technology, which brings<br />
nott onlyy<br />
fl oodd<br />
controll<br />
measures andd a human-friendly<br />
environment, butt also an effective ff impactt against<br />
globall warming. Itt cools down the temperature off the<br />
land d along the river. The gentle slope off the superr levee<br />
does not t preventt<br />
circulation off cooll<br />
airr<br />
on the river<br />
water r surface to the landside.”<br />
Yoshito Kikumori<br />
Chief, <strong>Climate</strong> Change Research Section, River<br />
Division, National l Institute for r Land d and d Infrastructure<br />
Management, Ministry y of f Land, Infrastructure, Transport<br />
andd Tourism, Japan<br />
“The challenges Japan faces and d the concrete<br />
achievements Japan makes mayy be an interesting<br />
example forr other r countries. International l exchange in<br />
the fi eldd<br />
of f urban storm water r managementt<br />
is increasing<br />
in importance. Itt seems likely y thatt<br />
recentt<br />
changes in<br />
storm water r managementt<br />
came about t due to increased<br />
international l awareness off global l environmental l issues.<br />
The Japanese way y is not t only y applicable in Japan, but<br />
could d be a leading example forr otherr<br />
countries off the<br />
world.”<br />
Professorr Shoichii<br />
Fujita<br />
Departmentt off<br />
Civil l andd<br />
Environmentall<br />
Engineering,<br />
Nagaoka Universityy off<br />
Technology<br />
Tokyo Engineering Consultants (TEC)
9<br />
2<br />
Present<br />
situation<br />
Tokyo is the capital off Japan and was founded in the<br />
Kanto region of f Central Honshu, next to Tokyo Bay. In<br />
this region only a small amount of f suitable land was<br />
available: a small area of f fl at land between the low hills<br />
off the Musashino Plain and the marshy shore of f the<br />
bay. T5 Tokyo is located at the mouth off three domestic<br />
large rivers: the Sumida River (nr. 1 in Figure 9.1), the<br />
Ara River (nr. 2 in Figure 9.1) and the Edo River (nr.<br />
3 in Figure 9.1). The Sumida River flows fl through the<br />
centre of f the Metropolis and is integrated in theurban<br />
pattern of f the city. The Edo River and the Ara River<br />
are located in the outer districts off Tokyo. Figure 9.2<br />
shows that large parts of f Tokyo are located below the<br />
flood fl level off its main rivers. T6 These areas are former<br />
plains, that were formed when sediment was dumped<br />
by rivers. By restricting the river course no new<br />
sediment is carried into these regions, thus creating<br />
T4 Figure 9.1 Map of f Tokyo (nr. 1 Sumida river; nr. 2 Ara river;<br />
nr. 3 Edo river).<br />
T O K Y O 117
a height difference. ff And also ground subsidence due<br />
to groundwater pumping and sediment deposition in<br />
river channel has a great impact. Japanese rivers are<br />
short, steep and flow fl rapidly down the mountains,<br />
across the plains and into the Pacific fi Ocean, the Sea of<br />
Japan or the Seto Inland Sea. T7 They are fed by rain. The<br />
ratio between normal flow fl volume and that during a<br />
storm is extremely great with the maximum discharge<br />
is around 100 times as much as minimum discharge.<br />
Heavy rainfall, in combination with steep slopes,<br />
gives short flood fl pulses off less than two days in the<br />
downstream river sections such as Tokyo Metropolis.<br />
Many urban rivers in Tokyo help to drain the city from<br />
floods fl caused by excessive rainfall. These urban rivers<br />
are a ralued asset off this historic low-lying city T5 .<br />
The population figure fi of f Japan increased from<br />
84 million in the 150s to nearly 128 million in 2009. T8<br />
The proportion of f people working in the primary<br />
industries such as, agriculture, forestry and fishing, fi<br />
fell over from more than 50 percent at the end of<br />
the Second World War to 17 percent in 1970. T9 More<br />
than 50 percent off the population and more than<br />
70 percent of f the nation’s assets are concentrated in<br />
the flood fl plains. T1 About 80 percent of f the villages<br />
and cities have to deal with water damage caused by<br />
fl oods. Today, next to the United States and China,<br />
Japan produces the third highest Gross Domestic<br />
Product (GDP) in the world. This makes Japan one of<br />
h lhi i h l I 2007 h<br />
Figure 9.2.<br />
Figure 9.3 High rise at the river shores of f the Sumida river.<br />
Looking at Tokyo, in 1940 the metropolitan area of<br />
Tokyo counted about 7.4 million inhabitants; this<br />
fi figure has increased since then to approximately<br />
12.8 million inhabitants in 2008 T8 .This is about 10%<br />
of f Japan’s total population. The average population<br />
density for the entire metropolis is about 5,750<br />
people per km2 . Tokyo has a large amount of f assets<br />
(Figure 9.3), economic value and a highly developed<br />
network k of f infrastructure. Tokyo has an extensive<br />
subway system. The introduction of f underground<br />
h i ll h l d i h
9<br />
3<br />
<strong>Climate</strong> and<br />
fl ood risks<br />
Japan is situated in the East Asian Monsoon region<br />
and has a warm and humid climate. T2 Mean annual<br />
precipitation in Japan is approximately 1.800 mm,<br />
high in some areas experiencing precipitation of f up<br />
to 3.000 mm. T6 Heavy precipitation takes place during<br />
the rainy season in June and July, during the typhoon<br />
season with typhoons originating from the South<br />
Pacific fi in September and October, and during winter<br />
snowfall in northern Japan. T2 About three typhoons hit<br />
the country directly each year. Heavy rain often leads<br />
to flooding fl off streets and causes a serious thread for<br />
flooding fl due to overflow fl of f river water.<br />
Winter precipitation is likely to increase in East Asia<br />
and summer precipitation is likely to increase as well.<br />
Additionally, an increase in the frequency of f intense<br />
precipitation events in East Asia is very likely. Extreme<br />
rainfall and winds associated with tropical cyclones are<br />
likely to increase in East Asia. Sea level is expected to<br />
rise at the end of f this century (2090–2099) by 0.35 m<br />
(0.23 to 0.47 m) Due to ocean density and circulation<br />
changes, the distribution of f sea level rise will not<br />
be uniform. Large deviations among models make<br />
estimates off distribution across the Caribbean Sea and<br />
the Indian and Pacific fi Oceans uncertain. T10<br />
Eff ff ect off fl flooding in highly urbanized Tokyo<br />
In response to the growing demand for housing<br />
in Tokyo Metropolis city’s the residential areas<br />
are expanding towards the less-elevated western<br />
region and the fl ood prone eastern area. The result<br />
is noticeable in the Naka river basin and the Ayase<br />
river basin. Here, urbanized zones have expended<br />
enormously from 11 percent in 1965 to 43 percent in<br />
T O K Y O 119
Figure 9.4 Flood gate.
Figure 9.5 Shibuya district in Tokyo.<br />
1995. T11 The original inhabitants off fl atland areas knew,<br />
for many generations, which areas the rivers would<br />
flood fl the hinterland during extreme discharges and<br />
where itwas relatively save to live. Damage caused by<br />
inundation to the newly build houses in these areas<br />
isnot compensated by the Japanese government.<br />
Still, flood fl prone land is cheap so many new houses<br />
are built in these areas and only a few houses are<br />
constructed in a climate proof f manner.<br />
Figure 9.3 and 9.5 shows that rapid urbanization in<br />
Tokyo Metropolis has reduced the function off forests<br />
and paddy fi fields retention for storm water. T12 Space<br />
was scarce, so ponds were used to construct buildings<br />
and infrastructure. Many areas were no longer used<br />
for storage of f storm water. Furthermore, the increase<br />
in impervious earth cover, such as asphalt, concrete<br />
covering and storm sewers, accelerated storm<br />
water runoff. ff The fl flood frequency on the streets has<br />
increased in the newly developed urbanized areas.This<br />
has become a major urban problem since the 1960s. T13<br />
The total of f urban fl flood disasters has increased<br />
signifi fi cantly. On the riverbanks off the lower Ara River<br />
inTokyo a very dense concentration of f population and<br />
property can be observed. The average population<br />
density for the entire Arakawa basin counts 3,400<br />
people per square kilometer. Some areas even reach a<br />
density of f 9,200 people per square kilometre where a<br />
tremendous amount of f private assets as well as public<br />
functions are concentrated. T3 Thus, embankment<br />
failure is bound to cause widespread flooding fl and<br />
tremendous damage in the Metropolis.<br />
T O K Y O 121
Figure 9.6 Super levee along the Ara river in Tokyo.
9<br />
4<br />
<strong>Climate</strong><br />
adaptation<br />
Next to conventional measures like fl ood walls, several<br />
adaptive measures exist in Tokyo against river floods fl<br />
and ponds against storm water fl oods are used to<br />
cope with climate change. Examples of f such measures<br />
are the super levee and multipurpose storage basin<br />
against river fl floods, impermeable pavements against<br />
storm water fl oods and a mobile evacuation system<br />
against fl<br />
oods.<br />
The super levee a multifunctional flood fl defence<br />
In 1987, the Japanese government adopted a policy<br />
for protection from extreme fl floods exceeding the<br />
design levels of f regular fl ood protection measures<br />
applicable to highly urbanized areas. T14 Due to the<br />
expected changes in peak k discharge and frequency<br />
due to climate change, such extreme floods fl are likely<br />
to occur on a more frequent basis in the future.<br />
The concept off a super levee is designed especially<br />
for extreme events in dense urban areas, such as<br />
Tokyo Metropolis. A super levee is a wide river<br />
embankment with a broad width which can withstand<br />
even overfl fl ow, so that destruction can be prevented<br />
(for principles see Figure 9.7). Main difference ff to a<br />
conventional dike is the width; a super levee has a<br />
T3 mild slope off 1:30. In other words, a super levee<br />
with a height of f 10 meters will have a width of f about<br />
300 meters. A super levee allows for overtopping as<br />
it is resistant to overfl fl ow, seepage and earthquakes,<br />
which isone off the main reasons for its construction. T3<br />
Super levee projects are always implemented in<br />
conjunction with urban redevelopment, land rezoning<br />
projects or other urban planning. Super levees enable<br />
multifunctional structures which incorporate both<br />
Emergency Sleep slope prevents View Blocked by Dense Residential/<br />
p earthquake damage<br />
Figure 9.7 Principles off a super levee.<br />
T O K Y O 123
the needs of fl ood control and the interests of the<br />
inhabitants. T14 It provides usable land and space for<br />
dwellings. T3 This will lead to an added urban value of<br />
the region through the restored accessibility of the river.<br />
The steep slope of a conventional dike prevents easy<br />
river access. T3 The outer slope of a super levee is gentler<br />
than the outer slope of conventional dike. Moreover, the<br />
gentle inner slope, in combination open recreational<br />
spaces at crest level provides an open view towards the<br />
river. T11 Super levees can be found along the Ara River<br />
and Sumida River in Tokyo. The super levee along the<br />
Ara River (Figure 9.6) combines a very broad dike with a<br />
park and a small amount of high rise whereas the super<br />
levee along the Sumida River combines a broad dike<br />
– fl ood wall with a promenade and a large amount of<br />
high rise.<br />
Multipurpose water storage facility<br />
The Tsurumi multipurpose detention basin is a good<br />
example of a multipurpose river water storage facility.<br />
The Tsurumi River is an urban river with a length of<br />
42.5 km and a catchment area of 235 km 2 , T12 and is<br />
located in the central part of Tokyo Metropolis, close<br />
to Yokohama and in short distance of Tokyo centre.<br />
Until the 1960s most of the basin was covered with<br />
forest and agriculture fi elds, but has been transformed<br />
into a large dwelling district. The percentage of<br />
urbanization has increased from 20 percent to 80<br />
percent in only 40 years T12 . Storm water run off<br />
accelerated due to the increase of paved areas and<br />
the peak discharge has nearly doubled since the early<br />
1960s. Therefore, the Tokyo Metropolitan Government<br />
and the city of Yokohama produced a master plan for<br />
an overfl ow location with multifunctional facilities for<br />
dealing with the peak discharge of the Tsurumi River.<br />
The detention basin is designed to ensure a safety from<br />
a 150-year fl ood. The basin is excavated deeper than<br />
the surrounding grounds and has a storage capacity<br />
of 3.9 million m 3 . In addition to fl ood control, the basin<br />
serves multiple purposes. It contains a sports venue, a<br />
recreation area and a park for local residents. T15 Most<br />
prominent is the International Stadium Yokohama.<br />
This structure has been built on a high foundation to<br />
prevent damage during inundation of the detention<br />
basis. The primary roads inside the basin are constructed<br />
along embankments or are elevated. T15 The Tsurumi<br />
multipurpose detention basis demonstrates that<br />
combining water storage and urban activities is a<br />
feasible solution in urban areas to cope with increasing<br />
river levels and increasing frequencies of peak<br />
discharges. It is therefore a promising solution to cope<br />
with climate change in fl ood endangered urbanized<br />
regions such as Tokyo metropolis.<br />
Permeable pavements as innovative measure<br />
against storm water<br />
Urbanization has resulted in an expansion of<br />
impermeable areas such as roofs and pavements. T16<br />
In Tokyo for instance, the runoff coeffi cient increased<br />
from approximately 0.3 in the beginning of the<br />
Twentieth Century towards 0.8 in 1994. T16, T17 A solution<br />
which enables further urbanization and is suitable to<br />
cope with climate change is the use of a permeable<br />
pavement. Nowadays, this solution is widely used in<br />
Japan. The permeable pavement is one of the structures<br />
within the Experimental Sewer System (ESS). ESS is a<br />
new sewer system which is capable of controlling storm<br />
water runoff by adding infi ltration and storage facilities<br />
to the conventional combined sewer system. T18<br />
This system reduces runoff thus causing less threat of<br />
river fl oods. Additionally, it reduces the frequency and<br />
quantity of overfl ow from the combined sewer system.
Figure 9.8 Permeable pavement in a residential area in Tokyo. T19<br />
Also, the ground waterlevelis restored and ground<br />
water pollution is reduced by the separation of f storm<br />
water and waste water. It prevents contamination of<br />
receiving waters. T18<br />
Figure 9.7 shows an example of f permeable asphalt in a<br />
residential area. Permeable asphalt has many voids in<br />
which storm water is infi fi ltrated directly. Unfortunately,<br />
it has less strength than ordinary asphalt so the<br />
application is limited to sidewalks, parking lots and small<br />
roads with a width off no more than 5 meter. T18, T20 Porous<br />
concrete blocks are mostly used for the construction<br />
of f permeable road surfaces. Due to the high void ratio,<br />
the infiltration fi rate is similar to the rateof f permeable<br />
asphalt pavement. T18 Special attention is needed on<br />
maintenance of f the permeable asphalt pavements.<br />
They are easily clogged by soil particles and debris.<br />
The pavements can be sufficiently ffi cleaned with high<br />
pressured water. This method restores the pavement<br />
with its original infi filtration capacity. A shortcoming is<br />
however that muddy water fl ows into the sewer system.<br />
T20 Until 1992, the Tokyo Metropolitan Government has<br />
already built about 494,000 m2 of f permeable pavements<br />
which is about 2.3 percent of f the total street area. T18<br />
Experience in damage mitigation measures<br />
Next to structuralmeasures which reduce the<br />
probability of f a flood fl event, in Tokyo, damage mitigation<br />
measures are used to reduce the consequences of f a<br />
fl ood event. One off the damage mitigation measures to<br />
cope with fl oods is the establishment of f a warning and<br />
evacuation system. Display panels throughout the city<br />
and in front of f railway, bus and metro stations provide<br />
information to local residents about emergencies like<br />
fl oods and earthquakes. At home, people are informed<br />
through television with special broadcasts and through<br />
websites to inform local residents about the current<br />
state of f the rivers. Furthermore, live images of f the river<br />
and charts of f the amount of f precipitation and water<br />
level are disseminated viathe Internet. T3 Additionally,<br />
the Internet can be used by local residents to state their<br />
position during a fl flood event. People throughout Japan<br />
can access the website to check k if f their relatives or<br />
friends are unharmed. T3 Another way to inform people<br />
about fl ood conditions is through their cell phones. This<br />
system allows users to automatically receive disaster<br />
prevention information if f they register for this service in<br />
advance. T3 In case off a flood fl hazard, the standby screen<br />
transforms into the emergency screen and provides<br />
the user with information about water levelsand<br />
meteorological information during flood fl conditions.<br />
This service has been tested in 2004, and is currently<br />
operational.<br />
T O K Y O 125
10<br />
Ho Chi Minh City<br />
by Philip Bubeck and Ho Long Phi
10<br />
1<br />
Introduction<br />
Ho Chi Minh City (HCMC), located in the<br />
delta area of the Saigon and Dong Nai rivers<br />
is Vietnam’s largest city and an important<br />
economic, trade, cultural and research<br />
centre of the country. With its seaport lying<br />
at an important intersection of international<br />
maritime routes, HCMC is situated at<br />
the heart of South-East Asia and has<br />
become a traffi c hub for the region and an<br />
international gateway.<br />
As Ho Chi Minh City continues to grow, more<br />
and more urban areas and infrastructures<br />
are developed in low-lying areas vulnerable<br />
to the eff ects of climate change. The<br />
authorities of HCMC have recognized the<br />
importance to undertake accompanying<br />
adaptation measures and to consider<br />
climate change in the city’s planning<br />
process.<br />
Figure 10.1 Map off HCMC.<br />
O C H I M I N H C I T Y 127
“As a fast-growing delta city, Ho Chi Minh City<br />
recognizes the importance to integrate climate change<br />
mitigation and adaptation into the city’s policies. With<br />
the Ho Chi Minh City <strong>Climate</strong> Change Steering Board,<br />
we have therefore established an organization that<br />
will coordinate all activities related to climate change<br />
of the city. Being an active member of the C40, Ho Chi<br />
Minh City has also intensifi ed its cooperation with our<br />
international partners to jointly address the challenges<br />
of future climate change.”<br />
Mister Le Hoang Quan,<br />
Chairman, Ho Chi Minh City People’s Committee<br />
“<strong>Climate</strong> change and especially sea level rise is a major<br />
challenge for the delta and the coastal areas around the<br />
globe. HCMC can be regarded as a typical example in this<br />
regard. As <strong>Climate</strong> Change Steering Board, we must focus<br />
on policies to respond to climate change appropriately<br />
and eff ectively to work towards sustainable development.<br />
Simultaneously, this challenge should be regarded as an<br />
opportunity for development, especially for maritime and<br />
seaport economic activities.”<br />
Mr. Dao Anh Kiet,<br />
Vice Chairman of HCMC <strong>Climate</strong> Change Steering Board
10<br />
2<br />
Present<br />
situation<br />
HCMC has a diversified fi topography, ranging from<br />
mainly agricultural and rural areas in the north to<br />
a widespread system of f rivers, canals and dense<br />
mangrove forest to the south. The urban areas are<br />
located approximately 50 km inland from the Pacific fi<br />
Ocean (also called East Sea by Vietnam) at the banks of<br />
the Saigon River (Figure 10.1). Early settlements date<br />
back k to the 17th century and were developed close to<br />
the Saigon River on slightly higher grounds and thus<br />
very favorable areas.<br />
Similar to other evolving mega-cities in South-East<br />
Asia, Ho Chi Minh City has experienced rapid changes<br />
in recent decades, especially after the introduction of<br />
economic reforms in the mid 1980s. Within the last<br />
20 years, the city’s population has more than doubled<br />
from 3.9 million in 1989 to approximately 8 million<br />
inhabitants in 2010. H1 The regional economy has<br />
continuously grown with double-digit growth<br />
rates and its economic importance for the country<br />
in general and the southern region in particular is<br />
exemplified fi by the fact that HCMC contributes nearly<br />
30 percent to the national GDP and received 37<br />
percent off total foreign direct investments in 2009. H1<br />
In addition to a substantial increase in population<br />
density, HCMC’s rapid growth has resulted in a<br />
considerable expansion of f urban areas into the<br />
adjacent rural areas. Within the last twenty years only,<br />
the extent of f urban surfaces has doubled H2 and many<br />
of f the new urban areas have been developed on lowlying<br />
marsh land (Figure 10.2). Today, approximately<br />
60 percent of f the urban area is located less than<br />
1.5 m above sea level, making it highly vulnerable to<br />
projected sea-level rise.<br />
Figure 10.2 Spatial Development Master Plan Map of f HCMC.<br />
H O C H I M I N H C I T Y 129
In the coming decades, HCMC is projected to grow<br />
continuously.Even thoughnatural population growth<br />
could be slowed down due to reduced birth rates,<br />
HCMC keeps attracting migrants from all over Vietnam<br />
due to its economic status and could reach up to 10 to<br />
12 million inhabitants in 2025. H3 A particular dynamic<br />
could unfold from potential impacts off sea-level rise<br />
that could lead to a large infl flux of f migrants from the<br />
low-lying Mekong <strong>Delta</strong> to the city in search for labor<br />
and better living conditions. According to the Spatial<br />
Development Master Plan up to 2025 of f HCMC, many<br />
off the new urban areas will be further developed<br />
into the low-lying marshlands exemplifying the need<br />
to take accompanying climate change adaptation<br />
measures (Figure 10.3).<br />
Figure 10.3 IS distribution from satellite images. H2
10<br />
��������<br />
����<br />
3<br />
���<br />
���<br />
���<br />
���<br />
���<br />
��<br />
��<br />
��<br />
��<br />
�<br />
<strong>Climate</strong> and<br />
fl ood risks<br />
HCMC is characterized by a tropical monsoonal climate<br />
with two distinct seasons: a rainy season lasting from<br />
May to November and a dry season from December<br />
to April. The mean annual temperature is 27.4 degrees<br />
with an average humidity of f about 77 percent.<br />
Average annual rainfall is about 2100 mm off which<br />
about 90 percent falls during the rainy season. H4<br />
During recent decades, changes in the regional<br />
climate have already been observed. Average annual<br />
temperature has increased by 0.6 degrees during the<br />
last seven decades from 26.8 degrees for the period<br />
1931-1940 to 27.4 degrees for the period 2000-2007.<br />
While the annual volume of f rainfall has remained<br />
Figure 10.4 Yearly maximum rainfall events at Tan Son Hoa Station<br />
(located close to Tan Son Nhat Airport of f HCMC, which lies about 7 km<br />
to the north from the city centre).<br />
� � ������ � ������<br />
���� ���� ���� ���� ���� ���� ����<br />
H O C H I M I N H C I T Y 131
Period 1952-1961 1962-1971 1972-1981 1982-1991 1992-2002 2003-2009<br />
Counts 0 1 2 2 4 8<br />
Table 10.5 Count of f rainfall events larger than 100 mm. *7-year period<br />
fairly stable in southern Vietnam, the number of f heavy<br />
rainfall events has increased remarkably (Figure 10.4<br />
and Table 10.5). The increase of f heavy rainfall events<br />
coincides with the rapid urbanization process in the<br />
last 20 years and has been attributed to the so-called<br />
H5<br />
urban heat island effect. ff<br />
The sea level has risen by 20 cm in the last 50 years<br />
and with a rate of f about 3 mm per year during the<br />
period 1993 and 2008. H6, H7 Water levels at river stations<br />
in and around HCMC have shown a notable upward<br />
trend with an average increase of f 1.5 cm per year since<br />
1990. So far, the observed raise of f river water levels<br />
in and around HCMC and the resulting increase in<br />
fl ood risk k has been mainly attributed to the profound<br />
changes that occurred in the catchment during<br />
the development and urbanization process, which<br />
seriously impacted the hydrological characteristics<br />
off the basin. H5 Statistical data show that 14.420 ha of<br />
agricultural areas, wetlands and water bodies have<br />
been sealed during 1997-2006. H3 At the same time,<br />
land subsidence has been observed in several locations<br />
in the city that has been attributed mainly to ground<br />
water extraction and overburden pressure of f high-rise<br />
buildings.<br />
The observed climatic trends are projected to continue<br />
under climate change. Annual mean temperature<br />
could rise by 1 degree in 2050 and up to 2.9 degrees<br />
by the end of f this century. H6 While annual rainfall is<br />
projected to remain fairly stable with an increase of<br />
about 1 percent to 1.9 percent by the year 2100, there<br />
are considerable seasonal changes foreseen. Rainfall<br />
is projected to decrease by 9.4 percent-18.2 percent<br />
in the dry-season months from March to May but<br />
expected to increase by 8.5 percent to 16.5 percent in<br />
the rainy-season months fromSeptember to November<br />
leading to a higher risk k off<br />
both floods fl and droughts.<br />
Sea level is projected to rise between 28 cm to 33 cm in<br />
2050 and between 65 cm to 100 cm in 2100, H6 posing a<br />
major challenge to low-lying HCMC.<br />
H5<br />
Figure 10.6 Hydraulic Modeling Scheme of f HCMC.<br />
�������� �����<br />
�������� �����<br />
����� ������ ���<br />
��� ����� ����<br />
�������� �����<br />
����� ����
����� ������<br />
Figure 10.7 Count of f fl ood events in HCMC.<br />
Flood risk<br />
Urban flooding fl has become a wide-spread<br />
phenomenon and a major concern in Ho Chi Minh<br />
City in recent years that has been accompanying the<br />
city’s rapid growth. Especially since the beginning<br />
of f the 1990s the amount of f fl ooded locations, fl flood<br />
frequencies and flood fl duration has steadily increased<br />
and has caused substantial economicand social<br />
losses, H5 such as damage to infrastructure and assets,<br />
water pollution as well as traffic ffi jams.<br />
HCMC faces fl ood risk k from several sources or<br />
combinations of f these. An overview of f the hydrological<br />
scheme off HCMC is provided in Figure 10.6. Dots<br />
represent nodal points of f the hydraulic model and the<br />
red circle the projected urban extension according to<br />
the General Development Plan of f HCMC until 2025. H3<br />
����� �� ����� ������<br />
���� ���� ���� ���� ���� ���� ����<br />
�� ��<br />
�� ��<br />
�� ��<br />
�� ��<br />
��<br />
��<br />
��<br />
��<br />
��<br />
����<br />
����� �� ��������<br />
����� ����<br />
������ � �� ��<br />
������� ��������� �������� ��������� ��������� � � �� ��<br />
First, low-lying areas to the south of f the city are<br />
impacted by tidal peaks, which are projected to<br />
in-crease under climate changes. According to the<br />
Urban Drainage Authority of f HCMC, about 20 sites are<br />
currently inundated on a monthly basis as a result of<br />
high tides. Second, frequent flooding fl results from a<br />
combination of f heavy rainfall events and an insufficient ffi<br />
drainage system. The Urban Drainage Authority of<br />
HCMC reported more than 100 seriously fl flooded<br />
locations after a heavy rainfall event of f 127 mm on<br />
May 16th , 2004. Many of f these locations are subject<br />
to frequent fl ooding even with muchlower rainfall<br />
intensity (Figure 10.7). Since early 2000 the urban<br />
drainage system of f HCMC’s central districts has been<br />
upgraded as part of f a fl flood controlproject. This has<br />
resulted in a decrease of f fl ood events in the central<br />
areas (Figure 10.7).<br />
H O C H I M I N H C I T Y 133
Figure 10.8 Flooding in Ho Chi Minh City.<br />
At the same time, flooding fl sharply increased in newly<br />
developed districts showing the negative impacts of<br />
urbanization on the fl flooding situation inHCMC.<br />
Third,HCMC is prone to river fl ooding, which also affects ff<br />
the upstream areas that are situated on slightly higher<br />
grounds. Theraising river water levels have worsened<br />
this problem. In addition, HCMC also faces flood fl risk k from<br />
upstream reservoirs. Heavy rains, accompanying tropical<br />
cyclones or typhoons, often not only affect ff HCMC but<br />
the whole Dong Nai river basin. In such a situation, extra<br />
amounts of f water are often released from upstream<br />
reservoirs at times when tides reach their annual peaks<br />
inOctober and November, causing even more severe<br />
problems for the urban drainage system. H5<br />
The observed increase in fl ood risk k in HCMC is thus a<br />
consequence off both climate and non climate related<br />
factors among which the rising river water levels, rapid<br />
and uncontrolled urbanization, land subsidence and the<br />
increase in heavy rainfall events have been identified fi as<br />
the most direct ones. H5 Given its distinct topographical<br />
location in the low-lying delta area as well as the<br />
projected changes in climate and urban expansion,<br />
flood fl risk k is expected to further increase, putting a<br />
major pressure on the city’s development. Assuming a<br />
sea-level rise off approximately 25 cm, up to 71 percent<br />
of f the area of f HCMC could be affected ff by an extreme<br />
flood fl event in 2050 iff no additional measures are taken.<br />
Inundation depths and the duration of f fl ood events<br />
would increase considerably, resulting in a growing risk<br />
for life, infrastructure and assets in thecity. H8 As the vast<br />
majority of f the growing population will settle in lowlying<br />
and thus unfavorable areas as shown in Figure<br />
10.3,millions of f people could beatrisk k off<br />
fl flooding.<br />
Figure 10.9 Flooding inHo Chi Minh City.
10<br />
4<br />
<strong>Climate</strong><br />
adaptation<br />
HCMC faces major challenges in terms of f infrastructure<br />
development, public transport, flood fl prevention<br />
and the provision of f other public services due to<br />
its ongoing rapid growth.These challenges will be<br />
amplified fi given the projected changes in climate.<br />
Vietnam in general, and HCMC in particular have been<br />
identified fi as one of f the most severely affected ff places<br />
by future climate change and especially sea level<br />
rise. H9, H10 In order to address these challenges Vietnam<br />
has adopted a National Target Programme to Respond<br />
to <strong>Climate</strong> Change (NTP) in December 2008. H7 As<br />
part off this NTP, HCMC along with other provinces in<br />
Vietnam is currently developing an Action Plan on<br />
<strong>Climate</strong> Change that shall define fi adaptive responses<br />
to safeguard the city’s development. In this context,<br />
further research is currently undertaken examining<br />
the effects ff off climate change on HCMC to arrive at<br />
sustainable solutions. Existing policies and strategic<br />
documents, such as the Socioeconomic Development<br />
Plan for 2025 are currently revised and updated<br />
to integrate climate change adaptation into the<br />
planning process. In order to coordinate and integrate<br />
all activities related to climate change, HCMC has<br />
established the so-called Ho Chi Minh City <strong>Climate</strong><br />
Change Steering Board.<br />
At the same time, HCMC is enhancing domestic<br />
and international training for its staff ff members on<br />
climate change and adaptation to improve the city’s<br />
management capacity. In May 2010, the ARUP-C40<br />
<strong>Climate</strong> Change workshop was held in HCMC, covering<br />
aspects of f water resource management under climate<br />
change, including urban flooding, fl groundwater<br />
depletion and water salinity (Figure 10.10).<br />
Figure 10.10 ARUP-C40 <strong>Climate</strong> Change Workshop inHCMC.<br />
H O C H I M I N H C I T Y 135
Along with institutional arrangements, HCMC is<br />
undertaking and planning concrete measures to adapt<br />
to climate change. In order to reduce the vulnerability<br />
off future urban areas, which will be mainly developed<br />
on low-lying marshlands, a policy has been decreed<br />
in 2008 that requires all new developments to be<br />
elevated 2 m to 2.5 m above mean sea level. To protect<br />
the city from rising sea water levels, a MasterPlan of<br />
Tide Control forHCMC has been approved by the Prime<br />
Minister in 2008 that proposes to build a polder system<br />
around HCMC (Figure 10.11). Almost 200 km of f dikes<br />
and hundreds of f tidal gates would be constructed. As<br />
the project is not yet implemented, the effects ff of f such<br />
a polder system are currently studied in detail and<br />
concerns regarding ecological aspects, city planning<br />
and the timing have been raised.<br />
Figure 10.11 MasterPlan of f Tide Control forHCMC.
Ho Chi Minh City Moving Towards the Sea with <strong>Climate</strong> Change Adaptation<br />
HCMC’s sea-harbour, being located in the central<br />
districts on the banks of the Saigon River is<br />
economically crucial for Southern Vietnam in<br />
general and HCMC in particular. To ensure further<br />
harbour and economic developments one has to<br />
create room for urban planning in central districts,<br />
HCMC currently plans to move its harbour facilities<br />
southwards towards the sea. As such, a shift into<br />
low-lying areas also means that vital infrastructure<br />
of the city will be moved to areas highly vulnerable<br />
to climate change and especially sea-level rise,<br />
HCMC recognizes the importance to climate-proof<br />
these activities.<br />
Similar developments are currently implemented<br />
by the city of <strong>Rotterdam</strong> that already shifts<br />
its harbour facilities toward the sea. To share<br />
respective knowledge and experiences regarding<br />
Figure 10.12 Consultations: HCMC Moving towards the Sea with <strong>Climate</strong> Change Adaptation, June 2010.<br />
both technical aspects but also institutional<br />
processes, the two cities are currently engaging in<br />
a strategic partnership as part of the <strong>Connecting</strong><br />
<strong>Delta</strong> <strong>Cities</strong> <strong>Initiative</strong>. The partnership shall also<br />
address other aspects of climate-proofi ng urban<br />
(re-) development.<br />
On June 14 th and 15th 2010, representatives from<br />
both cities met in HCMC together with a wide<br />
range of stakeholders from the private sector,<br />
knowledge institutes and national and local public<br />
authorities to explore needs and opportunities for<br />
further cooperation. The workshop resulted in an<br />
agreement on the key issues and next steps to be<br />
taken by HCMC and <strong>Rotterdam</strong>. This cooperation<br />
is part of a wider Strategic Partnership Agreement<br />
(SPA) between Vietnam and the Netherlands.<br />
H O C H I M I N H C I T Y 137
Conclusions on best<br />
CDC practices<br />
11<br />
by Piet Dircke, Arnoud Molenaar and Jeroen Aerts
11<br />
1<br />
Introduction<br />
“<strong>Climate</strong> change adaptation will l be one off the major<br />
challenges forr delta cities this century. Coastall cities need<br />
a holistic c approach for r theirr<br />
adaptation strategies and<br />
leadership to get t this implemented d andd<br />
to keep it t on the<br />
agenda. Internationall knowledge exchange is crucial. We<br />
willl have to act t now. Think k global, actt local, CDC C delta<br />
cities willl bring it t into practice.”<br />
Arnoud d Molenaar,<br />
Programme Manager r <strong>Rotterdam</strong> <strong>Climate</strong> Proof,<br />
<strong>Climate</strong> Office, ffi City y off<br />
<strong>Rotterdam</strong><br />
<strong>Delta</strong> cities are increasingly keen to share<br />
their experiences and knowledge with<br />
the CDC network. In addition to CDC,<br />
other networks and initiatives on climate<br />
adaptation in cities and deltas have<br />
emerged, demonstrating a growing interest<br />
in the issue of climate adaptation. There is a<br />
particular interest in climate adaptation best<br />
practices and in the methods for developing,<br />
implement and fi nance those examples.<br />
This chapter provides an overview of some<br />
of the best practices described by the eight<br />
CDC cities in the previous chapters and<br />
provides an outlook on how the CDC<br />
network will proceed.<br />
C D C N E T W O R K I N P R A C T I C E 139
11<br />
2<br />
Best<br />
practices<br />
Urbanplanning and waterfronts<br />
The role of f urban planners in the implementation of<br />
adaptation policies and management is vital for the<br />
successful construction, operation and maintenance<br />
off essential infrastructure and services in coastal<br />
cities impacted by the challenges of f climate change.<br />
Careful urban planning, creative engineering solutions<br />
and effective ff emergency management systems can<br />
substantially reduce the consequences of f climate<br />
change. However, this requires the embedding of<br />
climate change and adaptation considerations and<br />
long-term policymaking into the daily operations of<br />
urban planners and policy makers. It also requires<br />
a flexible fl approach towards newtechnologies and<br />
experiments and the careful review of f legislation and<br />
new urban building codes to ensure that plans are<br />
eff ff ectively implemented to meet new climate-proofi fing<br />
standards. The adaptation planning process also<br />
requires a multidisciplinary systems approach with the<br />
full participation of f stakeholders. If f stakeholders and<br />
the scientists and engineers involved are aware of f the<br />
risks off climate change, it will be much more feasible<br />
to jointly develop a workable adaptation plan for a city.<br />
Coastal cities continue to grow in exposed locations<br />
near and at the coast. Attractive waterfront development<br />
appeals to the desires of f people who can afford ff<br />
to live in vibrant large cities with easy coastal access,<br />
high environmental quality and convenient transportation.<br />
For many others, who are less fortunate, there is<br />
simply no option but to live in a vulnerable locations.<br />
To meet these demands of f living near the waterfront,<br />
both off the wealthy and the poor, new forms of<br />
adaptive planning and architecture are needed to<br />
maintain public safety, to limit the impact of f fl floods<br />
and facilitate large-scale evacuation if f neccessary.<br />
CDC best practices include the PlaNYC in New York,<br />
with a broad scope on city-wide climate adaptation<br />
options, ranging from zoning regulations, fl ood<br />
insurance and raising awareness through active<br />
citizen participation. Well known recent examples of<br />
waterfront developments in New York are Battery Park<br />
and Brooklyn Bridge Park. London has produced a<br />
<strong>Climate</strong> Change Adaptation Strategy with a far reaching<br />
planning horizon and has used a new concept that<br />
identifi es tipping points beyond, which adaptation<br />
options are less eff ective. New Orleans illustrates how to<br />
use a city network to increase its knowledge on climate<br />
adaptation through the Dutch Dialogues, a unique<br />
cooperation between American and Dutch architects<br />
and planners to develop a better urban future through<br />
remarkable best practices.
Finally, seasonalwater storage areas are increasingly<br />
seen to create so-called climate buffer ff areas that<br />
will have the appearence off urban wetlands. These<br />
multipurpose areas may have recreational functions<br />
and contribute to the ecological quality off the city<br />
suburbs. In conjunction with the WWF, <strong>Rotterdam</strong> is<br />
studying the possibilities of f no regrets measures as<br />
part of f the <strong>Rotterdam</strong> Adaptation Strategy. In addition,<br />
Jakarta with its enormous challenges as a mega city is<br />
a showcase for the future for showing how to develop<br />
more open space and green buffer ff zones. Other<br />
examples are the storage reservoirs and permeable<br />
pavements of f Tokyo and the green roofs and the<br />
floating fl pavilions in <strong>Rotterdam</strong>. A good example of<br />
CDC spatial planning practice is the HCMC Master Plan<br />
Polder System.<br />
Coastal protection and restoration<br />
Wetlandsand beaches have a natural buffer ff function<br />
to protect land and people from fl ood risk. However,<br />
due to land use change and coastal erosion, wetlands<br />
are disappearing at a high rate. The United States for<br />
example, continues to lose approximately y 100,000<br />
acres off wetlands each year. However, increasingly<br />
the natural buffer ff function off wetlands and beaches is<br />
acknowledged and projects and protective regulations<br />
are developed to restore wetlands. Furthermore, sand<br />
nourishment projects represent another measure to<br />
mitigate coastal erosion and to provide protection<br />
against storm surges. The required sand is mined from<br />
offshore ff bars, usually y located within several kilometers<br />
off the beach. If f possible, the texture and grain size off the<br />
mined sand is closely y matched with the original beach<br />
sand. Sand nourishment is relativelyy cheap compared<br />
to othermeasures but has onlyy a temporary y effff<br />
ect and<br />
therefore has to be repeated on a regular (annual) basis.<br />
Some of the best CDC practices on wetland restoration<br />
include the Mangrove restoration projects in Ho Chi<br />
Minh City and in Jakarta. Also the Staten Island Bluebell<br />
programme in New York is a successful and recognizable<br />
ecological restoration eff ort.<br />
Dunes, dikes and flood fl walls<br />
For low lying parts off delta cites, in particular those<br />
below sea level, an adequate protection against<br />
flooding fl by dunes, dikes, levees or fl ood walls is<br />
indispensable, though protection strategies may<br />
differ ff from city to city. For instance <strong>Rotterdam</strong> mainly<br />
relies on fl ood measures such as levees and storm<br />
surge barriers. In the United States, the emphasis has<br />
always been more on disaster response and mitigation<br />
measures, while the London approach is a mix of<br />
C D C N E T W O R K I N P R A C T I C E 141
prevention, response and mitigation. Since Hurricane<br />
Katrina, the Netherlands and the US intensively<br />
exchanged knowledge on this topic. The Lessons<br />
Learned from Katrina resulted in a new multiple lines<br />
of f defense strategy in both countries that is more or<br />
less comparable to the strategy in London.<br />
Dunes are a natural system for flood fl defense and<br />
therefore preferable and also often cheaper then<br />
expensive technical flood fl protection works. Their<br />
protection level can be enhanced through vegetation,<br />
sand nourishment of f the beach in front or through<br />
widening. In the Netherlands the first fi projects with a<br />
protective dike constructed inside a dune are being<br />
built.<br />
Dikes and fl flood walls – with the exception off the<br />
Super Levees inTokyo – can fail, and such a failure can<br />
cause considerable damage. Therefore dikes and fl flood<br />
walls need careful planning, design, construction and<br />
operation and management. The level of f protection<br />
is also crucial to lowering the risk k of f overtopping and<br />
subsequent failure. The fl ood protection system in<br />
<strong>Rotterdam</strong> has a safety norm of f 1/10,000, meaning<br />
that the system has been designed to withstand a<br />
fl flood with an estimated probability of f occuring once<br />
in every 10,000 years. Other cities have significant fi<br />
lower protection levels. New Orleans, for instance,<br />
has a protection level off one in a hundred years,<br />
although the new Hurricane Protection System now<br />
under construction is so solid that although it will be<br />
overtopped once in one hundred years, it is expected<br />
to have a resiliency against failure of f the dikes and<br />
fl flood walls of f one in a fivehundred<br />
fi years.<br />
Safety norms differ ff from country to country and<br />
reflect fl both the number of f inhabitants and the<br />
economic value off assets within a dike ring; the<br />
more people and economic value to be protectedby levee infrastructure, the higher the safety standard.<br />
As climate change is expected to increase the<br />
frequency and severity off fl ooding events, these<br />
fl flood probabilities will accordingly increase rapidly<br />
with sea level rise. Therefore, reinforcing dikes is an<br />
ongoing concern in the Netherlands and other deltas<br />
that are protected by dikes and flood fl walls.<br />
Some of the best and most innovative CDC practices<br />
include the super levee in Tokyo and the Hurricane<br />
and Flood Risk Reduction System that is now under<br />
construction In New Orleans, in an impressive programme<br />
with unprecedented speed and determination. Also<br />
the multifunctional and smart urban fl ood protection<br />
that <strong>Rotterdam</strong> is working on to protect its inner city is<br />
an example of a best CDC practice.<br />
Figure 11.1 The Maeslant Storm Surge Barrier.
Storm surge barriers<br />
Storm surge barriers can play an important role in<br />
the protective system of delta cities. Barriers provide<br />
suffi cient protection, while maintaining accessibility,<br />
both for economic activities like navigation and for<br />
ecological processes. On the other hand, they are<br />
expensive and complicated, and bear one signifi cant<br />
risk that has to be kept as low as possible: the risk of a<br />
closure failure. When designing a barrier, the required<br />
future protection level, including sea level rise should<br />
be taken into account. Large constructions, such as<br />
the Dutch Eastern Scheldt and Maeslant barriers, were<br />
designed to function for at least 100 years, taking<br />
the observed sea level rise of 30 cm per century into<br />
account.<br />
A faster rise of the sea level would shorten the<br />
functional period in which the barriers remain within<br />
set norms. Renewal costs would, as a consequence,<br />
occur sooner than expected.<br />
Some of the best CDC practices on storm surge barriers<br />
as part of the protective system can be found in New<br />
Orleans, London and <strong>Rotterdam</strong>. In New Orleans<br />
new barriers are under construction right now, while<br />
London and <strong>Rotterdam</strong> rely for the protection of their<br />
citizens and ports already for some decades on their<br />
barriers. With ongoing sea level rise also New York<br />
City might consider the construction of barriers. But<br />
being built above sea level, New York can take it’s time<br />
and consider various alternatives and learn from the<br />
experiences of the other CDC cities.<br />
Zoning regulations and fl ood insurance<br />
Damage caused by fl oods can be limited by land<br />
use planning, such as preventing development in<br />
hazard-prone areas, and by building structures that<br />
are better able to withstand natural hazard impacts.<br />
For example, damage may be limited by constructing<br />
elevated houses and building with water resistant<br />
materials in fl ood plains or by strengthening roofs<br />
in order to prevent hurricane damage. Studies<br />
showed that potential hurricane or fl ood damage<br />
can signifi cantly be reduced if existing building code<br />
standards would be implemented or if households<br />
undertake (low-cost) adaptation measures, such as<br />
installing temporary water barriers and adapting<br />
existing buildings through retrofi tting to fl ooding.<br />
The projected rise in damage challenges the insurance<br />
industry and off ers them new business opportunities<br />
in providing aff ordable insurance against natural<br />
disasters. Insurers need to incorporate changes in<br />
natural disaster risk caused by climate change in the<br />
assessment and management of their risk exposure.<br />
Governments can promote aff ordability of insurance<br />
in the face of climate change by investing in risk<br />
reduction. In addition, public-private partnerships<br />
to insure natural hazard risk may be established,<br />
for example, with a role for the government as an<br />
insurer of last resort. The experience of the insurance<br />
sector with assessing, managing, and spreading risks<br />
may be useful in fostering adaptation of societies<br />
to climate change. Insurance could provide tools to<br />
assess natural hazard risk, which can be useful to<br />
guide adaptation policies, such as spatial planning.<br />
Well-designed fi nancial compensation arrangements<br />
can speed up the recovery process after natural<br />
disasters have struck and provide fi nancial security<br />
to the insured. Moreover, insurance with risk-based<br />
premiums can provide economic incentives to<br />
limit damage by acting as a price signal of risks. For<br />
example, insurance can provide higher coverage or<br />
C D C N E T W O R K I N P R A C T I C E 143
eductions in insurance premiums to homeowners<br />
who invest in measures that limit potential damage<br />
due to natural disasters. Insurance could also play an<br />
important role in requiring or promoting the adoption<br />
of stricter building codes and other adaptation<br />
measures.<br />
Some best CDC practices on zoning regulations and<br />
insurances are the design standards in Hong Kong, the<br />
High level of urban water management in high rise<br />
city with exceptional urban challenges and extreme<br />
environment in Tokyo, the elevation of all developments<br />
on low lying areas in HCMC and the US national fl ood<br />
insurance policy to stimulate elevating buildings above<br />
the 100 year fl ood levels or higher, for example in New<br />
Orleans and New York.<br />
Financial aspects of climate adaptation<br />
Most coastal cities are still in the planning phase<br />
of climate adaptation. An estimate of the total cost<br />
for fl ood management adaptation is mostly not<br />
available yet and adaptation costs are often seen<br />
as a large share of the budget. Apart from making<br />
more reliable cost benefi t studies, cities can explore<br />
to mainstream adaptation policies into current and<br />
planned investments. In this way, adaptation measures<br />
can be effi ciently implemented. For example in most<br />
CDC cities billions of dollars are spent on updating and<br />
expanding the cities infrastructure. <strong>Climate</strong> adaptation<br />
related measures might be integrated into these<br />
eff orts.<br />
Choices made today will infl uence the vulnerability<br />
to climate risks of assets and people far into the<br />
future. Therefore, it is important to study impacts<br />
and adaptation options under long-term trends in<br />
climate and socioeconomic change. Many largescale<br />
infrastructure works take 10 to 20 years or<br />
more to design, plan and implement. Postponing<br />
adaptation planning and policy development to<br />
future generations will only exacerbate the problems<br />
of vulnerable city communities and expose them<br />
to unacceptable threats to life and property. But<br />
there is also money to be made, as creative and<br />
pro-active adaptation will stimulate new business<br />
and environmental opportunities and innovations in<br />
economic activities. Thus, there are many challenges<br />
and opportunities for both business interests and<br />
researchers to feed policy makers with new ideas<br />
and solutions.<br />
Best CDC practices of dealing with the fi nancial<br />
aspects of climate adaptation are to be found in<br />
London, with the Disaster Risk Reduction Framework<br />
and in <strong>Rotterdam</strong>, were the <strong>Rotterdam</strong> <strong>Climate</strong> Proof<br />
Programme has integrated the aspects of estimating<br />
and fi nancing costs of climate adaptation into their<br />
planning. Important is to involve private business and<br />
investors in the early stages of the climate adaptation<br />
process to ensure commitment and to continuously<br />
seek for mutual interests.<br />
Capacity building, public awareness and<br />
communication<br />
An important element of a <strong>Climate</strong> Adaptation<br />
Strategy is public awareness, as pointed out at the<br />
CDC workshop in June 2009 in New York. Public<br />
awareness is therefore one of the non-technical<br />
measures that should become part of the climate<br />
adaptation strategies. Awareness amongst<br />
politicians and civil servants is even more crucial, as<br />
they are respectively the decision makers, architects
and implementers of f the climate adaptation plans.<br />
An important awareness component is to create<br />
multidisciplinary teams and enough capacity as<br />
critical mass to anchor the climate adaptation<br />
strategy in key parts off the local government<br />
organization. Also warning and evacuation systems<br />
are important tools.<br />
Communication plans, brochures and the use<br />
of f media like TV and radio are useful to raise<br />
awareness. The use off the new social media such<br />
as You Tube, Twitter, Linked In and Facebook for<br />
climate change communication purposes is not<br />
widely spread yet. Use off these media will even<br />
further increase awareness and create commitment<br />
for the city government spending money on<br />
climate adaptation. It also will inspire people to<br />
think about there own contribution to make their<br />
city climate proof.<br />
A good example of a CDC best practice on awareness<br />
raising can be found in Ho Chi Minh City that is<br />
now working on capacity building and is investing<br />
in training their staff from diff erent departments<br />
of the Peoples Committee. In New Orleans the<br />
Dutch Dialogues proofed to be a unique tool for<br />
communication and interaction between American<br />
and Dutch architects, planners and engineers, jointly<br />
striving for a better city’s future. CDC best practices on<br />
warning systems can be found in Hong Kong and Tokyo;<br />
both cities developed a world class storm warning and<br />
evacuation system.<br />
The way London and its Mayor is using modern<br />
communication tools such as YouTube is a useful<br />
example for other CDC-cities. In New York Mayor<br />
Bloomberg used modern media like internet to<br />
challenge the New Yorkers to generate ideas for<br />
achieving the key goals for the city’s sustainable<br />
future, and New Yorkers from all boroughs responded<br />
positively, creating public support for the city’s<br />
sweeping climate plan. <strong>Rotterdam</strong> and Jakarta are<br />
both actively communicating climate change, raising<br />
awareness and communicating the importance of<br />
integrated spatial and land-use planning.<br />
C D C N E T W O R K I N P R A C T I C E 145
11<br />
3<br />
Future<br />
outlook<br />
<strong>Climate</strong> change adaptation is considered one of f the<br />
largest challenges for mankind in 21st century. CDC<br />
was erected to give delta cities a platform for dialogue,<br />
exchange of f knowledge and joined actions. Doing<br />
nothing is not an option, but whatever has to be done<br />
needs to be part of f a long term strategy and as well as<br />
a short term action plan, both based on an integrated<br />
climate change adaptation strategy. Knowledge<br />
development and exchange are indespensable in<br />
this approach. The CDC-publications including this<br />
book k contribute to this knowledge exchange, as they<br />
visualize the approaches and the best practices in<br />
different ff cities and make a comparison possible. At the<br />
same moment these publications contribute to raising<br />
awareness.<br />
This book, therefore, explores the different ff aspects<br />
of f climate adaptation in delta cities. It is an<br />
investigation of f comparable adaptation challenges<br />
and opportunities and of f progress in adaptation plans<br />
and investments in the eight <strong>Connecting</strong> <strong>Delta</strong> <strong>Cities</strong><br />
(CDC) cities of f <strong>Rotterdam</strong>, New York, Jakarta, London,<br />
New Orleans, Hong Kong, Tokyo and Ho Chi Minh City.<br />
Also other climate adaptation networks like The <strong>Delta</strong><br />
Alliance and recent climate adaptation initiatives and<br />
events like in Melbourne and Shanghai are described<br />
in the book.<br />
The first fi CDC bookk marked the launch off the CDC<br />
networkk and a first fi reconnaissance. It described how<br />
climate change adaptation was dealt with in the three<br />
CDC cities New York, <strong>Rotterdam</strong> and Jakarta. This<br />
second book k focuses on the expanding <strong>Connecting</strong><br />
<strong>Delta</strong> <strong>Cities</strong> network k and the experiences and best<br />
practices of f eight CDC cities with climate change<br />
adaptation, as well as wit a fi rst assessment of f their
strategies. Continuing this development, it makes<br />
sense to plan the writing off a third CDC bookk to cover<br />
the implementation of f climate change adaptation<br />
strategies. This third book k could also focus on specific fi<br />
topics like communication or climate proof f spatial<br />
planning and give a report on fruitful knowledge<br />
exchange between CDC cities. Your input, comments<br />
and ideas about this proposed follow up are more then<br />
welcome and will be highly appreciated. Send us your<br />
opinion and help us decide on the content off the third<br />
CDC book.<br />
<strong>Connecting</strong> <strong>Delta</strong> <strong>Cities</strong> is a fl exible network k that<br />
closely collaborates with similar and complementary<br />
cities and initiatives. Some of f them were already<br />
described in this book, the following text boxes<br />
describe two more examples of f succesful climate<br />
change adaptation and knowledge exchange, in<br />
Melbourne and at the Shanghai World Expo 2010.<br />
Figure 11.2 Dutch Pavilion Shanghai World Expo 2010.<br />
C D C N E T W O R K I N P R A C T I C E 147
Melbourne<br />
Melbourne’s recent experience of climaterelated<br />
hazards such as drought and<br />
bushfi res, and the need to plan for the<br />
threat of future sea level rise, is driving<br />
new thinking and action on climate change<br />
adaptation.<br />
Figure 11.3 Melbourne dock – city skyline (courtesy of Port of Melbourne)<br />
Melbourne, the capital of the State of Victoria, is the<br />
most southerly of Australian mainland capital cities.<br />
The metropolitan area is dissected by the Yarra River<br />
which then empties into Port Phillip Bay, one of the<br />
world’s largest bays. Beyond the bustle of the central<br />
business district, the city gives way to suburbs which<br />
sprawl 40 km to the south (following the curve of the<br />
bay), 30 km eastwards, and a further 20 km onto the<br />
northern plains, covering an area of well over<br />
8,000 km 2 and almost 4 million inhabitants. The city<br />
can be characterized as being of low-density urban<br />
form with high levels of car use. Urban containment<br />
is an important contemporary debate in this fast<br />
growing city.<br />
Melbourne is well known as a cosmopolitan city<br />
with inhabitants coming from 140 nations around
the world. The earliest inhabitants were members<br />
of the ‘Kulin’ nations – Melbourne is actually settled<br />
on an area that was a regular meeting place for<br />
local Indigenous clans. However, they were rapidly<br />
displaced by English settlers in the 1830s, with more<br />
arriving as a result of the 1850s gold rush. In more<br />
recent times, large numbers of Second World War<br />
refugees from south Europe and the Baltic regions<br />
brought with them a rich Mediterranean culture.<br />
Diversity of urban life was further enhanced by<br />
refugees from Vietnam and Cambodia in the late<br />
1970s. A strong Asian infl uence continues to this day,<br />
evidenced by large numbers of international students<br />
who add a youthful vibrancy to the city centre.<br />
Melbourne is also Australia’s busiest cargo port and<br />
largest container port. M1 An area adjacent to the port<br />
area has been reclaimed and a new suburb, comprising<br />
high rise apartments and corporate headquarters, has<br />
sprung up on the river frontage. Port activity is forecast<br />
to grow fairly rapidly, one consequence of which was a<br />
controversial decision to dredge the narrow entrance<br />
of Port Phillip Bay and deepen the shipping channels<br />
to allow access at all tides for large container vessels.<br />
Legislation introduced to State Parliament in June<br />
2010 has also set in motion plans to merge the ports of<br />
Melbourne and Hastings which would act to increase<br />
shipping capacity, taking advantage of Hastings<br />
natural location outside of Port Phillip Bay.<br />
Temperatures have, on average, risen by about 1°C<br />
over the past 50 years in Australia. Although located<br />
in the more temperate south, Melbourne has had<br />
to cope with a 13 year drought, serious bush fi re<br />
episodes in peri-urban areas in 2007 and 2009, and<br />
a heat wave in 2009 which resulted in scores of<br />
Figure 11.4 Melbourne (© City of Melbourne 2010).<br />
fatalities and signifi cant impacts on key elements of<br />
urban infrastructure, the electricity sector being the<br />
most severely aff ected. This was also the year that<br />
saw a heat wave of unprecedented intensity and<br />
duration, with three consecutive days reaching above<br />
43°C, followed by the hottest day ever recorded,<br />
reaching 46.4°C. It is this peak in temperature that<br />
concurred with the outbreak of the bushfi res around<br />
Melbourne. In response to this extreme event, roles<br />
and responsibilities for emergency management were<br />
clarifi ed, and a review of the heat wave action plan is<br />
now being conducted by the Victorian Department of<br />
Health<br />
Scenarios supporting the City of Melbourne’s<br />
adaptation strategy suggest an increase in<br />
temperature (up to 2.6 degrees Celsius by 2070),<br />
C O N N E C T I N G D E L T A C I T I E S 2 0 1 0 149
a corresponding increase in the number of days of<br />
extreme heat (an extra 20 days over 35 degrees),<br />
reductions in rainfall most notably in spring, and an<br />
uncertain rise in sea levels. This is currently suggested<br />
as between 26 cm and 59 cm, though 80cm is being<br />
used to inform coastal planning decisions. M2<br />
Given the recent history of drought conditions it is<br />
perhaps of little surprise that Melbourne communities<br />
have become accustomed to the need to conserve<br />
water. High profi le awareness-raising campaigns,<br />
the promotion of ‘water sensitive urban design’, and<br />
behavioral change initiatives such as promotion of<br />
domestic rain tanks, are refl ective of an underlying<br />
cultural shift and an increased public acceptance of<br />
the need to modify behavior in order to manage an<br />
increasingly scarce resource. More controversially,<br />
though in line with many of the major Australian<br />
cities, Melbourne has also turned to technical fi xes to<br />
address problems of water shortage. These include<br />
a new energy intensive desalinization plant which<br />
will become operational in 2011 and the Sugarloaf<br />
pipeline which will transfer water from the north of the<br />
State to meet the needs of metropolitan Melbourne.<br />
Current day fl ood risks are mainly confi ned to<br />
extreme storm events and the failings of storm-water<br />
systems. Periodically Melbourne is subjected to<br />
heavy rain and widespread fl ash fl ooding due to its<br />
natural fl oodplains, the reduction of permeability by<br />
suburban development, and an aging storm-water<br />
infrastructure. However, with over 40 km of the urban<br />
area exposed to a beachfront, the threat of sea level<br />
rise is now being taken very seriously by Melbourne
authorities. The Victorian Coastal Strategy (2008) M3<br />
has highlighted sea level rise and the combination<br />
of population growth and development pressures as<br />
key issues to be addressed. Sea level rise is currently<br />
recorded as between 2.4 and 2.8 mm per year, with<br />
planning guidance recommending the consideration<br />
of a minimum rise of 0.8 meters by 2100 (to be<br />
refi ned as new knowledge becomes available). Highresolution<br />
risk assessment is being carried out as<br />
part of the Future Coasts programme M4 in order to<br />
better understand likely future impacts and to design<br />
coastal adaptation strategies. Sea level rise will have<br />
signifi cant implications for commonly affl uent bayside<br />
suburbs and it has also been recognized that these<br />
impacts could have signifi cant implications for the<br />
structural and functional resilience of Melbourne’s<br />
major commercial ports (the Port of Melbourne being<br />
the largest of these).<br />
In response to current and future climate risks, the<br />
adaptation agenda is also being driven by important<br />
policy initiatives at the sub-national scale. In 2009,<br />
the City of Melbourne released a municipal <strong>Climate</strong><br />
Adaptation Strategy noting that operational<br />
research was needed to assess localized risks and<br />
identify suitable adaptation responses in the city.<br />
Adaptation is also being supported at the State level<br />
with the Victorian government releasing a <strong>Climate</strong><br />
Change Green Paper in 2009. Victoria is the only<br />
State in Australia to have committed to supporting<br />
and funding adaptation research through the<br />
establishment of the Victorian Centre for <strong>Climate</strong><br />
Change Adaptation Research (VCCCAR). Activity<br />
includes funding research projects to analyze regional<br />
priorities, hosting an international research fellow,<br />
organizing regional think tanks, and holding an annual<br />
adaptation forum for interested stakeholders.<br />
“<strong>Climate</strong> change presents particular challenges for<br />
delta cities. Rising sea levels, increasing temperatures<br />
and increased frequency of storm surges and other<br />
climate related events will place new pressures on ports,<br />
infrastructure, and communities. Eff ective adaptation to<br />
these challenges will require diff erent approaches to the<br />
future management of our urban environment.”<br />
Professor Rod Keenan<br />
Director, Victorian Centre for <strong>Climate</strong> Change<br />
Adaptation Research<br />
C O N N E C T I N G D E L T A C I T I E S 151
Shanghai-<strong>Rotterdam</strong><br />
Water Conference at<br />
World Expo 2010<br />
On Thursday, 10 June 2010, the ‘Happy Street’ Holland<br />
Pavilion at the 2010 Shanghai World Expo was the<br />
venue of the Shanghai-<strong>Rotterdam</strong> Water Conference.<br />
The offi cial opening was performed by Paula<br />
Verhoeven, <strong>Climate</strong> Director of the City of <strong>Rotterdam</strong>,<br />
and Zhu Shiqing, Deputy Director of the Shanghai<br />
Water Authority.
Reason for the conference was that Shanghai and<br />
<strong>Rotterdam</strong> both face the challenge of f preserving<br />
the attractive qualities of f their cities, despite<br />
climate change, by implementing innovative<br />
water management. The Shanghai-<strong>Rotterdam</strong><br />
Water Conference therefore offered ff an excellent<br />
opportunity to share and exchange knowledge and<br />
experience gained from best practices. Students<br />
from the Netherlands and China exchanged and<br />
compared best practices on climate change adaption<br />
from their countries in public classes. A number<br />
of f lectures addressed topics such as storm-surge<br />
barriers, adaptation strategies, rainwater storage and<br />
ecologically sustainable fl ood management. Cases<br />
were presented from Shanghai, <strong>Rotterdam</strong> and New<br />
Orleans, al looking for to make these low lying delta<br />
regions safeandresilient from fl floods.<br />
C O N N E C T I N G D E L T A C I T I E S 153
References<br />
General references<br />
G1 Rosenzweig, C., Solecki, W. and Hammer S. First UCCRN Assessment Report on <strong>Climate</strong> Change in <strong>Cities</strong> (ARC3), forthcoming.<br />
G2 Nicholls, R.J., S. Hanson, C. Herweijer, N. Patmore, S. Hallegatte, J. Corfee-Morlot, Jean Château and R. Muir-Wood (2008). ‘Ranking Port <strong>Cities</strong> with High Exposure<br />
and Vulnerability to <strong>Climate</strong> Extremes Exposure Estimates.’ OECD Environment Working Papers No. 1, 19/11/2008, November.<br />
G3 Intergovernmental Panel on <strong>Climate</strong> Change, 2007, <strong>Climate</strong> Change 2007: Impacts, Adaptation and Vulnerability, Contribution of Working Group II to the Fourth<br />
Assessment Report of the IPCC, Cambridge, UK: Cambridge University Press.<br />
G4 NPCC (2009). <strong>Climate</strong> Risk Information. New York City Panel on <strong>Climate</strong> Change (NPCC). www.nyc.gov/html/om/pdf/2009/NPCC_CRI.pdf.<br />
G5 Aerts, J., Sprong, T., Bannink, B. (2008). Attention for Safety. www.adaptation.nl. Report for the Dutch <strong>Delta</strong> committee pp. 258.<br />
G6 IPCC (2007). <strong>Climate</strong> Change 2007. The Physical Science Basis. Contribution of Working Group I to the Fourth Assessment Report of the Intergovernmental Panel<br />
on <strong>Climate</strong> Change. Cambridge University Press, Cambridge.<br />
G7 Jonkman, S.N., Bočkarjova, M., Kok, M., Bernardini, P. (2008). Integrated hydrodynamic and economic modeling of fl ood damage in the Netherlands. Ecological<br />
economics, 66(1), 77-90.<br />
References <strong>Rotterdam</strong><br />
R1 Aerts, J.C.J.H., Renssen, H., Ward, Ph., Moel de H., Odada, E., Goose, H. (2006) Sensitivity of Global River discharges to Long Term <strong>Climate</strong> Change and Future<br />
<strong>Climate</strong> Variability. Geophysical Research Letters, 33 L19401.<br />
R2 Developed by the Flood Resilience Group, Unesco-IHE/TU-Delft.<br />
R3 Aerts, J., Sprong, T., Bannink, B. (2008). Attention for Safety. www.adaptation.nl. Report for the Dutch <strong>Delta</strong> committee pp. 258.<br />
R4 <strong>Delta</strong>commissie 2008 (2008). Samen werken met water (in Dutch). ISBN/EAN 978-90-9023484-7.<br />
R5 Kabat, P., Fresco, L.O., Stive, M., Veerman, C., Alphen, J. van, Parmet, B. , Hazeleger, W. & Katsman, C. Nature Geoscience 2, 450 - 452 (2009) doi:10.1038/ngeo572.
R6 <strong>Rotterdam</strong> <strong>Climate</strong> <strong>Initiative</strong>. www.rotterdamclimateinitiative.nl<br />
R7 Molenaar, A., et al, (2010) <strong>Rotterdam</strong> <strong>Climate</strong> Proof, Adaptation Programme 2010, <strong>Rotterdam</strong>, pp. 32.<br />
References New York<br />
NY1 Neumann, C.J., Jarvinen, B.R., McAdie, C.J., Hammer, G.R. (1999). Tropical Cyclones of the North Atlantic Ocean, 1871-1998. Historical Climatology Series 6-2.<br />
National Climatic Data Center, pp. 206.<br />
NY2 Coch, N.K. (1994). Hurricane hazards in the Northeast US Journal of Coastal Research, 12, 115-147.<br />
NY3 New York Times, August 27, 1999.<br />
NY4 NPCC (2009). <strong>Climate</strong> Risk Information. New York City Panel on <strong>Climate</strong> Change (NPCC). www.nyc.gov/html/om/pdf/2009/NPCC_CRI.pdf. f<br />
NY5 Rosenzweig, C., Solecki, W. (2001). <strong>Climate</strong> Change and a Global City: The Potential Consequences of <strong>Climate</strong> Variability and Change, Metro East Coast.<br />
Report for the US Global Change Research Programme, Columbia Earth Institute.<br />
NY6 New York City Department of Environmental Protection <strong>Climate</strong> Change Programme (2008). Assessment and Action Plan, May, 2008.<br />
NY7 City of New York (2007) PlaNYC 2030. www.nyc.gov/html/planyc2030/html/plan/climate.shtml.<br />
NY8 Intergovernmental Panel on <strong>Climate</strong> Change, 2007, <strong>Climate</strong> Change 2007: Impacts, Adaptation and Vulnerability, Contribution of Working Group II to the Fourth<br />
Assessment Report of the IPCC, Cambridge, UK: Cambridge University Press.<br />
NY9 New York City Panel on <strong>Climate</strong> Change, Adapting to <strong>Climate</strong> Change: The New York City Experience, William Solecki and Cynthia Rosenzweig, eds., forthcoming.<br />
NY10 PlaNYC 2008. Sustainable Stormwater Management Plan 2008.<br />
NY11 Colle, B.A., Buonaiuto, F., Bowman, M.J., Wilson, R.E., Flood, R., Hunter, R., Mintz, A., Hill, D., 2008. New York City’s vulnerability to coastal fl ooding.<br />
Bull. Amer. Met. Soc. 89, 829-841.<br />
NY12 Jagtar s. Khinda et al, 2009. Against the Deluge: Storm Surge Barriers to Protect New York City. Proceedings of the March 2009 ASCE Seminar an exhibition in<br />
New York City.<br />
References Jakarta<br />
J1 BPS Jakarta, 2007. Jakarta dalam angka 2007. Katalog BPS: 1403.31. Badan Pusat Statistik Propinsi DKI Jakarta, Jakarta, Indonesia.<br />
J2 Firman, T., 2000. Rural to urban land conversion in Indonesia during boom and bust periods. Land Use Policy, 17, 13-20.<br />
J3 Verburg, P.H., Veldkamp, T.A., Bouma, J., 1999. Land use change under conditions of high population pressure: the case of Java. Global Environmental Change,<br />
9, 303-312, doi:10.1016/S0959-3780(99)00175-2.<br />
J4 Firman, T., 2009. The continuity and change in mega-urbanization in Indonesia: A survey of Jakarta-Bandung Region (JBR) development.<br />
Habitat International, 33, 327-339, doi:10.1016/j.habitatint.2008.08.005.<br />
J5 Abeyasekere, S., 1987. Jakarta: a history. Oxford University Press, Singapore.<br />
J6 Abidin, H.Z., Andreas, H., Gumilar, I., Gamal, M., Susanti, P., Fukuda, Y., Deguchi, T., 2010. Land subsidence in Jakarta Basin (Indonesia):<br />
characteristics, causes and impacts. IAHS book series. Groundwater system response to a changing climate. CRC Press/Balkema, in press.<br />
J7 Hulme, M., Sheard, N., 1999. <strong>Climate</strong> change scenarios for Indonesia. Climatic Research Unit, Norwich, U.K.<br />
J8 Cruz, R.V., Harasawa, H., Lal, M., Wu, S., Anokhin, Y., Punsalmaa, B., Honda, Y., Jafari, M., Li, C., Huu Ninh, N., 2007. Asia. In: Parry, M.L., Canziani, O.F., Palutikof,<br />
J.P., Van der Linden, P.J., Hanson, C.E. (Eds.) <strong>Climate</strong> Change 2007: Impacts, Adaptation and Vulnerability. Contribution of Working Group II to the Fourth<br />
Assessment Report of the Intergovernmental Panel on <strong>Climate</strong> Change. Cambridge University Press, Cambridge, U.K., pp.469-506.<br />
J9 Pribadi, K.S., 2008. <strong>Climate</strong> change adaptation research in Indonesia. Asian Universities for Environment and Disaster Management, 28-29 July 2008, Kyoto, Japan.<br />
J10 Knutson, T.R., Tuleya, R.E., 2004. Impacts of CO2 induced warming on simulated hurricane intensities and precipitation: sensitivity to the choice of climate model<br />
and convective parameterization. Journal of <strong>Climate</strong>, 17, 3477-3495.<br />
J11 Yulianto, F., Marfai, M.A., Parwati., Suwarsono., Suprapto, T., 2010. Simulation model of the overfl owing fl ood of Ciliwung River at kampong Melayu-Bukit Duri,<br />
Jakarta, Indonesia. Being submitted to Digital Images Processing and Remote Sensing Journal, National institute of Aeronautics and space (LAPAN), Jakarta,<br />
Indonesia.<br />
J12 Steinberg, F., 2007. Jakarta: Environmental problems and sustainability. Habitat International, 31, 354-365, doi:10.1016/j.habitatint.2007.06.002.<br />
J13 Public Work Department, 2008. Issues and activities for fl ood mitigation in Directorate general for Human Settlement, Public Work Department. Presented at<br />
Seminar Penanganan Banjir di Jabodetabek. Grend Melia Hotel, 4th December 2008.<br />
C O N N E C T I N G D E L T A C I T I E S 155
References London<br />
L1 GLA (2009) Draft Replacement London Plan. www.london.gov.uk/shaping-london/london-plan/strategy/<br />
L2 http://ec.europa.eu/environment/water/water-framework/info/intro_en.htm<br />
L3 Armstrong B, Chalabi Z, Fenn B, Hajat S, Kovats S (2010) Association of mortality with high temperatures in a temperate climate: England and Wales.<br />
www.ncbi.nlm.nih.gov/pubmed/20439353<br />
L4 GLA (2010) London <strong>Climate</strong> Change Adaptation Strategy, Draft for Public Consultation. www.london.gov.uk/climatechange/strategy<br />
L5 www.unisdr.org/<br />
L6 www.youtube.com/watch?v=WplvSvvGXRA<br />
L7 www.london.gov.uk/climatechange/<br />
L8 The draft TE2100 plan can be downloaded from www.environment-agency.gov.uk/te2100<br />
L9 Areas susceptible to surface water fl ooding modelling undertaken by JBA consulting for the Environment Agency<br />
L10 UKWIR (2004), Report 03/CL/10/2<br />
L11 www.therrc.co.uk/lrap.php<br />
References New Orleans<br />
NO1 Campanella, Richard. <strong>Delta</strong> Urbanism: New Orleans. The American Planning Association. Chicago, 2010.<br />
NO2 US Census Bureau. ‘Orleans Parish, Louisiana’. 2000. http://quickfacts.census.gov/qfd/states/22/22071.html. [accessed 20 July 2010].<br />
NO3 Times Picayune, 2009. Recovery by the Numbers 2009 [Online] Available at: http://blog.nola.com/news_impact/2009/08/katrina-recovery-year4.pdf<br />
[Accessed 18 July 2010]<br />
NO4 Division of Administration, State of Louisiana. ‘Louisiana Economy’. http://doa.louisiana.gov/about_economy.htm. [accessed 19 July 2010].<br />
NO5 New Orleans City Business. ‘New Orleans’ Nightlife Ranked #1 in World’.<br />
http://neworleanscitybusiness.com/ blog/2010/05/07/new-orleans-nightlife-ranked-no-1-in-world. [Accessed 20 July 2010].<br />
NO6 The Weather Channel Interactive. ‘Monthly Averages for New Orleans, NAS LA’.<br />
www.weather.com/outlook/health/fi tness/wxclimatology/monthly/graph/USLA0339<br />
NO7 National Weather Service. ‘The Saffi r-Simpson Hurricane Wind Scale’. www.nhc.noaa.gov/sshws.shtml. [accessed 19 July 2010].<br />
NO8 National Hurricane Center. ‘Tropical Cyclone Climatology’. www.nhc.noaa.gov/pastprofi le.shtml. [accessed 19 July 2010].<br />
NO9 Campanella, Richard. Bienville’s Dilemma: A historical geography of New Orleans. Centre for Louisiana Studies. Lafayette, 2008.<br />
NO10 Coastal Wetlands Planning, Protection, and Restoration Act (CWPPRA) Programme, USGS National Wetlands Research Center. ‘Mississippi River <strong>Delta</strong> Basin’.<br />
www.lacoast.gov/landchange/basins/mr/. [Accessed 19 July 2010].<br />
/<br />
NO11 American Society of Civil Engineers. The New Orleans hurricane protection system: what went wrong and why: a report by the American Society of Civil<br />
Engineers Hurricane Katrina External Review Panel. American Society of Civil Engineers. Reston, 2007.<br />
NO12 Lerardi, K. Beyond receding waters: devastated by Hurricanes Katrina and Rita, the Gulf Coast fi nally grows green again The Free Library [Online]<br />
22 September 2008, www.thefreelibrary.com<br />
NO13 Hike for KaTREEna; Replanting New Orleans 4,980 trees and counting. www.hikeforkatreena.com. [Accessed 18 July 2010].<br />
NO14 US Army Corps of Engineers. June 2010 Status Report.<br />
NO15 US Army Corps of Engineers. Rebuilding Snapshot 2009.<br />
NO16 Beyond receding waters: devastated by Hurricanes Katrina and Rita,...-a0187926856 [accessed18 July 2010].<br />
NO17 Kelman, Ari. ‘Boundary Issues: Clarifying New Orleans’s Murky Edges’. Journal of American History, 94. December 2007. PP 695-703.<br />
NO18 State of Louisiana Press Release. ‘Just the Facts: Drilling Moratorium’s Impact on Louisiana’s Families and Economy’. 14 June 2010.<br />
http://emergency.louisiana.gov/Releases/06142010-moratorium.html. [accessed 18 July 2010].<br />
NO19 Stromberg, Meghan. ‘Putting the Water to Work’. PLANNING Magazine, American Planning Association. July 2010. PP 34-36.<br />
NO20 US Army Coprs of Engineers. Greater New Orleans hurricane and storm risk reduction system [map]. US Army Corps of Engineers. New Orleans, 2008.
References Hong Kong<br />
HK1 Department of Public and Social Administration, City University of Hong Kong, 2010<br />
HK2 World Bank (2010). World Development Indicators. http://data.worldbank.org/data-catalog/world-development-indicators?cid=GPD_WDI<br />
HK3 <strong>Climate</strong> Change Business Forum (2010) www.climatechangebusinessforum.com/en-us/hong_kong_context_aff ected)<br />
HK4 CIA Fact Book, Map of Hong Kong, www.cia.gov/library/publications/the-world-factbook/geos/hk.html<br />
HK5 Greenpeace China (2010). The ‘<strong>Climate</strong> change bill’. Economic costs of heavy rainstorm in Hong Kong. Greenpeace China report.<br />
HK6 Electrical and Mechanical Services Department (2009). Hong Kong energy end use data 2009. Electrical and Mechanical Service Department, September 2009.<br />
HK7 Lee, T.C., Kok, M.H. & Chan, K.Y. (2010). Climatic infl uences on the energy consumption in domestic and commercial sectors in Hong Kong. Presented in the 16th<br />
Annual International Sustainable Development Research Conference, Hong Kong, China, 30 May - 1 June 2010, Hong Kong Observatory Reprint No.903<br />
HK8 IEA (2007). Selected 2007 Indicators for Hong Kong (China) www.iea.org/stats/indicators.asp?COUNTRY_CODE=HK<br />
HK9 Fung Wing Yee (2004). Provision of Service for characterizing climate change impact in Hong Kong. The Hong Kong Polytechnic University, September 23, 2004.<br />
HK10 Water Supplies Department (2009). Statistics.<br />
www.wsd.gov.hk/en/publications_and_statistics/statistics/key_facts/miscellaneous_data/graph/index.html#2<br />
HK11 Hong Kong Observatory (2010). <strong>Climate</strong> of Hong Kong. www.hko.gov.hk/cis/climahk_e.htm<br />
HK12 Leung, Y.K., Yeung, K.H., Ginn, E.W.L. & Leung, W.M. (2004). <strong>Climate</strong> Change in Hong Kong. Hong Kong Observatory technical note no 107.<br />
HK13 Leung, Y.K., Wu, M.C., Yeung, K.K. & Leung, W.M. (2007). Temperature projections in Hong Kong based on IPCC Fourth Assessment Report.<br />
Hong Kong Meteorological Society Bulletin, Vol. 17.<br />
HK14 Lee, T.C. & Wong, C.F. (2007). Historical Storm Surges and Storm Surge Forecasting in Hong Kong. Hong Kong Observatory. Paper for the JCOMM Scientifi c and<br />
Technical Symposium on Storm Surges (SSS) in Seoul, 2007.<br />
HK15 Drainage Services Department (2008). Sewerage and Flood Protection. Drainage services 1841-2008. The Government of Hong Kong Special<br />
Administrative Region.<br />
HK16 Ginn, W.L., Lee, T.C. & Chan, K.Y. (2010). Past and future changes in the climate of Hong Kong. ACTA Meteorologica Sinica, 24(2), 163-175.<br />
www.cmsjournal.net/qxxb_en/ch/reader/view_abstract.aspx?fi le_no=20100203&fl ag=1<br />
HK17 Environmental Protection Department (2009). <strong>Climate</strong> change. Actions in Hong Kong. www.epd.gov.hk/epd/<strong>english</strong>/climate_change/hkactions.html).<br />
HK18 Environmental Protection Department (2010). A study of climate change in Hong Kong – Feasibility Study. www.climatechange.com.hk<br />
HK19 Hong Kong Observatory (2002). Tropical Cyclones in 2001. Published in April 2002. www.hko.gov.hk/publica/tc/tc2001.pdf<br />
HK20 Water Supplies Department (2009). Meeting demand for water. Year in Review. Annual report 2008-2009.<br />
References Tokyo<br />
T1 Nakamura, K., K. Tockner, et al., 2006. River and wetland restoration: lessons from Japan. BioScience 56(5): 11.<br />
T2 Yoshimura, C., Omura, T., Furumai, H., Tockner, K., 2005. Present state of rivers and streams in Japan. River research and applications, 21.<br />
T3 Arakawa - Karyu River Offi ce and MLIT, 2006. The Arakawa: River of the Metropolis; A comprehensive guide to the lower Arakawa, Arakawa -<br />
Karyu River Offi ce Ministry of Land, Infrastructure and Transport.<br />
T4 Google, 2009. http://maps.google.nl.<br />
T5 Hooimeijer, F., 2008. History of urban water in Japan, in Hooimeijer, F. and De Graaf, R. (ed.) Urban water in Japan. London: Taylor & Francis Group.<br />
T6 River Bureau, 1990. Rivers in Japan and other countries. Tokyo: Ministry of Construction.<br />
T7 Takahasi, Y. and Uitto, J. I., 2004. Evolution of river management in Japan: from focus on economic benefi ts to a comprehensive view.<br />
Global environmental Change, 14.<br />
T8 Statistics Bureau of Japan, 2010. Japan Statistical Yearbook 2010.<br />
T9 Kundzewicz, Z. W. and K. Takeuchi. 1999. Flood protection and management: quo vadimus? Hydrological Sciences Journal 44(3): 16<br />
T10 Solomon, S., D. Qin, M. Manning, Z. Chen, M. Marquis, K.B. Averyt, M. Tignor and H.L. Miller., 2007. IPCC Fourth Assessment Report (AR4); <strong>Climate</strong> Change 2007:<br />
The Physical Science Basis; Contribution of Working Group I to the Fourth Assessment Report of the Intergovernmental Panel on <strong>Climate</strong> Change. Cambridge<br />
University Press, Cambridge, United Kingdom and New York, NY, USA.<br />
T11 Infrastructure Development Institute-Japan and Japan River Association. Rivers in Japan. Japan: Ministry of Land, Infrastructure and Transport.<br />
T12 Nakao, T. and K. Tanimoto, 1997. Comprehensive Flood Control Measures in the Tsurumi River Basin in Japan. Water International 22(4): 7<br />
C O N N E C T I N G D E L T A C I T I E S 157
T13 Ando, Y. and Y. Takahasi, 1997. Recent Flood Control Measures for Urban Rivers in Japan: Case Study of the Kanda River in Tokyo. Water International 22(4): 7.<br />
T14 Takahasi, Y. and Uitto, J. I., 2004. Evolution of river management in Japan: from focus on economic benefi ts to a comprehensive view.<br />
Global environmental Change, 14.<br />
T15 Keihin Offi ce of Rivers, -. Tsurumi river multipurpose retarding basin. Retrieved July 25th, 2007, from<br />
www.keihin.ktr.mlit.go.jp/<strong>english</strong>/tsurumi/oasis_01.htm.<br />
T16 Fujita, S., 1984. Experimental sewer system for reduction of urban storm runoff . Chalmers University of Technology: 10. Goteborg, Sweden).<br />
T17 Kiguchi, K., Maeda, M., et al., 1994. Sewer system for improving fl ood control in Tokyo: a step towards a return period of 70 years.<br />
Water science and technology 29 (1-2): 8.<br />
T18 Fujita, S., 1994. Infi ltration structures in Tokyo. Water science and technology 30(1): 9.<br />
T19 Fujita, S. 2010.<br />
T20 Fujita, S., 1997. Measures to promote storm water infi ltration. Water Science and Technology, Volume 36, No. 8-9.<br />
References HCMC<br />
H1 General Statistics Offi ce of Vietnam<br />
H2 Tran Thi Van and Ha Duong Xuan Bao (2010). Study of the Impact of Urban Development on Surface Temperature Using Remote Sensing in Ho Chi Minh City.<br />
Geographical Research, 48(1):86-96.<br />
H3 Report on the revised General Development Plan of HCMC until 2025. Institute of Construction Planning. Department of Planning and Architecture,<br />
HCMC. In Vietnamese.<br />
H4 Southern Meteorology and Hydrology Centre<br />
H5 Ho Long Phi (2007). <strong>Climate</strong> change and urban fl ooding in Ho Chi Minh City. In: Finish Environment Institute (SYKE), Proceedings of the Third International<br />
Conference on <strong>Climate</strong> and Water, September 3-6, 2007. Pp. 194-199. Helsinki.<br />
H6 MONRE (2009). <strong>Climate</strong> Change, Sea level rise scenarios for Vietnam. Ministry of Natural Resources and Environment. Hanoi.<br />
H7 NTP (2008). Decision No: 158/2008/QĐ-TTg. National Target Programme to Respond to <strong>Climate</strong> Change. Hanoi. Department of Natural Resources and<br />
Environment of Ho Chi Minh City<br />
H8 ICEM (2009). HCMC Adaptation to <strong>Climate</strong> Change Study Report – Volume 2: Main Report – Draft 4. International Centre for Environmental Management. Hanoi.<br />
H9 Dasgupta, S., Laplante, B., Meisner, C., Wheeler, D., Yan, J. (2009). The impact of sea-level rise on developing countries: a comparative analysis.<br />
Climatic Change, 93:379-388.<br />
H10 Nicholls, R.J. et al. (2008). Ranking Port <strong>Cities</strong> with High Exposure and Vulnerability to <strong>Climate</strong> Extremes: Exposure Estimates, OECD Environment Working Papers,<br />
No 1, OECD Publishing.<br />
References Melbourne<br />
M1 Port of Melbourne Corporation (2009) Port Development Strategy 2035 Vision: www.portofmelbourne.com/portdev/portdevstrategy.asp<br />
M2 Maunsell Australia Pty Ltd (2008) City of Melbourne <strong>Climate</strong> Change Adaptation Strategy City of Melbourne:<br />
www.melbourne.vic.gov.au/AboutCouncil/PlansandPublications/strategies/Pages/Environmentalpolicies.aspx<br />
M3 Victorian Coastal Strategy: www.vcc.vic.gov.au/vcs.htm<br />
M4 Future Coasts programme:<br />
www.climatechange.vic.gov.au/Greenhouse/wcmn302.nsf/childdocs/-0A075FE0F68F56D6CA2575C40007BF74-A2C8013E5CEDE429CA25766D0016E286<br />
References illustrations<br />
The publishers gratefully acknowledge the following for permission to use the illustrations indicated: 30 Figure 8.11 - Roel Dijkstra; 32 RDM Campus - Fotografi e Marijke<br />
Volkers; 60 Figure 5.3 (left) Marfai (right) Novira; 66 Figure 5.6 - Marfai; 67 Figure 5.6 - Marfai; 70 Figure 5.9 - Marfai; 71 Mayor of London - James O. Jenkins; 92 Flood - ANP<br />
Photo’s; 95 Photo left - Bas Jonkman; 103 Figure 8.4 - DSD; 103 Figure 8.4 - DSD; 111 Figure 8.11 - Fotografi e W.P. Pauw; 126 HCMC - Peter Stucking; and iStockphoto.
Contact Information CDC secretariat<br />
Ms. Chantal Oudkerk Pool<br />
Address<br />
WTC Beursplein 37, 3011 AA <strong>Rotterdam</strong>,<br />
the Netherlands<br />
E-mail<br />
info@deltacities.com<br />
Website<br />
www.deltacities.com<br />
C O N N E C T I N G D E L T A C I T I E S 159
At present, more than 50 percent of the world’s<br />
population lives in cities. According to the<br />
United Nations, more than two thirds of the<br />
world’s large cities are vulnerable to rising sea<br />
levels, exposing millions of people to the risk of<br />
extreme fl oods and storms. Within the next<br />
30 years, the number of people living in cities<br />
will increase to 60 percent of the world’s<br />
population, resulting in even more people living<br />
in highly exposed areas.<br />
This book explores the diff erent aspects of<br />
climate adaptation and the various challenges<br />
delta cities in the world face. It is an investigation<br />
of comparative adaptation problems and<br />
progress in the cities of <strong>Rotterdam</strong>, New York,<br />
Jakarta, London, New Orleans, Hong Kong,<br />
Tokyo and Ho Chi Minh City. Each city faces<br />
diff erent challenges; one of the lessons of the<br />
<strong>Connecting</strong> <strong>Delta</strong> <strong>Cities</strong> initiative is that while<br />
cities will follow adaptation paths that may<br />
diff er, sometimes substantially, each city can<br />
learn from the others.