Mobile Wireless Competition Report - FCC
Mobile Wireless Competition Report - FCC
Mobile Wireless Competition Report - FCC

Create successful ePaper yourself
Turn your PDF publications into a flip-book with our unique Google optimized e-Paper software.
In the Matter of<br />
Implementation of Section 6002(b) of the<br />
Omnibus Budget Reconciliation Act of 1993<br />
Annual <strong>Report</strong> and Analysis of Competitive<br />
Market Conditions With Respect to <strong>Mobile</strong><br />
<strong>Wireless</strong>, Including Commercial <strong>Mobile</strong> Services<br />
Federal Communications Commission <strong>FCC</strong> 10-81<br />
Before the<br />
Federal Communications Commission<br />
Washington, D.C. 20554<br />
)<br />
)<br />
)<br />
)<br />
)<br />
)<br />
)<br />
)<br />
)<br />
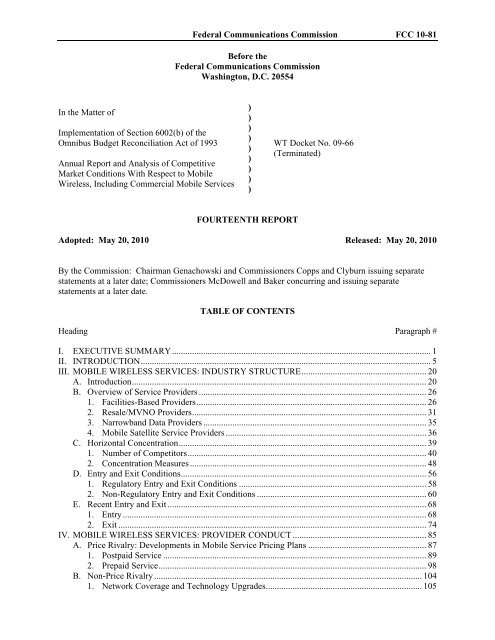
FOURTEENTH REPORT<br />
WT Docket No. 09-66<br />
(Terminated)<br />
Adopted: May 20, 2010 Released: May 20, 2010<br />
By the Commission: Chairman Genachowski and Commissioners Copps and Clyburn issuing separate<br />
statements at a later date; Commissioners McDowell and Baker concurring and issuing separate<br />
statements at a later date.<br />
TABLE OF CONTENTS<br />
Heading Paragraph #<br />
I. EXECUTIVE SUMMARY.................................................................................................................... 1<br />
II. INTRODUCTION.................................................................................................................................. 5<br />
III. MOBILE WIRELESS SERVICES: INDUSTRY STRUCTURE........................................................ 20<br />
A. Introduction.................................................................................................................................... 20<br />
B. Overview of Service Providers ...................................................................................................... 26<br />
1. Facilities-Based Providers....................................................................................................... 26<br />
2. Resale/MVNO Providers......................................................................................................... 31<br />
3. Narrowband Data Providers .................................................................................................... 35<br />
4. <strong>Mobile</strong> Satellite Service Providers .......................................................................................... 36<br />
C. Horizontal Concentration............................................................................................................... 39<br />
1. Number of Competitors...........................................................................................................40<br />
2. Concentration Measures ..........................................................................................................48<br />
D. Entry and Exit Conditions.............................................................................................................. 56<br />
1. Regulatory Entry and Exit Conditions .................................................................................... 58<br />
2. Non-Regulatory Entry and Exit Conditions ............................................................................ 60<br />
E. Recent Entry and Exit .................................................................................................................... 68<br />
1. Entry ........................................................................................................................................ 68<br />
2. Exit .......................................................................................................................................... 74<br />
IV. MOBILE WIRELESS SERVICES: PROVIDER CONDUCT ............................................................ 85<br />
A. Price Rivalry: Developments in <strong>Mobile</strong> Service Pricing Plans ..................................................... 87<br />
1. Postpaid Service ...................................................................................................................... 89<br />
2. Prepaid Service........................................................................................................................ 98<br />
B. Non-Price Rivalry ........................................................................................................................ 104<br />
1. Network Coverage and Technology Upgrades...................................................................... 105
Federal Communications Commission <strong>FCC</strong> 10-81<br />
a. Service Provider Technology Deployments ................................................................... 111<br />
b. Coverage by Technology Type....................................................................................... 118<br />
c. Roaming.......................................................................................................................... 124<br />
2. Advertising, Marketing, Sales Expenditures, and Retailing.................................................. 127<br />
a. Advertising Expenditures................................................................................................ 128<br />
b. Marketing Campaigns..................................................................................................... 132<br />
c. Retailing.......................................................................................................................... 134<br />
3. Differentiation in <strong>Mobile</strong> <strong>Wireless</strong> Handsets/Devices .......................................................... 135<br />
4. Differentiation in <strong>Mobile</strong> Data Applications......................................................................... 148<br />
V. MOBILE WIRELESS SERVICES: PERFORMANCE..................................................................... 153<br />
A. Subscribership Levels .................................................................................................................. 155<br />
1. <strong>Mobile</strong> <strong>Wireless</strong> Subscribers by Type of Service ................................................................. 156<br />
2. <strong>Mobile</strong> <strong>Wireless</strong> Subscribers by Pricing Plan ....................................................................... 163<br />
3. <strong>Mobile</strong> <strong>Wireless</strong> Subscribers by Age .................................................................................... 165<br />
B. Penetration Rates Across Economic Areas (EAs) ....................................................................... 169<br />
C. Net Adds/Subscriber Growth....................................................................................................... 171<br />
1. Industry-Wide Subscriber Net Adds ..................................................................................... 171<br />
2. <strong>Mobile</strong> <strong>Wireless</strong> Net Adds by Pricing Plan........................................................................... 173<br />
3. <strong>Mobile</strong> <strong>Wireless</strong> Net Adds by Service Provider.................................................................... 175<br />
D. Output and Usage Levels............................................................................................................. 176<br />
1. <strong>Mobile</strong> Voice......................................................................................................................... 176<br />
2. <strong>Mobile</strong> Messaging ................................................................................................................. 178<br />
3. <strong>Mobile</strong> Data Traffic (Non-Messaging).................................................................................. 181<br />
E. Pricing Levels, Changes, and Trends........................................................................................... 185<br />
1. Price Indicators...................................................................................................................... 185<br />
2. Wholesale Pricing.................................................................................................................. 194<br />
3. Intercarrier Roaming Rates and Revenue.............................................................................. 196<br />
F. Revenue ....................................................................................................................................... 200<br />
G. Investment.................................................................................................................................... 208<br />
H. Profitability .................................................................................................................................. 214<br />
1. Measuring Profitability.......................................................................................................... 215<br />
I. Network Quality .......................................................................................................................... 222<br />
J. Economic Impact of <strong>Mobile</strong> <strong>Wireless</strong> Services........................................................................... 225<br />
VI. MOBILE WIRELESS SERVICES: CONSUMER BEHAVIOR ...................................................... 228<br />
A. Consumer Switching Costs.......................................................................................................... 229<br />
1. Access to Information on <strong>Mobile</strong> <strong>Wireless</strong> Services............................................................. 231<br />
2. Early Termination Fees (ETFs)............................................................................................. 234<br />
3. Handsets, Handset Locking, and Handset Applications........................................................ 239<br />
4. Number Portability................................................................................................................ 242<br />
B. Churn as a Measure of Consumer Switching Costs..................................................................... 244<br />
VII.INPUT AND DOWNSTREAM SEGMENTS OF THE MOBILE WIRELESS ECOSYSTEM....... 249<br />
A. Input Segments ............................................................................................................................ 249<br />
1. Spectrum................................................................................................................................ 250<br />
a. Availability of <strong>Mobile</strong> <strong>Wireless</strong> Services Spectrum....................................................... 251<br />
(i) Frequency Bands ...................................................................................................... 253<br />
(ii) Facilitating Access to Spectrum Among Multiple Providers ................................... 260<br />
b. Analysis of Spectrum Holdings Overall ......................................................................... 265<br />
c. Analysis of Spectrum Holdings by Spectrum Characteristics ........................................ 268<br />
d. Competitive Effects of Spectrum Holdings .................................................................... 281<br />
2. Infrastructure Facilities.......................................................................................................... 284<br />
a. Background..................................................................................................................... 284<br />
b. Communications Tower Industry ................................................................................... 285<br />
c. Barriers to Cell Site Deployment.................................................................................... 287<br />
2
Federal Communications Commission <strong>FCC</strong> 10-81<br />
d. Competitive Effects of Infrastructure Costs and the Independent Communications<br />
Tower Industry................................................................................................................ 290<br />
3. Backhaul Facilities ................................................................................................................ 293<br />
a. Background..................................................................................................................... 293<br />
b. Competitive Landscape................................................................................................... 295<br />
c. The Growing Need for Backhaul Solutions and Alternatives......................................... 297<br />
B. Downstream Segments................................................................................................................. 299<br />
1. <strong>Mobile</strong> <strong>Wireless</strong> Handsets/Devices and Operating Systems................................................. 299<br />
a. Handsets/Devices............................................................................................................ 300<br />
b. Key Factors Affecting <strong>Mobile</strong> <strong>Wireless</strong> <strong>Competition</strong> .................................................... 311<br />
(i) Bundling of <strong>Wireless</strong> Service Subscriptions with the Purchase of Handsets........... 312<br />
(ii) Exclusive Handset Arrangements ............................................................................ 316<br />
2. <strong>Mobile</strong> Applications.............................................................................................................. 318<br />
3. <strong>Mobile</strong> Commerce................................................................................................................. 333<br />
VIII. INTERMODAL COMPETITION ............................................................................................... 339<br />
A. Voice Services ............................................................................................................................. 339<br />
B. Broadband Services ..................................................................................................................... 341<br />
C. <strong>Wireless</strong> Local Area Networks and <strong>Wireless</strong>-Wireline Convergence ......................................... 343<br />
IX. URBAN-RURAL COMPARISONS.................................................................................................. 351<br />
X. INTERNATIONAL COMPARISONS .............................................................................................. 359<br />
A. ARPU........................................................................................................................................... 360<br />
B. Average Revenue Per Minute ...................................................................................................... 361<br />
C. Usage ........................................................................................................................................... 362<br />
D. Penetration Rates ......................................................................................................................... 363<br />
E. Concentration............................................................................................................................... 364<br />
XI. CONCLUSION .................................................................................................................................. 368<br />
XII.PROCEDURAL MATTERS.............................................................................................................. 369<br />
APPENDIX A: Spectrum for <strong>Mobile</strong> <strong>Wireless</strong> Services<br />
APPENDIX B: <strong>Mobile</strong> <strong>Wireless</strong> Network Technologies<br />
APPENDIX C: Tables<br />
APPENDIX D: Maps<br />
APPENDIX E: List of Commenters<br />
3
Federal Communications Commission <strong>FCC</strong> 10-81<br />
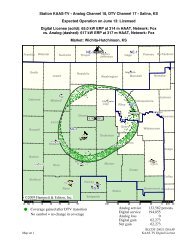
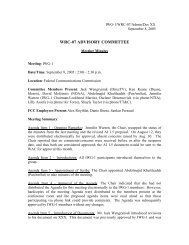
Map 1: <strong>Mobile</strong> <strong>Wireless</strong> Competitors<br />
4
Federal Communications Commission <strong>FCC</strong> 10-81<br />
I. EXECUTIVE SUMMARY<br />
1. In this <strong>Mobile</strong> <strong>Wireless</strong> <strong>Competition</strong> <strong>Report</strong>, we present our findings regarding the state<br />
of competition in the mobile services marketplace, pursuant to Congress’s instruction in section<br />
332(c)(1)(C) of the Communications Act. Promoting competition is a fundamental goal of the<br />
Commission’s policymaking. <strong>Competition</strong> has played and must continue to play an essential role in<br />
mobile – leading to lower prices and higher quality for American consumers, and producing new waves<br />
of innovation and investment in wireless networks, devices, and services.<br />
2. In this <strong>Mobile</strong> <strong>Wireless</strong> <strong>Competition</strong> <strong>Report</strong> to Congress (Fourteenth <strong>Report</strong> or <strong>Report</strong>),<br />
we incorporate several important new forms of analysis that reflect fundamental shifts in the mobile<br />
marketplace. For example, whereas previous reports analyzed Commercial <strong>Mobile</strong> Radio Service<br />
(CMRS) competition and discussed a variety of metrics – including number of providers, subscribers,<br />
usage, and prices – this <strong>Report</strong> integrates an analysis of CMRS into an analysis of all mobile wireless<br />
services, such as voice, messaging, and broadband. This <strong>Report</strong> also goes beyond previous reports in<br />
reflecting the transformative importance of mobile wireless broadband, which has resulted in a shift from<br />
devices that can place traditional phone calls to pocketable devices that can access the entire Internet.<br />
Because each of the interrelated segments of the mobile wireless ecosystem has the potential to affect<br />
competition, this <strong>Report</strong> analyzes competition across the entire mobile wireless ecosystem, including, for<br />
the first time, in-depth analyses of “upstream” and “downstream” market segments, such as infrastructure<br />
and devices.<br />
3. As described in this <strong>Mobile</strong> <strong>Wireless</strong> <strong>Competition</strong> <strong>Report</strong>, the mobile wireless ecosystem<br />
is sufficiently complex that any review or analysis of competitive market conditions must take into<br />
consideration a multitude of factors. As a result, rather than reaching an overarching, industry-wide<br />
determination with respect to whether there is “effective competition,” the <strong>Report</strong> complies with the<br />
statutory requirement by providing a detailed analysis of the state of competition that seeks to identify<br />
areas where market conditions appear to be producing substantial consumer benefits and provides data<br />
that can form the basis for inquiries into whether policy levers could produce superior outcomes. 1 As the<br />
mobile wireless marketplace evolves, driven in particular by mobile wireless broadband and data usage,<br />
the Commission’s analyses and policies with respect to key inputs – such as spectrum – also must evolve<br />
in order to ensure a robust level of competition going forward.<br />
4. The <strong>Report</strong> – which reflects market conditions prevailing in 2008 and 2009 2 – finds<br />
evidence of several key trends in the mobile wireless industry:<br />
• Maturation of the <strong>Mobile</strong> Voice Segment. As of the end of 2008, 90 percent of Americans had a<br />
mobile wireless device, and Americans used these devices to talk for an average of 709 minutes<br />
each month. While usage statistics have generally increased over time, this year marks the first<br />
instance of reduced (though still substantial) voice usage, perhaps due to increased reliance on<br />
text and multimedia messaging. Voice revenues stayed relatively steady compared to past<br />
periods, with average revenue per user (ARPU) slightly decreasing but revenue per minute<br />
(RPM) slightly increasing.<br />
• Transition to a Data-Centric Market. Data traffic has grown significantly, due to the increased<br />
adoption of smartphones and data consumption per device. Indeed, with overall revenue per<br />
1<br />
For a more detailed discussion of our analysis of effective competition, as required by Section 332(c) of the<br />
Communications Act, see paragraphs 11-16 infra.<br />
2 Where possible, the <strong>Report</strong> uses the most current data available, including network coverage data from American<br />
Roamer from the fourth quarter of 2009. In other instances, particularly where year-end metrics are discussed or<br />
annual comparisons are made, the <strong>Report</strong> uses year-end 2008 data. See Section II, Introduction, infra, for an<br />
additional discussion of data timeframes.<br />
5
Federal Communications Commission <strong>FCC</strong> 10-81<br />
mobile customer generally remaining flat the past several years, revenue from newer data services<br />
is replacing revenue from traditional services.<br />
• Proliferation of Devices and Applications. Handset manufacturers have introduced a growing<br />
number of smartphones that provide mobile Internet access and other data services, and use<br />
operating systems that provide many of the functionalities of personal computers. The four<br />
nationwide providers launched about 67 new smartphones in 2008 and 2009, based upon several<br />
different platforms (e.g., Apple iPhone, Android, BlackBerry, Palm, and Windows <strong>Mobile</strong>). The<br />
Android and iPhone platforms have been particularly successful in creating an entire ecosystem<br />
of applications and services. As of December 2009, there were over 100,000 applications on the<br />
Apple App Store, and 15,000 on the Android Market.<br />
• Continued Industry Concentration. Over the past five years, concentration has increased in the<br />
provision of mobile wireless services. The two largest providers, AT&T, Inc. (AT&T) and<br />
Verizon <strong>Wireless</strong>, have 60 percent of both subscribers and revenue, and continue to gain share<br />
(accounting for 12.3 million net additions in 2008 and 14.1 million during 2009). The two nextlargest<br />
providers, T-<strong>Mobile</strong> USA (T-<strong>Mobile</strong>) and Sprint Nextel Corp. (Sprint Nextel), had a<br />
combined 1.7 million net loss in subscribers during 2008 and gained 827,000 subscribers during<br />
2009. One widely-used measure of industry concentration indicates that concentration has<br />
increased 32 percent since 2003 and 6.5 percent in the most recent year for which data is<br />
available.<br />
• Robust Capital Investment but Declining Relative to Industry Size. Providers continue to invest<br />
significant capital in networks, despite the recent economic downturn. One source reports capital<br />
investment at around $25 billion in both 2005 and 2008, while another shows that capital<br />
investment declined from around $25 billion to around $20 billion during the same period and<br />
that investment during the first half of 2009 was $8.9 billion. Because industry revenue has<br />
continued to grow, both sources show that capital investment has declined as a percentage of<br />
industry revenue over the same period (from 20 percent to 14 percent). 3<br />
• Role of Spectrum for <strong>Mobile</strong> Broadband. Especially as mobile wireless data usage grows,<br />
spectrum becomes an increasingly pivotal input. In particular, lower-frequency spectrum<br />
possesses superior propagation characteristics that create certain advantages in the provision of<br />
mobile wireless broadband service, especially in rural areas. Lower-frequency spectrum<br />
potentially allows for a higher quality of coverage with fewer cell sites, when compared to other<br />
frequency bands used to provide mobile services. Conversely, higher-frequency spectrum may be<br />
effective for increasing capacity, particularly within smaller, more densely-populated geographic<br />
areas. Recent auctions reflect that lower frequency bands are more highly valued than higher<br />
frequencies. A significant portion of spectrum below 1 GHz is held by the two largest providers:<br />
67 percent of the 700 MHz band, and 91 percent of the Cellular band, based on megahertz-POPs<br />
(MHz-POPs). 4<br />
Selected developments and key metrics with respect to the current state of mobile wireless competition<br />
are highlighted below:<br />
Number of Providers & Network Deployment<br />
For the third consecutive <strong>Report</strong>, the Commission has conducted an analysis of service provider coverage<br />
3<br />
All dollar figures included in this <strong>Report</strong> have not been adjusted for inflation (i.e., they are nominal dollars) unless<br />
stated otherwise.<br />
4<br />
“MHz-POPs” refers to the amount of spectrum in a given license or set of frequencies multiplied by the population<br />
covered by the geographic area of the spectrum license. For example, the MHz-POPs of a 20 megahertz license<br />
covering a geographic area with a population of 1,000 would be 20,000.<br />
6
Federal Communications Commission <strong>FCC</strong> 10-81<br />
by census block, based on data from American Roamer 5 and population data from the 2000 Census. 6<br />
<strong>Mobile</strong> Voice Providers. The coverage analysis suggests that approximately 284 million people, or 99.6<br />
percent of the U.S. population, are served by one or more mobile voice providers. Approximately 281<br />
million people, or 98.6 percent of the population, are served by at least two mobile voice providers.<br />
Approximately 273 million people, or 95.8 percent of the population, are served by at least three mobile<br />
voice providers.<br />
<strong>Mobile</strong> Broadband Providers. Approximately 280 million people, or 98.1 percent of the U.S. population,<br />
are served by one or more mobile broadband providers, 7 according to the coverage analysis.<br />
Approximately 255 million people, or 89.5 percent of the U.S. population, are served by two or more<br />
mobile broadband providers. Approximately 217 million people, or 76.1 percent of the population, are<br />
served by at least three mobile broadband providers. During 2008 and 2009, the four nationwide mobile<br />
wireless service providers (AT&T, Verizon <strong>Wireless</strong>, Sprint Nextel and T-<strong>Mobile</strong>), as well as other<br />
mobile operators, continued to expand service into new markets and to upgrade their networks with<br />
mobile broadband technologies. They also announced plans to deploy 4G network technologies.<br />
5 We note that the American Roamer analysis likely overstates the coverage actually experienced by consumers,<br />
because American Roamer reports advertised coverage as reported to it by many mobile wireless service providers,<br />
each of which uses a different definition of coverage. The data do not expressly account for factors such as signal<br />
strength, bit rate, or in-building coverage, and they may convey a false sense of consistency across geographic areas<br />
and service providers. Nonetheless, the analysis is useful because it provides a quantitative baseline that can be<br />
compared across network types, technologies, and carriers, over time. Connecting America: The National<br />
Broadband Plan, <strong>FCC</strong>, at 39 (Chapter 4) (rel. Mar. 16, 2010), available at www.broadband.gov (National<br />
Broadband Plan). We also recognize that an analysis of coverage at the nationwide level provides only a general<br />
benchmark. A nationwide average will mask regional disparities in coverage and create an overall picture that does<br />
not capture variances across the country. See Section III.C.1, Number of Competitors, infra.<br />
6 Unless otherwise noted, population data in the <strong>Report</strong> is taken from U.S. Census Bureau (Census Bureau). For<br />
purposes of calculating numbers on broader geographic bases, such as the nationwide penetration rate, we use<br />
Census Bureau population estimates as of July 1, 2008. See infra note 473. For purposes of calculating the extent<br />
of service provision based on census blocks, we use 2000 Census population figures because that is the Census<br />
Bureau’s most recent data about population at the census block level.<br />
7 For purposes of this <strong>Report</strong>, “mobile broadband” refers to mobile Internet access and other data services provided<br />
using Third Generation (3G) and Fourth Generation (4G) mobile network technologies, CDMA EV-DO,<br />
WCDMA/HSPA, and WiMAX. Therefore, this coverage analysis estimates the U.S. population, based on census<br />
blocks, covered by these technologies. See Section IV.B.1, Network Coverage and Technology Upgrades and<br />
Appendix B, <strong>Mobile</strong> <strong>Wireless</strong> Network Technologies, infra, for an additional discussion.<br />
7
Federal Communications Commission <strong>FCC</strong> 10-81<br />
3G/4G Deployment by Selected <strong>Mobile</strong> <strong>Wireless</strong> Service Providers<br />
Service<br />
Provider<br />
3G Deployment 4G Deployment<br />
AT&T As of October 2009, HSPA network Plans LTE trials in 2010 and deployment<br />
covered 230 million POPs in more than 350<br />
metropolitan areas.<br />
in 2011.<br />
Verizon As of mid-2009, EV-DO network covered Expects to launch LTE in 25-30 markets<br />
<strong>Wireless</strong> 284 million POPs.<br />
in 2010 and to cover 285 million POPs by<br />
2013.<br />
Clearwire Not applicable. As of September 2009, WiMAX network<br />
covered over 10 million POPs, expected<br />
to cover 120 million POPs by end of<br />
2010.<br />
Sprint As of August 2009, EV-DO network Ownership interest in Clearwire and<br />
Nextel covered 271 million POPs.<br />
reselling Clearwire WiMAX service.<br />
T-<strong>Mobile</strong> As of August 2009, HSPA network covered<br />
121 million POPs, expected to cover 200<br />
million POPs by year-end 2009.<br />
No U.S.-specific plans.<br />
The following table, again using data from the census block coverage analysis based on American<br />
Roamer data, depicts the growth in population coverage for mobile wireless broadband service over the<br />
past year:<br />
Subscribers and Net Adds<br />
<strong>Mobile</strong> <strong>Wireless</strong> Broadband Network Population Coverage,<br />
Selected Facilities-Based Providers<br />
Service<br />
Provider<br />
Covered POPs<br />
November 2008<br />
(millions)<br />
8<br />
Covered POPs<br />
November 2009<br />
(millions)<br />
AT&T 189.0 212.3<br />
Verizon <strong>Wireless</strong> 241.7 266.7<br />
Sprint Nextel 218.9 226.9<br />
T-<strong>Mobile</strong> 88.4 133.9<br />
Alltel 57.7 --<br />
Leap 19.7 79.2<br />
US Cellular 13.1 26.6<br />
With wireless market penetration approaching 90 percent as of the end of 2008, overall wireless industry<br />
growth has slowed down. At the end of 2008, based upon Numbering Resource Utilization Forecast<br />
(NRUF) data, there were over 277 million mobile wireless subscribers in the United States, up from 263<br />
million at the end of 2007. As of the end of 2008, there were 25.1 million mobile wireless high-speed<br />
Internet access subscribers and 86 million mobile high-speed-capable devices in use in the United States.
Year<br />
Federal Communications Commission <strong>FCC</strong> 10-81<br />
<strong>Mobile</strong> <strong>Wireless</strong> Subscribership<br />
Subscribers Subscribers -<br />
Increase from<br />
Previous Year<br />
9<br />
Penetration Rate Penetration Rate<br />
– Percent<br />
Increase from<br />
Previous Year<br />
(millions) (millions) (percent) (percent)<br />
NRUF* CTIA NRUF CTIA NRUF CTIA NRUF CTIA<br />
1999 n/a 86 n/a 16.8 n/a 32% n/a 23%<br />
2000 n/a 109.5 n/a 23.4 n/a 39% n/a 21%<br />
2001 128.5 128.4 n/a 18.9 45% 45% n/a 16%<br />
2002 141.8 140.9 13.3 12.4 49% 49% 9% 9%<br />
2003 160.6 158.7 18.8 18 54% 55% 10% 12%<br />
2004 184.7 182.1 24.1 23.4 62% 62% 15% 14%<br />
2005 213 207.9 28.3 25.8 71% 70% 15% 13%<br />
2006 241.8 233 28.8 25.1 80% 78% 13% 11%<br />
2007 263 255.4 21.2 22.4 86% 85% 7% 9%<br />
2008 277.6 270.3 14.6 14.9 90% 89% 5% 5%<br />
*NRUF data is not available for the calendar years prior to 2001.<br />
Industry net new subscriber additions (or “net adds”) totaled between 14.5 and 15 million during 2008, a<br />
33 percent drop from the 2007 net additions.<br />
Net adds have not been distributed evenly among major service providers. The two largest providers<br />
garnered 12.3 million net new subscribers during 2008 and 14.1 million during 2009, while the two nextlargest<br />
providers combined lost 1.7 million subscribers during 2008 and gained 827,000 subscribers<br />
during 2009.<br />
Service Provider Subscribers<br />
Year-End<br />
2008<br />
(Thousands)<br />
Net Additions by Service Provider<br />
2008 Net<br />
Additions<br />
(Loss)<br />
2008<br />
Percent<br />
Increase<br />
(Loss)<br />
Subscribers<br />
Year-End<br />
2009<br />
(Thousands)<br />
2009 Net<br />
Additions<br />
(Loss)<br />
2009<br />
Percent<br />
Increase<br />
(Loss)<br />
AT&T 77,009 6,785 9.7% 85,120 8,111 10.5%<br />
Verizon <strong>Wireless</strong>** 72,056 5,558 8.4% 91,249 19,193 26.6%<br />
Sprint Nextel 48,338 (4,667) (8.8%) 48,133 (205) (0.4%)<br />
T-<strong>Mobile</strong> 32,758 2,973 10.0% 33,790 1,032 3.2%<br />
Alltel 13,219 (181) (1.4%) -- -- --<br />
US Cellular 6,196 74 1.2% 6,141 (55) (0.9%)<br />
MetroPCS 5,367 1,404 35.4% 6,640 1,273 23.7%<br />
Leap 3,845 981 34.3% 4,954 1,109 28.8%<br />
**Verizon <strong>Wireless</strong>’s 2009 subscriber figures include subscribers added as a result of the Alltel merger. If<br />
subscribers from the Alltel acquisition were excluded, Verizon <strong>Wireless</strong>’s “organic” net adds for 2009 would total<br />
approximately 5.97 million, an increase of 8.3 percent.<br />
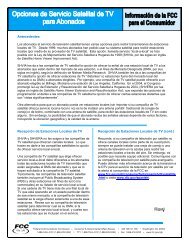
Churn<br />
During the past year, churn has increased slightly from 1.9 percent to around 2.1 percent per month, with<br />
pre-paid churn rates significantly higher than post-paid churn rates. Churn rates of the two largest<br />
national service providers are half the rates for the next two largest providers.
Usage<br />
Monthly Churn %<br />
6.0%<br />
5.0%<br />
4.0%<br />
3.0%<br />
2.0%<br />
1.0%<br />
0.0%<br />
Source: Bernstein Research<br />
Monthly Churn Percentage<br />
3.5%<br />
3.0%<br />
2.5%<br />
2.0%<br />
1.5%<br />
1.0%<br />
0.5%<br />
0.0%<br />
Source: Bernstein Research<br />
Federal Communications Commission <strong>FCC</strong> 10-81<br />
Comparative Churn<br />
2005 2006 2007 2008 2Q 2009<br />
Post-paid churn Pre-paid/reseller churn Total (Blended) Churn<br />
Annual Churn is an average for each of the four quarters<br />
National Operators: Blended Churn<br />
(<strong>Report</strong>ed)<br />
2005 2006 2007 2008 2Q 2009<br />
AT&T Mobility Sprint Nextel T-<strong>Mobile</strong><br />
Verizon <strong>Wireless</strong> Industry Wtd. Average<br />
Annual Churn is an average for each of the four quarters. Verizon <strong>Wireless</strong> is combined with Alltel churn.<br />
In 2008, wireless voice usage per subscriber declined for the first time in 11 years. At the same time, use<br />
of text messaging and other wireless data services increased over the previous year. The decline in voice<br />
minutes-of-use, coupled with the increase in data use, suggests that although only about 40 percent of<br />
consumers currently use data services, these consumers may be substituting data services, such as text<br />
messaging, for traditional voice services. The following data describe top-line usage trends for specific<br />
10
service segments:<br />
Federal Communications Commission <strong>FCC</strong> 10-81<br />
Voice: Average minutes-of-use per subscriber per month (MOUs) declined to about 708 minutes<br />
for the six months ending in December 2008, 8 down from 769 minutes in the same period of<br />
2007, and the first decrease in MOUs since 1997.<br />
Text Messaging: The average mobile wireless subscriber sent 388 text messages per month<br />
during the second half of 2008, a 169 percent increase from the 144 text messages sent per month<br />
during the same period of 2007.<br />
Multimedia Messaging: The average mobile wireless subscriber sent 5.8 multimedia messages<br />
(MMS) per month during the second half of 2008, a 152 percent increase from the 2.3 multimedia<br />
messages sent per month during the same period of 2007.<br />
<strong>Mobile</strong> Broadband Services: The wireless industry does not currently report aggregate or persubscriber<br />
mobile broadband/Internet traffic metrics (i.e., megabytes (MB) consumed).<br />
Nonetheless, one analyst estimates per-subscriber mobile data traffic by type of device and found<br />
that traditional handset users generate, on average, 25 MB of traffic each month, BlackBerry<br />
users generate 54 MB, iPhone users generate 275 MB, other smartphone users generate 150 MB,<br />
and laptop “aircard” users generate 1.4 gigabytes (GB).<br />
CPI and Unit Prices<br />
Two measures of pricing for wireless services are the Consumer Price Index (CPI) and unit price (revenue<br />
per user per month divided by average unit consumption per month). The annual Cellular CPI decreased<br />
by approximately 0.2 percent from 2007 to 2008, while the overall CPI increased by 3.8 percent during<br />
this period. After many years of declines, voice revenue per minute was $0.054 in December 2008, an<br />
increase of two percent from 2007. This slight increase reflects that a reported decrease in voice ARPU<br />
was more than offset by a decrease in minutes of use per subscriber per month (see below).<br />
The price of messaging services, on an average price per unit basis, continued to decline in 2008.<br />
Average revenue per text message in 2008 decreased by $0.014 from the prior year, from $0.025 in 2007<br />
to $0.011 per message in 2008. Average revenue per text message was $0.036 in 2006.<br />
Revenue and ARPU<br />
Revenues for the mobile wireless industry have increased each year between 2004 and 2008, although the<br />
annual growth rate for industry revenues has been declining since 2007. Total mobile wireless industry<br />
revenue grew to $150.6 billion in 2008, up from $140.9 billion in 2007 for a 6.9 percent increase (a more<br />
modest annual growth rate than the prior year, when industry revenue was $127.1 million in 2006). For<br />
the first half of 2009, industry revenue totaled $75.8 billion, a 4.3 percent increase over the first half of<br />
2008.<br />
Voice revenues grew to $118.3 billion in 2008 from approximately $117.7 billion in 2007, text messaging<br />
revenues grew to $11.4 billion in 2008 from approximately $9 billion in 2007, and other data revenues –<br />
including MMS and Internet access – grew to $21.0 billion in 2008 from $14.3 billion in 2007.<br />
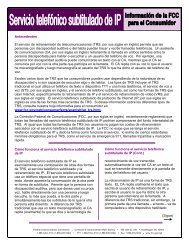
Monthly ARPU remained nearly unchanged between 2007 and 2008, increasing $0.01 from $47.08 to<br />
$47.09. The average wireless consumer pays approximately $565 per year for service and the average<br />
household (of 2.5 persons) pays $1,271 per year for service. An average American household spends<br />
about the same proportion of its income on wireless services as it spends on electricity (2.5 percent on<br />
wireless services and 2.7 percent on electricity). Total ARPU has generally been flat over the past several<br />
years. Voice ARPU, which excludes the portion of ARPU generated by data, continued to decline<br />
between 2007 and 2008, decreasing from $39.32 to $36.98 per month. Declining monthly voice ARPU<br />
was offset by continued growth in monthly ARPU for text and other data services, such as mobile<br />
8 Data is averaged over a six-month period.<br />
11
Federal Communications Commission <strong>FCC</strong> 10-81<br />
broadband. Text ARPU increased from $3.00 in 2007 to $3.55 in 2008 per month. Monthly ARPU for<br />
other data services, such as mobile Internet access and mobile messaging service, also continued to<br />
increase, rising from $4.76 in 2007 to $6.56 in 2008. In 2008, monthly ARPU for text and other data<br />
services accounted for approximately 21 percent of total monthly ARPU, up from approximately 16<br />
percent in 2007, and compared to about 4 percent in 2004.<br />
Monthly Average Revenue Per User<br />
(ARPU)<br />
$55.0<br />
$50.0<br />
$45.0<br />
$40.0<br />
$35.0<br />
$30.0<br />
$25.0<br />
$20.0<br />
$49.41<br />
$1.55<br />
$0.63<br />
Voice ARPU Calculation incl. Toll revenues<br />
Profitability<br />
Monthly ARPU by Type: 2004 - 2008<br />
(unadjusted dollars)<br />
$47.72<br />
$2.31<br />
$1.24<br />
$47.23 $44.17 $41.21 $39.32 $36.98<br />
12<br />
$46.82 $47.08 $47.09<br />
$3.52<br />
$2.09<br />
$4.76<br />
$3.00<br />
$6.56<br />
2004 2005 2006 2007 2008<br />
Voice ARPU Text ARPU Other Data ARPU<br />
$3.55<br />
Source: CTIA & Analyst Data, <strong>FCC</strong> Analysis<br />
Measures of profitability are useful indicators of absolute and relative provider performance, entry and<br />
exit conditions, growth conditions, and the intensity of rivalry. Because measuring the profitability of<br />
firms in a capital-intensive industry such as the mobile wireless industry is not as straightforward as in<br />
other industries, industry analysts often employ more than one measure. Analysts sometimes use<br />
Earnings Before Interest, Taxes, Depreciation, and Amortization (EBITDA) as an indicator of<br />
profitability, but this metric does not include the substantial cost of capital investment in tangible assets<br />
such as networks or in intangible assets such as spectrum licenses. For the first time, the <strong>Report</strong> includes<br />
indicators of service provider profitability – measured by EBITDA margin (EBITDA divided by service<br />
revenue), by EBITDA per subscriber, and by EBITDA minus capital expenditures (EBITDA minus<br />
CAPEX) per subscriber. While the seven largest mobile wireless service providers all had EBITDA<br />
margins over 20 percent during the second quarter of 2009, only four – AT&T, MetroPCS, T-<strong>Mobile</strong>, and<br />
Verizon <strong>Wireless</strong> – had EBITDA margins greater than 30 percent, and the two largest providers had the<br />
highest EBITDA margins. In addition, these two providers had the highest EBITDA minus CAPEX per<br />
subscriber of the top four providers in 2007 and 2008.
Percent<br />
60.0%<br />
50.0%<br />
40.0%<br />
30.0%<br />
20.0%<br />
10.0%<br />
Federal Communications Commission <strong>FCC</strong> 10-81<br />
<strong>Report</strong>ed EBITDA Margins: 2002 – 2009 (Selected Providers)<br />
0.0%<br />
US Cellular<br />
T-<strong>Mobile</strong><br />
13<br />
Verizon <strong>Wireless</strong><br />
Sprint Nextel<br />
Leap <strong>Wireless</strong><br />
Verizon <strong>Wireless</strong> 39.5% 39.7% 39.5% 46.8% 43.2% 43.6% 47.5% 46.3%<br />
T-<strong>Mobile</strong> 9.1% 16.5% 18.5% 32.0% 29.8% 29.8% 31.1% 33.1%<br />
Leap <strong>Wireless</strong> 5.7% 29.5% 29.4% 31.6% 17.1% 28.2% 17.7% 23.5%<br />
US Cellular 23.7% 25.9% 24.6% 21.0% 25.2% 26.4% 21.3% 28.9%<br />
Sprint Nextel 34.8% 34.6% 35.4% 28.7% 21.6% 21.7%<br />
AT&T 31.1% 34.4% 38.2% 35.8% 38.3%<br />
Metro PCS 28.9% 29.4% 29.9% 29.2% 30.5%<br />
AT&T<br />
2002 (Q4) 2003 (Q4) 2004 (Q4) 2005 (Q4) 2006 (Q4) 2007 (Q4) 2008 (Q4) 2009 (Q2)
Federal Communications Commission <strong>FCC</strong> 10-81<br />
EBITDA minus CAPEX per Subscriber per Month (Selected Providers)<br />
$ Per Subscriber per Month<br />
$20.0<br />
$15.0<br />
$10.0<br />
$5.0<br />
$0.0<br />
2006 2007 2008<br />
AT&T $5.91 $14.00 $12.38<br />
Sprint Nextel $9.67 $7.84 $8.52<br />
T-<strong>Mobile</strong> $7.37 $8.15 $6.61<br />
Verizon <strong>Wireless</strong> $11.77 $13.83 $16.52<br />
14
Federal Communications Commission <strong>FCC</strong> 10-81<br />
Subscriber Net Additions vs. EBITDA Per Subscriber: 2008<br />
Sprint Nextel<br />
$30.0<br />
$25.0<br />
$20.0<br />
$15.0<br />
$10.0<br />
$5.0<br />
$0.0<br />
15<br />
T-<strong>Mobile</strong><br />
Verizon<br />
(6,000) (4,000) (2,000) 0 2,000 4,000 6,000 8,000<br />
Source: Analyst <strong>Report</strong>s, Company Data<br />
Market Concentration<br />
EBITDA per Subscriber<br />
2008 Annual Net Additions<br />
AT&T Verizon Sprint Nextel T-<strong>Mobile</strong><br />
The Herfindahl-Hirschman Index (HHI) is used to measure concentration of mobile wireless service<br />
providers. Average HHI (weighted by Economic Area (EA) population) increased in 2008 relative to<br />
prior years. Both the lowest EA HHI value and the highest EA HHI value are both higher than preceding<br />
years’ lowest and highest EA HHI values. The weighted average of the HHIs (weighted by EA<br />
population) was 2848 in 2008, an increase from 2674 in 2007. The weighted average HHI has increased<br />
by nearly 700 since we first calculated this metric in 2003.<br />
HHI<br />
3000<br />
2800<br />
2600<br />
2400<br />
2200<br />
2000<br />
Average Herfindahl-Hirschman Index<br />
2003 2004 2005 2006 2007 2008<br />
Year<br />
AT&T
Investment<br />
Federal Communications Commission <strong>FCC</strong> 10-81<br />
Data from the Census Bureau suggests that, after decreasing by more than 20 percent between 2006 and<br />
2007, capital expenditures by wireless providers rebounded in 2008, increasing by approximately 15<br />
percent over the previous year to more than $25.5 billion. CTIA–The <strong>Wireless</strong> Association (CTIA),<br />
however, reports that incremental capital investment by wireless operators totaled $20.2 billion in 2008, a<br />
4.4 percent decrease from the $21.14 spent in 2007 and a 20 percent decrease from the $25.2 billion spent<br />
in 2005. CTIA also reports that capital investment for the first half of 2009 totaled $8.9 billion, a seven<br />
percent drop from the first half of 2008.<br />
Data from both CTIA and the Census Bureau show that annual capital investment as a percentage of total<br />
industry revenue has been declining. According to CTIA data, capital expenditures, as a percentage of<br />
total revenue, declined from 22 percent in 2005 to 14 percent in 2008. According to CTIA, 2008 saw an<br />
increase in the pace of new cell site deployment, with nearly 29,000 cell sites deployed (compared to<br />
about 18,000 the prior year).<br />
Incremental Cell sites<br />
35,000<br />
30,000<br />
25,000<br />
20,000<br />
15,000<br />
10,000<br />
5,000<br />
0<br />
Source: CTIA<br />
12,739<br />
<strong>Mobile</strong> <strong>Wireless</strong> Handsets/Devices<br />
7,964<br />
16<br />
11,924<br />
17,686<br />
28,831<br />
2004 2005 2006 2007 2008<br />
<strong>Wireless</strong> handsets have evolved from the more traditional handsets that offer basic features such as voice<br />
and text messaging, to smartphones that offer Internet connectivity. Over the past two years, the industry<br />
has experienced an increase in smartphone adoption, led by the Apple iPhone. Smartphones accounted<br />
for 44 percent of total handsets sold in the third quarter of 2009, up from 27 percent in the second quarter<br />
of 2008.
60%<br />
50%<br />
40%<br />
30%<br />
20%<br />
10%<br />
0%<br />
27%<br />
29%<br />
24%<br />
Federal Communications Commission <strong>FCC</strong> 10-81<br />
Smartphone Adoption Rates in the United Sates<br />
30%<br />
29%<br />
30%<br />
39%<br />
31%<br />
35%<br />
17<br />
46%<br />
27%<br />
37%<br />
47%<br />
35%<br />
41%<br />
50%<br />
39%<br />
2Q2008 3Q2008 4Q2008 1Q2009 2Q2009 3Q2009<br />
Percentage of Smartphones as of Total Handset Sales<br />
Percentage of Smartphones as of Total Handset Upgrades<br />
Percentage of Smartphones as of Total Gross Adds<br />
The iPhone’s share of the smartphone business segment has grown as well, from 5 percent in the first<br />
quarter of 2008 to 17 percent in the third quarter of 2009. Google’s Android operating system was also a<br />
notable development in 2008-2009. The emergence of new smartphone operating systems – Apple,<br />
Android, Research in Motion Ltd. (RIM) BlackBerry, Palm, and Windows <strong>Mobile</strong> – represents a shift in<br />
the mobile wireless ecosystem. In addition to launching new smartphones, several service providers<br />
began offering a range of data-only devices, including netbook computers with embedded modems,<br />
wireless data cards, and mobile Wi-Fi hotspots.<br />
Spectrum<br />
Spectrum is a necessary component of providing mobile wireless service. Sufficient access to spectrum<br />
with propagation characteristics suited to the efficient provision of mobile broadband service may be a<br />
contributing factor in the ability of a wireless service provider to compete effectively. Access to lowerfrequency<br />
spectrum may account for some of the disparities in operating economics among providers.<br />
Backhaul<br />
Consumers are increasingly adopting Internet-connected mobile computing devices, such as smartphones,<br />
for purposes such as video and Internet browsing. Such data services consume greater amounts of<br />
bandwidth than traditional voice services, resulting in a greater need for backhaul capacity. Further, the<br />
rollout of 4G networks using Long Term Evolution (LTE) and WiMAX technologies, which support<br />
higher data throughput rates and lower latencies, will make access to sufficient backhaul for wireless<br />
service even more critical over time. While copper circuits currently serve as the predominant choice for<br />
backhaul, fixed wireless (including microwave) and fiber solutions are gaining popularity. Allowing the<br />
more efficient installation of fiber facilities, as well as providing for the more flexible use of microwave<br />
frequencies for backhaul, may help promote access to backhaul solutions that are critical to the<br />
deployment of wireless broadband and other services.<br />
44%
Roaming<br />
Federal Communications Commission <strong>FCC</strong> 10-81<br />
While reported annual roaming traffic has grown, roaming minutes as a percentage of total minutes has<br />
dropped significantly. Roaming minutes increased from 13 billion minutes in 1999 to 121.4 billion<br />
minutes in 2008. Yet this growth has been much slower than overall traffic growth, which increased from<br />
147.7 billion minutes to 2.2 trillion minutes. Therefore, roaming as a percentage of overall traffic has<br />
decreased from 8.8 percent in 1999 to 5.5 percent in 2008, a relative decline of nearly 40 percent.<br />
Service Quality<br />
The J.D. Power and Associates (J.D. Power) 2009 <strong>Wireless</strong> Call Quality Performance Study (Volume 1)<br />
indicates that network quality for the industry overall has held steady since the 2008 study, with the<br />
number of problems reported by consumers remaining virtually unchanged at 15 problems per 100 calls.<br />
Intermodal <strong>Competition</strong><br />
In the first half of 2009, 22.7 percent of households (or more than one out of every five), were wirelessonly,<br />
up from 17.5 percent in the first half of 2008, 13.6 percent in the first half of 2007, and 10.5 percent<br />
in the first half of 2006. The percentages of adults and children living in such households are depicted in<br />
the chart below:<br />
Urban-Rural Comparisons<br />
Roughly 61 million people, or 21 percent of the U.S. population (including Puerto Rico), live in rural<br />
counties (defined as counties with a population density of 100 persons or fewer per square mile). These<br />
counties comprise 3.1 million square miles, or 86 percent of the geographic area of the United States.<br />
Analysis based on American Roamer data shows that 98.5 percent of the U.S. rural population, based on<br />
census blocks, receives coverage by at least one mobile wireless voice provider. 9 In addition, 94.5<br />
percent of the rural population lives in census blocks with two or more mobile voice operators competing<br />
to offer service, 83.1 percent live in census blocks with at least three competing mobile voice operators,<br />
and 65.5 percent live in census blocks with at least four competing mobile voice operators. The figures<br />
on the percentage of the U.S. rural population covered by a certain number of providers are similar to<br />
those in the Thirteenth <strong>Report</strong>. In that <strong>Report</strong>, the Commission estimated, based on July 2007 American<br />
Roamer data, that 94.2 percent of the rural population had a choice of at least two providers, 82.1 percent<br />
9 See infra note 5 for a discussion of American Roamer data.<br />
18
Federal Communications Commission <strong>FCC</strong> 10-81<br />
of the rural population had a choice of at least three providers, and 65.2 percent had a choice of at least<br />
four providers.<br />
Total Number of<br />
Providers in a<br />
Block<br />
Estimated <strong>Mobile</strong> Voice Providers in Rural Areas by Census Block<br />
Number of<br />
Rural Blocks<br />
POPs<br />
Contained in<br />
Rural Blocks<br />
19<br />
% of Total<br />
U.S. POPs<br />
Square Miles<br />
Contained in<br />
Those Blocks<br />
% of Total<br />
U.S. Square<br />
Miles<br />
Total for Rural U.S. 4,169,790 60,836,650 21.3% 3,367,687 88.6%<br />
% of Total<br />
Rural U.S.<br />
POPs<br />
% of Total<br />
Rural US<br />
Square Miles<br />
1 or More 3,937,968 59,907,519 98.5% 2,310,870 68.6%<br />
2 or More 3,575,744 57,469,158 94.5% 1,759,319 52.2%<br />
3 or More 2,831,795 50,527,557 83.1% 1,131,548 33.6%<br />
4 or More 1,978,475 39,828,360 65.5% 641,065 19.0%<br />
5 or More 979,198 23,413,805 38.5% 257,068 7.6%<br />
6 or More 220,472 5,327,376 8.8% 50,192 1.5%<br />
7 or More 17,056 369,429 0.6% 3,918 0.1%<br />
Source: Commission estimates based on data supplied by American Roamer, Oct. 2009.<br />
Notes: POPs are from the 2000 Census, and the square miles include the United States and Puerto Rico.<br />
Looking at mobile broadband service, the U.S. population in rural areas is not served by as many mobile<br />
broadband providers as other areas of the country. While 76 percent of the total U.S. population lives in<br />
census blocks with three or more mobile broadband providers, only 30 percent of the rural population is<br />
served by at least three broadband providers. In addition, 58 percent of the total U.S. population lives in<br />
census blocks with four or more mobile broadband providers; in rural areas, only ten percent of the<br />
population is served by four or more providers. 10<br />
Estimated <strong>Mobile</strong> Broadband Providers in Rural Areas by Census Block<br />
Total Number of<br />
Providers in a<br />
block<br />
Number of<br />
Blocks<br />
POPs Contained<br />
in Those Blocks<br />
% of Rural<br />
U.S. POPs<br />
Square Miles<br />
Contained in<br />
Those Blocks<br />
% of Rural<br />
U.S.<br />
Square<br />
Miles<br />
1 or More 3,422,482 55,990,890 92.0% 1,688,928 50.2%<br />
2 or More 1,889,535 37,592,392 61.8% 706,670 21.0%<br />
3 or More 635,043 18,032,174 29.6% 142,609 4.2%<br />
4 or More 160,703 6,350,563 10.4% 24,500 0.7%<br />
Source: Commission estimates based on data supplied by American Roamer, Nov. 2009 (EV-<br />
DO/HSDPA/WiMAX Coverage).<br />
Notes: POPs are from the 2000 Census, and the square miles include the United States and Puerto Rico.<br />
International Comparisons<br />
A comparison of the United States market with other developed markets reveals that consumers in the<br />
United States pay relatively more on a monthly basis than most other countries but also consume more<br />
airtime and enjoy lower unit rates. Despite the decrease in MOUs from 2007 to 2008, U.S. mobile<br />
subscribers continue to lead the world in voice usage by a substantial margin, with Western European<br />
10 See Section III.C.1, Number of Competitors, infra.
Federal Communications Commission <strong>FCC</strong> 10-81<br />
subscribers averaging 158 MOUs and Japanese subscribers averaging 139 MOUs, compared to more than<br />
700 minutes in the United States. Japan has the highest average monthly bill (ARPU) for mobile services<br />
($56.82), followed by the United States ($51.54). The U.S. average monthly bill is significantly higher<br />
than the Western European average ($33.45). At $0.05 per minute, mobile calls remained less expensive<br />
on a per minute basis in the United States than in Western Europe, where voice RPM averaged $0.16 at<br />
the end of 2008, and Japan, where voice RPM averaged $0.26 at the end of 2008. At nearly 90 percent,<br />
U.S. mobile penetration is lower than average mobile penetration in Western Europe (128 percent) but<br />
higher than mobile penetration in Japan (86 percent).<br />
Country Penetration Prepaid MOUs Revenue per ARPU Data<br />
(% of Pops) (% of Subs)<br />
Minute ($) ($) (% of ARPU)<br />
Receiving Party Pays<br />
USA 88.9 17.1 829 0.05 51.54 25.5<br />
Canada 64.8 21.2 444 0.09 49.24 17.8<br />
Hong Kong 147.6 44.9 447 0.04 20.40 26.7<br />
Singapore 135.8 48.6 377 0.06 32.08 27.3<br />
Calling Party Pays<br />
UK 125.5 62.0 192 0.12 35.35 27.8<br />
Germany 130.6 56.6 102 0.16 20.59 25.3<br />
Italy 152.7 88.3 131 0.16 26.87 24.7<br />
Sweden 123.6 35.0 206 0.10 28.05 20.9<br />
France 91.9 34.2 246 0.14 44.37 18.3<br />
Finland 127.5 12.7 244 0.12 33.91 18.9<br />
Japan 85.7 1.4 139 0.26 56.82 41.0<br />
South Korea 93.9 3.0 320 0.08 30.34 17.0<br />
Australia 109.9 44.9 218 0.11 34.57 32.4<br />
20
Federal Communications Commission <strong>FCC</strong> 10-81<br />
II. INTRODUCTION<br />
5. In 1993, Congress created the statutory classification of Commercial <strong>Mobile</strong> Radio<br />
Services 11 (CMRS) to promote the consistent regulation of mobile radio services that are similar in<br />
nature. 12 At the same time, Congress established the promotion of competition as a fundamental goal for<br />
CMRS policy formation and regulation. To measure progress toward this goal, Congress required the<br />
Commission to submit annual reports that analyze competitive conditions in the industry. 13<br />
6. Congress called on the Commission to report on “competitive market conditions with<br />
respect to commercial mobile services.” 14 In particular, the statute requiring the annual report on CMRS<br />
competition states:<br />
The Commission shall review competitive market conditions with respect to commercial<br />
mobile services and shall include in its annual report an analysis of those conditions.<br />
Such analysis shall include an identification of the number of competitors in various<br />
commercial mobile services, an analysis of whether or not there is effective competition,<br />
an analysis of whether any of such competitors have a dominant share of the market for<br />
such services, and a statement of whether additional providers or classes of providers in<br />
those services would be likely to enhance competition. 15<br />
In the Thirteenth <strong>Report</strong>, the Commission found effective competition in the CMRS market based on a<br />
variety of metrics, including the number of providers, subscribers, usage, and prices. 16 Since the period<br />
covered by the Thirteenth <strong>Report</strong>, CMRS competition has grown stronger by some of the measures<br />
previously considered, but weaker by others. To better comply with Congress’s mandate to assess market<br />
conditions, this <strong>Report</strong> looks beyond the metrics considered in the Thirteenth <strong>Report</strong> and undertakes a<br />
11 Commercial <strong>Mobile</strong> Services came to be known as the Commercial <strong>Mobile</strong> Radio Services, or “CMRS.” CMRS<br />
includes a large number of terrestrial services and some mobile satellite services. See 47 C.F.R. § 20.9(10).<br />
12 The Omnibus Budget Reconciliation Act of 1993, Pub. L. No. 103-66, Title VI, § 6002(b), amending the<br />
Communications Act of 1934 and codified at 47 U.S.C. § 332(c). As in the past, this <strong>Report</strong> bases its analysis on a<br />
consumer-oriented view of mobile services by focusing on specific product categories, regardless of their regulatory<br />
classification. In some cases, this includes an analysis of offerings outside the umbrella of “services” specifically<br />
designated as CMRS. However, because these other services can affect competition in the CMRS market and<br />
because providers of these other services can compete with CMRS providers, the Commission has indicated that it is<br />
important to consider them in the analysis. As the Commission said, paraphrasing the Department of Justice/Federal<br />
Trade Commission guidelines on merger review, “When one product is a reasonable substitute for the other in the<br />
eyes of consumers, it is to be included in the relevant product market even though the products themselves are not<br />
identical.” Application of Echostar Communications Corporation, General Motors Corporation, and Hughes<br />
Electronics Corporation (Transferors) and Echostar Communications Corporation (Transferee), Hearing<br />
Designation Order, 17 <strong>FCC</strong> Rcd 20559, 20606, 106 (2002).<br />
13 47 U.S.C. § 332(c)(1)(C).<br />
14 47 U.S.C. § 332(c)(1)(C). As noted in previous <strong>Report</strong>s, any individual proceeding in which the Commission<br />
defines relevant product and geographic markets, such as an application for approval of a license transfer, may<br />
present facts pointing to narrower or broader markets than any used, suggested, or implied in this <strong>Report</strong>. See, e.g.,<br />
Implementation of Section 6002(b) of the Omnibus Budget Reconciliation Act of 1993, Annual <strong>Report</strong> and Analysis<br />
of Competitive Market Conditions with Respect to Commercial <strong>Mobile</strong> Services, Twelfth <strong>Report</strong>, 23 <strong>FCC</strong> Rcd 2241,<br />
2252, n. 5 (2008) (Twelfth <strong>Report</strong>).<br />
15 47 U.S.C. § 332 (c)(1)(C).<br />
16 Implementation of Section 6002(b) of the Omnibus Budget Reconciliation Act of 1993, Annual <strong>Report</strong> and<br />
Analysis of Competitive Market Conditions with Respect to Commercial <strong>Mobile</strong> Services, Thirteenth <strong>Report</strong>, 24<br />
<strong>FCC</strong> Rcd 6185 (WTB 2009) (Thirteenth <strong>Report</strong>).<br />
21
Federal Communications Commission <strong>FCC</strong> 10-81<br />
more expansive and detailed analysis of the mobile wireless industry than past reports.<br />
7. In order to improve upon the competitive analysis of previous <strong>Report</strong>s, the <strong>Wireless</strong><br />
Telecommunications Bureau, in May 2009, released a Public Notice soliciting data and information in<br />
order to evaluate the state of competition among providers of CMRS. 17 The Fourteenth <strong>Report</strong> Public<br />
Notice sought comment generally on which indicators are useful for analyzing competitive market<br />
conditions with respect to CMRS. 18 In August 2009, the Commission released a Notice of Inquiry (NOI)<br />
seeking to expand and enhance its understanding of mobile wireless competition in various ways. 19 The<br />
NOI requested input on the analytic framework the Commission should use to examine and describe<br />
competition in the mobile wireless market. 20 The August 2009 NOI also sought information on the<br />
competitive effects of vertical relationships between wireless service providers and other markets that<br />
supply inputs that are required to produce the services, applications, and content used by consumers. 21 In<br />
particular, it sought comment on the various input segments, the contractual relationships firms in these<br />
segments have with providers of mobile wireless services, and the effects of these relationships on mobile<br />
wireless competition. 22<br />
8. The Fourteenth <strong>Report</strong> integrates data on market conditions with respect to CMRS into a<br />
general analysis of competition in the mobile wireless services marketplace. Many providers of CMRS<br />
also offer a variety of mobile data services, including mobile broadband Internet access service, which is<br />
not classified as “CMRS,” 23 and other mobile data services whose regulatory status the Commission has<br />
not addressed. 24 For the Fourteenth <strong>Report</strong>, our analysis of the mobile wireless services industry includes<br />
voice, messaging, and broadband services because they often jointly use the same spectrum, network<br />
facilities, and customer equipment; and many mobile providers have integrated the marketing of these<br />
services, often offering them in bundles. Also, consumers are increasingly substituting among voice,<br />
messaging, and data services, and, in particular, are willing to substitute from voice to messaging or data<br />
services for an increasing portion of their communication needs.<br />
17<br />
“<strong>Wireless</strong> Telecommunications Bureau Seeks Comment on Commercial <strong>Mobile</strong> Radio Services Market<br />
<strong>Competition</strong>,” WT Docket No. 09-66, Public Notice, 24 <strong>FCC</strong> Rcd 5618 (WTB 2009) (Fourteenth <strong>Report</strong> Public<br />
Notice).<br />
18<br />
Fourteenth <strong>Report</strong> Public Notice, 24 <strong>FCC</strong> Rcd at 5619-5620.<br />
19 Implementation of Section 6002(b) of the Omnibus Budget Reconciliation Act of 1993, Annual <strong>Report</strong> and<br />
Analysis of Competitive Market Conditions with Respect to <strong>Mobile</strong> <strong>Wireless</strong>, including Commercial <strong>Mobile</strong><br />
Services, Notice of Inquiry, 24 <strong>FCC</strong> Rcd 11357, 11359, 5 (2009) (<strong>Competition</strong> <strong>Report</strong> NOI).<br />
20 Id.<br />
21 Id. See Appendix E for a list of commenters.<br />
22 <strong>Competition</strong> <strong>Report</strong> NOI, 24 <strong>FCC</strong> Rcd at 11364-11366, 23-27.<br />
23 In 2007, the Commission classified wireless broadband Internet access service as an information service under the<br />
Communications Act and found that wireless broadband Internet access service using mobile technologies was not a<br />
“commercial mobile service” as defined in the Act. Appropriate Regulatory Treatment for Broadband Access to the<br />
Internet over <strong>Wireless</strong> Networks, WT Docket No. 07-53, Declaratory Ruling, 22 <strong>FCC</strong> Rcd 5201 (2007).<br />
24 We note that the regulatory classification of a particular wireless service offered by a CMRS carrier is determined<br />
on a case-by-case basis. See Amendment of the Commission’s Rules to Permit Flexible Service Offerings in the<br />
Commercial <strong>Mobile</strong> Radio Service, WT Docket No. 96-6, Second <strong>Report</strong> and Order and Order on Reconsideration,<br />
15 <strong>FCC</strong> Rcd 14680, 14683, 7, 14687, 15 (2000). Aside from broadband Internet access service, the regulatory<br />
classification of services and applications that rely on Internet Protocol (IP-enabled services) is pending. See IP-<br />
Enabled Services, WC Docket No. 04-36, Notice of Proposed Rulemaking, 19 <strong>FCC</strong> Rcd 4863 (2004). In addition,<br />
the Bureau has sought comment on a petition seeking clarification on the regulatory classification of text messaging<br />
services. See “<strong>Wireless</strong> Telecommunications Bureau Seeks Comment on Petition for Declaratory Ruling That Text<br />
Messages and Short Codes Are Title II Services or Are Title I Services Subject to Section 202 Non-Discrimination<br />
Rules,” Public Notice, 23 <strong>FCC</strong> Rcd 262 (WTB 2008).<br />
22
Federal Communications Commission <strong>FCC</strong> 10-81<br />
9. The ongoing transition of mobile wireless services from interconnected mobile voice<br />
service to an array of voice, messaging, and broadband services provided on previous and next generation<br />
mobile networks has contributed to the growth in diverse mobile wireless market segments that are<br />
involved in bringing these information products to consumers. These interrelated market segments form<br />
the mobile wireless ecosystem, the various parts of the supply and production network that bring<br />
thousands of mobile wireless products to Americans every day. Each of the segments in the mobile<br />
wireless ecosystem has the potential to affect competitive and consumer outcomes in the mobile wireless<br />
services segment. As a result, unlike previous annual reports on the state of CMRS competition, 25 this<br />
<strong>Report</strong> analyzes competition across the entire mobile wireless ecosystem, expanding its analysis to<br />
include new “upstream” and “downstream” market segments such as device and infrastructure, and how<br />
the vertical relationships among these segments affect mobile wireless competition. 26<br />
10. Figure 1 below provides an illustration of the mobile wireless ecosystem and the sections<br />
of the Fourteenth <strong>Report</strong> in which each of the ecosystem segments is discussed. The input segments are<br />
divided into spectrum, towers, network equipment, and backhaul facilities. 27 Following these inputs, the<br />
transmission of mobile wireless services includes voice services, messaging services, 28 and data services<br />
(including broadband). The downstream segments include mobile devices, device operating systems, and<br />
mobile applications, content, and mobile commerce. 29 <strong>Mobile</strong> devices, the endpoints of mobile networks,<br />
are the last of many links in mobile wireless networks that connect consumers to the network. For more<br />
and more consumers, mobile devices are evolving from voice-only handsets to handheld computers with<br />
sophisticated operating systems capable of supporting many of the same functionalities and software<br />
applications of personal computers (e.g., Internet browsers, video players, and e-mail programs). <strong>Mobile</strong><br />
devices can also include devices that do not even provide circuit-switched voice service, such as modems<br />
for portable computers and electronic books. The final layer of the mobile wireless ecosystem consists of<br />
the information products that are transmitted over mobile data networks and directly consumed by<br />
subscribers. These information goods include mobile applications, content (e.g., video and music files,<br />
web sites, photos, and documents), and mobile commerce (e.g., electronic shopping and financial<br />
transactions using a mobile device). It is recognized that these input segments can affect entry,<br />
competition, output, or prices in the provision of mobile wireless services. The importance of the<br />
downstream segments to consumers’ mobile wireless experience is increasing with the deployment of<br />
mobile broadband networks that support Internet-based applications.<br />
25 See Implementation of Section 6002(b) of the Omnibus Budget Reconciliation Act of 1993, Annual <strong>Report</strong> and<br />
Analysis of Competitive Market Conditions with Respect to Commercial <strong>Mobile</strong> Services, First <strong>Report</strong>, 10 <strong>FCC</strong><br />
Rcd 8844 (1995); Second <strong>Report</strong>, 12 <strong>FCC</strong> Rcd 11266 (1997); Third <strong>Report</strong>, 13 <strong>FCC</strong> Rcd 19746 (1998); Fourth<br />
<strong>Report</strong>, 14 <strong>FCC</strong> Rcd 10145 (1999); Fifth <strong>Report</strong>, 15 <strong>FCC</strong> Rcd 17660 (2000); Sixth <strong>Report</strong>, 16 <strong>FCC</strong> Rcd 13350<br />
(2001); Seventh <strong>Report</strong>, 17 <strong>FCC</strong> Rcd 12985 (2002); Eighth <strong>Report</strong>, 18 <strong>FCC</strong> Rcd 14783 (2003); Ninth <strong>Report</strong>, 19<br />
<strong>FCC</strong> Rcd 20597 (2004); Tenth <strong>Report</strong>, 20 <strong>FCC</strong> Rcd 15908 (2005); Eleventh <strong>Report</strong>, 21 <strong>FCC</strong> Rcd 10947 (2006);<br />
Twelfth <strong>Report</strong>, 23 <strong>FCC</strong> Rcd 2241; Thirteenth <strong>Report</strong>, 24 <strong>FCC</strong> Rcd 6185. The reports can also be found on the<br />
Commission’s website at http://wireless.fcc.gov/index.htm?job=cmrs_reports.<br />
26 Commenters have supported expansion of the analysis of the mobile wireless ecosystem. See, e.g., California<br />
PUC Reply at 2; New Jersey Division of Rate Council Comments at 4.<br />
27 Spectrum, towers, network equipment, and backhaul facilities can be viewed as input or upstream markets<br />
because of their input relation to mobile wireless networks.<br />
28 Messaging includes text and multimedia (photo and video) message services, also referred to as SMS (Short<br />
Message Service) and MMS (multimedia messaging services), respectively.<br />
29 <strong>Mobile</strong> devices, device operating systems, and mobile applications, content, and mobile commerce can be viewed<br />
as edge or downstream markets because they are products that utilize mobile wireless services.<br />
23
INPUT/<br />
UPSTREAM<br />
SEGMENTS<br />
SPECTRUM<br />
(Section VII.A.1)<br />
TOWERS<br />
(Section VII.A.2)<br />
NETWORK<br />
EQUIPMENT<br />
(Section VII.A.2)<br />
BACKHAUL<br />
(Section VII.A.3)<br />
Federal Communications Commission <strong>FCC</strong> 10-81<br />
Figure 1. <strong>Mobile</strong> <strong>Wireless</strong> Ecosystem<br />
MOBILE<br />
WIRELESS<br />
SERVICES<br />
(Sections III-VI)<br />
VOICE<br />
MESSAGING<br />
DATA<br />
11. In this <strong>Report</strong>, the discussion of the middle part of the mobile wireless ecosystem –<br />
mobile wireless services – includes a detailed analysis of mobile wireless service market conditions,<br />
including an analysis of whether there is effective competition in the CMRS market, as required by<br />
Section 332(c) of the Act. As discussed above, the statute requires an identification of the number of<br />
competitors in the various commercial mobile services, an analysis of whether any of the competitors<br />
have a dominant share of the market for the services, and a statement of whether additional providers or<br />
classes of providers in the services would be likely to enhance competition. In May 2009, the <strong>Wireless</strong><br />
Telecommunications Bureau released a Public Notice seeking comment on which indicators are the most<br />
relevant for analyzing competitive market conditions and whether any specific criteria should be used to<br />
more precisely define a standard of effective competition. 30<br />
12. This competitive analysis of mobile wireless services in the Fourteenth <strong>Report</strong> considers<br />
data that provide information on whether any wireless service provider is exercising undue market power<br />
– the ability to profitably charge prices above cost for a sustained period of time due to a lack of<br />
competitive constraints. 31 This analysis has been organized in four distinct categories: market structure,<br />
provider conduct, market performance, and consumer behavior. 32 First, within market structure, the<br />
30 Fourteenth <strong>Report</strong> Public Notice, 24 <strong>FCC</strong> Rcd at 5619-5621.<br />
31 See Dennis W. Carlton and Jeffrey M. Perloff, Modern Industrial Organization (4 th ed.), Addison, Wesley,<br />
Longman, Inc., 2005, at 8, 249-251 (Modern Industrial Organization).<br />
32 This organization is a variant of the Structure-Conduct-Performance framework in economics. We employ this<br />
framework as a taxonomy to organize the data, and we recognize the modern critique of economists that this<br />
framework is a descriptive model and some of its assumptions are not found in current economic models. See, e.g.,<br />
Modern Industrial Organization at 2, 268. Numerous commenters supported the use of this framework. See, e.g.,<br />
(continued….)<br />
24<br />
EDGE/DOWNSTREAM<br />
SEGMENTS<br />
DEVICES<br />
OPERATING SYSTEMS<br />
(Section VII.B.1)<br />
APPS<br />
(Section VII.B.2)<br />
CONTENT<br />
(Section VII.B.2)<br />
MOBILE<br />
COMMERCE<br />
(Section VII.B.3)
Federal Communications Commission <strong>FCC</strong> 10-81<br />
number of competitors is analyzed and measures of concentration are calculated because there is some<br />
relation between the ability to exercise market power and market concentration, i.e., without competitors<br />
or potential entry, there can be no competitive constraints on market power. The <strong>Report</strong> also investigates<br />
entry and exit of wireless service providers, the potential for any antitrust violations in the mobile<br />
wireless market, and the existence of any intermodal sources of competition. These factors provide<br />
additional valuable information on the amount of competitive pressure existing in the mobile wireless<br />
services market that can serve to restrain exercises of market power. Entry and exit conditions may affect<br />
the number of competitors that can enter and compete in the market, and, as discussed above, this in turn<br />
can influence whether any firm can exercise undue market power. Mergers, a type of exit, are closely<br />
reviewed by the Commission because mergers can potentially form stronger competitors that restrain<br />
competitors from exercising market power. At the same time, a merger may increase the risk that the<br />
merged firm may itself exercise undue market power. Last, although mobile wireless services have some<br />
unique characteristics, we regularly assess whether intermodal sources of competition (e.g., wireline,<br />
fixed wireless, and satellite communication services) can or will place competitive pressure on mobile<br />
wireless service providers.<br />
13. Second, price and non-price rivalry are examined as part of provider conduct. We<br />
discuss product differentiation, network investment and technology upgrades, advertising and marketing,<br />
and innovation because such non-price modes of competition can impose significant competitive<br />
constraints, especially in high technology industries that experience rapid innovation.<br />
14. Third, the section on market performance evaluates evidence of the outcomes of<br />
competitive conditions in the mobile wireless industry from the consumer’s point of view, focusing on the<br />
benefits to consumers of competition, such as lower prices, higher consumption, and better quality. In<br />
contrast, the sections on market structure, provider conduct, and consumer behavior examine various<br />
structural and behavioral determinants of such market outcomes. Within market performance, prices of<br />
services across competitors provide more direct evidence of competitive outcomes and the strength of<br />
competitive rivalry than do measures of concentration. The study of prices also provides evidence of any<br />
unusual increases or upward trends in prices. In addition, the quantity of services consumed is analyzed<br />
because exercises of undue market power are often accompanied by observable restrictions on the<br />
quantity of services produced. 33<br />
15. Accordingly, this <strong>Report</strong> complies with the statutory requirements for analyzing<br />
competitive market conditions with respect to commercial mobile services by employing the competition<br />
analysis described above. We analyze the extent of competitive pressure and rivalry present in the mobile<br />
wireless market, the benefits received by consumers, and trends in indicators of firm rivalry and consumer<br />
benefits over time. This analysis of competitive conditions also tries to identify areas where competition<br />
is strong and also areas that could benefit from increased competition. In some cases, the <strong>Report</strong> provides<br />
data that can form the basis for in-depth proceedings, special oversight, or targeted regulations that could<br />
promote competition and consumer welfare.<br />
16. The mobile wireless ecosystem is sufficiently complex such that no single definition of<br />
effective competition adequately encompasses both general indicators of competition and challenges<br />
inherent in the mobile wireless industry, such as spectrum availability, network interconnection issues,<br />
(Continued from previous page)<br />
Mercatus NOI Comments at 2; CTIA NOI Comments at 72-75, and Verizon <strong>Wireless</strong> NOI Comments at 2, 7, 8, and<br />
12.<br />
33 See Ernest Gellhorn, Antitrust Law and Economics (4 th ed.), West Publishing, 1994, at 117 (stating “Market<br />
shares are not synonymous with market power; they should mark the beginning for careful analysis, not the end of<br />
it.”) (Antitrust Law and Economics). See also, Michael Whinston, Antitrust Policy toward Horizontal Mergers, in<br />
Handbook of Industrial Organization, Volume 3, edited by Mark Armstrong and Robert Porter, at 2411-2414;<br />
Massimo Motta, <strong>Competition</strong> Policy: Theory and Practice, Cambridge University Press, at 117 (<strong>Competition</strong><br />
Policy).<br />
25
Federal Communications Commission <strong>FCC</strong> 10-81<br />
and network access issues. 34 Further, there is no definition of “effective competition” that is widely<br />
accepted by economists or competition policy authorities such as the U.S. Department of Justice (DOJ). 35<br />
The DOJ’s position on competition policy is in agreement with the approach taken in the Fourteenth<br />
<strong>Report</strong>. 36 The DOJ states, “[t]he operative question in competition policy is whether there are policy<br />
levers that can be used to produce superior outcomes, not whether the market resembles the textbook<br />
model of perfect competition.” 37 We note as well that the Commission’s first seven Annual CMRS<br />
<strong>Competition</strong> <strong>Report</strong>s did not include an overall conclusion regarding whether or not the CMRS<br />
marketplace was effectively competitive. Instead, they provided an analysis and description of the CMRS<br />
industry’s competitive metrics and trends. Thus, this <strong>Report</strong> returns to the approach of those <strong>Report</strong>s, but<br />
with an expanded and more detailed analysis of the entire mobile wireless ecosystem.<br />
17. Structure of the <strong>Report</strong>. The Fourteenth <strong>Report</strong> addresses the markets and market<br />
segments that constitute the mobile wireless ecosystem. The mobile wireless services market, including<br />
CMRS, is addressed in Sections III - VI. These sections follow the market structure-provider conductmarket<br />
performance-consumer behavior competitive analysis framework described above. The input<br />
segments of the mobile wireless services market are analyzed in Section VII.A and the handset/device<br />
market, mobile applications, and mobile commerce are analyzed in Section VII.B. Intermodal<br />
<strong>Competition</strong> is discussed in Section VIII. Differences across Geographic Markets, including Urban-Rural<br />
Comparisons and International Comparisons, are addressed in Section IX. The Appendices discuss<br />
spectrum available for mobile wireless services (Appendix A), provide an extended discussion on mobile<br />
wireless network technologies (Appendix C), and present tables and maps (Appendix D).<br />
18. Data Timeframes. The Fourteenth <strong>Report</strong> focuses on conditions prevailing in the mobile<br />
wireless industry during 2008 and 2009. Given that the industry is dynamic and that market conditions<br />
are rapidly evolving, we strive to use the most recent data available in our analysis. In cases where our<br />
analysis relies on annual year-end metrics – such as with subscribership levels, penetration rates, and<br />
concentration – we use, and have included in the <strong>Report</strong>, year-end 2008 data. In other cases, where our<br />
analysis is based on metrics reported quarterly or semi-annually, we have included data through the<br />
second or third quarter of 2009, or mid-2009, respectively. The <strong>Report</strong>’s analysis of network coverage<br />
and the number of providers is based on data provided by American Roamer in October 2009 (for voice<br />
or overall network coverage) and November 2009 (for mobile broadband and next-generation network<br />
coverage). Many sections of the <strong>Report</strong> also discuss major industry developments, where relevant, that<br />
occurred during 2009 and early 2010.<br />
19. Dollar Amounts. Dollar figures stated in this <strong>Report</strong> have not been adjusted for inflation<br />
(i.e., they are nominal dollars) unless stated otherwise.<br />
34 See e.g., Ex Parte Submission of the United States Department of Justice, GN Docket No. 09-51, at 11 (filed Jan.<br />
4, 2010) (stating that “[w]e do not find it helpful to define an abstract notion of whether or not broadband markets<br />
are ‘competitive.’”); AT&T PN Comment at 10 (stating that “[r]eal world markets are incredibly complex and<br />
cannot be simplified to “silver bullet” or bright-line indicator metrics”). We also note that the Commission’s first<br />
seven Annual CMRS <strong>Competition</strong> <strong>Report</strong>s did not include an overall conclusion regarding whether or not the<br />
CMRS marketplace was effectively competitive.<br />
35 See Ex Parte Submission of the United States Department of Justice, GN Docket No. 09-51 at 11 (filed Jan. 4,<br />
2010).<br />
36 See id.<br />
37 Id.<br />
26
Federal Communications Commission <strong>FCC</strong> 10-81<br />
III. MOBILE WIRELESS SERVICES: INDUSTRY STRUCTURE<br />
A. Introduction<br />
20. <strong>Mobile</strong> <strong>Wireless</strong> Services. The Fourteenth <strong>Report</strong> provides an analysis of competition in<br />
the mobile wireless services industry. Providers of mobile wireless services offer an array of mobile<br />
voice and data services, including interconnected mobile voice services, text and multimedia messaging,<br />
and mobile broadband Internet access services. The <strong>Report</strong> considers information and data on the mobile<br />
wireless services industry as a whole as well as on each of the individual segments where appropriate.<br />
From the standpoint of competitive analysis, the <strong>Report</strong> considers, for several reasons, the mobile<br />
wireless services industry as a whole rather than providing separate competitive analyses of all of the<br />
various segments.<br />
21. First, a mobile wireless service provider may offer voice and data services using the same<br />
spectrum and network infrastructure. Therefore, it is difficult to extricate the cost structure of different<br />
services, which would be essential in determining comparative profitability or other important analyses.<br />
22. Second, consumers typically receive mobile voice and data services on a single end-user<br />
device and purchase these services from a single provider. Although mobile data services are not always<br />
offered in conjunction with mobile voice service (e.g., mobile Internet access on a laptop computer or the<br />
wireless network connection for an e-reader such as Amazon.com Inc.’s (Amazon) Kindle), mobile<br />
wireless subscribers who use their handsets for data services typically purchase these services as either an<br />
add-on to voice services or as part of a bundled voice and data plan; in some cases, they may not be able<br />
to purchase data services independent of voice services. The combination of these factors may affect<br />
competition across the entire mobile wireless services industry and impact consumer choice with respect<br />
to these services.<br />
23. Third, the availability of certain data employed in this <strong>Report</strong> reflects the entire mobile<br />
wireless services industry and not the individual segments. For example, the NRUF data provide an<br />
estimate of all mobile wireless devices in use that have a telephone number assigned to them. 38 This<br />
includes traditional mobile handsets used primarily or exclusively for voice calls, as well as smartphones<br />
that are used for both voice and data services and devices used exclusively for data services, such as<br />
wireless modem aircards or e-readers. 39 The NRUF data do not distinguish by the type of device used.<br />
24. Defining the appropriate size of the local geographic area for mobile wireless services is<br />
necessary to assess competition. A basic economic principle for defining the scope of the relevant<br />
geographic area for a competitive analysis is to include the customers of a geographic area who face<br />
similar competitive alternatives. Because mobile wireless consumers are generally not willing to search<br />
for competitive alternatives that do not serve their local areas, the relevant geographic area is a local area.<br />
Accordingly, assessing competition in mobile wireless services at the national level could overstate the<br />
level of competition and industry concentration because the total number of providers in the entire United<br />
States exceeds the number of providers that compete with each other in any single region in which a<br />
consumer searches for a wireless provider. For example, two facilities-based providers that do not have<br />
overlapping network coverage do not directly compete with each other.<br />
25. Defining the appropriate extent of the local geographic area for mobile wireless services<br />
is a highly complex exercise due to various factors, including: (1) the variety of geographic schemes used<br />
to license different spectrum bands; (2) the wide variation in providers’ geographic footprints; (3) the<br />
relatively large number of licensed providers; and (4) the difficulty of collecting accurate information on<br />
the geographic coverage of each mobile operator’s network in its license area(s). In this <strong>Report</strong>, we base<br />
38 See Section V.A, Subscribership Levels, infra.<br />
39 Even though data-only devices, such as wireless modem cards, mobile Wi-Fi devices, and e-readers, are not used<br />
to make circuit-switched voice calls, they are typically assigned telephone numbers because that is the method<br />
wireless service providers use to establish accounts and provide access to their networks.<br />
27
Federal Communications Commission <strong>FCC</strong> 10-81<br />
our analysis of market concentration on uniform geographic areas that may be broader or narrower than<br />
the relevant geographic markets employed in other analyses conducted by the Commission. We estimate<br />
network coverage and the number of competitors serving an area using census blocks, and we provide<br />
concentration measures at the level of EAs. EAs are geographic units defined by the U.S. Department of<br />
Commerce that define geographic economic markets using data on commuting patterns. Although the<br />
Commission typically uses smaller geographic areas to calculate HHIs when it evaluates the competitive<br />
consequences of certain transactions, we use EAs in this <strong>Report</strong> to maintain continuity with past <strong>Report</strong>s<br />
and to ensure that we do not compromise the confidential information found in the NRUF data. 40<br />
B. Overview of Service Providers<br />
1. Facilities-Based Providers<br />
26. Facilities-based mobile wireless service providers offer mobile voice, messaging, and/or<br />
data services using their own network facilities. Most facilities-based providers currently offer circuitswitched<br />
mobile voice services that are interconnected with the public switched telephone network<br />
(PSTN). Many of the data and messaging services offered by facilities-based providers rely only on IPbased,<br />
packet-switched networks, while other services may continue to connect to the PSTN. Most<br />
mobile wireless voice providers also offer data-only services – such as mobile wireless Internet access for<br />
portable computers or mobile Wi-Fi hotspot 41 connections – that are not bundled in a service plan with a<br />
mobile voice service. Certain mobile wireless service providers, such as Clearwire Corporation<br />
(Clearwire), offer mobile broadband data services but do not offer circuit-switched mobile voice<br />
services. 42 Facilities-based providers compete with each other in offering individual mobile wireless<br />
services, as well as bundles of complementary services (e.g., mobile voice, text, and data services) in the<br />
same service plan designed to meet the voice and data communication needs of customers.<br />
27. As of year-end 2008, there were four facilities-based mobile wireless service providers in<br />
the United States that industry observers typically describe as “nationwide”: AT&T, Sprint Nextel, 43 T-<br />
<strong>Mobile</strong>, 44 and Verizon <strong>Wireless</strong>. 45 When a facilities-based provider is described as being nationwide, it<br />
does not literally mean that the provider’s network covers the entire land area or entire population of the<br />
United States. 46 The four facilities-based providers that analyst reports typically describe as nationwide<br />
all have mobile wireless networks that cover in excess of 86 percent of the U.S. population in large<br />
proportions of the western, mid-western, and eastern United States. 47 A map of the combined coverage<br />
40 See also Section III.C.2, Concentration Measures, infra.<br />
41 <strong>Mobile</strong> Wi-Fi hotspot devices, such as the Novatel MiFi, can provide mobile broadband Internet access to<br />
multiple Wi-Fi-enabled devices, such netbooks, MP3 players, and smartphones.<br />
42<br />
Fixed wireless services, such as those offered by Stelera <strong>Wireless</strong>, are currently not included in our analysis of<br />
mobile wireless services.<br />
43<br />
Sprint Nextel was created by the merger of Sprint Corp. and Nextel Communications, Inc. See Tenth <strong>Report</strong>, 20<br />
<strong>FCC</strong> Rcd at 15931, 60.<br />
44 T-<strong>Mobile</strong> USA is a wholly-owned subsidiary of Deutsche Telekom AG (Deutsche Telekom).<br />
45 Verizon <strong>Wireless</strong> is the brand name of Cellco Partnership. See Cellco Partnership, SEC Form 10-Q, filed Oct. 29,<br />
2009, at 5. Verizon <strong>Wireless</strong> is a joint venture of Verizon Communications, Inc. (Verizon) and Vodafone Group<br />
PLC (Vodafone). Verizon owns 55 percent of Verizon <strong>Wireless</strong>, and Vodafone owns 45 percent. See Verizon<br />
Communications, Inc., SEC Form 10-K, filed Feb. 24, 2009, at 3.<br />
46<br />
Rather, a nationwide network covers a sufficiently large percentage of the population such that it would be<br />
inappropriate to categorize it as a regional network.<br />
47 These providers have spectrum holdings in different bands, including cellular, SMR, PCS, AWS, 700 MHz, and<br />
2.5 GHz (both BRS licenses and EBS spectrum leases). Their respective holdings are discussed in more detail in<br />
Section VII.A.1, Spectrum, and Appendix A, infra.<br />
28
Federal Communications Commission <strong>FCC</strong> 10-81<br />
areas of these four facilities-based providers can be found in Appendix D.<br />
28. The next tier of facilities-based providers consists of companies that provide mobile<br />
wireless services on a regional, multi-metro, or local basis. Two facilities-based providers – Leap<br />
<strong>Wireless</strong> International, Inc. (Leap) and MetroPCS Communications Inc. (MetroPCS) – provide service in<br />
multiple large and medium-sized metropolitan areas across the nation. United States Cellular Corporation<br />
(US Cellular) is a large regional provider that serves regions in the western, mid-western, and eastern<br />
United States. 48 Clearwire, a recent entrant to the mobile wireless services market, provides mobile<br />
wireless broadband services in several metropolitan areas across the country. 49 A large, former regional<br />
provider, Alltel Corporation (Alltel), was acquired by Verizon <strong>Wireless</strong> in January 2009. 50<br />
29. There are over one hundred small facilities-based providers throughout the country that<br />
typically provide service in a single geographical area, many of them rural areas. Cincinnati Bell<br />
<strong>Wireless</strong>, one of the larger of these providers, provides service within the Cincinnati area of Ohio.<br />
Cellular South provides service in the southeastern part of the United States, primarily Mississippi. The<br />
total number of smaller, facilities-based providers remained unchanged between April 2008 and October<br />
2009. 51 Non-nationwide service providers typically rely on roaming agreements with nationwide<br />
facilities-based providers to extend their facilities-based network coverage. 52<br />
30. The population covered by the mobile wireless networks of the top eight facilities-based<br />
providers appears below. Table 1 presents mobile wireless voice network coverage, and Table 2 presents<br />
mobile wireless broadband network coverage. In addition, subscriber figures for the top eight service<br />
providers appear in Table 3 and Chart 1. From these data, we see that the four nationwide service<br />
providers account for 90 percent of the nation’s mobile wireless subscribers (including <strong>Mobile</strong> Virtual<br />
Network Operator (MVNO) subscribers), with AT&T and Verizon <strong>Wireless</strong> accounting for 60 percent. 53<br />
The remaining, non-nationwide service providers account for ten percent (see Chart 1). Table C-4 in<br />
Appendix C provides a list of the 16 largest facilities-based service providers.<br />
48<br />
United States Cellular Corp., SEC Form 10-K, filed Feb. 29, 2009, at 1 (stating that US Cellular has 185<br />
geographical markets covering 26 states).<br />
49 Clearwire is discussed in more detail in Section III.E.1, Entry, infra.<br />
50 See Section III.E.2, Exit, infra.<br />
51<br />
American Roamer database, Apr. 2008 and Oct. 2009. The calculation excludes the top-16 facilities-based<br />
providers at each date.<br />
52 See Section IV.B.1.c, Roaming, infra.<br />
53 These shares are not necessarily representative of the shares in individual EAs. See Section V.B, Penetration<br />
Rates Across Economic Areas (EAs), infra, for a discussion of EA penetration rates. See also, MetroPCS PN<br />
Comments at 2.<br />
29
Federal Communications Commission <strong>FCC</strong> 10-81<br />
Table 1<br />
<strong>Mobile</strong> <strong>Wireless</strong> Network Coverage, Selected Facilities-Based Providers: Voice Networks 54<br />
Service Provider Covered POPs<br />
October 2008<br />
(millions)<br />
30<br />
Covered POPs<br />
October 2009<br />
(millions)<br />
Verizon <strong>Wireless</strong> 252.9 270.5<br />
AT&T 260.1 262.8<br />
Sprint Nextel 256.6 258.0<br />
T-<strong>Mobile</strong> 237.6 246.2<br />
Alltel 55 77.4 --<br />
MetroPCS 56.0 84.6<br />
Leap 53.9 80.5<br />
US Cellular 41.8 41.7<br />
Table 2<br />
<strong>Mobile</strong> <strong>Wireless</strong> Network Coverage, Selected Facilities-Based Providers: Broadband Networks 56<br />
Service<br />
Provider<br />
Covered POPs<br />
November 2008<br />
(millions)<br />
Covered POPs<br />
November 2009<br />
(millions)<br />
Verizon <strong>Wireless</strong> 241.7 266.7<br />
Sprint Nextel 218.9 226.9<br />
AT&T 189.0 212.3<br />
T-<strong>Mobile</strong> 88.4 133.9<br />
Alltel 57 57.7 --<br />
Leap 19.7 79.2<br />
US Cellular 13.1 26.6<br />
54 American Roamer database, Oct. 2008 and Oct. 2009; population figures based on census blocks using 2000<br />
Census data.<br />
55 Verizon <strong>Wireless</strong> and Alltel closed their transaction on January 9, 2009. See Section III.E, Recent Entry and Exit,<br />
infra.<br />
56 Includes coverage by WCDMA/HSPA and EV-DO networks. American Roamer database, Nov. 2008 and Nov.<br />
2009; population figures based on census blocks using 2000 Census data.<br />
57 Verizon <strong>Wireless</strong> and Alltel closed their transaction on January 9, 2009.
Federal Communications Commission <strong>FCC</strong> 10-81<br />
Table 3<br />
<strong>Mobile</strong> <strong>Wireless</strong> Subscribers: Selected Facilities-Based Service Providers 58<br />
Service Provider Q4 2008 Q2 2009<br />
(millions) (millions)<br />
Verizon <strong>Wireless</strong> 72.1 87.7<br />
AT&T 77.0 79.6<br />
Sprint Nextel 48.3 47.9<br />
T-<strong>Mobile</strong> 32.8 33.5<br />
Alltel 59 14.1 --<br />
MetroPCS 5.4 6.3<br />
US Cellular 6.2 6.2<br />
Leap 3.8 4.5<br />
Chart 1<br />
Service Provider Share of Subscribers (Year-End 2008) and Revenues (4Q 2008) 60<br />
100%<br />
90%<br />
80%<br />
70%<br />
60%<br />
50%<br />
40%<br />
30%<br />
20%<br />
10%<br />
0%<br />
Percent of Subscribers Percent of Revenues<br />
Other 4.3% 1.9%<br />
US Cellular 2.3% 2.4%<br />
Metro PCS 2.0% 1.6%<br />
Leap <strong>Wireless</strong> 1.4% 1.1%<br />
Alltel 5.2% 5.4%<br />
T-<strong>Mobile</strong> 12.1% 12.1%<br />
Sprint Nextel 17.9% 16.6%<br />
Verizon 26.3% 31.1%<br />
AT&T 28.5% 27.8%<br />
58 John C. Hodulik, et al., US <strong>Wireless</strong> 411 – Version 31.0, UBS Investment Research, UBS, Mar. 23, 2009, at 13<br />
(US <strong>Wireless</strong> 411 4Q08); John C. Hodulik, et al., US <strong>Wireless</strong> 411 – Version 33.0, UBS Investment Research, UBS,<br />
Aug. 14, 2009, at 13 (US <strong>Wireless</strong> 411 2Q09). Verizon <strong>Wireless</strong> Q2 2009 subscriber figure includes Alltel.<br />
59 Verizon <strong>Wireless</strong> and Alltel closed their merger transaction on January 9, 2009.<br />
60 US <strong>Wireless</strong> 411 4Q08; Company SEC 10-K filings. These shares are not necessarily representative of the shares<br />
in individual EAs.<br />
31
2. Resale/MVNO Providers<br />
Federal Communications Commission <strong>FCC</strong> 10-81<br />
31. A reseller purchases mobile wireless services from facilities-based providers and resells<br />
the services to consumers. Many resellers are referred to as <strong>Mobile</strong> Virtual Network Operators (MVNOs)<br />
because they typically do not own any network infrastructure or spectrum licenses. Verizon <strong>Wireless</strong><br />
provides a definition of an MVNO:<br />
“MVNOs execute a contract with [the facilities-based provider] to buy wireless service from<br />
[the facilities-based provider] to resell under their own brand to customers and perform all<br />
marketing, billing, collections and customer service for the customers they activate. MVNOs<br />
establish and maintain the relationship with its customers. MVNOs own the relationship with<br />
their customers and establish their own calling plans and pricing.” 61<br />
MVNOs may target their service and product offerings at specific demographic, lifestyle, and market<br />
niches that have particular needs or interests. Their customers typically include a relatively large<br />
proportion of consumers who have a low income, are relatively price sensitive, do not want to commit to<br />
multiyear subscription contracts, have low usage needs, or do not want to buy a bundle that contains<br />
unwanted data services.<br />
32. MVNOs are not counted as separate competitors from their hosting facilities-based<br />
providers in our analysis of market structure. MVNOs are mobile wireless service competitors which,<br />
like facilities-based providers, compete for subscribers. However, because MVNOs purchase their<br />
mobile wireless services in wholesale contracts from facilities-based providers, the ability of MVNOs to<br />
compete against their host facilities-based provider is limited. Also, MVNOs do not compete through<br />
network investments and upgrades as do facilities-based providers. 62 Subscriber figures of MVNOs are<br />
usually accounted for in the subscriber figures of the hosting facilities-based provider and are categorized<br />
as “wholesale” subscribers. 63 For these reasons, many industry analysts focus on facilities-based service<br />
providers to characterize market developments that define the state of competition in the mobile wireless<br />
industry. 64 Many MVNOs are privately-held companies and do not report their subscribers. For purposes<br />
of this <strong>Report</strong>, the Commission does not count any MVNO or reseller as a competitor in the mobile<br />
wireless market when it calculates market concentration. 65<br />
33. At least 60 MVNOs were operating in the United States in the first quarter of 2010. 66<br />
The largest MVNO is Tracfone. At the end of 2009, Tracfone had over 14 million subscribers, making it<br />
the fifth largest mobile wireless service provider in the United States after the four nationwide facilities-<br />
61<br />
Verizon <strong>Wireless</strong>, Authorized Retailers and MVNOs,<br />
http://www.verizonwireless.com/b2c/aboutUs/reseller/authorizedAgentIndex.jsp (visited Jan. 11, 2010).<br />
62<br />
See Section IV.B.1, Network Coverage and Technology Upgrades, infra.<br />
63<br />
Robert F. Roche and Lesley O’Neill, CTIA’s <strong>Wireless</strong> Industry Indices, Semi-Annual Data Survey Results: A<br />
Comprehensive <strong>Report</strong> from CTIA Analyzing the U.S. <strong>Wireless</strong> Industry, Mid-Year2009 Results, Nov. 2008, at 11<br />
(CTIA Mid-Year 2009 <strong>Wireless</strong> Indices <strong>Report</strong>) (“[s]ubscribers to [MVNOs] are accounted for in the results reported<br />
by the facilities-based companies that support the [MVNO] offerings.”)<br />
64<br />
See, e.g., Glen Campbell, Get Ready for the <strong>Wireless</strong> Revenue Bounce, Bank of America, Global <strong>Wireless</strong> Matrix<br />
4Q09, Dec. 13, 2009, at 10 (Bank of America Global <strong>Wireless</strong> Matrix 4Q09); John C. Hodulik, et al., US <strong>Wireless</strong><br />
411, Version 34.0, UBS, Nov. 16, 2009 (US <strong>Wireless</strong> 411 3Q09). However, TracFone has received some attention<br />
due to its size in the prepaid market. See Phil Cusick, et al., Prepaid <strong>Wireless</strong> Services, Just Who is TracFone<br />
Anyway?, Macquarie Research, June 10, 2009, at 1 (Macquarie - Just Who is TracFone Anyway?).<br />
65<br />
See Section III.C, Horizontal Concentration, infra.<br />
66<br />
See Table C-7, Appendix C. CTIA estimates that there are at least 43 MVNOs. CTIA PN Comments at 6.<br />
32
Federal Communications Commission <strong>FCC</strong> 10-81<br />
based service providers. 67 Tracfone is owned by América Móvil, S.A.B. de C.V., a wireless service<br />
provider in Latin America and Puerto Rico, and offers mobile wireless services using the networks of<br />
AT&T and Verizon <strong>Wireless</strong>. 68 Tracfone had 3.2 million net customer additions in 2009, 1.2 million of<br />
which were added in the fourth quarter alone. 69<br />
34. Another large MVNO, Virgin <strong>Mobile</strong> USA, was acquired by Sprint Nextel in the fourth<br />
quarter of 2009. 70 Some mobile wireless service providers offer service both as MVNOs and facilitiesbased<br />
providers. For instance, Sprint Nextel offers mobile wireless voice and data services using its own<br />
networks and has entered an MVNO agreement with Clearwire to resell WiMAX service from<br />
Clearwire. 71<br />
3. Narrowband Data Providers<br />
35. Narrowband data and paging services comprise a specialized market segment of mobile<br />
wireless industry. These services include two-way messaging, and machine-to-machine and other<br />
telemetry communications, and are consumed primarily by businesses, government users, and other<br />
institutions. According to Commission licensing databases there is approximately seven megahertz of<br />
spectrum allocated to narrowband and paging services, and there are hundreds of licensees for these<br />
services. Licensees include citizens, firms, and local and State governments. For instance, USA Mobility<br />
provides paging and two-way messaging products to the business, government, and health care sectors. 72<br />
USA Mobility states that, due to competition from mobile wireless service providers (using Cellular and<br />
broadband PCS spectrum), they expect demand for their messaging services to decline in the near<br />
future. 73 Another narrowband provider, Space Data Corp., provides commercial telemetry services across<br />
the south-central United States to energy, utility, and transportation companies. 74 SkyTel offers machineto-machine<br />
services including tracking services, automated reading of utility meters, power grid<br />
communication services, wireless security services, and point of sale communication services. 75<br />
4. <strong>Mobile</strong> Satellite Service Providers<br />
36. <strong>Mobile</strong> Satellite Services (MSS) providers also offer mobile wireless services by<br />
providing satellite-based communications to mobile devices. Traditionally, MSS has involved voice and<br />
narrowband data services, but licensees are increasing the number and variety of broadband service<br />
offerings. 76 MSS services are generally targeted to users that require service in remote areas, in disaster<br />
67 América Móvil, S.A.B. De C.V., SEC Form 6-K, filed Feb. 3, 2010, at 4.<br />
68 See Phil Cusick, et al., Macquarie - Just Who is TracFone Anyway?, at 1; TracFone, About Us,<br />
http://www.tracfone.com/about.jsp?nextPage=about.jsp&task=about (visited Jan. 11, 2010).<br />
69 América Móvil, S.A.B. De C.V., SEC Form 6-K, filed Feb. 3, 2010, at 16.<br />
70 Sprint Nextel Completes Acquisition of Virgin <strong>Mobile</strong> USA, Press Release, Sprint Nextel, Nov. 24, 2009. Prior to<br />
this acquisition, Sprint Nextel held an approximate 13 percent interest in Virgin <strong>Mobile</strong> USA. Sprint Nextel to<br />
Acquire Virgin <strong>Mobile</strong> USA, Press Release, Sprint Nextel, July 28, 2009.<br />
71 Sprint Nextel, SEC Form 10-Q, filed Nov. 6, 2009, at 7.<br />
72 See USA Mobility, <strong>Wireless</strong> Messaging – Products and Services,<br />
http://www.usamobility.com/products/messaging/ (visited Jan. 18, 2010); Tenth <strong>Report</strong>, 20 <strong>FCC</strong> Rcd at 15923, 33.<br />
73 USA Mobility Inc., SEC Form 10-K, Feb. 25, 2010, at 4.<br />
74 Space Data Corp., Overview of SkySite Network, and<br />
http://www.spacedata.net/company.html (visited Jan. 15, 2008); Tenth <strong>Report</strong>, 20 <strong>FCC</strong> Rcd at 15923, 34.<br />
75 See Skytel, Powering Innovations using SkyTel’s Network-on-Demand Communications Platform,<br />
http://www.skytel.com/index.html (visited Apr. 20, 2010).<br />
76 See generally Thirteenth <strong>Report</strong>, 24 <strong>FCC</strong> Rcd at 6302-09, 253-73; SkyTerra Communications, Inc., Transferor,<br />
And Harbinger Capital Partners Funds, Transferee, Applications for Consent to Transfer of Control of SkyTerra<br />
(continued….)<br />
33
Federal Communications Commission <strong>FCC</strong> 10-81<br />
response situation, or other places where terrestrial mobile wireless network access may be limited. 77<br />
Examples of MSS consumers include the oil industry, maritime users, public safety agencies, and other<br />
government/military operations.<br />
37. While terrestrial mobile wireless service providers and satellite mobile wireless service<br />
providers both provide mobile wireless voice and data services, the Commission has recognized that<br />
terrestrial mobile wireless services and MSS have different characteristics and involve different consumer<br />
benefits, coverage, prices, product acceptance, and distribution methods. 78 The two services, at the<br />
present time, are not perfectly interchangeable, appear to be imperfect substitutes for one another, and<br />
appeal to different market segments. 79 The mobile satellite service industry, however, is undergoing<br />
major technological and structural changes. 80 As with the rest of the telecommunications sector,<br />
technological advances in the mobile satellite industry are shifting the locus of consumer demand and<br />
competition to broadband services. 81 Several MSS providers also have stated plans to offer high-speed<br />
data services, especially in connection with terrestrial networks using their Ancillary Terrestrial<br />
Component (ATC) authority. 82 Such services in the future could potentially enhance competition in the<br />
provision of mobile terrestrial wireless services. 83 As of the end of 2009, however, no mobile services<br />
have been offered using ATC. 84<br />
38. While the Twelfth and Thirteenth <strong>Report</strong>s discussed MSS spectrum, providers, and<br />
networks, 85 the Commission’s forthcoming Annual <strong>Report</strong> and Analysis of Competitive Market<br />
Conditions with Respect to Domestic and International Satellite Communication Services will include a<br />
more detailed discussion of MSS, including ATC services. 86 Accordingly, this <strong>Report</strong> does not include a<br />
further discussion of MSS, and does not include MSS in its analysis of the mobile wireless services<br />
industry.<br />
C. Horizontal Concentration<br />
39. The level of market concentration can be measured by the number of competitors, shares<br />
(Continued from previous page)<br />
Subsidiary, LLC, IB Docket No. 08-184, Memorandum Opinion and Order and Declaratory Ruling, DA 10-535, <br />
33-36 (rel. Mar. 26, 2010) (SkyTerra/Harbinger).<br />
77 See Thirteenth <strong>Report</strong>, 24 <strong>FCC</strong> Rcd at 6301, 247; SIA PN Comments at 2-3.<br />
78 Thirteenth <strong>Report</strong>, 24 <strong>FCC</strong> Rcd at 6301, 247. See also, SIA PN Comments at 2.<br />
79 Thirteenth <strong>Report</strong>, 24 <strong>FCC</strong> Rcd at 6301, 247. See also, SIA PN Comments at 2; Flexibility for Delivery of<br />
Communications by <strong>Mobile</strong> Satellite Service Providers in the 2 GHz Band, the LBand, and the 1.6/2.4 GHz bands;<br />
Review of the Spectrum Sharing Plan Among Non-Geostationary Satellite Orbit <strong>Mobile</strong> Satellite Service Systems in<br />
the 1.6/2.4 GHz Bands, <strong>Report</strong> and Order and Notice of Proposed Rulemaking, 18 <strong>FCC</strong> Rcd 1962, 1984, 39<br />
(2003), modified sua sponte, Order on Reconsideration, 18 <strong>FCC</strong> Rcd 13590 (2003), on reconsideration,<br />
Memorandum Opinion and Order and Second Order on Reconsideration, 20 <strong>FCC</strong> Rcd 4616 (2005), further recon.<br />
pending.<br />
80 See generally SkyTerra/Harbinger, 40-54.<br />
81 Id. at 40.<br />
82 Id. at 33-36, 40.<br />
83 Id. at 62.<br />
84<br />
Some fixed wireless services are being offered, under ATC authority, by Open Range Communications, which is<br />
leasing spectrum from MSS licensee Globalstar LLC.<br />
85<br />
See Twelfth <strong>Report</strong>, 23 <strong>FCC</strong> Rcd at 2345-2352, 259-289; Thirteenth <strong>Report</strong>, 24 <strong>FCC</strong> Rcd 24 at 6298-6309, <br />
240-273,<br />
86 See “IB Invites Comment for Third Annual <strong>Report</strong> to Congress on Status of <strong>Competition</strong> in Satellite Services<br />
Market,” Public Notice, 24 <strong>FCC</strong> Rcd 5424, 5426 (2009).<br />
34
Federal Communications Commission <strong>FCC</strong> 10-81<br />
of subscribers or sales, or the distribution of competitors’ respective shares of subscribers or sales. A<br />
high market concentration will occur whenever a small number of competitors each possess a relatively<br />
large share of subscribers or sales. In conjunction with entry conditions and the degree of rivalry among<br />
providers, market concentration affects the likelihood that a single provider unilaterally, or a group of<br />
providers through coordinated action, could successfully exercise market power that results in profitable<br />
and sustainable price increases.<br />
1. Number of Competitors<br />
40. In this section, we estimate the percentage of the U.S. population served by facilitiesbased<br />
mobile wireless service providers in more than 8 million U.S. census blocks. 87 This analysis is<br />
based on provider coverage maps provided to the Commission through a contract with American Roamer,<br />
an independent consulting firm that tracks service provision for mobile voice and mobile data services. 88<br />
We note that the American Roamer analysis likely overstates the coverage actually experienced by<br />
consumers, because American Roamer reports advertised coverage as reported to it by many mobile<br />
wireless service providers, each of which uses a different definition of coverage. 89 The data do not<br />
expressly account for factors such as signal strength, bit rate, or in-building coverage, and they may<br />
convey a false sense of consistency across geographic areas and service providers. 90 Nonetheless, the<br />
data are useful for benchmarking mobile network deployment across the United States, especially over<br />
time.<br />
41. Map 2 below depicts the number of facilities-based providers operating across the United<br />
States. More detailed regional maps are available in Appendix D.<br />
87 A census block is the smallest geographic unit for which the Census Bureau tabulates decennial census data. See,<br />
U.S. Census Bureau, Glossary Of Basic Geographic And Related Terms - Census 2000,<br />
http://www.census.gov/geo/www/tiger/glossary.html#glossary (visited Dec. 15, 2008). Many blocks correspond to<br />
individual city blocks bounded by streets, but blocks – especially in rural areas – may include many square miles<br />
and may have some boundaries that are not streets. The Census Bureau established blocks covering the entire nation<br />
for the first time in 1990. Previous censuses back to 1940 had blocks established only for part of the nation. Over 8<br />
million blocks are identified for Census 2000. U.S. Census Bureau, Question & Answer Center,<br />
http://www.census.gov (visited Oct. 2, 2008). The mean size of a census block is .0460 square miles, and its median<br />
size is 0.016 square miles with a range of 0.0000001 to 8,081 square miles; its mean population is 34.3 people, while<br />
its median population is 8.0 people, with a range of 0 to 23,373 people. Commission analysis is based on Census<br />
2000 “Summary File 1 (SF 1),” U.S. Census Bureau, United States Census 2000, http://www.census.gov/Press-<br />
Release/www/2001/sumfile1.html (visited Dec. 15, 2008).<br />
88 American Roamer provides data on carriers under contract as coverage boundary maps based on the coverage<br />
boundaries provided to them by mobile wireless network operators. American Roamer began in 1985 as the original<br />
vendor of custom printed roaming guides for cellular carriers, but has since evolved into a provider of data and<br />
mapping for the mobile wireless industry. See American Roamer, http://www.americanroamer.com (visited Dec.<br />
16, 2008).<br />
89 National Broadband Plan, at 39 (Chapter 4).<br />
90 Id.<br />
35
Federal Communications Commission <strong>FCC</strong> 10-81<br />
Map 2<br />
<strong>Mobile</strong> <strong>Wireless</strong> Competitors 91<br />
42. Estimates of the total number of competitors by aggregate census block coverage, by<br />
population coverage, and by land area coverage are shown below. Table 4 presents coverage by all<br />
mobile wireless service providers, and Table 5 shows the extent of coverage in areas of the country<br />
excluding Federal lands. Table 6 and Table 7 present coverage by mobile wireless voice and broadband<br />
providers, respectively. Due to confidentially agreements with American Roamer, we cannot provide<br />
details about the census blocks served by individual facilities-based providers.<br />
91 An enlarged version of this map can be found in Appendix D.<br />
36
Federal Communications Commission <strong>FCC</strong> 10-81<br />
Table 4<br />
Estimated <strong>Mobile</strong> <strong>Wireless</strong> Service Providers by Census Block, Including Federal Land 92<br />
Total Number of<br />
Providers in a<br />
Block<br />
Number of<br />
Blocks<br />
POPs<br />
Contained in<br />
Those Blocks<br />
37<br />
% of Total<br />
US POPs<br />
Square Miles<br />
Contained in<br />
Those Blocks<br />
% of Total<br />
US Square<br />
Miles<br />
Total for US 8,262,363 285,230,516 100.0% 3,799,408 100.0%<br />
1 or more 8,001,159 284,122,621 99.6% 2,782,734 73.2%<br />
2 or more 7,608,107 281,287,053 98.6% 2,207,144 58.1%<br />
3 or more 6,801,227 273,236,840 95.8% 1,547,456 40.7%<br />
4 or more 5,812,155 259,248,116 90.9% 999,147 26.3%<br />
5 or more 4,009,938 210,574,568 73.8% 480,056 12.6%<br />
6 or more 1,334,038 70,492,955 24.7% 122,594 3.2%<br />
7 or more 300,215 20,000,444 7.0% 15,436 0.4%<br />
Table 5<br />
Estimated <strong>Mobile</strong> <strong>Wireless</strong> Service Providers by Census Block, Excluding Federal Land 93<br />
Total Number of<br />
Providers in a<br />
Block<br />
Number of<br />
Blocks<br />
POPs<br />
Contained in<br />
Those Blocks<br />
% of Total<br />
US POPs<br />
Excluding<br />
Those on<br />
Federal<br />
Land<br />
Square Miles<br />
Contained in<br />
Those Blocks<br />
% of Total<br />
US Square<br />
Miles<br />
Excluding<br />
Federal Land<br />
Total for US 7,794,199 280,371,248 100.0% 2,652,534 100.0%<br />
1 or more 7,630,576 279,465,237 99.7% 2,209,609 83.3%<br />
2 or more 7,321,670 276,981,583 98.8% 1,876,215 70.7%<br />
3 or more 6,604,650 269,434,807 96.1% 1,375,448 51.9%<br />
4 or more 5,683,440 256,008,675 91.3% 918,467 34.6%<br />
5 or more 3,950,485 208,505,981 74.4% 453,357 17.1%<br />
6 or more 1,316,617 69,684,129 24.9% 118,040 4.5%<br />
7 or more 297,391 19,784,321 7.1% 14,900 0.6%<br />
43. Table 4 and Table 5 present estimates of how many competitors serve the U.S mobile<br />
wireless services market. Table 4 includes federally-owned or administered land, and Table 5 excludes<br />
92 Commission estimates based on American Roamer database, Oct. 2009 and Nov. 2009. The estimates include<br />
Clearwire’s mobile WiMAX network coverage from November 2009. Population and land area are based on census<br />
blocks. POPs are from the 2000 Census, and square miles include the United States and Puerto Rico.<br />
93 Commission estimates based on American Roamer database, Oct. 2009 and Nov. 2009. The estimates include<br />
Clearwire’s mobile WiMAX network coverage from November 2009. Population and land area are based on census<br />
blocks. POPs are from the 2000 Census, and square miles include the United States and Puerto Rico. In this<br />
analysis, Federal lands consist of lands owned or administered by the Federal Government, including the Bureau of<br />
Land Management, the Bureau of Reclamation, the U.S. Department of Agriculture Forest Service, the Department<br />
of Defense, the U.S. Fish and Wildlife Service, the National Park Service, the Tennessee Valley Authority, and other<br />
agencies. Only areas of one square mile (640 acres) or more are included. Indian lands are not included in Federal<br />
lands. See U.S. Department of the Interior, Federal Lands of the United States,<br />
http://www.nationalatlas.gov/mld/fedlanp.html (visited Dec. 16, 2008).
Federal Communications Commission <strong>FCC</strong> 10-81<br />
such lands. Including or excluding Federal lands results in a similar number of competitors by population<br />
coverage; however, due to the large quantity of sparsely-populated Federal lands, the analysis shows<br />
significantly greater percentages of land coverage when Federal lands are excluded. For example,<br />
approximately 40.7 percent of the total U.S. land area is covered by three or more facilities-based<br />
providers, compared to approximately 51.9 percent of the land area when Federal lands are excluded. As<br />
the Commission has recognized, “[i]n many locations, covering certain government land may be<br />
impractical, because these lands are subject to restrictions that prevent a licensee from providing service<br />
or make provision of service extremely difficult. We also note that government lands often include only<br />
very small portions of the population in a license area.” 94 Federally-owned lands constitute nearly 30<br />
percent of the approximately 3.6 million square mile land area of the United States. 95 A map showing the<br />
extent of Federal lands, with American Indian Reservations and Alaska Native Village Statistical Areas,<br />
can be found in Appendix D.<br />
44. Table 4 shows that approximately 284 million people, or 99.6 percent of the total U.S.<br />
population, are served by at least one facilities-based provider, according to our census block level<br />
analysis using American Roamer data. Approximately 273 million people, or 95.8 percent of the total<br />
U.S. population, are served by three or more competitors offering mobile wireless service in the census<br />
blocks in which they live, and approximately 259 million people, or 90.9 percent of the U.S. population,<br />
live in census blocks served by four or more competitors.<br />
45. Table 5, shows that approximately 279 million people, or 99.7 percent of the U.S.<br />
population, excluding those on Federal lands, are served by at least one facilities-based provider,<br />
according to the analysis. Approximately 269 million people, or 96.1 percent of the total U.S. population,<br />
are served by three or more competitors offering mobile wireless service in the census blocks in which<br />
they live, and approximately 256 million people, or 91.3 percent of the U.S. population, live in census<br />
blocks served by four or more competitors. Approximately 17 percent of the land area of the United<br />
States, when Federal lands are excluded, has no mobile wireless network coverage. 96<br />
94 Service Rules for the 698-746, 747-762 and 777-792 MHz Bands; Revision of the Commission’s Rules to Ensure<br />
Compatibility with Enhanced 911 Emergency Calling Systems; Section 68.4(a) of the Commission's Rules<br />
Governing Hearing Aid-Compatible Telephones; Biennial Regulatory Review – Amendment of Parts 1, 22, 24, 27,<br />
and 90 to Streamline and Harmonize Various Rules Affecting <strong>Wireless</strong> Radio Services; Former Nextel<br />
Communications, Inc. Upper 700 MHz Guard Band Licenses and Revisions to Part 27 of the Commission’s Rules;<br />
Implementing a Nationwide, Broadband, Interoperable Public Safety Network in the 700 MHz Band; and<br />
Development of Operational, Technical and Spectrum Requirements for Meeting Federal, State and Local Public<br />
Safety Communications Requirements Through the Year 2010, Second <strong>Report</strong> and Order, 22 <strong>FCC</strong> Rcd 15289,<br />
15350, 160 (2007).<br />
95 See U.S. Department of the Interior, Federal Lands and Indian Reservations,<br />
http://www.nationalatlas.gov/printable/fedlands.html (visited Jan. 18, 2010).<br />
96 See Table 5; RTG PN Comments at 2.<br />
38
Total Number of<br />
Providers in a<br />
Block<br />
Federal Communications Commission <strong>FCC</strong> 10-81<br />
Table 6<br />
Estimated <strong>Mobile</strong> <strong>Wireless</strong> Voice Providers by Census Block, 2009 97<br />
Number of<br />
Blocks<br />
POPs<br />
Contained in<br />
Those Blocks<br />
39<br />
% of Total<br />
US POPs<br />
Square Miles<br />
Contained in<br />
Those Blocks<br />
% of Total<br />
US Square<br />
Miles<br />
Total for US 8,262,363 285,230,516 100.0% 3,799,408 100.0%<br />
1 or more 8,000,570 284,121,970 99.6% 2,782,606 73.2%<br />
2 or more 7,607,934 281,286,168 98.6% 2,207,056 58.1%<br />
3 or more 6,800,716 273,209,240 95.8% 1,547,420 40.7%<br />
4 or more 5,806,406 258,958,719 90.8% 998,978 26.3%<br />
5 or more 3,959,641 207,724,511 72.8% 478,046 12.6%<br />
6 or more 1,087,150 54,416,664 19.1% 113,421 3.0%<br />
7 or more 61,020 2,087,253 0.7% 8,632 0.2%<br />
Table 7<br />
Estimated <strong>Mobile</strong> <strong>Wireless</strong> Broadband Providers by Census Block, 2009 98<br />
Total Number of<br />
Providers in a<br />
block<br />
Number of<br />
Blocks<br />
POPs Contained<br />
in Those Blocks<br />
% of<br />
Total US<br />
POPs<br />
Square Miles<br />
Contained in<br />
Those Blocks<br />
% of<br />
Total US<br />
Square<br />
Miles<br />
1 or More 7,464,539 279,756,929 98.1 2,150,171 56.6<br />
2 or More 5,662,923 255,187,772 89.5 1,073,018 28.2<br />
3 or More 3,878,519 217,078,155 76.1 390,208 10.3<br />
4 or More 2,457,193 165,393,450 58.0 139,625 3.7<br />
46. The analysis estimates that approximately 284 million people, or 99.6 percent of the U.S.<br />
population, are served by one or more mobile voice providers, as depicted in Table 6. Equivalently, 1.1<br />
million people, or 0.4 percent of the U.S. population, are not served by any mobile service provider.<br />
Approximately 273 million people, or 95.8 percent of the population, are served by at least three mobile<br />
voice providers. 99 Approximately 259 million people, or 90.8 percent of the population, are served by at<br />
least four mobile voice providers. 100<br />
47. Table 7 shows the extent of mobile broadband coverage, which includes EV-DO,<br />
WCDMA/HSPA, or mobile WiMAX networks. Approximately 280 million people, or 98.1 percent of<br />
the U.S. population, are served by one or more mobile broadband providers. The percentage of the<br />
population served by at least two mobile broadband providers increased from 73 percent in May 2008 to<br />
97 Commission estimates are based on American Roamer database, Oct. 2009. The estimates exclude Clearwire’s<br />
mobile WiMAX network coverage. Population and land area are based on census blocks. POPs are from the 2000<br />
Census, and square miles include the United States and Puerto Rico.<br />
98 Commission estimates are based on American Roamer database, Nov. 2009. The estimates include coverage by<br />
all EVDO, EVDO Rev. A, HSPA/UMTS/WCDMA, and mobile WiMAX networks. Population and land area are<br />
based on census blocks. POPs are from the 2000 Census, and square miles include the United States and Puerto<br />
Rico.<br />
99<br />
Equivalently, 12 million people, or 4.2 percent of the U.S. population, are not served by three or more mobile<br />
service providers.<br />
100<br />
Equivalently, 26 million people, or 9.2 percent of the U.S. population, are not served by four or more mobile<br />
service providers.
Federal Communications Commission <strong>FCC</strong> 10-81<br />
nearly 90 percent in November 2009. 101 In addition, the percentage of the population served by three or<br />
more providers increased from 51 percent in May 2008 to 76 percent in November 2009. 102 Table 7 also<br />
shows that approximately 58 percent of the population is served by at least four mobile broadband<br />
providers. 103<br />
2. Concentration Measures<br />
48. Measures of industry concentration aim to relate industry structure to industry<br />
performance. They can be useful indicators when evaluated together with firm conduct and actual<br />
industry performance. The number of competitors and shares of subscribers or sales are the most<br />
elementary measures of industry concentration. 104<br />
49. Herfindahl-Hirschman Index (HHI). The HHI, a measure of market concentration, is<br />
employed by the Commission because it is the most widely-accepted measure of concentration in<br />
competition analysis. 105 In particular, it allows a comparison of different distributions of providers’<br />
shares of subscribers using a common index. The range of the HHI is the positive numbers up to 10,000,<br />
with 10,000 representing a monopoly, the highest degree of concentration. Fewer competitors and higher<br />
shares of subscribers result in higher HHI index values. 106 As a benchmark for comparison, the value of<br />
the HHI for a hypothetical market in which there are four facilities-based providers with equal shares of<br />
subscribers is 2500; if there are three facilities-based providers with equal shares of subscribers the value<br />
is 3333. For context, the DOJ antitrust guidelines consider a market to be “highly concentrated” if the<br />
post-merger HHI exceeds 1800. 107 DOJ antitrust scrutiny is typically applied to a merger if it would<br />
trigger an increase in the HHI of 100 or greater when the post-merger HHI is between 1000 and 1800, and<br />
an increase of 50 or greater when the post-merger HHI is above 1800. 108 As described below, the<br />
Commission has previously used a higher screen, 2800 for the HHI and 100 for the change in HHI, in<br />
101 See Thirteenth <strong>Report</strong>, 24 <strong>FCC</strong> Rcd at 6258, 146, Table 10.<br />
102 Id.<br />
103<br />
The estimated percentage of the population covered by four or more mobile broadband providers was not<br />
provided in the Thirteenth <strong>Report</strong>.<br />
104 Due to confidentiality requirements, the Commission does not publish subscriber share data for local markets.<br />
See Section III.B, Overview of Service Providers, supra, for estimates and a discussion of subscriber shares at a<br />
nationwide level.<br />
105 The HHI is calculated by summing the squares of all provider subscriber shares in the EA. When a single firm is<br />
the sole supplier in the relevant market (a pure monopoly), the HHI attains its maximum value of 10,000 (100 x<br />
100). If there are ten providers, each with ten percent of the market, the value of HHI would be 1,000 [(10) 2 x 10].<br />
As the structure of a market becomes progressively more atomistic, the value of HHI approaches 0.<br />
106 The value of the HHI decreases as the number of firms increases (provided that no existing firm’s share of<br />
subscribers increases). For a given number of firms, the value of the HHI can increase as the inequality in<br />
subscriber shares increases. For example, if four carriers are identified as participants in the relevant markets and<br />
each carrier accounts for 25 percent of total sales, the value of HHI would be 2500 [(25) 2 x 4]. If there are still only<br />
four carriers but the top carrier has a 40 percent subscriber share while each of the remaining three carriers has 20<br />
percent, the value of HHI increases from 2500 to 2800 [(40) 2 + (20) 2 x 3]. If the number of carriers increases to<br />
five, each with a 20 percent subscriber share, the value of the HHI declines to 2000 [(20) 2 x 5].<br />
107 U.S. Department of Justice and the Federal Trade Commission, Horizontal Merger Guidelines, Rev. Apr. 8,<br />
1997, at § 1.51, available at http://www.justice.gov/atr/public/guidelines/horiz_book/hmg1.html (visited Apr. 21,<br />
2010) (Horizontal Merger Guidelines). In April 2010, the FTC proposed that an HHI above 2500 be the guideline<br />
for a market to be considered highly concentrated in the Horizontal Merger Guidelines. See FTC, Horizontal<br />
Merger Guidelines, For Public Comment, (rel. Apr. 20, 2010), available at<br />
http://www.ftc.gov/os/2010/04/100420hmg.pdf.<br />
108 Horizontal Merger Guidelines, at § 1.51.<br />
40
eviewing mergers of mobile providers. 109<br />
Federal Communications Commission <strong>FCC</strong> 10-81<br />
50. HHI Methodology. As in previous <strong>Report</strong>s, we apply the HHI to the shares of subscribers<br />
held by facilities-based mobile wireless providers at the level of EAs, calculating shares of subscribers<br />
from the providers’ numbers of subscribers. 110 Hence, we use a facilities-based provider’s number of<br />
subscribers as a proxy for the provider’s actual output (i.e., minutes of use, MBs, etc.). The number of<br />
subscribers served by each provider is determined based on the Commission’s year-end 2008 NRUF data,<br />
which track phone number usage information for the United States. 111 We emphasize that, in using the<br />
EA as the basis for calculating shares of subscribers in this <strong>Report</strong>, we are not concluding that the EA is<br />
the appropriate geographic market for other purposes. 112<br />
51. Current HHI values. As shown in Table 8, the weighted average of the HHIs (weighted<br />
by EA population) was 2848 at the end of 2008, up from 2674 at the end of 2007—an increase of 174, or<br />
6.5 percent, year over year. 113 The 2008 HHI data reflect several mergers that were completed during<br />
2008, 114 including the mergers of AT&T/Aloha (February 2008), T-<strong>Mobile</strong>/Suncom (February 2008),<br />
Verizon <strong>Wireless</strong>/Rural Cellular (August 2008), and Verizon <strong>Wireless</strong>/Alltel (January 2009). 115 From<br />
2003 (the first year the Commission calculated HHI using this methodology) to 2008, the average HHI<br />
has increased from 2151 to 2848, an increase of 697 (see Table 8 and Chart 2). The lowest EA HHI<br />
values and the highest EA HHI values both increased in 2008 relative to the 2007 HHI values. 116 For<br />
2008, the value of the HHI for individual EAs ranges from a low of 2123 in EA 63 (covering parts of<br />
southeastern Wisconsin) to a high of 8263 in EA 4 (covering parts of Vermont and New York). The<br />
increase in the 2008 HHI values relative to the 2007 HHI values could be attributed to fewer competitors<br />
and/or a greater inequality in the shares of subscribers held by providers. A merger can increase the HHI<br />
due to there being fewer providers in an EA and due to an increase in the subscribers in an EA of the postmerger<br />
provider. The change in the HHI from 2007 to 2008 may also reflect changes in subscribers that<br />
did not result because of a merger.<br />
52. The HHI values can be viewed in the context of the “HHI screen” used by the<br />
Commission in its analysis of mergers and license transactions. The Commission employed an HHI<br />
109<br />
Applications of AT&T <strong>Wireless</strong> Services, Inc. and Cingular <strong>Wireless</strong> Corporation For Consent to Transfer<br />
Control of Licenses and Authorizations, File Nos. 0001656065, et al., Memorandum Opinion & Order, 19 <strong>FCC</strong> Rcd<br />
21522, 21568 108 (2004).<br />
110<br />
See Section III.A, Introduction, supra. Although the Commission typically uses 734 CMAs to calculate HHIs<br />
when it evaluates the competitive consequences of certain transactions, we use 172 EAs to calculate HHIs in this<br />
<strong>Report</strong>. We use EAs in this <strong>Report</strong> to maintain continuity with past <strong>Report</strong>s and to avoid compromising the<br />
confidential information found in the NRUF data. The subscribers of MVNOs are included with the subscribers of<br />
their hosting facilities-based providers.<br />
111<br />
The methodology used to compile NRUF data is described in Section V.A, Subscribership Levels, infra.<br />
112<br />
For instance, in the Commission’s review of the transfers and assignments of mobile wireless licenses, it has<br />
typically used CMAs, which generally are smaller than EAs, as the relevant geographic market for calculating HHIs.<br />
113<br />
See Appendix C, Table C-3, infra, for EA subscribership levels, penetration rates, and population densities. The<br />
weighted average assigns proportionately greater (less) weight to EAs that have a higher (lower) population. The<br />
simple average (not weighted by population) is 3775. If one weights by market output shares (i.e. number of<br />
subscribers) a similar figure is obtained.<br />
114 See Thirteenth <strong>Report</strong>, 24 <strong>FCC</strong> Rcd at 6259, 151.<br />
115 The Verizon/Alltel transaction was approved by the Commission in November 2008 and closed on January 9,<br />
2009. See Section III.E, Recent Entry and Exit, infra. The HHI calculations allocate to Verizon <strong>Wireless</strong> those<br />
Alltel subscribers that are not to be divested under the order.<br />
116<br />
See Thirteenth <strong>Report</strong>, 24 <strong>FCC</strong> Rcd at 6212, 46. The lowest EA value was 1795 in EA 28 and the highest was<br />
6272 in EA 121.<br />
41
Federal Communications Commission <strong>FCC</strong> 10-81<br />
screen in its review of transactions during 2009, including the AT&T/Centennial transaction. 117 The HHI<br />
screen identified service areas in which (1) the post-transaction HHI would be both greater than 2800 and<br />
would increase by at least 100, or (2) the post-transaction HHI would have increased by at least 250.<br />
Service areas that met these criteria were flagged and subject to a further case-by-case competitive<br />
analysis. 118<br />
HHI<br />
Table 8<br />
<strong>Mobile</strong> <strong>Wireless</strong> Market Concentration 119<br />
Fourteenth<br />
<strong>Report</strong><br />
Herfindahl-Hirschman Index<br />
Thirteenth<br />
<strong>Report</strong><br />
Twelfth<br />
<strong>Report</strong><br />
42<br />
Eleventh<br />
<strong>Report</strong><br />
Tenth<br />
<strong>Report</strong><br />
Ninth<br />
<strong>Report</strong><br />
Year 2008 2007 2006 2005 2004 2003<br />
Average 2848 2674 2674 2706 2450 2151<br />
High 8263 6272 6551 9042 7064 7155<br />
Low 2123 1795 1609 1605 1554 1325<br />
3000<br />
2800<br />
2600<br />
2400<br />
2200<br />
2000<br />
2151<br />
Chart 2<br />
Average HHI of EAs 120<br />
2450<br />
2706<br />
2674 2674<br />
2848<br />
2003 2004 2005 2006 2007 2008<br />
117 Applications of AT&T Inc. and Centennial Communications Corp. For Consent to Transfer Control of Licenses,<br />
Authorizations, and Spectrum Leasing Arrangements, Memorandum Opinion and Order, 24 <strong>FCC</strong> Rcd 13915 (2009)<br />
(AT&T-Centennial Order).<br />
118 The service areas that met the screen were not subject to an automatic divestiture condition. In some cases, the<br />
parties agree to a voluntary divestiture of service areas that meet the HHI screen, in which case no further<br />
competitive analysis is necessary.<br />
119 Population-weighted average of 172 EAs based on Commission estimates using NRUF and Census Bureau<br />
population data.<br />
120 Based on data shown in Table 8.<br />
Year
Federal Communications Commission <strong>FCC</strong> 10-81<br />
53. HHI values tend to vary with the population density of different markets. Specifically,<br />
market concentration in EAs tends to increase as the EA population declines. Chart 3 shows the<br />
relationship between EA population densities and HHI values. The most concentrated EAs tend to be in<br />
rural areas, while major metropolitan areas lie in the least concentrated EAs. The median HHI value of<br />
EAs that lie within population density bands decreases as the population density increases (see Chart 4).<br />
This phenomenon likely reflects greater demand and greater cost efficiencies (per-user mobile wireless<br />
network deployment costs tend to decrease with increases in the population density) in more denselypopulated<br />
areas.<br />
HHI<br />
Median HHI of EAs<br />
10000.00<br />
8000.00<br />
6000.00<br />
4000.00<br />
2000.00<br />
3500<br />
3000<br />
2500<br />
2000<br />
0.00<br />
Chart 3<br />
Plot of EA HHI Values on EA Population Densities<br />
0 200 400 600 800 1000<br />
Population per Square Mile<br />
Chart 4<br />
Median HHI of EAs in Population Density Bands 121<br />
3346<br />
0-<br />
100<br />
2801<br />
100-<br />
200<br />
2733<br />
200-<br />
300<br />
2615<br />
300-<br />
400<br />
43<br />
2766<br />
400-<br />
500<br />
2140<br />
500-<br />
600<br />
2574<br />
600-<br />
700<br />
Population Density of EAs<br />
2614<br />
700-<br />
800<br />
2466<br />
800-<br />
900<br />
54. Apart from differences in population, EAs also vary significantly with regard to other<br />
121 The highest population density, 891, occurs in EA 34 (Tampa-St. Petersburg-Clearwater, FL), and the lowest<br />
population density, 1, occurs in EA 171 (Anchorage, AK).
Federal Communications Commission <strong>FCC</strong> 10-81<br />
determinants of market demand and facilities-based provider costs, such as per-capita income, the age<br />
distribution of the population, and the size and composition of the business sector. 122 The economic<br />
determinants of industry concentration are discussed further in Section III.D, Entry and Exit Conditions<br />
below.<br />
55. Relation between HHI and Market Power. Shares of subscribers and measures of<br />
concentration are not synonymous with market power – the ability to charge prices above the competitive<br />
level for a sustained period of time. 123 High market concentration may be a reasonable proxy for<br />
significant market power when a reduction in the number of competitors or an increase in their shares of<br />
subscribers result in significantly fewer constraints on the market power of the remaining firms.<br />
However, market concentration, by itself, is an imperfect indicator of market power. This <strong>Report</strong><br />
analyzes the strength of other factors, besides market concentration, which constrain market power.<br />
These include entry and exit conditions, the degree of price and non-price rivalry, and innovative activity<br />
that undercuts the market power of non-innovators by increasing product diversity and quality and<br />
lowering costs. While mobile wireless service prices and price margins are assessed below, 124 this <strong>Report</strong><br />
does not contain a summary estimate of market power – i.e., a numerical estimate of price mark-up over<br />
cost – due to the complexities of estimating market power in an industry with high fixed costs that are<br />
recovered gradually over time, difficulties with analyzing pricing plans for bundles of services, and the<br />
difficulties in obtaining accurate and suitable cost data. Our merger review process uses a market-bymarket<br />
analysis of market concentration as one of many indicia used to find evidence of market power.<br />
D. Entry and Exit Conditions<br />
56. Actual entry and exit occurs in the context of underlying regulatory, market, and<br />
technological conditions that directly influence the total number of firms that can compete successfully in<br />
a market. Entry and exit conditions are relevant for determining if entry or exit will occur, and when<br />
entry or exit will occur – both of which are important for competition.<br />
57. We distinguish regulatory from non-regulatory entry and exit conditions in order to<br />
distinguish spectrum and infrastructure policies from basic market factors. Regulatory entry conditions<br />
tend to be related to access to the inputs necessary to offer mobile wireless services. They include<br />
spectrum policy, which affects the total spectrum capacity available for mobile wireless services, and<br />
tower-siting regulations, which affect whether and how quickly mobile wireless networks can be<br />
deployed or expanded. 125 Regulatory delay at the policy or licensee level can cause delay of entry and<br />
therefore is, in itself, a kind of adjustment cost 126 or entry barrier. 127 Non-regulatory or market conditions<br />
122 The Commission conducted a regression analysis of data at the EA level in September 2008, which indicates that<br />
concentration in the mobile wireless market (measured by the HHI) tends to decline with increases in market size,<br />
population density, per capita income, and percentage of the population living in urban areas.<br />
123 See Jonathan B. Baker and Timothy Bresnahan, “Economic Evidence in Antitrust: Defining Markets and<br />
Measuring Market Power” in Handbook of Antitrust Economics, ed. Paolo Buccirossi, (Cambridge: MIT Press,<br />
2008), 15. See also, Antitrust Law and Economics, at 117.<br />
124 See Section IV.A, Price Rivalry: Developments in <strong>Mobile</strong> Service Pricing Plans, infra.<br />
125 See Sections VII.A.1, Spectrum and VII.A.2, Infrastructure Facilities, infra, for a further discussion.<br />
126 Adjustment costs are costs that delay entry or delay entry by incumbents into new markets. See Dennis W.<br />
Carlton, Why Barriers to Entry are Barriers to Understanding, AMERICAN ECONOMIC REVIEW, 2004, 94: 2, at 468-<br />
469 (Barriers to Understanding). See also R. Preston McAfee, et al., What Is a Barrier to Entry?, AMERICAN<br />
ECONOMIC REVIEW, 2004, 94: 2, at 463 (What Is a Barrier to Entry?).<br />
127 One example of a regulatory delay would be the clearing of a spectrum band. Economists argue that some<br />
operating licenses and other legal restrictions that serve to limit access to the market are barriers to entry, i.e., they<br />
create positive economic profits for incumbents. See Jean Tirole, The Theory of Industrial Organization, MIT Press,<br />
1988, at 305 (The Theory of Industrial Organization). See also, Hal R. Varian, Intermediate Microeconomics: A<br />
Modern Approach, W. W. Norton and Company, 1999, at 395 (Intermediate Microeconomics). Legal entry<br />
(continued….)<br />
44
Federal Communications Commission <strong>FCC</strong> 10-81<br />
that influence entry and exit can be summarized by expected post-entry profitability and its associated<br />
risk factors, which in turn have several main market determinants that are discussed below. 128<br />
1. Regulatory Entry and Exit Conditions<br />
58. Spectrum. Spectrum bandwidth is a vital input to the production of mobile wireless<br />
services. For an entering firm to employ spectrum that was previously unemployed in the mobile wireless<br />
services market, it must be able to access such spectrum. The effective supply of spectrum capacity that<br />
is available for mobile wireless service depends on several aspects of spectrum policy, including<br />
allocation and licensing polices, as well as interference and technical rules. First, increasing the total<br />
supply of spectrum bandwidth that the Commission allocates for mobile wireless service and licenses to<br />
mobile wireless service providers can increase network capacity and reduce the degree of frequency reuse<br />
required to achieve a given capacity. 129 Therefore, spectrum policies affect the ability of potential<br />
entrants to access spectrum and hence the technological, economic, and legal resources required to<br />
expand capacity. 130 Second, interference and technical rules can affect both spectrum access and<br />
spectrum efficiency, and, hence, overall network capacity. 131 Spectrum is discussed in more detail in<br />
Section VII.<br />
59. Tower Siting. State and local zoning rules for erecting wireless towers or attaching<br />
equipment to pre-existing structures can affect the deployment of mobile wireless networks. In particular,<br />
delays in zoning approvals can lengthen the process of cell site acquisition and deployment, thereby<br />
increasing costs for new or existing providers to enter into new markets. The Commission reported that<br />
in 2009, of 3,300 pending zoning applications for wireless facilities, over 760 (nearly one quarter) had<br />
been pending for more than a year and 180 had been pending for more than three years. 132 In November<br />
2009, the Commission issued a Declaratory Ruling that sets time frames for state and local zoning<br />
authorities to act on a zoning application –90 days for collocations and 150 days for all other towers. 133<br />
If a zoning authority does not act within the appropriate time period, and the parties have not agreed to<br />
extend the review period, the applicant can file for relief in federal court. 134 Furthermore, the Declaratory<br />
Ruling acts to reduce regulatory barriers to entry by finding that it is a violation of the Communications<br />
Act for a state or local government to deny a wireless service facility-siting application because service is<br />
available from another provider. 135<br />
(Continued from previous page)<br />
conditions that are not included under regulatory entry conditions could include corporate tax rates, a factor that<br />
directly affects profit calculations and hence entry conditions.<br />
128 See Modern Industrial Organization at 12, 61-62. See also, The Theory of Industrial Organization, at 34;<br />
George S. Ford, et al., <strong>Competition</strong> After Unbundling: Entry, Industry Structure, and Convergence, FEDERAL<br />
COMMUNICATIONS LAW JOURNAL, 2007, 59: 2, at 342 (<strong>Competition</strong> After Unbundling).<br />
129 See Theodore S. Rappaport, <strong>Wireless</strong> Communications: Principles and Practice (2 nd ed.), Prentice Hall, 2002, at<br />
58.<br />
130 Further discussion and data on the market for spectrum, recent spectrum auctions, upcoming spectrum auctions,<br />
and spectrum policy can be found in Section VII.A.1, Spectrum, infra and Appendix A, infra.<br />
131 See <strong>FCC</strong>, Spectrum Policy Task Force, <strong>Report</strong> of the Spectrum Efficiency Working Group, 2002, at 16,<br />
(Spectrum Policy Task Force <strong>Report</strong>). A discussion of the Commission’s flexible licensing policies and their effects<br />
on network deployment can be found in Section IV.B.1, Network Coverage and Technology Upgrades, infra.<br />
132 Petition for Declaratory Ruling to Clarify Provisions of Section 332(c)(7)(B) to Ensure Timely Siting Review<br />
and to Preempt Under Section 253 State and Local Ordinances that Classify All <strong>Wireless</strong> Siting Proposals as<br />
Requiring a Variance, WT Docket No. 08-165, Declaratory Ruling, 24 <strong>FCC</strong> Rcd 13994, 14005 33 (2009).<br />
133 Id. at 13995, 4.<br />
134 Id. at 13995 4, 14013 49.<br />
135 Id. at 13995-96, 5.<br />
45
Federal Communications Commission <strong>FCC</strong> 10-81<br />
2. Non-Regulatory Entry and Exit Conditions<br />
60. Non-regulatory entry and exit conditions are market-determined conditions that affect a<br />
firm’s ability to enter into or exit from a market. Service provider entry and exit decisions are primarily<br />
determined by market profitability estimates. 136 Profitability depends on many factors, including<br />
providers’ costs, market demand projections, market supply and capacity projections, the intensity of<br />
rivalry, and market risks. 137 Some of the major entry costs include (1) spectrum licenses or spectrum<br />
leasing costs; (2) network coverage costs such as site acquisition and preparation costs, site construction<br />
and leasing costs, network equipment costs, backhaul transport 138 costs, and other potential<br />
interconnection and roaming costs; (3) the costs of offering customers a portfolio of attractive wireless<br />
devices; and (4) the costs of marketing and distributing wireless services and devices. Below, we briefly<br />
discuss these major costs of deploying a network and gaining a customer base. On the demand side,<br />
population, population density, income, other socioeconomic variables, and macroeconomic conditions<br />
affect the service revenue projections of potential entrants.<br />
61. Market-determined costs, like regulatory entry conditions, can affect both if entry will<br />
occur and when entry will occur. Entry costs, on a per subscriber basis, are generally less in the mobile<br />
wireless industry than in the wireline industry. 139 A high level of network deployment costs (a type of<br />
fixed cost 140 of building network capacity) in relation to the number of customers may limit the number<br />
of firms that can enter and survive in a market. 141 For example, areas with a low population density tend<br />
to have fewer facilities-based competitors (and higher concentration) than areas that have a high<br />
population density. 142 For an entrant to survive in the market, the market must be large enough for a<br />
potential entrant to recoup its network deployment costs over time from service revenues. Costs that<br />
136 High economic profits encourage entry to the market, low economic profits discourage entry, and prolonged<br />
negative economic profits induce exit from the market. See Intermediate Microeconomics, at 394-395, 503; Modern<br />
Industrial Organization, at 61, 76. See also, <strong>Competition</strong> After Unbundling, at 334.<br />
137<br />
See <strong>Competition</strong> After Unbundling, at 344. See also, Andreu Mas-Colell, et al., Microeconomic Theory, Oxford<br />
University Press, 1995, at 383-384, 423.<br />
138<br />
The backhaul transport link generally refers to the communications link between the cell site radio equipment<br />
and the core network.<br />
139 See, e.g., Ex Parte Submission of the United States Department of Justice, GN Docket No. 09-51 (Economic<br />
Issues in Broadband <strong>Competition</strong>, A National Broadband Plan for our Future), at 14; and Jonathan E. Nuechterlein<br />
and Philip J. Weiser, Digital Crossroads, American Telecommunications Policy in the Internet Age, MIT Press,<br />
2005, at 274.<br />
140 Fixed costs are costs that are associated with fixed factors in production and are generally incurred independent<br />
of the quantity of output. However, fixed costs can change if maximum production capacity is changed. They can<br />
be financed in many ways, including over time. See Intermediate Microeconomics, at 353.<br />
141 See W. Kip Viscusi, et al., Economics of Regulation and Antitrust (3 rd ed.), MIT Press, 2000, at 150 (Economics<br />
of Regulation and Antitrust). See also, <strong>Competition</strong> Policy, at 51, 76. See also, Avner Shaked and John Sutton,<br />
Product Differentiation and Industrial Structure, THE JOURNAL OF INDUSTRIAL ECONOMICS, Vol. 36, No. 2 (Dec.<br />
1987), at 131, 141 (arguing that markets are concentrated because market demand is high and the advancing<br />
technological frontier requires recurrent fixed costs). See also, <strong>Competition</strong> After Unbundling, at 332, 337. For the<br />
use of fixed costs to estimate market concentration, see, e.g., Modern Industrial Organization, at 41; Economics of<br />
Regulation and Antitrust, at 150. For the relevance of the size of sunk costs to predict market concentration, see<br />
<strong>Competition</strong> Policy, at 76-79; <strong>Competition</strong> After Unbundling, at 337; and Barriers to Understanding, at 467. See<br />
also, Written Statement of George S. Ford, Ph.D., Chief Economist, Phoenix Center for Advanced Legal &<br />
Economic Public Studies, Before the House of Representatives, Committee on Energy and Commerce,<br />
Subcommittee Telecommunications and the Internet, Hearing on “An Examination of <strong>Competition</strong> in the <strong>Wireless</strong><br />
Industry,” May 7, 2009, at 5, (estimating that three to five nationwide carriers will be able to provide mobile<br />
services, including mobile broadband).<br />
142 See Section III.C, Horizontal Concentration, infra.<br />
46
Federal Communications Commission <strong>FCC</strong> 10-81<br />
delay entry, sometimes referred to as “adjustment costs,” are relevant for estimating exactly when entry<br />
will occur. 143 A role of competition policy is to estimate how the timing of entry depends on various<br />
costs and to determine whether there are any relevant regulatory policy tools that can reduce entry<br />
delay. 144<br />
62. Spectrum. A potential facilities-based entrant to a wireless service market can obtain<br />
spectrum in several ways including purchasing spectrum at Commission auctions, purchasing spectrum in<br />
the secondary market, and leasing spectrum in the secondary market. For instance, in the two recent<br />
major spectrum auctions, the average spectrum price ranged from $0.53/MHz/Pop for the AWS-1<br />
(Advanced <strong>Wireless</strong> Service) band (1700/2100 MHz band) in Auction 66 to $1.28/MHz/Pop for the 700<br />
MHz band in Auction 73. 145 At these prices, aggregating a significant regional spectrum footprint would<br />
involve an outlay of hundreds of millions of dollars and a national footprint would require billions of<br />
dollars. Leasing spectrum in the secondary market can reduce initial spectrum acquisition costs,<br />
distributing the costs over time. Some companies such as Spectrum Bridge, Inc. provide online market<br />
places for spectrum exchange. 146 Additional information about spectrum can be found in Section VII.A.1.<br />
63. Network Coverage. To create a customer base, a new facilities-based entrant must<br />
provide network coverage that is sufficient to attract new customers, including enticing customers to<br />
switch from existing service providers. 147 Major network deployment costs include cell site acquisition,<br />
preparation, engineering, and construction. Network cost studies analyze cost scenarios under diverse<br />
sets of assumptions. One network cost study estimates that the total capital cost of deploying a cell site,<br />
on average, can be upwards of $200,000. 148 Regional wireless providers typically have hundreds or<br />
thousands of sites and national providers have tens of thousands of sites. A new entrant would therefore<br />
need to invest tens or hundreds of millions of dollars in capital expense for a regional network (depending<br />
on the size of the regions) and billions of dollars for a national network. We note that roaming on<br />
competitors’ networks can offer entrants access to greater network coverage while they are deploying<br />
their own networks. Providers, including new entrants to a mobile wireless market that typically deploy<br />
their planned networks gradually, may seek access to networks besides their own in order to achieve a<br />
competitive level of coverage while their network is being built out. Roaming can increase network<br />
coverage by allowing the entrant’s customers to have network coverage when they travel outside of the<br />
range of the entrant’s own network. 149<br />
64. Entrants often use backhaul provided by other firms, especially if construction of separate<br />
143 See Barriers to Understanding, at 468; What is a Barrier to Entry?, at 463.<br />
144 See, e.g., Barriers to Understanding, at 469; Malcolm B. Coate, Theory Meets Practice: Barriers to Entry in<br />
Merger Analysis, REVIEW OF LAW AND ECONOMICS, vol. 4, Feb. 2008, at 190 (Theory Meets Practice); What is a<br />
Barrier to Entry?, at 463-465. The difference between an adjustment cost and a barrier to entry (i.e. a permanent<br />
asymmetry in firms’ costs) may, in practice, be a matter of degree, depending on the length of the delay caused by<br />
the adjustment cost. See What is a Barrier to Entry?, at 464 (arguing that economies of scale are not barriers to<br />
entry), and 465 (arguing that sunk costs cause firms to delay entry because of their option value).<br />
145 Calculated by dividing the total net auction revenue by spectrum bandwidth and by the population in the year<br />
2000.<br />
146 Spectrum Bridge Inc.’s online market exchange, SpecEx, can be accessed at<br />
http://www.specex.com/Default.aspx (visited Apr. 21, 2010).<br />
147 A scale effect can occur when positive network externalities increase with the size of the network, a relationship<br />
known as “network effects.” See <strong>Competition</strong> Policy, at 82 (stating that greater network coverage, by increasing the<br />
pool of network users, increases the quality of the service, and, hence, the benefits consumers derive from the good).<br />
148 See Comments of <strong>Mobile</strong> Satellite Ventures Subsidiary LLC, WT Docket No. 06-150, Service Rules for the 698-<br />
746, 747-762 and 777-792 MHz Bands (filed June 20, 2008), at 49 (MSV 700 MHz Comments).<br />
149 See Section IV.B.1.c, Roaming, infra, for an additional discussion of roaming.<br />
47
Federal Communications Commission <strong>FCC</strong> 10-81<br />
backhaul facilities is not cost-justified given the size of the market. Backhaul can be a significant cost for<br />
new entrants; estimates of average monthly costs range from hundreds of dollars (for a T1 line) to<br />
$6,000. 150 The costs can vary widely by market and provider, and may affect the ability of entrants to<br />
compete successfully.<br />
65. Overall cell site and backhaul costs also depend on the spectrum held by new entrants. 151<br />
For instance, a new entrant with more spectrum bandwidth would be able to reduce its cell site and<br />
backhaul costs by deploying fewer cell sites and potentially fewer backhaul transmission lines for a given<br />
traffic volume. Additionally, a new entrant utilizing spectrum only in higher frequency bands may need<br />
to deploy more infrastructure, including cell sites to cover the same land area and therefore incur higher<br />
cell site costs, compared to providers using lower band spectrum. Additional discussions on cell site<br />
deployment and backhaul facilities can be found in Sections VII.A.2-3.<br />
66. Handsets and Devices. <strong>Mobile</strong> handsets and devices are the end points of mobile<br />
wireless networks that connect consumers to the networks. 152 They directly affect the quality of a<br />
consumer’s mobile wireless experience, and, hence, they factor into a consumer’s choice of a wireless<br />
provider. Depending on the market strategy of the entrant, its portfolio of handsets and devices may be a<br />
significant non-price factor affecting its ability to compete for customers. 153 Although handset<br />
manufacturers sell many handsets to any service provider with a compatible network, some handsets are<br />
subject to exclusivity arrangements that restrict their distribution to a single service provider in the United<br />
States. 154 Exclusive handset arrangements held by existing providers can create a kind of adjustment cost<br />
for potential entrants if lack of access to the exclusive technology delays the entry of potential entrants. 155<br />
67. Marketing and Distribution. The ability of a potential entrant to compete for customers<br />
is also influenced by its expenditures on marketing and the development of its Internet and non-Internet<br />
sales and distribution networks. Marketing expenditures help to distribute product information and<br />
promote brand recognition. Marketing expenditures are a significant factor of non-price competition in<br />
the mobile wireless industry. 156 The size of a provider’s sales and distribution networks is one measure of<br />
the provider’s penetration of the market. An entrant that has an existing customer base for other<br />
150 See MSV 700 MHz Comments. See also, Space Data Corporation Comments, WT Docket No. 06-150, PS Docket<br />
No. 06-229, Exhibit A (filed June 20, 2008) (backhaul cost ranging from $2,500 to $6,000); Clearwire NOI<br />
Comments at 8.<br />
151 See Section VII.A.1, Spectrum, infra.<br />
152 See Sections IV.B.3, Differentiation in <strong>Mobile</strong> <strong>Wireless</strong> Handsets/Devices and VII.B.1, <strong>Mobile</strong> <strong>Wireless</strong><br />
Handsets/Devices and Operating Systems, infra, for a more detailed discussion of handsets and devices.<br />
153 According to the Nielsen Company’s <strong>Mobile</strong> Insights survey, in the first quarter of 2009, the specific handset<br />
was the seventh ranking factor in consumers’ choice of a provider. Roger Entner, When Choosing A Carrier Does<br />
the iPhone Really Matter?, NIELSEN WIRE, Aug. 10, 2009 (citing data from The Nielsen Company’s <strong>Mobile</strong> Insights<br />
survey).<br />
154 See Section VII.B.1, <strong>Mobile</strong> <strong>Wireless</strong> Handsets/Devices and Operating Systems, infra.<br />
155 Lack of access to a particular good due to a legal restriction may have an effect on potential entrants similar to<br />
the good having a high price. However, see <strong>Competition</strong> Policy, at 378 (stating that it is well-known that exclusivity<br />
agreements can benefit innovation and consumers; the trade-offs must be evaluated in a case-by-case cost-benefit<br />
analysis).<br />
156 See Barriers to Understanding, at 467 (Advertising, like investments that raise product quality, is as common a<br />
competitive behavior in high-technology industries as price competition is in industries that are characterized by less<br />
product innovation). See also, Modern Industrial Organization, at 80 (If an incumbent has never had any rivals [i.e.<br />
it is a monopolist] then asymmetries in advertising costs between the incumbent and entrant can constitute a barrier<br />
to entry, because the monopolist has never had to bear these costs). However, the wireless telephony/broadband<br />
market is not a monopoly, and incumbent providers incur significant advertising costs as a component of their<br />
rivalry.<br />
48
Federal Communications Commission <strong>FCC</strong> 10-81<br />
telecommunication services (for example, Cox Communications, discussed below) may expect to have<br />
lower expenditures on marketing, sales, and distribution than an entrant that does not have a customer<br />
base in potentially complimentary telecommunication services that can be marketed in bundles.<br />
Marketing and advertising expenditures are discussed in Section IV.B.<br />
E. Recent Entry and Exit<br />
1. Entry<br />
68. Data and information about the stages a firm has completed in the entry process can<br />
provide valuable information for estimating the timeframe during which entry will be completed. Entry<br />
normally proceeds through several stages that require a significant period of time to complete, including<br />
raising financial capital, acquisition of spectrum rights, 157 deployment of the mobile wireless network,<br />
and a product launch stage during which a customer base is gained. Analysis of when entry will occur<br />
can be likened to a “pipeline” that is marked by increasing financial commitments and the completion of<br />
the various stages. 158 In particular, estimating the date of potential entry is one factor in a more<br />
comprehensive entry analysis that predicts how soon there will be new rivals who are in a position to<br />
place competitive constraints on the existing competitors. 159 Below we summarize entry commitments<br />
that are large enough to be consistent with entry that could introduce new competitive constraints at the<br />
regional or national level.<br />
69. Clearwire Corporation. Clearwire is an independent corporation in which Sprint Nextel<br />
is a majority shareholder. 160 In November 2008, with the Commission’s approval of the Sprint Nextel-<br />
Clearwire transaction, Sprint Nextel transferred its 2.5 GHz spectrum (both Broadband Radio Service<br />
(BRS) licenses and Educational Broadband Service (EBS) leases) and WiMAX network assets to<br />
Clearwire, which had significant holdings of 2.5 GHz spectrum. 161 The Sprint Nextel-Clearwire<br />
transaction was valued at $3.3 billion. 162 Clearwire holds 2.5 GHz spectrum in all markets across the<br />
United States. Comcast Corporation, Time Warner Cable Inc., Bright House Networks LLC, Google, and<br />
Intel Corporation agreed to invest $3.2 billion in Clearwire. 163 In November 2009, Clearwire reached an<br />
agreement with some of its investors to invest an additional $1.56 billion, with approximately two-thirds<br />
of this sum attributable to Sprint Nextel and the remainder attributable to Comcast, Time Warner Cable,<br />
Intel, Eagle River Holdings, and Bright House Networks. 164 Clearwire’s services consist primarily of<br />
wireless (mobile and fixed) broadband data in the 2.5 GHz BRS/EBS band; they offer a fixed wireless<br />
VoIP service, but not an interconnected mobile voice service. 165 Clearwire valued its spectrum license<br />
holdings at $4.49 billion in the third quarter of 2009, including the 2.5 GHz spectrum licenses that were<br />
157 We note that acquisition of spectrum, in itself, is not necessarily a good predictor of timely entry into a market.<br />
For a discussion of the discrepancy between the spectrum license coverage of some facilities-based providers and<br />
their network coverage, see Section VII.A.1, Spectrum, infra.<br />
158 See Theory Meets Practice, at 206.<br />
159 Id. at 190.<br />
160 Sprint Nextel Corporation, SEC Form 10-Q, filed Nov. 11, 2009, at 13.<br />
161 Sprint Nextel Corporation, SEC Form 10-K, filed Feb. 27, 2009, at 3.<br />
162 Id.<br />
163 See NCTA NOI Comments at 3.<br />
164 Clearwire Corp., SEC Form 10-Q, filed Nov. 10, 2009, at 26.<br />
165 Clearwire Corp., SEC Form 10-K, filed Mar. 26, 2009, at 3, 9 (“<strong>Mobile</strong> WiMAX technology enables us to offer<br />
mobile and fixed communications services over a single wireless network.”); Clear, <strong>Mobile</strong> Internet,<br />
http://www.clear.com/shop/services/mobile (visited Apr. 20, 2010); Clear, Home Internet,<br />
http://www.clear.com/shop/services/home (visited Apr. 20, 2010).<br />
49
transferred from Sprint Nextel to Clearwire. 166<br />
Federal Communications Commission <strong>FCC</strong> 10-81<br />
70. Clearwire is currently operating and continuing to deploy a mobile wireless network<br />
using the 802.16e mobile WiMAX technology. 167 As of December 31, 2009, Clearwire’s U.S. WiMAX<br />
network covered 27 markets and approximately 34.5 million people; it had approximately 392,000<br />
wireless broadband Internet subscribers (under the brand “CLEAR”) and 46,000 wholesale subscribers. 168<br />
In its other 30 markets, covering 7.2 million people, Clearwire offered fixed and portable wireless<br />
broadband service using a propriety network technology standard. 169 Clearwire has stated that it plans to<br />
upgrade the networks in the majority of these legacy markets to WiMAX technology over the next<br />
year. 170<br />
71. Clearwire has wholesale service agreements with its investors. 171 For example, Clearwire<br />
has an MVNO agreement with Sprint Nextel under which Sprint Nextel can purchase (at wholesale)<br />
mobile broadband data services from Clearwire for resale to consumers, and Clearwire can purchase (at<br />
wholesale) 3G CDMA mobile wireless voice and data services from Sprint Nextel for resale to<br />
consumers. Sprint Nextel states that amounts attributable to its resale agreements with Clearwire were<br />
immaterial as of the third quarter of 2009. 172<br />
72. Leap and MetroPCS. The entry of current facilities-based providers into new geographic<br />
markets is an important form of entry. 173 Leap and MetroPCS are metropolitan area service providers that<br />
have recently invested in new markets. Leap states that its business model is to keep “costs low by<br />
engineering high-quality, efficient networks covering only the urban and suburban areas where its<br />
potential customers live, work and play enabling it to sell its wireless minutes for less than it costs other<br />
carriers to produce theirs,” 174 and “provide customers with unlimited wireless services for a flat rate<br />
without requiring a fixed-term contract or a credit check.” 175 Leap, which holds many PCS licenses and<br />
AWS licenses (acquired at the 2006 auction) in markets throughout much of the country has expanded its<br />
coverage from approximately 53.9 million people in October 2008 to 80.5 million in October 2009, an<br />
increase of 26.6 million. MetroPCS states that it provides mobile wireless services in “selected major<br />
metropolitan areas in the United State[s,]” and it provides “a variety of wireless communications services<br />
to our subscribers on a no long-term contract, paid-in-advance, flat-rate, unlimited usage basis.” 176<br />
MetroPCS, which holds PCS and AWS spectrum in many markets throughout the United States, has<br />
expanded its facilities-based coverage from October 2008, when it covered approximately 56.0 million<br />
166 Clearwire Corp., SEC Form 10-Q, filed Nov. 10, 2009, at 3.<br />
167 Id. at 29.<br />
168 Clearwire Corp., SEC Form 10-K, filed Feb. 24, 2010, at 2.<br />
169 Id.<br />
170 Id.<br />
171 Clearwire Corp., SEC Form 10-Q, filed Nov. 10, 2009, at 30.<br />
172 See Sprint Nextel Corporation, SEC Form 10-Q, filed Nov. 11, 2009, at 7.<br />
173 For example, the Twelfth <strong>Report</strong> discusses how, following the acquisition of new spectrum holdings in 2006, T-<br />
<strong>Mobile</strong>, Leap, and MetroPCS entered new markets. See Twelfth <strong>Report</strong>, 23 <strong>FCC</strong> Rcd at 2265, 75. See also,<br />
Cellular South, About Us, https://www.cellularsouth.com/aboutus/index.html (visited Jan. 4, 2010) (stating that,<br />
since 2006, Cellular South has significantly increased the size of its regional coverage).<br />
174 Leap, About Leap, http://www.leapwireless.com/l1_about_leap.htm (visited Jan. 13, 2010).<br />
175 Leap <strong>Wireless</strong> International Inc., SEC Form 10-K, filed Mar. 1, 2010, at 1. Verizon <strong>Wireless</strong> claims that Leap<br />
and MetroPCS have been achieving penetration rates of between 8 and 13 percent in markets where they have been<br />
active for five or more years. See Verizon <strong>Wireless</strong> PN Comments at 4.<br />
176 MetroPCS Communications Inc., SEC Form 10-K, filed Mar. 1, 2010, at 5.<br />
50
Federal Communications Commission <strong>FCC</strong> 10-81<br />
people, to 84.6 million people in October 2009, an increase of 28.6 million. According to American<br />
Roamer 2008 and 2009 data, the coverage of Leap does not generally overlap with the coverage of<br />
MetroPCS, except near Philadelphia, PA and between Fresno and Sacramento,<br />
CA.<br />
73. Cox Communications. Cox Communications (Cox) invested more than $500 million in<br />
spectrum in the AWS and 700 MHz bands and the development of infrastructure in 2006 and 2008. 177 In<br />
2008, Cox announced plans to deploy a 3G mobile wireless network in selected regions of the United<br />
States. 178 In 2009, Huawei Technologies announced that it had signed a contract with Cox<br />
Communications to supply CDMA 1x and EV-DO network infrastructure and equipment for a Cox<br />
Communications mobile wireless network. 179 Cox Enterprises, the parent company of Cox<br />
Communications, states that its planned mobile wireless services will be bundled with other Cox products<br />
and will initially be targeted at its existing customer base. 180 Similarly, an industry press report asserts<br />
that Cox’s mobile wireless network deployment plans would focus on deploying in geographic markets<br />
where it already offers other products. 181 Cox currently has about 6 million customers for its cable and<br />
broadband products. 182<br />
2. Exit<br />
74. Exit of service providers, whether through mergers, acquisitions, or discontinuance,<br />
affects the structure of the mobile wireless market and potentially exerts both negative and positive<br />
effects on competitive performance and consumer welfare, depending on details of the pre- and post-exit<br />
competitors in the market. The main potential negative effect of the exit of a competitor is that with<br />
fewer competitors remaining in the market, there is an increased possibility of higher prices, reduced<br />
quality of services, or a slower rate of innovation. The main potential positive effects of the exit of a<br />
competitor occur in the context of a merger or acquisition that creates a stronger competitor due to cost<br />
efficiencies or greater network coverage. 183 Since mergers and acquisitions can exhibit these positive and<br />
negative effects simultaneously, merger analysis typically involves a detailed analysis to evaluate the<br />
magnitude of the opposing effects and determine whether, on balance, the effects of the merger are<br />
positive or negative. If the cost savings generated by consolidation endow the merged provider with the<br />
ability to compete more effectively, consolidation could result in lower prices and new and innovative<br />
177 Cox to Launch Next Generation Bundle with <strong>Wireless</strong> in 2009, Press Release, Cox, Oct. 27, 2008. Cox holds the<br />
spectrum through the SpectrumCo LLC joint venture, the entity that purchased the AWS spectrum at the<br />
Commission’s 2006 AWS-1 Auction and originally included three other cable operators. The other operators<br />
subsequently left the SpectrumCo venture, and Cox is the only remaining member. Marguerite Reardon, Cox<br />
<strong>Wireless</strong> Coming in March, CNET NEWS, Jan. 14, 2010, available at http://news.cnet.com/8301-30686_3-<br />
10434831-266.html.<br />
178<br />
Cox to Launch Next Generation Bundle with <strong>Wireless</strong> in 2009, Press Release, Cox, Oct. 27, 2008; NCTA NOI<br />
Comments at 2.<br />
179 See Huawei to Provide CDMA Technology for Cox Communications’ <strong>Wireless</strong> Network, Press Release, Huawei<br />
Technologies, Apr. 1, 2009. See also, Amol Sharma and Sarah Silver, Huawei Tries to Crack U.S. Market, WALL<br />
STREET JOURNAL, Mar. 26, 2009, at B2.<br />
180<br />
See Cox Enterprises, 2008 Annual <strong>Report</strong>, at 3, available at http://www.corporatereport.com/cox2008/index.html<br />
(visited Apr. 20, 2010).<br />
181<br />
See Amol Sharma and Vishesh Kumar, Cox Plans to Launch a Cellular Network, WALL STREET JOURNAL, Apr.<br />
8, 2009, at B5.<br />
182<br />
See Cox, Cox Communications Fact Sheet, http://ww2.cox.com/aboutus/oklahomacity/newsroom/pressresources/fact-sheet.cox<br />
(visited Jan. 4, 2010).<br />
183 See <strong>Competition</strong> Policy, at 238. See also, Daniel Birke and G. M. Peter Swann, Network Effects and the Choice<br />
of <strong>Mobile</strong> Phone Operator, JOURNAL OF EVOLUTIONARY ECONOMICS, 2006, 16: 65 – 84.<br />
51
Federal Communications Commission <strong>FCC</strong> 10-81<br />
services for consumers. 184 However, if the consolidation substantially increases the size of the firm, there<br />
may be reduced competitive pressure on the firm, potentially leading to higher consumer prices or lower<br />
incentive to improve its consumer services. 185 Service providers in non-overlapping geographic markets<br />
are not considered competitors for present purposes.<br />
75. Mergers and Acquisitions. Facilities-based providers have expanded their network<br />
coverage and capacity through mergers and acquisitions, as well as through increased investment and<br />
expansion of their existing assets. Through the years, the four nationwide facilities-based providers have<br />
all employed mergers or acquisitions as a growth strategy to realize nationwide networks. 186 A summary<br />
of significant mergers or acquisitions since 2005 involving a nationwide facilities-based provider and the<br />
exit of another facilities-based provider appears in Table 9. 187 The table provides an overview and<br />
background for the transactions discussed in detail below and indicates that each of the four nationwide<br />
facilities-based providers has used mergers or acquisitions to expand coverage since 2005. In many<br />
instances, the entities that were combined had not previously competed in the same geographic market; as<br />
a result these transactions resulted in the expansion of the coverage of the newly combined entity. In<br />
markets where the entities were significant competitors, the Commission may have required divestitures<br />
in specified markets as conditions of the transaction in order to prevent competitive harm. 188 Below we<br />
summarize these transactions and report on the status of divestitures that were required in some recent<br />
transactions.<br />
Table 9<br />
Selected Mergers and Acquisitions: 2005-2009<br />
Year of<br />
Commission<br />
Approval<br />
52<br />
Merger<br />
2005 Sprint/Nextel<br />
2007 AT&T/Dobson<br />
2008 AT&T/Aloha<br />
T-<strong>Mobile</strong>/Suncom<br />
Verizon <strong>Wireless</strong>/Rural Cellular<br />
Verizon <strong>Wireless</strong>/Alltel<br />
Sprint Nextel/Clearwire<br />
2009 AT&T/Centennial<br />
76. Sprint Nextel – Sprint/Nextel and Sprint Nextel/Clearwire. In 2005, Sprint combined its<br />
PCS and BRS holdings with Nextel’s Specialized <strong>Mobile</strong> Radio (SMR), PCS, and 2.5 GHz (BRS licenses<br />
184 See Jonathan B. Baker, Developments in Antitrust Economics, JOURNAL OF ECONOMIC PERSPECTIVES, 1999, 13:<br />
1, 182.<br />
185 See Economics of Regulation and Antitrust, at 126.<br />
186 See Section III.B.1, Facilities-Based Providers, supra, for a discussion of the term “nationwide.”<br />
187 The Commission must consent to the transfer of control or assignment of all non pro-forma spectrum licenses<br />
used to provide wireless telecommunications services. 47 C.F.R. § 1.948.<br />
188 See, e.g., AT&T-Centennial Order, 24 <strong>FCC</strong> Rcd at 13915.
Federal Communications Commission <strong>FCC</strong> 10-81<br />
and EBS leases) spectrum holdings to create Sprint Nextel. 189 As discussed above, in 2008, Sprint Nextel<br />
and Clearwire combined their 2.5 GHz spectrum holdings into a new company, also named Clearwire.<br />
The Commission consented to this transaction in November 2008, and the companies closed their<br />
transaction later that month. 190<br />
77. AT&T – AT&T/Dobson, AT&T/Aloha, and AT&T/Centennial. As mentioned in last<br />
year’s <strong>Report</strong>, in November 2007, following Commission approval, AT&T acquired Dobson<br />
Communications Corporation, which held cellular, PCS, and AWS licenses and related assets, subject to<br />
divestitures in four markets. 191 In February 2008, following Commission approval, AT&T acquired the<br />
700 MHz spectrum holdings of Aloha Spectrum Holdings Company, which had acquired the licenses at<br />
auction in 2003. 192<br />
78. More recently, on November 5, 2009, the Commission consented with conditions to<br />
AT&T’s acquisition of Centennial Communications Corp. (Centennial). 193 On November 6, 2009, AT&T<br />
completed its acquisition of Centennial, with Centennial shareholders receiving approximately $945<br />
million in cash in exchange for their shares. 194 Centennial held cellular, PCS, and AWS spectrum and<br />
EBS leases. Using GSM-track technology, Centennial provided voice and data wireless service to<br />
approximately 633,100 wireless customers in two geographic clusters in the mainland United States in<br />
parts of Indiana, Michigan, and Ohio (the Midwest cluster) and parts of Louisiana, Mississippi, and Texas<br />
(the Southeast cluster). 195 It also provided mobile wireless service to approximately 424,400 subscribers<br />
in Puerto Rico and the U.S. Virgin Islands using CDMA-track technology. 196<br />
79. The Commission determined that competitive harm was unlikely in most mobile wireless<br />
markets as a result of the AT&T/Centennial transaction, and that the public interest, convenience, and<br />
necessity were served by the transaction, subject to certain conditions imposed on the transaction in the<br />
Commission’s Memorandum Opinion and Order. 197 To remedy likely anti-competitive harms in<br />
particular geographic markets stemming from the proposed transaction, the Commission required AT&T<br />
to divest virtually all of Centennial’s mobile wireless assets in seven geographic markets, six in Louisiana<br />
and one in Mississippi. 198 The Commission also determined that the public interest would be served by<br />
requiring AT&T to honor the terms of Centennial’s existing roaming agreements, and in some cases to<br />
189 The Commission consented to that merger in August, 2005. Applications of Nextel Communications, Inc. and<br />
Sprint Corporation For Consent to Transfer Control of Licenses and Authorizations, File Nos. 0002031766, et al.,<br />
WT Docket No. 05-63, Memorandum Opinion and Order, 20 <strong>FCC</strong> Rcd 13967 (2005).<br />
190 Sprint Nextel Corporation and Clearwire Corporation, Applications for Consent to Transfer Control of Licenses,<br />
Leases, and Authorizations, WT Docket No. 08-94, Memorandum Opinion and Order, 23 <strong>FCC</strong> Rcd 17570 (2008)<br />
(Sprint Nextel-Clearwire Order). See also, Thirteenth <strong>Report</strong>, 24 <strong>FCC</strong> Rcd at 6218, 59-60.<br />
191 Applications of AT&T Inc. and Dobson Communications Corporation For Consent to Transfer Control of<br />
Licenses and Authorizations, File Nos. 0003092368 et al., WT Docket No. 07-153, Memorandum Opinion and<br />
Order, 22 <strong>FCC</strong> Rcd 20295 (2007) (AT&T-Dobson Order).<br />
192 Application of Aloha Spectrum Holdings Company LLC (Assignor) and AT&T Mobility II LLC (Assignee)<br />
Seeking <strong>FCC</strong> Consent For Assignment of Licenses and Authorizations, Memorandum Opinion and Order, 23 <strong>FCC</strong><br />
Rcd 2234, 2337 13 (2008); Twelfth <strong>Report</strong>, 23 <strong>FCC</strong> Rcd at 2241 64.<br />
193 AT&T-Centennial Order.<br />
194<br />
AT&T Completes Acquisition of Centennial Communications, Press Release, AT&T, Nov. 6, 2009. See also,<br />
AT&T Inc., SEC Form 8-K, filed Nov. 6, 2009.<br />
195 AT&T-Centennial Order, 24 <strong>FCC</strong> Rcd at 13919, 8.<br />
196 Id. at 13919, 9.<br />
197 Id. at 13981, 166.<br />
198 Id. at 13961, 111. The DOJ required divestiture in an additional market. Id. at 13926, 23.<br />
53
Federal Communications Commission <strong>FCC</strong> 10-81<br />
potentially extend their duration beyond the terms in the original roaming contracts. 199 The Commission<br />
determined that the transaction, subject to the previously discussed conditions, would likely result in<br />
public interest benefits, including increasing the variety and quality of service and product offerings<br />
available to users of the Centennial wireless network, 200 reducing the roaming fees of subscribers, 201<br />
increasing the seamless network coverage available to subscribers, 202 and decreasing the amount of time<br />
required to upgrade the Centennial network to 3G and 4G quality and capacity. 203<br />
80. T-<strong>Mobile</strong> – T-<strong>Mobile</strong>/Suncom. In February 2008, following Commission approval, T-<br />
<strong>Mobile</strong> expanded its coverage footprint through its acquisition of Suncom, which held PCS spectrum and<br />
had operated in four states, Puerto Rico, and the U.S. Virgin Islands serving more than 1.1 million<br />
customers. 204<br />
81. Verizon <strong>Wireless</strong> – Verizon <strong>Wireless</strong>/Rural Cellular Corporation and Verizon<br />
<strong>Wireless</strong>/Alltel. In August 2008, following Commission consent that required divestitures in four<br />
markets, Verizon <strong>Wireless</strong> acquired Rural Cellular Corporation, which held cellular and PCS licenses<br />
covering markets in 12 states. 205<br />
82. In June 2008, Verizon <strong>Wireless</strong> announced that it had agreed to acquire the equity of<br />
Alltel for approximately $5.9 billion and an aggregate transaction value of $28.1 billion based on Alltel’s<br />
projected net debt at closing of $22.2 billion. 206 Alltel held Cellular, SMR, PCS, and 700 MHz spectrum<br />
holdings, and was serving more than 13 million customers in markets in 34 states, including 57 primarily<br />
rural markets that Verizon <strong>Wireless</strong> did not serve. 207 Verizon <strong>Wireless</strong> claimed that it expected to realize<br />
synergies with a net present value, after integration costs, of more than $9 billion driven by reduced<br />
capital and operating expense savings. 208 Verizon <strong>Wireless</strong> believed that the synergies of the merger<br />
would generate incremental cost savings of $1 billion in the second year after closing. 209 According to<br />
Verizon <strong>Wireless</strong>’ Chief Executive Officer, the transaction would “create an enhanced platform of<br />
network coverage, spectrum and customer care to better serve the growing needs of both Alltel and<br />
Verizon <strong>Wireless</strong> customers for reliable basic and advanced broadband wireless services.” 210 Verizon<br />
199 Id. at 13968, 129.<br />
200 Id. at 13955-57, 94, 99, 100.<br />
201 Id. at 13955, 95.<br />
202 Id.<br />
203 Id. at 13956, 96-98.<br />
204 Applications of T-<strong>Mobile</strong> USA, Inc. and SunCom <strong>Wireless</strong> Holdings, Inc. For Consent to Transfer Control of<br />
Licenses and Authorizations and Petition for Declaratory Ruling that the Transaction is Consistent with Section<br />
310(b)(4) of the Communications Act, Memorandum Opinion and Order, 23 <strong>FCC</strong> Rcd 2515, 2526 27 (2008);<br />
Twelfth <strong>Report</strong>, 23 <strong>FCC</strong> Rcd at 2272, 67-68.<br />
205 Applications of Cellco Partnership d/b/a Verizon <strong>Wireless</strong> and Rural Cellular Corporation, for Consent to<br />
Transfer Control of Licenses, Authorizations, and Spectrum Manager Leases, and Petitions for Declaratory Ruling<br />
that the Transaction is Consistent with Section 310(b)(4) of the Communications Act, WT Docket No. 07-208,<br />
Memorandum Opinion and Order and Declaratory Ruling, 23 <strong>FCC</strong> Rcd 12463, 12465 3 (2008) (Verizon-RCC<br />
Order); Thirteenth <strong>Report</strong>, 24 <strong>FCC</strong> Rcd at 6217, 57-58.<br />
206<br />
Verizon <strong>Wireless</strong> To Acquire Alltel; Will Expand Nation’s Most Reliable <strong>Wireless</strong> Network, Press Release,<br />
Verizon <strong>Wireless</strong>, June 5, 2008.<br />
207 Id.<br />
208 Id.<br />
209 Id.<br />
210 Id.<br />
54
Federal Communications Commission <strong>FCC</strong> 10-81<br />
<strong>Wireless</strong> and Alltel filed a series of applications to seek Commission approval of their transaction. 211<br />
83. The Commission approved the Verizon <strong>Wireless</strong>/Alltel transaction on November 4,<br />
2008. 212 The Commission conditioned its approval of the transaction on the companies divesting the<br />
licenses and related operational and network assets in five markets where the Commission found potential<br />
for competitive harm. 213 The Commission also conditioned the transaction on the companies’ voluntary<br />
commitment to divest the licenses and related operational and network assets in 100 markets and on<br />
Verizon <strong>Wireless</strong>’s voluntary commitments with respect to providing roaming services to other<br />
providers. 214 The companies closed their transaction on January 9, 2009. 215<br />
84. Divestitures. The divestitures of the mobile wireless assets by Verizon <strong>Wireless</strong> and<br />
AT&T – as conditions of the Verizon <strong>Wireless</strong>/Rural Cellular, Verizon <strong>Wireless</strong>/Alltel, and<br />
AT&T/Centennial transactions, respectively – have not all received regulatory approval (by the<br />
Commission and the DOJ) as of the end of 2009. 216 Subject to regulatory approval, Verizon <strong>Wireless</strong> has<br />
agreed to divest to AT&T 79 of the 105 service areas covered under the DOJ/Commission rulings on the<br />
Verizon/Alltel and Verizon/Rural Cellular transactions; 217 and has agreed to divest to Atlantic Tele-<br />
Network Inc. (ATN) the remaining 26 service areas covered under the DOJ/Commission rulings on the<br />
Verizon <strong>Wireless</strong>/Alltel transactions. 218 Subject to regulatory approval, AT&T has agreed to divest to<br />
Verizon <strong>Wireless</strong> five of the eight Centennial service areas covered under the DOJ/Commission<br />
211 “Verizon <strong>Wireless</strong> and Atlantis Holdings LLC Seek <strong>FCC</strong> Consent to Transfer Licenses, Spectrum Manager and<br />
De Facto Transfer Leasing Arrangements, and Authorizations, and Request a Declaratory Ruling on Foreign<br />
Ownership,” WT Docket No. 08-95, Public Notice, 23 <strong>FCC</strong> Rcd 10004 (WTB 2008).<br />
212 Applications of Cellco Partnership d/b/a Verizon <strong>Wireless</strong> and Atlantis Holdings LLC For Consent to Transfer<br />
Control of Licenses, Authorizations, and Spectrum Manager and De Facto Transfer Leasing Arrangements and<br />
Petition for Declaratory Ruling that the Transaction is Consistent with Section 310(b)(4) of the Communications<br />
Act, WT Docket No. 08-95, Memorandum Opinion and Order, 23 <strong>FCC</strong> Rcd 17444, 17546-47 233 (2008) (Verizon<br />
<strong>Wireless</strong>-Alltel Order).<br />
213 Id. at 17491-93, 100-106.<br />
214 See id. at 17515-16, 17524-25, 17546-47, 157, 178-181, 233. The Commission conditioned its approval of the<br />
transaction on Verizon <strong>Wireless</strong>’s compliance with a voluntary commitment to phase out its requests for federal<br />
high-cost universal service support over a five-year transition period and with a voluntary commitment to use<br />
counties for measuring compliance with the Commission’s wireless E911 location accuracy rules governing<br />
handset-based technologies. Id. at 17532-33, 197 & 201.<br />
215<br />
Verizon <strong>Wireless</strong> Completes Purchase of Alltel; Creates Nation’s Largest <strong>Wireless</strong> Carrier, Press Release,<br />
Verizon <strong>Wireless</strong>, Jan. 9, 2009.<br />
216 For a discussion of the divestiture requirements of these transactions, see Verizon-RCC Order 23 <strong>FCC</strong> Rcd at<br />
12512-15, 110-122; Verizon <strong>Wireless</strong>-Alltel Order, 23 <strong>FCC</strong> Rcd 17491-93, 17515-18, 99-106, 157-162;<br />
AT&T-Centennial Order, 24 <strong>FCC</strong> Rcd 13960-63, 109-119.<br />
217 AT&T Updates Anticipated Completion Date of Divestiture Properties From Verizon <strong>Wireless</strong>, Press Release,<br />
AT&T, Dec. 11, 2009. See “AT&T Inc. and Cellco Partnership d/b/a Verizon <strong>Wireless</strong> Seek <strong>FCC</strong> Consent To<br />
Assign or Transfer Control of Licenses and Authorizations and Modify a Spectrum Leasing Arrangement,” WT<br />
Docket No. 09-104, Public Notice, 24 <strong>FCC</strong> Rcd 8171 (WTB 2009). These service areas include areas in Alabama,<br />
Arizona, California, Colorado, Iowa, Kansas, Michigan, Minnesota, Montana, Nebraska, Nevada, New Mexico,<br />
North Dakota, South Dakota, Tennessee, Utah, Virginia and Wyoming. See AT&T to Acquire Divestiture<br />
Properties from Verizon <strong>Wireless</strong>, Enhance Network Coverage and Customer Service, Press Release, AT&T, May 8,<br />
2009.<br />
218 See “Atlantic Tele-Network, Inc. and Verizon <strong>Wireless</strong> Seek <strong>FCC</strong> Consent To Assign or Transfer Control of<br />
Licenses and Authorizations,” WT Docket No. 09-119, Public Notice, 24 <strong>FCC</strong> Rcd 9035 (WTB 2009); Verizon<br />
Communications, Inc., SEC Form 10-Q, filed Oct. 29, 2009, at 8.<br />
55
Federal Communications Commission <strong>FCC</strong> 10-81<br />
rulings. 219 The Commission has stated that divestiture transactions are evaluated, upon receipt of the<br />
application(s) for transfers, by the same competitive and public interest criteria that the Commission<br />
regularly applies to transactions. 220<br />
219 AT&T Completes Acquisition of Centennial Communications, Press Release, AT&T, Nov. 6, 2009. See “Cellco<br />
Partnership d/b/a Verizon <strong>Wireless</strong> and AT&T Inc. Seek <strong>FCC</strong> Consent To Assign or Transfer Control of Licenses<br />
and Authorizations and Request a Declaratory Ruling on Foreign Ownership,” WT Docket No. 09-121, Public<br />
Notice, 24 <strong>FCC</strong> Rcd 11314 (WTB 2009).<br />
220 Verizon <strong>Wireless</strong>-Alltel Order, 23 <strong>FCC</strong> Rcd at 17518, 162.<br />
56
Federal Communications Commission <strong>FCC</strong> 10-81<br />
IV. MOBILE WIRELESS SERVICES: PROVIDER CONDUCT<br />
85. In addition to industry structure, a second key element of our analysis of competition in<br />
the mobile wireless services sector is an examination of the conduct of mobile wireless services<br />
providers—in particular, whether they engage in price and non-price rivalry.<br />
86. During 2008 and 2009, mobile wireless service providers continued to compete on the<br />
basis of pricing plans as well as on various non-price factors, such as network upgrades; product<br />
information and perception, which include advertising and marketing; and downstream product<br />
differentiation, which includes handset/device and application offerings. 221 Indicators of non-price<br />
rivalry, which are discussed in detail below, include technology deployment and upgrades, advertising<br />
and marketing strategies and expenditures, and handsets/devices and application offerings.<br />
A. Price Rivalry: Developments in <strong>Mobile</strong> Service Pricing Plans<br />
87. One way that mobile wireless providers compete is through differentiated pricing plans.<br />
In the mobile wireless sector, we observe varying pricing levels and structures, for varying service<br />
packages, with various handsets and policies on handset pricing. Today, all of the nationwide service<br />
providers, and many smaller operators, offer some version of a national flat-rate pricing plan in which<br />
customers can purchase a “bucket” of minutes to use on a nationwide or nearly nationwide network<br />
without incurring roaming or long-distance charges. All the nationwide service providers also offer some<br />
version of a family plan. 222<br />
88. Operators have experimented with various types of “unlimited” calling options. 223 For<br />
example, some providers offer “calling circle” plans that allow subscribers unlimited free calling to and<br />
from a small number of designated numbers, regardless whether they are for wireline or wireless<br />
phone, 224 while other providers offer plans that provide for free calls only to customers who use the same<br />
mobile wireless provider (“on-net” mobile-to-mobile options). 225 In 2008, unlimited national flat-rate<br />
calling plans were launched by all the nationwide operators, 226 and then spread from postpaid service to<br />
the prepaid and reseller segment of the market. 227 Both postpaid and prepaid versions of these unlimited<br />
flat-rate plans include bundled options that combine unlimited nationwide calling with either unlimited<br />
text messaging or unlimited use of other data services as well as text messaging. 228 Finally, a number of<br />
smaller, regional, and multi-metro providers, like Leap and MetroPCS, also have been offering unlimited<br />
local calling plans. 229 As detailed below, the pricing conduct of mobile wireless providers in 2009 and<br />
early 2010 included changes in the monthly price of service plans, the attachment of additional features to<br />
existing plans, the introduction of new pricing options for customers who choose to forego discounted<br />
handsets, and the launch of new unlimited prepaid service offerings.<br />
221<br />
See CTIA NOI Comments, at 63-64.<br />
222<br />
See Tenth <strong>Report</strong>, 20 <strong>FCC</strong> Rcd at 15946, 98.<br />
223<br />
See Twelfth <strong>Report</strong>, 23 <strong>FCC</strong> Rcd at 2292, 113; CTIA PN Comments at 24-28.<br />
224<br />
Eleventh <strong>Report</strong>, 21 <strong>FCC</strong> Rcd at 10984, 91. See also Allie Winter, Verizon <strong>Wireless</strong> Apes Alltel’s My Circle<br />
With New Small Businesses Calling Plan, RCR WIRELESS NEWS, June 11, 2008 (reporting that, in June 2008,<br />
Verizon <strong>Wireless</strong> also introduced a new plan for businesses, allowing unlimited calling between a Verizon <strong>Wireless</strong><br />
number and up to five wireline numbers for $5 per line).<br />
225 Eleventh <strong>Report</strong>, 21 <strong>FCC</strong> Rcd at 10984, 91.<br />
226 Thirteenth <strong>Report</strong>, 24 <strong>FCC</strong> Rcd at 6244, 112.<br />
227 Id. at 6246, 118.<br />
228 Id. at 6247, 120.<br />
229 See id. at 6295, 231; RTG PN Comments at 10.<br />
57
1. Postpaid Service<br />
Federal Communications Commission <strong>FCC</strong> 10-81<br />
89. In the period since the release of the Thirteenth <strong>Report</strong>, pricing competition among the<br />
nationwide service providers in the postpaid market initially centered on changes in the composition of<br />
pricing plans, rather than outright price cuts. 230 In general, there were three types of postpaid price<br />
changes: new features added to existing price plans, new unlimited calling plans, and ancillary terms and<br />
conditions. Each is described in turn below.<br />
90. New Pricing Features. Some of the nationwide operators further differentiated their<br />
service plans by attaching additional features to existing plans, without changing core components such as<br />
the monthly recurring charge and the number of “anytime” minutes offered in each tier. 231 While the<br />
monthly bill remains unchanged, the additional features are designed to create a perception that<br />
consumers are getting more value for their money. For example, in September 2009, AT&T introduced<br />
its “A-List” calling feature, which allows unlimited mobile calling to and from any five “VIP” domestic<br />
phone numbers for individual plans, and any ten numbers for family plans. 232 The A-List feature, which<br />
was included at no additional charge with individual and family plans offering a minimum number of<br />
anytime minutes, was designed to compete with earlier unlimited “calling circle” options, such as T-<br />
<strong>Mobile</strong>’s myFaves and Verizon <strong>Wireless</strong>’s Friends and Family options. 233 Also in September 2009,<br />
Sprint Nextel launched its “Any <strong>Mobile</strong>, Anytime” feature, which allows unlimited mobile-to-mobile<br />
calling to any domestic wireless number, rather than just a limited selection of designated wireless and<br />
wireline numbers. 234 The Any <strong>Mobile</strong>, Anytime feature was offered at no additional charge with Sprint<br />
Nextel’s existing “Everything Data” plan, and was included with individual and family plans offering<br />
buckets of anytime minutes for calls to and from wireline numbers. 235<br />
91. Unlimited Calling Plans. The focus of price competition now appears to be shifting to<br />
unlimited service offerings. In an effort to reduce churn, T-<strong>Mobile</strong> introduced a lower-priced version of<br />
its unlimited national voice calling plan in the first quarter of 2009, but limited its availability to select<br />
existing customers. 236 With the subsequent launch of its new “Even More” plans in October 2009, T-<br />
<strong>Mobile</strong> reset prices on tiered offerings at significant discounts to its legacy plans, and brought its pricing<br />
structure more closely into line with that of Sprint Nextel, the least expensive nationwide service<br />
provider. 237 The biggest pricing changes were made on T-<strong>Mobile</strong>’s unlimited service offerings, which<br />
include bundled voice, text and data offerings as well as an unlimited voice-only calling plan. 238 At the<br />
same time, T-<strong>Mobile</strong> discontinued its myFaves unlimited calling circle offer. 239<br />
230 David W. Barden, et al., <strong>Wireless</strong> Service and Handset Pricing – Pressure Building, Bank of America, Equity<br />
Research, Oct. 5, 2009, at 6 (<strong>Wireless</strong> Service and Handset Pricing – Pressure Building).<br />
231 Id. at 1, 5.<br />
232 Id. at 6.<br />
233 Id.<br />
234 Id.<br />
235<br />
Id.; John C. Hodulik, et al., Waiting for T-<strong>Mobile</strong> to Pull the Price Lever, UBS, Global Equity Research, Oct. 12,<br />
2009, at 3 (T-<strong>Mobile</strong> Price Lever).<br />
236<br />
T-<strong>Mobile</strong> Price Lever, at 3; Craig Moffet, et al., U.S. <strong>Wireless</strong> ’09: A Recipe for Disaster?, Bernstein Research,<br />
Mar. 5, 2009, at 15 (Recipe for Disaster).<br />
237 David W. Barden, et al., <strong>Wireless</strong> Service and Handset Pricing – Tick Tock, Bank of America, Equity Research,<br />
Jan. 10, 2010, at 1-2, 5-6 (<strong>Wireless</strong> Service and Handset Pricing – Tick Tock); <strong>Wireless</strong> Service and Handset Pricing<br />
– Pressure Building, at 1, 3.<br />
238 <strong>Wireless</strong> Service and Handset Pricing – Tick Tock, at 1-2, 5.<br />
239 Id. at 5.<br />
58
Federal Communications Commission <strong>FCC</strong> 10-81<br />
92. Even before T-<strong>Mobile</strong> launched its new pricing plans, Verizon <strong>Wireless</strong> and AT&T<br />
priced their postpaid service offerings at a premium relative to those of T-<strong>Mobile</strong> and Sprint Nextel. 240<br />
According to analysts, this premium reflected the willingness of consumers to pay higher prices for access<br />
to preferred handsets and data offerings, 241 and in Verizon <strong>Wireless</strong>’s case, positive perceptions of its<br />
network. 242 T-<strong>Mobile</strong>’s price changes appear to have prompted Verizon <strong>Wireless</strong> and AT&T to narrow<br />
the price premium on unlimited service offerings. 243 In January 2010, Verizon <strong>Wireless</strong> reduced the<br />
prices of its unlimited voice plans for both individual and shared family offerings. 244 Later the same day,<br />
AT&T responded to Verizon <strong>Wireless</strong>’s changes with matching price reductions on its unlimited voice<br />
plans. 245 While Verizon <strong>Wireless</strong>’s and AT&T’s unlimited plan price cuts were significant, their postpaid<br />
service offerings remained the most expensive in the industry, even following these price changes, as the<br />
prices of Sprint Nextel’s and T-<strong>Mobile</strong>’s equivalent or comparable unlimited plans had already declined<br />
sharply. 246<br />
Table 10<br />
Comparison of Unlimited Pricing Plans 247<br />
Verizon <strong>Wireless</strong> AT&T T-<strong>Mobile</strong> Sprint Nextel<br />
Voice $69.99 $69.99 $59.99 Not offered<br />
Voice + Text $89.99 $89.99 $69.99 Not offered<br />
Voice + Text + Basic Data $99.99 $99.99 $79.99 Not offered<br />
Voice + Text + Smartphone Data $119.99 $119.99 $99.99 $99.99<br />
93. Ancillary Terms and Conditions. While Verizon <strong>Wireless</strong> and AT&T shared a virtually<br />
identical tiered pricing structure before and after these pricing changes, in the past year Verizon <strong>Wireless</strong><br />
has differentiated its pricing from that of AT&T and the other two national operators in three interrelated<br />
areas: early termination fees (ETFs), data plan requirements for advanced devices, and handset pricing<br />
and subsidies.<br />
94. Under the postpaid handset subsidy model, customers are required to sign a one- to twoyear<br />
service contract in exchange for purchasing a handset at a discount, and are subject to paying an ETF<br />
if they cancel their wireless service before the term of their service contract expires. In November 2009,<br />
Verizon <strong>Wireless</strong> introduced a new two-tiered structure for ETFs. The ETF starts at one amount for<br />
240 Id. at 6; Recipe for Disaster, at 26.<br />
241 Recipe for Disaster, at 26.<br />
242 Roger Cheng, Wal-Mart <strong>Wireless</strong> Expands, Wall Street Journal, Oct. 15, 2009. See also, Roger Entner, When<br />
Choosing a Carrier, Does the iPhone Really Matter?, NIELSENWIRE, Aug. 10, 2009, at 2 (noting that “the number of<br />
consumers who perceive Verizon <strong>Wireless</strong> as having the best mobile network has shot up over the last two years and<br />
it leads its closest competitor now by an almost 2:1 margin”).<br />
243 T-<strong>Mobile</strong> Price Lever, at 2.<br />
244 Verizon <strong>Wireless</strong> Offers Simple, Affordable Convenience With New Unlimited Voice Plans, Press Release,<br />
Verizon <strong>Wireless</strong>, Jan. 15, 2010; Simon Flannery et al., Quick Comment: Verizon’s Price Plan Changes Should Not<br />
Rattle Postpaid Market, Morgan Stanley, Equity Research, Jan. 15, 2010, at 1-2 (Verizon’s Price Plan Changes).<br />
245 AT&T Announces New Unlimited Plans, Press Release, AT&T, Jan. 15, 2010.<br />
246<br />
Jonathan Chaplin, et al., Breaking View: VZ Pricing Changes Not Deflationary, Credit Suisse, Equity Research,<br />
Jan. 15, 2010, at 1, 6.<br />
247 Tony Adam, The Ultimate Cell Phone Plans Comparison, BillShrink.com, Jan. 18, 2010, available at<br />
http://androidandme.com/2010/01/news/billshrink-compares-smartphone-data-plans-t-mobile-comes-out-on-top/.<br />
59
Federal Communications Commission <strong>FCC</strong> 10-81<br />
regular handsets, and double that amount for designated “advanced devices.” 248 In either case, the ETF<br />
declines over time by a fixed amount for each full month of service completed by the customer, consistent<br />
with the policy of pro-rating ETFs instituted by Verizon <strong>Wireless</strong> in November 2006. 249 Customers can<br />
also opt out of ETFs altogether by paying the full retail price upfront for advanced devices or regular<br />
handsets and choosing Verizon <strong>Wireless</strong>’s month-to-month contract option. 250<br />
95. Purchase of a monthly data plan is typically a requirement for smartphones such as the<br />
iPhone and its closest competitors. In January 2010, along with the pricing changes on its unlimited voice<br />
plans, Verizon <strong>Wireless</strong> introduced a three-tiered structure of data plan requirements for handsets. 251<br />
Verizon <strong>Wireless</strong> extended a requirement to purchase a 25 MB monthly data package from two devices to<br />
its entire line of 3G “multimedia” handsets. For more advanced 3G smartphones, including the Motorola<br />
Droid, Blackberry Storm, and Palm Pre, a more expensive 5 GB monthly data plan is still required.<br />
Customers using traditional handsets (labeled “simple feature” phones) have the option of purchasing the<br />
25 MB data package, the unlimited monthly data package, or they can also continue to access mobile<br />
broadband and data services using a pay-as-you-go or pay-per-use pricing option by paying a fixed per-<br />
MB fee. 252<br />
96. The doubling of the ETF for advanced devices and the expansion of data plan<br />
requirements for multimedia phones followed a move by Verizon <strong>Wireless</strong> to discount handsets in the<br />
second half of 2009. 253 One analyst estimates that, in the third quarter of 2009, Verizon <strong>Wireless</strong> lowered<br />
its average smartphone selling price 39 percent through discounts and promotions. 254 According to the<br />
analyst, Verizon <strong>Wireless</strong> offered the least expensive average smartphone price after discount beginning<br />
in the third quarter of 2009 and continuing through the fourth of quarter of 2009. 255 The same analyst<br />
argues that Verizon <strong>Wireless</strong>’s move to discount the prices of smartphones aggressively is a response to<br />
the launch of the iPhone 3GS and the lower price of the legacy 3G iPhone. 256 The mandating of data<br />
plans for all new enhanced devices, with the resulting addition of a minimum monthly service charge for<br />
active data users, is interpreted by the analyst as a way of “cushioning the cost of additional handset<br />
248 Letter from Ruth Milkman, Chief, <strong>Wireless</strong> Telecommunications Bureau, <strong>FCC</strong>, and Mark Stone, Acting Chief,<br />
Consumer and Governmental Affairs Bureau, <strong>FCC</strong>, to Steven E. Zipperstein, Vice President – Legal and External<br />
Government Affairs, General Counsel and Secretary, Verizon <strong>Wireless</strong>, WT Docket No. 05-194, CG Docket No. 09-<br />
158, (Dec. 18, 2009) (WTB ETF Letter to Verizon <strong>Wireless</strong>).<br />
249 Twelfth <strong>Report</strong>, 23 <strong>FCC</strong> Rcd at 2293, 115; Verizon <strong>Wireless</strong> Expands the ‘Worry-Free <strong>Wireless</strong> Guarantee’ It<br />
Pioneered, Press Release, Verizon <strong>Wireless</strong>, Nov. 16, 2006. Verizon <strong>Wireless</strong> reduces its $175 ETF for regular<br />
handsets by $5 per month for each full month the customer retained Verizon <strong>Wireless</strong>’s service, while it reduces its<br />
$350 ETF for designated advanced devices by $10 per month for each full month of service completed by the<br />
customer.<br />
250<br />
Thirteenth <strong>Report</strong>, 24 <strong>FCC</strong> Rcd at 6245, 115; Verizon <strong>Wireless</strong> Statement on <strong>Wireless</strong> Service Pricing Options,<br />
Press Release, Verizon, Nov. 9, 2009.<br />
251 Verizon <strong>Wireless</strong> Offers Simple, Affordable Convenience With New Unlimited Voice Plans, Press Release,<br />
Verizon <strong>Wireless</strong>, Jan. 15, 2010; Jonathan Chaplin, et al., Breaking View: VZ Pricing Changes Not Deflationary,<br />
Credit Suisse, Equity Research, Jan. 15, 2010, at 1, 6; Verizon’s Price Plan Changes, at 1.<br />
252 Verizon <strong>Wireless</strong> Offers Simple, Affordable Convenience With New Unlimited Voice Plans, Press Release,<br />
Verizon <strong>Wireless</strong>, Jan. 15, 2010. See also, Thirteenth <strong>Report</strong>, 24 <strong>FCC</strong> Rcd at 6246-48, 119-122, for a detailed<br />
discussion of the variety of pricing options for mobile broadband and data services.<br />
253<br />
<strong>Wireless</strong> Service and Handset Pricing – Tick Tock, at 9-10; <strong>Wireless</strong> Service and Handset Pricing – Pressure<br />
Building, at 1-2.<br />
254 <strong>Wireless</strong> Service and Handset Pricing – Pressure Building, at 1-2, 16.<br />
255 Id. at 16; <strong>Wireless</strong> Service and Handset Pricing – Tick Tock, at 9.<br />
256 <strong>Wireless</strong> Service and Handset Pricing – Pressure Building, at 1-2.<br />
60
discounts.” 257<br />
Federal Communications Commission <strong>FCC</strong> 10-81<br />
97. As noted in the Thirteenth <strong>Report</strong>, Verizon <strong>Wireless</strong> also offers a month-to-month pricing<br />
option that allows customers to purchase the company’s nationwide postpaid pricing plans without<br />
signing a one- to two-year service contract, provided the customers either purchase new devices at the full<br />
retail price or use their own technologically compatible devices. 258 Customers who choose the month-tomonth<br />
option pay the same recurring monthly charge as customers who purchase handsets at a discount,<br />
but unlike the latter they can terminate their service at the end of any month without paying an ETF. T-<br />
<strong>Mobile</strong> introduced a differentiated version of this pricing option, called “Even More Plus,” in the fall of<br />
2009. The different tiers of Even More Plus correspond to those of T-<strong>Mobile</strong>’s Even More pricing plans,<br />
but handset prices are not discounted, no annual contract is required and the recurring monthly charges<br />
are lower. 259 Thus, in contrast to Verizon <strong>Wireless</strong>’s month-to-month option, T-<strong>Mobile</strong>’s Even More Plus<br />
plan gives customers the option of paying a lower monthly price than the equivalent Even More plan if<br />
they purchase their handsets at the full retail price. 260<br />
2. Prepaid Service<br />
98. In the United States, most mobile wireless subscribers pay their phone bills after they<br />
have incurred charges, which requires service providers to extend credit to their customers. This<br />
approach is known as postpaid service. 261 Prepaid service, in contrast, requires customers to pay for<br />
service prior to making calls. Prepaid plans typically produce lower ARPUs and higher churn rates in<br />
comparison to postpaid service. 262 For these reasons, the industry generally had not heavily promoted<br />
prepaid offerings in the past. 263 More recently, however, the pool of unsubscribed customers qualified for<br />
postpaid plans declined to the point where prepaid offerings, which do not require credit checks, have<br />
become more attractive to service providers. 264 In response, some service providers have introduced new<br />
prepaid plans, or entire “flanker brands,” for prepaid service. 265 In some cases, providers have tailored<br />
prepaid offerings to suit segments of the market that do not want or cannot get a traditional service plan,<br />
particularly the youth market segment. As one 2009 analyst report put it, “As penetration of cellular<br />
phones has increased among more attractive demographics, providers have increasingly offered and<br />
promoted prepaid plans as they dig deeper and deeper into younger and poorer demographics to sustain<br />
growth.” 266 In addition to facilities-based providers, many MVNOs offer prepaid plans rather than<br />
standard monthly billing.<br />
99. The prepaid service segment has evolved in recent years due in part to the introduction<br />
and growth of unlimited prepaid service offerings. 267 As one analyst explained, “The prepaid market used<br />
257 Id. at 2.<br />
258 Thirteenth <strong>Report</strong>, 24 <strong>FCC</strong> Rcd at 6245, 115.<br />
259 T-<strong>Mobile</strong>, Plans, http://www.t-mobile.com/shop/plans/Cell-Phone-Plans-<br />
Overview.aspx?WT.z_HP=shop_plans_DL (visited Feb. 22, 1010).<br />
260 Saul Hansell, Is There is Method in Cellphone Madness?, NEW YORK TIMES, Nov. 15, 2009.<br />
261<br />
See Section V.A.2, <strong>Mobile</strong> <strong>Wireless</strong> Subscribers by Pricing Plan, infra, for information on mobile wireless<br />
subscribers by pricing plan.<br />
262 Twelfth <strong>Report</strong>, 23 <strong>FCC</strong> Rcd at 2293-94, 116.<br />
263 Id.<br />
264 Id.<br />
265 Id.<br />
266 Recipe for Disaster, at 20.<br />
267<br />
Phil Cusick et al., Slumdog Millionaires, Macquarie Capital, Equity Research, May 1, 2009, at 3 (Slumdog<br />
Millionaires).<br />
61
Federal Communications Commission <strong>FCC</strong> 10-81<br />
to be fairly homogenous, with customers buying minutes ahead of time on a card, or ‘European Style,’<br />
and in general far overpaying for handsets and minutes relative to postpaid customers.” 268 This kept<br />
prepaid usage and ARPU low. However, with the growth of unlimited prepaid offerings, among other<br />
developments, there is a trend to lower per-minute rates and increased usage and ARPU in prepaid<br />
services. As a result, analysts stress that the market segment for prepaid service appears to be<br />
“bifurcating” into a low-end segment and a high-end segment. 269 The low-end segment comprises<br />
traditional pay-as-you-go prepaid service, while the high-end segment encompasses unlimited (“all you<br />
can eat”) prepaid offerings.<br />
100. Tracfone <strong>Wireless</strong> is generally regarded as the leader in the low-end prepaid niche. 270<br />
Although Tracfone’s rates are slightly higher on a per minute basis than those of alternative prepaid<br />
offerings, the company targets low-usage and safety-oriented customers whom other prepaid service<br />
providers are reluctant to go after because the average monthly revenue per user (ARPU) they generate, at<br />
around $10-12, is so low. 271 Tracfone purchases minutes predominantly from AT&T and resells them<br />
through a national distribution network under various brands, including Tracfone, Net10, and Safelink. 272<br />
The company’s phones and prepaid calling cards are sold at Wal-Mart Stores, Target, and RadioShack, in<br />
addition to drug stores and other local retail outlets. 273 Analysts attribute much of Tracfone’s recent<br />
subscriber growth to its Safelink offer, a program supported by the Universal Service Fund (USF) that<br />
provides a free cell phone and credit for a limited amount of free monthly wireless service to eligible lowincome<br />
families. 274<br />
101. The unlimited prepaid segment includes the earliest unlimited prepaid providers, Leap<br />
and MetroPCS, and more recent unlimited prepaid players such as Sprint Nextel’s Virgin <strong>Mobile</strong> and<br />
Boost <strong>Mobile</strong> prepaid brands. 275 The latest entrant to the unlimited prepaid segment is Tracfone’s<br />
“Straight Talk” service, which became nationally available in October 2009 after a limited trial service<br />
that began the previous summer. 276 As with other Tracfone prepaid brands, the Wal-Mart store chain<br />
distributes Straight Talk handsets and service. 277 Unlike Tracfone’s other prepaid brands, however,<br />
Straight Talk runs on Verizon <strong>Wireless</strong>’s network and was initially marketed with Verizon <strong>Wireless</strong>’s<br />
name and logo on the box. 278 In addition, whereas other Tracfone brands are targeted at low-usage<br />
customers in the traditional pay-as-you-go prepaid segment, Straight Talk’s unlimited prepaid offerings<br />
268 Slumdog Millionaires, at 3.<br />
269 Craig Moffett et al., U.S. <strong>Wireless</strong> Industry Scorecard: The Haves and the Have-Nots Diverge, Bernstein<br />
Research, Nov. 6, 2009, at 1, 9 (The Haves and the Have-Nots Diverge); Slumdog Millionaires, at 4.<br />
270 The Haves and the Have-Nots Diverge, at 9; Slumdog Millionaires, at 1; Roger Cheng, TracFone’s Prepaid<br />
Niche, WALL STREET JOURNAL, Mar. 4, 2009 (TracFone’s Prepaid Niche).<br />
271 TracFone’s Prepaid Niche; Slumdog Millionaires, at 4, 24.<br />
272 Slumdog Millionaires, at 24; CTIA PN Comments at 26.<br />
273 TracFone’s Prepaid Niche.<br />
274 The Haves and the Have-Nots Diverge, at 10; Slumdog Millionaires, at 25; TracFone’s Prepaid Niche.<br />
275 See Verizon <strong>Wireless</strong> PN Comments at 6 (“Prepaid and no-contract options for consumers are growing, and<br />
though they’ve been pioneered by smaller companies, the national providers are starting to respond to this<br />
competition by expanding their own prepaid and no-contract options”); CTIA PN Comments at 24-26.<br />
276<br />
Roger Cheng, Wal-Mart <strong>Wireless</strong> Expands, WALL STREET JOURNAL, Oct. 15, 2009 (Wal-Mart <strong>Wireless</strong><br />
Expands).<br />
277 Wal-Mart <strong>Wireless</strong> Expands.<br />
278<br />
Wal-Mart <strong>Wireless</strong> Expands; Craig Moffett et al., Weekend Media Blast: Tilt, Bernstein Research, Jul. 10, 2009,<br />
at 1 (Weekend Media Blast: Tilt).<br />
62
are targeted at customers with higher usage and ARPU.<br />
Federal Communications Commission <strong>FCC</strong> 10-81<br />
102. Prepaid service providers have been the most aggressive in cutting the price of unlimited<br />
service offerings. 279 In January 2009, Sprint Nextel reduced the monthly charge on its Boost Unlimited<br />
voice and data plan to roughly half the price of the cheapest postpaid version of an unlimited voice and<br />
data offering then available. 280 One analyst argues that stranded capacity on Sprint Nextel’s iDEN<br />
network was the incentive for Sprint Nextel to offer the Boost Unlimited plan at a substantial discount to<br />
existing unlimited offerings. 281 The unlimited voice, text and data offering launched by Tracfone under<br />
the Straight Talk brand later that same year was initially priced at a slight discount to Boost’s unlimited<br />
voice and data plan. 282 In light of these unlimited prepaid offerings, one analyst estimated that all-youcan-eat<br />
plans have dropped by as much as 55 percent since the first unlimited national flat-rate calling<br />
plan was launched by Verizon <strong>Wireless</strong> in February 2008. 283<br />
103. Analysts see both the Straight Talk unlimited offering and the Boost Unlimited plan as<br />
competitive threats to unlimited players Leap and MetroPCS. 284 Following the launch of Tracfone’s lowpriced<br />
service offering, MetroPCS enhanced its unlimited local calling plan in August 2009 by reducing<br />
the monthly charges for add-on features such as text messaging and various other data services. 285 Leap<br />
responded with similar changes to the pricing of add-on features for its Cricket service plans shortly<br />
thereafter. 286 MetroPCS made another round of similar price cuts to add-on features in the fourth quarter<br />
of 2009, and Leap again followed suit. 287 With each round of changes, MetroPCS and Leap lowered the<br />
monthly recurring charge for applicable features by five to ten dollars. 288<br />
B. Non-Price Rivalry<br />
104. In addition to price, mobile wireless service providers compete on many other<br />
dimensions. This section identifies three broad categories of non-price rivalry among mobile wireless<br />
service providers: 1) network upgrades; 2) product information and perception, which include advertising<br />
and marketing; and 3) downstream product differentiation, which includes handset/device and application<br />
offerings. 289 Indicators of non-price rivalry, which are discussed in detail below, include technology<br />
deployment and upgrades, advertising and marketing expenditures, and handsets/devices and application<br />
offerings.<br />
1. Network Coverage and Technology Upgrades<br />
105. Network investment remains a centerpiece of providers’ efforts to improve their<br />
customers’ mobile wireless service experience. During 2008 and 2009, mobile wireless service providers<br />
continued to improve the coverage, capacity, and capabilities of their networks, focusing largely on the<br />
279 Recipe for Disaster, at 16.<br />
280 Id. at 14; Slumdog Millionaires, at 5, 16.<br />
281 Slumdog Millionaires, at 5.<br />
282 Wal-Mart <strong>Wireless</strong> Expands; Weekend Media Blast: Tilt, at 1.<br />
283 Weekend Media Blast: Tilt, at 1.<br />
284 Wal-Mart <strong>Wireless</strong> Expands; Recipe for Disaster, at 14.<br />
285 <strong>Wireless</strong> Service and Handset Pricing – Pressure Building, at 6-7.<br />
286 Id. at 7.<br />
287 <strong>Wireless</strong> Service and Handset Pricing – Tick Tock, at 2-3.<br />
288<br />
<strong>Wireless</strong> Service and Handset Pricing – Pressure Building, at 6-7; <strong>Wireless</strong> Service and Handset Pricing – Tick<br />
Tock, at 2-3.<br />
289 See CTIA NOI Comments, at 63-64.<br />
63
Federal Communications Commission <strong>FCC</strong> 10-81<br />
upgrade and expansion of mobile broadband networks to enable high-speed Internet access and other data<br />
services for their customers. 290<br />
106. Industry analysts and commenters have highlighted the key role that mobile broadband<br />
networks – and the products, services, and applications that rely on them – play in mobile wireless<br />
competition. As mobile voice service has become commoditized and mobile voice penetration is<br />
reaching saturation, one way that mobile wireless service providers are differentiating themselves is with<br />
the speeds, reliability, capabilities, and coverage of their mobile broadband networks and with the<br />
handsets/devices, applications, and other products and services that run on those networks. According to<br />
one analyst, “[C]arriers with the most attractive, feature rich smartphones and robust networks have been<br />
performing strongly. … [S]uccess for the carriers who compete in the high end will largely hinge on<br />
retailing and upselling more data services.” 291<br />
107. As a component of investing in their networks, service providers can improve capacity,<br />
coverage, and service quality through their spectrum positions. As mentioned elsewhere in the <strong>Report</strong>,<br />
service providers have added to their spectrum holdings in recent years through the Commission’s<br />
spectrum auctions, the purchase of licenses in the secondary market, and mergers and acquisitions. 292<br />
These spectrum acquisitions have enabled certain operators – including Leap, MetroPCS, and T-<strong>Mobile</strong> –<br />
to expand networks into new markets, and to improve and enhance networks in existing markets. 293<br />
108. The Commission has largely adopted flexible licensing policies that do not mandate any<br />
particular technology or network standard for commercial mobile wireless licensees. <strong>Mobile</strong> wireless<br />
service providers have the flexibility to deploy the network technologies and services they choose as long<br />
as they abide by certain technical parameters designed to avoid radiofrequency interference with adjacent<br />
licensees. 294 As a result of this approach, different U.S. service providers have deployed, over the past 15<br />
years, different digital network technologies with divergent technology migration paths. The two main<br />
migration paths for 2G, 2.5G, and 3G technologies have been the CDMA and GSM technology paths, as<br />
shown in Figure 2 below. 295 The major CDMA and GSM service providers are now planning to deploy<br />
290 See AT&T PN Comments at 16; AT&T NOI Comments at 36. As discussed in the Thirteenth <strong>Report</strong>, network<br />
upgrades in previous years have focused on improving voice quality and call-completion rates, minimizing dead<br />
zones and dropped calls, and adding calling features. Providers have addressed many of these issues by increasing<br />
the number of cell sites in their networks, and adding micro-cell sites, repeaters, and in-building wireless systems.<br />
See Thirteenth <strong>Report</strong>, 24 <strong>FCC</strong> Rcd at 6262, 159.<br />
291<br />
Simon Flannery, et al., Telecom Services – 3Q09 Preview: Expecting Solid Earnings Despite <strong>Competition</strong><br />
Concerns, Morgan Stanley, Oct. 20, 2009, at 20.<br />
292 See Section III.D, Entry and Exit Conditions, supra, and Section VII.A.1, Spectrum, infra. Section VII.A.1 also<br />
highlights the key importance of spectrum holdings in influencing service providers’ network deployment costs and<br />
network capacity.<br />
293 See Section III.E, Recent Entry and Exit, supra, and Section VII.A.1, Spectrum, infra. According to T-<strong>Mobile</strong>,<br />
“the launch of the 3G network also enables T-<strong>Mobile</strong> to accommodate and serve more customers more efficiently<br />
through the use of its AWS spectrum, effectively doubling T-<strong>Mobile</strong> USA’s spectrum position.” T-<strong>Mobile</strong> USA<br />
Begins Commercial 3G Network Rollout, Press Release, T-<strong>Mobile</strong>, May 5, 2008.<br />
294 In contrast, the European Community mandated a single harmonized standard for second-generation mobile<br />
telecommunications services (GSM), and also has adopted a single standard for third-generation services<br />
(WCDMA). Neil Gandal, et al., Standards in <strong>Wireless</strong> Telephone Networks, TELECOMMUNICATIONS POLICY, Vol.<br />
27, No. 5-6, June-July 2003, at 325 (Standards in <strong>Wireless</strong> Telephone Networks). The authors note that, although<br />
the European Community backed away from mandating a single standard for third-generation services, the absence<br />
of a mandate has had little practical effect as all European mobile operators have opted for the same standard and<br />
migration path. Id. at 330.<br />
295 Additional information on mobile wireless network technologies, including definitions, background, and average<br />
and peak download speeds for the various technologies, can be found in Appendix B, <strong>Mobile</strong> <strong>Wireless</strong> Network<br />
Technologies, infra.<br />
64
Federal Communications Commission <strong>FCC</strong> 10-81<br />
LTE as a 4G technology. 296 However, at least one other service provider is deploying an alternate 4G<br />
technology, WiMAX.<br />
Figure 2<br />
<strong>Mobile</strong> <strong>Wireless</strong> Network Technology Evolution<br />
109. One advantage of compatibility between competing wireless networks is that greater<br />
economies of scale in the production of both terminals and network infrastructure equipment tend to<br />
lower the unit cost of handsets, chipsets, and other network equipment. 297 Lower equipment costs, in<br />
turn, may promote more rapid adoption of mobile wireless services. 298 In addition, standardization tends<br />
to produce greater variety of handsets. 299 However, it has been argued that the Commission’s marketbased<br />
approach to wireless network standards helped to encourage the development of the CDMA<br />
wireless network technology. 300 <strong>Competition</strong> among mobile wireless providers using incompatible<br />
wireless network technologies has other advantages that can benefit consumers, including greater product<br />
variety and differentiation of services, 301 more technological competition, 302 and greater price<br />
296 See Table 11. See also, Verizon <strong>Wireless</strong> PN Comments at 8 (Verizon <strong>Wireless</strong>, AT&T, Cox, and MetroPCS<br />
have all announced plans to deploy LTE); CTIA PN Comments, Attach. A, at 14.<br />
297 Id. at 329.<br />
2G 2.5G 3G<br />
CDMA 1xRTT EV-DO<br />
Rev. 0<br />
GSM/<br />
TDMA<br />
298 See Carl Shapiro and Hal R. Varian, Information Rules, Harvard Business School Press, 1999, at 264<br />
(Information Rules) (noting that “the Europeans managed to adopt new digital wireless telephone technology more<br />
rapidly than in the United States”); Stephen C. Littlechild, <strong>Mobile</strong> Termination Charges: Calling Party Pays Versus<br />
Receiving Party Pays, TELECOMMUNICATIONS POLICY, Vol. 30, No. 5-6, June-July 2006, at 242-77 (finding that<br />
“technical concentration,” measured as the percent of subscribers on GSM networks, increases mobile penetration).<br />
299 Standards in <strong>Wireless</strong> Telephone Networks, at 329.<br />
300 Id. at 328-30; Information Rules, at 264.<br />
GPRS EDGE WCDMA/<br />
GPRS EDGE<br />
HSPA<br />
WCDMA/<br />
HSPA<br />
301 Standards in <strong>Wireless</strong> Telephone Networks, at 329-330 (noting, for example, that CDMA networks “have offered<br />
more and better data services than were available on GSM networks”).<br />
65<br />
EV-DO<br />
Rev. A<br />
HSPA+<br />
Increasing data transfer speeds<br />
4G<br />
LTE<br />
WiMAX
competition. 303<br />
Federal Communications Commission <strong>FCC</strong> 10-81<br />
110. In addition to upgrading their networks for mobile broadband systems, as described<br />
below, mobile wireless operators are also taking steps to improve indoor coverage through the use of new<br />
technologies such as distributed antenna systems (DAS) and femtocells. 304 DAS provides enhanced<br />
coverage in highly trafficked areas such as shopping malls and office buildings. Femtocells are personal<br />
cell sites that can be installed in a consumer’s home; they receive cell phone signals within the home and<br />
nearby area and use an in-home broadband connection for the last-mile transport of calls and data<br />
transmissions. 305 Several mobile wireless operators have made femtocells available to their customers to<br />
improve coverage in areas that might not otherwise have it. 306<br />
a. Service Provider Technology Deployments<br />
111. During 2008 and 2009, the four nationwide mobile wireless service providers, as well as<br />
other mobile operators, continued to expand service into new markets and to upgrade their networks with<br />
mobile broadband technologies. Of the top four nationwide mobile wireless providers, AT&T and T-<br />
<strong>Mobile</strong> use GSM as their 2G digital technology and WCDMA as their 3G digital technology, while<br />
Verizon <strong>Wireless</strong> and Sprint Nextel followed a different technology path by upgrading their 2G CDMA<br />
technology to 3G EV-DO Rev. A technology. 307 In addition, several providers have either begun to<br />
deploy 4G wireless technologies or announced plans to deploy 4G networks over the next few years, as<br />
shown in Table 11 below. For purposes of the report, we include the CDMA EV-DO and<br />
WCDMA/UMTS/HSPA technologies within the 3G category, and LTE and WiMAX in the 4G category.<br />
Additionally, we include all 3G and 4G network technologies in our discussion of mobile broadband. For<br />
additional information on mobile wireless network technologies, including the average and peak<br />
download speeds of the various technologies, can be found in Appendix B, <strong>Mobile</strong> <strong>Wireless</strong> Network<br />
Technologies, infra.<br />
(Continued from previous page)<br />
302 Id. at 330. See also Eleventh <strong>Report</strong>, 21 <strong>FCC</strong> Rcd at 10993, 113 (noting that the former Cingular was pressured<br />
to upgrade its network to WCDMA/HSDPA, rather than the slower, interim WCDMA technology, in an effort to<br />
compete with Verizon <strong>Wireless</strong>’s EV-DO network, which offers speeds similar to WCDMA/HSDPA and faster than<br />
WCDMA) and at 11025-26 (arguing that this technological competition helped give the United States an edge over<br />
Europe with regard to the deployment of high-speed wireless data networks).<br />
303 Standards in <strong>Wireless</strong> Telephone Networks, at 330. Technological competition may pressure providers to cut<br />
rates and provide larger handset subsidies to attract a sufficiently large customer base to ensure their chosen<br />
technology survives as a standard. See Simon Flannery et al., 3G Economics a Cause for Concern, Morgan Stanley,<br />
Equity Research, Feb. 1, 2005, at 11. In addition, use of multiple incompatible wireless network standards may act<br />
as a constraint on providers’ ability to engage in explicit or tacit coordination that would impair price competition.<br />
See Horizontal Merger Guidelines, at § 2.11 (noting that standardization of pricing and product variables on which<br />
firms could compete may facilitate reaching terms of coordination that would harm consumers).<br />
304 CTIA NOI Comments, at 16-17.<br />
305 Id.<br />
306 Id.<br />
307 Sprint Nextel also uses iDEN on the former Nextel network. In addition, through February 18, 2008, all<br />
operators using cellular spectrum were required to deploy AMPS, an analog technology, throughout the part of their<br />
networks using cellular spectrum. 47 C.F.R. § 22.901(b). In 2002, the Commission decided to eliminate the<br />
requirement after a five-year transition period, which ended February 18, 2008. Year 2000 Biennial Regulatory<br />
Review – Amendment of Part 22 of The Commission’s Rules to Modify or Eliminate Outdated Rules Affecting The<br />
Cellular Radiotelephone Service and Other Commercial <strong>Mobile</strong> Radio Services, <strong>Report</strong> and Order, 17 <strong>FCC</strong> Rcd<br />
18401, 18414 22 (2002).<br />
66
Federal Communications Commission <strong>FCC</strong> 10-81<br />
Table 11<br />
3G/4G Deployment by Selected <strong>Mobile</strong> <strong>Wireless</strong> Service Providers<br />
Service Provider 3G Deployment 4G Deployment<br />
AT&T <strong>Wireless</strong> As of October 2009, HSPA network<br />
covered 230 million POPs in more<br />
than 350 metropolitan areas. 308<br />
Verizon <strong>Wireless</strong> As of mid-2009, EV-DO network<br />
covered 284 million POPs. 310<br />
67<br />
Plans LTE trials in 2010 and<br />
deployment in 2011. 309<br />
Expects to launch LTE in 25-<br />
30 markets in 2010 and to<br />
cover 285 million POPs by<br />
2013. 311<br />
Clearwire NA As of September 2009,<br />
WiMAX network covered<br />
over 10 million POPs,<br />
expected to cover 120 million<br />
POPs by end of 2010. 312<br />
Sprint Nextel As of August 2009, EV-DO network<br />
covered 271 million POPs. 313<br />
T-<strong>Mobile</strong> As of August 2009, HSPA network<br />
covered 121 million POPs, expected<br />
to cover 200 million POPs by yearend<br />
2009. 314<br />
Ownership interest in<br />
Clearwire and reselling<br />
Clearwire WiMAX service.<br />
No U.S.-specific plans.<br />
112. The two nationwide CDMA operators, Verizon <strong>Wireless</strong> and Sprint Nextel, have<br />
deployed EV-DO and EV-DO Rev. A network technologies across significant portions of their networks.<br />
As noted in the Thirteenth <strong>Report</strong>, Verizon <strong>Wireless</strong> has upgraded its entire EV-DO network to EV-DO<br />
308 AT&T Brings 3G <strong>Mobile</strong> Broadband Network to Champaign-Urbana Area, Press Release, AT&T, Oct. 8, 2009.<br />
309 AT&T to Deliver 3G <strong>Mobile</strong> Broadband Speed Boost, Press Release, AT&T, May 27, 2009; AT&T Doubling 3G<br />
Capacity, TELEPHONY ONLINE, Apr. 20, 2009, available at http://telephonyonline.com/wireless/news/att-3gnetwork-capacity-increase-0420/<br />
(referring to statement by AT&T executive on use of 700 MHz and AWS<br />
spectrum).<br />
310 Verizon <strong>Wireless</strong>, Network Facts, http://aboutus.vzw.com/bestnetwork/network_facts.html (visited Oct. 7, 2009);<br />
Verizon <strong>Report</strong>s Revenue Growth and Continued Improvement in Cash Flow in 2Q, Press Release, Verizon, July 27,<br />
2009.<br />
311 See Presentation by Tom Sawanobori, Vice President of Network Technology and Strategy, Verizon <strong>Wireless</strong>, at<br />
<strong>FCC</strong> Workshop: Deployment <strong>Wireless</strong> – General, Aug. 12, 2009; Verizon Uses New Network for First Time, AP,<br />
Aug. 14, 2009.<br />
312 See Clearwire Introduces CLEAR(TM) 4G WiMAX Internet Service in 10 New Markets, Press Release,<br />
Clearwire, Sept. 1, 2009; Clearwire to Bring WiMAX to 10 More Markets, <strong>Wireless</strong> – CNET News, Aug. 3, 2009;<br />
Sprint 4G Blazes into Milledgeville, Press Release, Sprint Nextel, Oct. 5, 2009; Clearwire, SEC Form 10-K, filed<br />
Mar. 26, 2009, at 2-3.<br />
313<br />
HTC Touch Pro2 from Sprint Pairs a Dynamic Must-Have Business Device with the Best Value in <strong>Wireless</strong>,<br />
Press Release, Sprint Nextel, Aug. 31, 2009.<br />
314 Caroline Gabriel, T-<strong>Mobile</strong> USA to Upgrade Network and Move to HSPA+ Next Year, RETHINK WIRELESS, Sept.<br />
16, 2009, at http://www.rethink-wireless.com/article.asp?article_id=1901&keywords=t-mobile (citing Cole<br />
Brodman, T-<strong>Mobile</strong> Chief Technology Officer).
Federal Communications Commission <strong>FCC</strong> 10-81<br />
Rev. A technology, 315 increasing download speeds for customers with Rev. A-capable devices from 400-<br />
700 kilobits per second (kbps) to 600 kbps-1.4 megabits per second (Mbps) and increasing upload speeds<br />
from 60-80 kbps to 500-800 kbps. 316 At the end of 2007, the EV-DO Rev. A network footprint covered<br />
approximately 240 million people. 317 Since that time, Verizon <strong>Wireless</strong> has added over 44 million POPs<br />
to its EV-DO Rev. A network footprint by expanding this network technology into new markets and<br />
acquiring Alltel’s EV-DO network, which covered approximately 61 million POPs at the end of 2008. 318<br />
As of mid-2009, Verizon <strong>Wireless</strong>’s EV-DO Rev. A network covered 284 million people. 319 Verizon<br />
<strong>Wireless</strong> has also announced that it plans to deploy LTE as its 4G network technology beginning in<br />
2010. 320 LTE will further increase data rates; the company expects to deliver average download speeds of<br />
5-12 Mbps. 321 LTE will also provide lower latency and enable global roaming in countries where<br />
Vodafone, a major investor in Verizon <strong>Wireless</strong>, operates. 322 Verizon <strong>Wireless</strong> expects to launch LTE in<br />
25-30 U.S. markets in 2010 using its 700 MHz Band spectrum, and to expand LTE coverage to 210<br />
markets covering 285 million people by 2013. 323 The company is currently testing LTE in Boston and<br />
Seattle. 324<br />
113. Sprint Nextel continued to upgrade its network with EV-DO Rev. A technology during<br />
2008 and 2009; 325 however, the company’s mobile broadband deployment efforts during the period<br />
315 Thirteenth <strong>Report</strong>, 24 <strong>FCC</strong> Rcd at 6254, 136; see also Verizon <strong>Wireless</strong>, Network Facts,<br />
http://aboutus.vzw.com/bestnetwork/network_facts.html (visited Oct. 7, 2009). When EV-DO subscribers travel to<br />
other parts of the country where EV-DO networks have not been deployed, they can seamlessly roam on and access<br />
Verizon <strong>Wireless</strong>’s 1xRTT network because the more advanced technologies on the CDMA migration path are<br />
backwards compatible. See Ninth <strong>Report</strong>, 19 <strong>FCC</strong> Rcd at 20652.<br />
316 Verizon <strong>Wireless</strong>, <strong>Mobile</strong> Broadband, http://www.verizonwireless.com/b2c/mobilebroadband/?page=coverage<br />
(visited Jan. 14, 2010).<br />
317 Thirteenth <strong>Report</strong>, 24 <strong>FCC</strong> Rcd at 6254, 136.<br />
318 Verizon Communications, Inc., SEC Form 10-K, filed Feb. 24, 2009, at 8. Verizon <strong>Wireless</strong> stated in September<br />
2009 that it planned to complete the upgrade of all of Alltel’s EV-DO Rev. 0 markets to EV-DO Rev. A by the end<br />
of 2009. Verizon <strong>Wireless</strong> NOI Comments, at 82.<br />
319 Verizon <strong>Wireless</strong>, Network Facts, http://aboutus.vzw.com/bestnetwork/network_facts.html (visited Oct. 7, 2009);<br />
Verizon <strong>Report</strong>s Revenue Growth and Continued Improvement in Cash Flow in 2Q, Press Release, July 27, 2009, at<br />
http://newscenter.verizon.com/press-releases/verizon/2009/verizon-reports-revenue.html; Presentation by Tom<br />
Sawanobori, VP of Network Technology and Strategy, Verizon <strong>Wireless</strong>, <strong>FCC</strong> Workshop: Deployment <strong>Wireless</strong> –<br />
General, Aug. 12, 2009.<br />
320 Presentation by Tom Sawanobori, VP of Network Technology and Strategy, Verizon <strong>Wireless</strong>, <strong>FCC</strong> Workshop:<br />
Deployment <strong>Wireless</strong> – General, Aug. 12, 2009; Verizon Uses New Network for First Time, AP, Aug. 14, 2009;<br />
Thirteenth <strong>Report</strong>, 24 <strong>FCC</strong> Rcd at 6254, 136.<br />
321 Presentation by Tom Sawanobori, VP of Network Technology and Strategy, Verizon <strong>Wireless</strong>, <strong>FCC</strong> Workshop:<br />
Deployment <strong>Wireless</strong> – General, Aug. 12, 2009; Verizon Uses New Network for First Time, AP, Aug. 14, 2009;<br />
Thirteenth <strong>Report</strong>, 24 <strong>FCC</strong> Rcd at 6254, 136.<br />
322 Thirteenth <strong>Report</strong>, 24 <strong>FCC</strong> Rcd at 6254, 136.<br />
323 Presentation by Tom Sawanobori, VP of Network Technology and Strategy, Verizon <strong>Wireless</strong>, <strong>FCC</strong> Workshop:<br />
Deployment <strong>Wireless</strong> – General, Aug. 12, 2009; Verizon Uses New Network for First Time, AP, Aug. 14, 2009;<br />
CTIA NOI Comments at 33.<br />
324 Presentation by Tom Sawanobori, VP of Network Technology and Strategy, Verizon <strong>Wireless</strong>, <strong>FCC</strong> Workshop:<br />
Deployment <strong>Wireless</strong> – General, Aug. 12, 2009; Verizon Uses New Network for First Time, AP, Aug. 14, 2009.<br />
325 At the end of 2007, Sprint Nextel’s EV-DO network covered nearly 234 million people and its EV-DO Rev. A<br />
network covered 222 million people. Thirteenth <strong>Report</strong>, 24 <strong>FCC</strong> Rcd at 6255, 137. As of August 2009, Sprint’s<br />
EV-DO network covered 271 million POPs, including roaming, and had been deployed in census blocks covering<br />
232 million POPs, excluding roaming. HTC Touch Pro2 from Sprint Pairs a Dynamic Must-Have Business Device<br />
(continued….)<br />
68
Federal Communications Commission <strong>FCC</strong> 10-81<br />
focused on launching the resale of 4G WiMAX service in several markets in conjunction with its<br />
relationship with Clearwire. As discussed above, Sprint Nextel transferred its WiMAX network assets<br />
and 2.5 GHz spectrum holdings to Clearwire in 2008, and currently holds a majority ownership interest in<br />
the company. 326 During 2009, Sprint Nextel began reselling Clearwire’s WiMAX service in several<br />
markets across the country where Sprint Nextel also offers mobile wireless voice and data services over<br />
its own CDMA network. 327 As of December 2009, Sprint Nextel was offering “Sprint 4G powered by<br />
WiMAX” in 27 markets. 328 The company expects to launch 4G service in several additional markets –<br />
including Boston, Houston, New York, San Francisco, and Washington, D.C. – in 2010 and to offer<br />
service in 80 markets covering 120 million POPs by the end of 2010. 329 As of January 2010, Sprint<br />
Nextel was offering a dual-mode USB (Universal Serial Bus) laptop card and mobile Wi-Fi hotspot<br />
device, which are compatible with both 4G WiMAX and 3G EV-DO networks. 330<br />
114. Apart from Sprint Nextel and Verizon <strong>Wireless</strong>, 22 other smaller, regional, and multimetro<br />
CDMA operators also have deployed EV-DO technology within their networks. 331 For example,<br />
Leap had deployed EV-DO across nearly all of its network footprint, which covered approximately 91<br />
million POPs as of September 2009. 332 Leap’s covered POPs increased 36 percent from 67 million at the<br />
end of 2008, and 72 percent from 53 million at the end of 2007. 333 In addition, US Cellular’s EV-DO<br />
network has grown from covering one city at the end of 2006, to five markets at the end of 2008, to 75<br />
percent of its customer base as of September 30, 2009. 334 The EV-DO networks of the non-nationwide<br />
CDMA providers combined had been deployed in census blocks covering 113 million people, 40 percent<br />
of the U.S. population, as of November 2009. 335 One additional CDMA operator, MetroPCS, has not<br />
upgraded its network with EV-DO but has announced that it plans to begin deploying LTE beginning in<br />
the second half of 2010 using its AWS spectrum licenses. 336<br />
(Continued from previous page)<br />
with the Best Value in <strong>Wireless</strong>, Press Release, Sprint Nextel, Aug. 31, 2009; American Roamer database, Aug.<br />
2009.<br />
326 See Section III.E, Recent Entry and Exit, supra. See also, Sprint Nextel, SEC Form 10-Q, filed Nov. 6, 2009, at<br />
7.<br />
327 Sprint Nextel, SEC Form 10-Q, filed Nov. 6, 2009, at 7.<br />
328<br />
Sprint 4G Rollout Blazes on with Maui Launch, Press Release, Sprint Nextel, Dec. 1, 2009; Sprint Nextel, SEC<br />
Form 10-Q, filed Nov. 6, 2009, at 20.<br />
329 Id.<br />
330 Overdrive 3G/4G <strong>Mobile</strong> Hotspot by Sierra <strong>Wireless</strong> Can Bring Sprint’s 4G Speeds to More Than 400 Million<br />
W-Fi-Enabled Devices, Press Release, Sprint Nextel, Jan. 10, 2010; Sprint Nextel, Turbocharge your Now<br />
Connection. Get 4G Speeds up to 10x Faster Than 3G,<br />
http://mobilebusiness.sprint.com/broadband/index.html?pid=5 (visited Jan. 19, 2010). Sprint is also offering a 4Gonly<br />
desktop modem device. Sprint 4G Desktop Modem CPEi25150 by Motorola Fact Sheet, Press Release, Sprint<br />
Nextel, Dec. 14, 2009.<br />
331 American Roamer database, Nov. 2009. See also, CDMA Development Group Comments at 6.<br />
332<br />
Leap <strong>Wireless</strong> International, Inc., SEC Form 10-Q, filed Nov. 9, 2009, at 39, 41. American Roamer database,<br />
Nov. 2009.<br />
333 Leap <strong>Wireless</strong> International, Inc., SEC Form 10-Q, filed Nov. 9, 2009, at 41.<br />
334 United States Cellular Corp., SEC Form 10-Q, filed Nov. 5, 2009, at 26; United States Cellular Corp., SEC Form<br />
10-K, filed Feb. 26, 2009, at 11 (US Cellular launched EV-DO in Milwaukee, WI in Nov. 2006, then in Chicago,<br />
Des Moines, Tulsa, and southern Wisconsin during 2008).<br />
335 American Roamer database, Nov. 2009.<br />
336 Unlimited <strong>Wireless</strong> Carrier MetroPCS Announces Vendors for 2010 4G LTE Launch, Press Release, MetroPCS,<br />
Sept. 15, 2009. At that time, MetroPCS announced deals with LTE equipment vendors Ericsson and Samsung. Id.<br />
69
Federal Communications Commission <strong>FCC</strong> 10-81<br />
115. In addition to the 3G deployments and 4G announcements by CDMA operators, AT&T<br />
and T-<strong>Mobile</strong> continued to expand and upgrade their HSPA networks during 2008 and 2009. 337 As of<br />
August 2009, AT&T had deployed HSPA to more than 350 major metropolitan areas, 338 up from 275 in<br />
May 2008. 339 In early 2010, the company revealed that its 3G network covered 230 million Americans. 340<br />
In addition, AT&T has upgraded its entire HSPA network with an HSPA 7.2 software upgrade 341 and is in<br />
the process of increasing the number of high-speed backhaul connections to its cell sites, primarily with<br />
fiber connections, to accommodate increased data speeds and traffic. 342 According to analysts and the<br />
company, AT&T’s network upgrades are being done to improve consistency in accessing data sessions,<br />
increase efficiency, meet the rising demands on the network from bandwidth-heavy data applications, and<br />
address service quality problems – such as dropped calls, delayed text and voice messages, and slow<br />
download speeds – which typically occur during periods of peak use in dense urban areas with higher<br />
concentrations of iPhone users. 343 AT&T claims that the backhaul upgrades will also be used to support<br />
its LTE deployment. 344 The company plans to begin LTE trials in 2010 and LTE deployment in 2011<br />
using its 700 MHz band and AWS spectrum. 345<br />
116. T-<strong>Mobile</strong> is also deploying an HSPA 3G network in cities across the United States. As<br />
mentioned in the Thirteenth <strong>Report</strong>, the company had launched HSPA service, using its AWS spectrum,<br />
in 13 major U.S. markets as of September 2008. Since that time, T-<strong>Mobile</strong> has expanded its HSPA<br />
coverage into new markets. As of August 2009, T-<strong>Mobile</strong>’s HSPA network covered 121 million people<br />
in 176 cities, and the company planned to cover 200 million people in an additional 100 cities by the end<br />
337 See CTIA PN Comments, Attach. A, at 14.<br />
338 AT&T Brings 3G <strong>Mobile</strong> Broadband Network to Champaign-Urbana Area, Press Release, AT&T, Oct. 8, 2009.<br />
In August 2009, AT&T stated that it planned to deploy HSPA to 20 additional markets, including 2,000 cell sites, by<br />
the end of 2009. Presentation by Kris Rinne, Senior VP, AT&T, <strong>FCC</strong> National Broadband Plan Workshop:<br />
Technology-<strong>Wireless</strong>, Aug. 13, 2009.<br />
339 Thirteenth <strong>Report</strong>, 24 <strong>FCC</strong> Rcd at 6256, 139.<br />
340 See AT&T, The Truth About 3G (television advertisements), http://www.att.com/truthabout3g/?WT.srch=1<br />
(visited Feb. 1, 2010). In May 2009, AT&T announced that it was migrating its 850 MHz Cellular band network to<br />
HSPA technology in order to improve coverage and increase capacity. AT&T to Deliver 3G <strong>Mobile</strong> Broadband<br />
Speed Boost, Press Release, AT&T, May 27, 2009.<br />
341 When combined with the backhaul upgrade, HSPA 7.2 will support theoretical peak maximum download speeds<br />
of 7.2 Mbps, with actual speeds being lower and varying due to a number of factors. AT&T Upgrades 3G<br />
Technology at Cell Sites Across Nation, Press Release, AT&T, Jan. 5, 2010. See also, CTIA NOI Comments at 33.<br />
As of January 2010, AT&T offered 10 HSPA 7.2-compatible devices and planned to introduce additional HSPA 7.2compatible<br />
devices in 2010. Id.<br />
342 In December 2009, AT&T began the backhaul upgrades at cell sites in six cities – Charlotte, Chicago, Dallas,<br />
Houston, Los Angeles, and Miami – and plans to continue upgrading cell sites across its network during 2010 and<br />
2011. AT&T Upgrades 3G Technology at Cell Sites Across Nation, Press Release, AT&T, Jan. 5, 2010. For<br />
additional information on backhaul, see Section VII.A.3, Backhaul Facilities, infra.<br />
343 AT&T Upgrades 3G Technology at Cell Sites Across Nation, Press Release, AT&T, Jan. 5, 2010. <strong>Wireless</strong><br />
Service and Handset Pricing – Pressure Building, at 2; Jenna Wortham, Customers Angered as iPhones Overload<br />
AT&T, NEW YORK TIMES, Sept. 3, 2009. See Section V.I, Network Quality, infra.<br />
344 AT&T Upgrades 3G Technology at Cell Sites Across Nation, Press Release, AT&T, Jan. 5, 2010.<br />
345 AT&T to Deliver 3G <strong>Mobile</strong> Broadband Speed Boost, Press Release, AT&T, May 27, 2009; AT&T Doubling 3G<br />
Capacity, TELEPHONY ONLINE, Apr. 20, 2009, available at http://telephonyonline.com/wireless/news/att-3gnetwork-capacity-increase-0420/<br />
(referring to statement by AT&T executive on use of 700 MHz and AWS<br />
spectrum).<br />
70
Federal Communications Commission <strong>FCC</strong> 10-81<br />
of 2009. 346 T-<strong>Mobile</strong> also announced that it planned to upgrade its network with HSPA 7.2 technology<br />
by the end of 2009 347 and that it is was running a trial of HSPA+, which has a theoretical peak maximum<br />
speed of 21 Mbps, in Philadelphia. 348 The company expects to launch HSPA+ in select, high demand<br />
markets in 2010. 349<br />
117. In addition to the 3G networks deployed by the major mobile wireless service providers,<br />
Clearwire is the only service provider now offering 4G service, using mobile WiMAX technology in the<br />
2.5 GHz BRS/EBS spectrum band. 350 Clearwire launched commercial 4G mobile WiMAX service in<br />
Portland, OR in January 2009. 351 As of September 2009, Clearwire’s WiMAX service was available in<br />
14 markets covering 10.1 million POPs. 352 Since that time, Clearwire has expanded the WiMAX network<br />
to an additional 16 markets and expects to reach 120 million POPs by the end of 2010. 353 Clearwire’s<br />
WiMAX network provides average speeds of 3-6 Mbps with burst rates up to 10 Mbps. 354 In all of the<br />
markets except Baltimore, WiMAX service is available under both Sprint Nextel’s 4G brand as well as<br />
Clearwire’s CLEAR brand. 355 CLEAR service includes both mobile and fixed service plan and device<br />
options. In addition, since July 2009, Comcast has been reselling Clearwire’s WiMAX service under the<br />
brand name Comcast High-Speed 2go in five cities - Atlanta, Chicago, Philadelphia, Portland, and<br />
Seattle. 356 The service is sold bundled with one of Comcast’s other Internet access, phone, or<br />
multichannel video products. 357 Customers have the option of purchasing a 4G WiMAX-only data card,<br />
346 Caroline Gabriel, T-<strong>Mobile</strong> USA to Upgrade Network and Move to HSPA+ Next Year, RETHINK WIRELESS, Sept.<br />
16, 2009, available at http://www.rethink-wireless.com/article.asp?article_id=1901&keywords=t-mobile (citing<br />
Cole Brodman, T-<strong>Mobile</strong> CTO).<br />
347 Taylor Wimberly, T-<strong>Mobile</strong> 3G to Reach 21Mbps in 2010, ANDROID & ME, Sept. 14, 2009, available at<br />
http://androidandme.com/2009/09/carriers/t-mobile-news/t-mobile-3g-to-reach-21mbps-in-2010/ (citing T-<strong>Mobile</strong><br />
CTO, Cole Brodman, in an interview with Om Malik, available at http://www.livestream.com/gigaomtv).<br />
348 Sascha Segan, Hands-On with T-<strong>Mobile</strong>’s Super 3G HSPA+ Network, PC MAG, Sept. 25, 2009, available at<br />
http://www.pcmag.com/article2/0,2817,2353300,00.asp; CTIA NOI Comments at 33.<br />
349 Caroline Gabriel, T-<strong>Mobile</strong> USA to Upgrade Network and Move to HSPA+ Next Year, RETHINK WIRELESS, Sept.<br />
16, 2009, available at http://www.rethink-wireless.com/article.asp?article_id=1901&keywords=t-mobile (citing<br />
Cole Brodman, T-<strong>Mobile</strong> CTO).<br />
350 NCTA NOI Comments at 3.<br />
351 Clearwire Corp., SEC Form 10-K, filed Mar. 26, 2009, at 2. Prior to the close of the transaction, Sprint had<br />
launched WiMAX service in Baltimore, MD. Sprint 4G Rollout Blazes on with Maui Launch, Press Release, Sprint<br />
Nextel, Dec. 1, 2009.<br />
352 Clearwire Corp., SEC Form 10-Q, filed Nov. 11, 2009, at 29.<br />
353<br />
Clearwire, Where is CLEAR?, http://www.clear.com/coverage (visited Jan. 19, 2010); Clearwire Corp., SEC<br />
Form 10-K, filed Mar. 26, 2009, at 2-3.<br />
354 Clearwire, How Fast is “Super Fast”?, http://www.clear.com/discover/network (visited Jan. 19, 2010).<br />
355 Sprint 4G Rollout Blazes on with Maui Launch, Press Release, Sprint Nextel, Dec. 1, 2009; Clearwire, Where is<br />
CLEAR?, http://www.clear.com/coverage (visited Jan. 19, 2010). Only Sprint offers WiMAX service in Baltimore.<br />
Sprint states that it offers 4G service in 27 markets; however, the company’s press release does not list Tacoma,<br />
Everett-Snohomish, and Kitsap, WA as separate markets from Seattle, whereas Clearwire’s website coverage map<br />
does. Id. The 4G coverage map on Sprint’s website shows coverage in these areas. See, e.g., Sprint Nextel, Sprint<br />
Coverage Tool,<br />
http://coverage.sprintpcs.com/IMPACT.jsp?covType=wimaxdual&serviceType=data&mapcity=Snohomish&mapst<br />
ate=WA (visited Jan. 20, 2010).<br />
356 Comcast Begins National Rollout of High-Speed <strong>Wireless</strong> Data Service, Press Release, Comcast, Jun. 29, 2009;<br />
Comcast, 4G Coverage Map, http://www.comcast.com/highspeed2go/#/coverage (visited Apr. 9, 2010).<br />
357 Comcast Begins National Rollout of High-Speed <strong>Wireless</strong> Data Service, Press Release, Comcast, Jun. 29, 2009.<br />
71
Federal Communications Commission <strong>FCC</strong> 10-81<br />
or a 3G/4G data card that will also work on Sprint Nextel’s 3G network. 358<br />
b. Coverage by Technology Type<br />
118. Using a census block level analysis of American Roamer data, 359 we are able to estimate<br />
coverage by air interface type in the approximately 8 million census blocks. 360 As of November 2009,<br />
virtually the entire population of the United States lived in census blocks where operators offer digital<br />
mobile wireless service, using CDMA, GSM/TDMA, or iDEN (including their respective next generation<br />
technologies), or some combination of the three.<br />
Table 12<br />
<strong>Mobile</strong> <strong>Wireless</strong> Coverage by Technology 361<br />
Technology POPs in<br />
Covered<br />
Blocks 362<br />
% of Total<br />
POPs<br />
72<br />
Square Miles<br />
Contained in<br />
Those Blocks<br />
% of Total<br />
Square Miles<br />
CDMA 282,911,183 99.2% 2,603,946 68.5%<br />
GSM/TDMA 279,560,517 98.0% 2,170,954 57.1%<br />
iDEN 251,976,136 88.3% 936,119 24.6%<br />
Total Digital 284,108,955 99.6% 2,779,247 73.1%<br />
119. As shown in Table 12, CDMA and GSM/TDMA have been deployed in census blocks<br />
containing 283 million and 280 million people, respectively. iDEN coverage is more limited, available in<br />
census blocks covering 252 million people, or 88 percent of the U.S. population. These figures are<br />
essentially unchanged from the Thirteenth <strong>Report</strong>, which was based on an analysis of May 2008<br />
American Roamer data. 363<br />
120. Based on data supplied by American Roamer from November 2009, we also have<br />
estimated the extent of mobile data and mobile broadband network coverage. Table 13 below shows the<br />
population and land area covered by the 2.5G CDMA and GSM mobile data network technologies, as<br />
well as population and land area covered by the 3G and 4G mobile broadband network technologies,<br />
HSPA, EV-DO, and WiMAX.<br />
358 Comcast Begins National Rollout of High-Speed <strong>Wireless</strong> Data Service, Press Release, Comcast, Jun. 29, 2009.<br />
359 See Section III.C.1, Number of Competitors, supra, for a discussion of the limitations of American Roamer data.<br />
360 By utilizing such a small geographic area to analyze technological availability, we are able to minimize the<br />
concerns regarding the over-counting of population and geographic area covered that were inherent in previous<br />
reports’ county-based analyses (there are approximately 3,200 in the United States). See Section III.C.1, Number of<br />
Competitors, supra.<br />
361<br />
Commission estimates based on American Roamer database, Oct. 2009. POPs are from the 2000 Census, and the<br />
square miles include the United States and Puerto Rico.<br />
362 A covered block has at least one provider.<br />
363 See Thirteenth <strong>Report</strong>, 24 <strong>FCC</strong> Rcd at 6257, 143, Table 8.
Federal Communications Commission <strong>FCC</strong> 10-81<br />
Table 13<br />
<strong>Mobile</strong> <strong>Wireless</strong> Data/Broadband Network Coverage by Census Block<br />
Technology POPs in<br />
Covered<br />
Blocks<br />
73<br />
% of Total<br />
POPs<br />
Square Miles<br />
Contained in<br />
Those Blocks<br />
% of Total<br />
Square<br />
Miles<br />
CDMA Path (1xRTT/EV-DO/EV-DO Rev. A) 282,751,321 99.1% 2,574,498 67.8%<br />
GSM Path (GPRS/EDGE/WCDMA/HSPA) 279,587,859 98.0% 2,188,317 57.6%<br />
Total <strong>Mobile</strong> Data Coverage 284,014,858 99.6% 2,763,446 72.7%<br />
WCDMA/HSPA (3G) 217,440,872 76.2% 423,738 11.2%<br />
EV-DO/EV-DO Rev. A (3G) 279,153,300 97.9% 2,125,354 55.9%<br />
<strong>Mobile</strong> WiMAX (4G) 28,074,849 9.8% 13,895 0.4%<br />
Total <strong>Mobile</strong> Broadband Coverage (3G/4G) 279,756,907 98.1% 2,150,160 56.6%<br />
Source: Federal Communications Commission estimates based on data supplied by American Roamer, Nov. 2009.<br />
Notes: POPs are from the 2000 Census, and the square miles include the United States and Puerto Rico.<br />
121. Table 13 shows that mobile data networks, which include 2.5G technologies such as<br />
1xRTT, GPRS, and EDGE, were widely deployed as of November 2009, covering 99.6 percent of the<br />
total U.S. population. While coverage by all mobile data network technologies increased slightly from<br />
May 2008 – CDMA path coverage grew from 98.8 percent to 99.1 percent, and GSM path coverage grew<br />
from 97.4 percent to 98.0 percent – the overall figure remained essentially unchanged. 364<br />
122. When looking at mobile broadband coverage, 98.1 percent of the U.S. population was<br />
covered by at least one mobile broadband network technology as of November 2009, up from 92.3<br />
percent in May 2008, according to the analysis of American Roamer data. 365 EV-DO coverage increased<br />
six percent from 263 million people, or 92.2 percent of the U.S. population, to 279 million people, or 97.9<br />
percent of the U.S. population. 366 The increase in HSPA coverage was more substantial, growing 42<br />
percent from 153 million POPs (54 percent of the U.S. population) to 217 million POPs (76 percent of the<br />
U.S. population). 367 In addition, mobile WiMAX networks, which were effectively non-existent in the<br />
Thirteenth <strong>Report</strong>, now cover approximately 28 million people. <strong>Mobile</strong> broadband coverage across<br />
different states and areas of the country is shown in Map D-28 in Appendix D.<br />
123. Chart 5 below depicts the pace of 3G and 4G deployment over the past four years. In<br />
2006, EV-DO networks covered 62.6 percent of the U.S. population. Today, they cover nearly all<br />
Americans, as measured by census blocks, with 98 percent covered as of November 2009. 368 This is<br />
reflected in the network deployment activities of the two major EV-DO providers, Verizon <strong>Wireless</strong> and<br />
Sprint Nextel, which are beginning to focus on 4G offerings rather than 3G deployment – Verizon<br />
<strong>Wireless</strong> with LTE and Sprint Nextel with its investment in Clearwire. HSPA network coverage is not as<br />
extensive as EV-DO coverage. However, HSPA deployment has been increasing in recent years, rising<br />
from 20 percent of the U.S. population in 2006 to 76 percent in 2009. 369 The largest HSPA network<br />
operators, AT&T and T-<strong>Mobile</strong>, are still in the process of actively expanding and upgrading their HSPA<br />
networks.<br />
364 See Thirteenth <strong>Report</strong>, 24 <strong>FCC</strong> Rcd at 6257, 145, Table 9.<br />
365<br />
Id.<br />
366<br />
Id.<br />
367<br />
Id.<br />
368 See Eleventh <strong>Report</strong>, 21 <strong>FCC</strong> Rcd at 10985, 95, Table 8.<br />
369 See id.
Percent of U.S. Population<br />
100<br />
90<br />
80<br />
70<br />
60<br />
50<br />
40<br />
30<br />
20<br />
10<br />
0<br />
Federal Communications Commission <strong>FCC</strong> 10-81<br />
Chart 5<br />
The Pace of 3G and 4G Network Deployment 370<br />
HSPA EV-DO WiMax<br />
2006 2007 2008 2009<br />
c. Roaming<br />
124. Due to the challenges inherent in building out a wireless network, which can include both<br />
economic and environmental obstacles, it may be more cost-effective in some areas for a mobile wireless<br />
provider to attain roaming agreements with other providers than to build out its own facilities. 371<br />
Roaming arrangements between commercial mobile wireless service providers allow customers of one<br />
mobile wireless provider to automatically receive service from another provider’s network when they are<br />
in areas that their provider’s network does not cover. 372 As shown in Table 21, below, total annual<br />
intercarrier roaming revenues and minutes have declined as a percentage of total service revenues and<br />
total minutes, respectively, over the past ten years. 373 From a customer perspective, many service plans<br />
now include nationwide roaming at no additional cost to subscribers. In addition, changes in the wireless<br />
industry over the last decade have resulted in larger geographic coverage areas, which may have affected<br />
roaming arrangements in some instances.<br />
125. Despite the declining contribution of roaming relative to wireless industry revenues and<br />
minutes of use on the whole, roaming remains an important means for mobile wireless providers in areas<br />
where they do not have network coverage. As commenters have noted, no mobile wireless provider –<br />
including the four nationwide providers – has built out its entire licensed service area, and consequently<br />
370 Commission estimates based on American Roamer database, Nov. 2009 (for 2009 data). See Thirteenth <strong>Report</strong>,<br />
24 <strong>FCC</strong> Rcd at 6257, 145; Twelfth <strong>Report</strong>, 23 <strong>FCC</strong> Rcd at 2304, 143; Eleventh <strong>Report</strong>, 21 <strong>FCC</strong> Rcd at 10995, <br />
117.<br />
371 See AT&T NOI Comments, at 74 (stating that “the economics of providing any type of product or service –<br />
including wireless – are more challenging in rural areas, because the lower population density of these areas<br />
typically entails higher average delivery costs”); NTCA PN Comments, at 3 (acknowledging the “difficulties<br />
inherent to providing wireless service to rural areas, such as challenging topography and low customer density”).<br />
372 All mobile calling plans specify a calling area – such as a particular metropolitan area, a state, a region, the<br />
provider’s entire network, or the entire United States – within which the subscriber can make a call without<br />
incurring additional charges. Outside of this calling area, roaming services are obtained by a carrier for its<br />
customers through a roaming agreement with another carrier.<br />
373 See Section V.E.3, Intercarrier Roaming Rates and Revenue, infra.<br />
74
Federal Communications Commission <strong>FCC</strong> 10-81<br />
all providers employ roaming to some extent to fill gaps in their coverage. 374 In addition, as discussed<br />
above, there are various non-nationwide providers whose business plans are not focused on building out<br />
their networks nationally. 375 Nonetheless, through roaming agreements with other mobile wireless<br />
providers, many of the non-nationwide providers are able to offer coverage and service plans that are<br />
national in scope. 376 Accordingly, roaming can be particularly important for small and regional providers<br />
with limited network population coverage to remain competitive by meeting their customers’ expectations<br />
of nationwide service. 377 Similarly, roaming may be important to new entrants who wish to begin<br />
offering service before they have fully built out their networks. 378<br />
126. The Commission has recognized the importance of roaming and in 2007 clarified that<br />
automatic roaming is a common carrier obligation for CMRS providers. 379 In the 2007 Roaming Order<br />
and FNPRM, the Commission held that CMRS providers must provide automatic roaming services to<br />
other technologically compatible providers outside their home areas upon reasonable request and on a<br />
just, reasonable, and nondiscriminatory basis pursuant to Sections 201 and 202 of the Communications<br />
Act. 380 Recently, the Commission adopted a Roaming Order on Reconsideration, which eliminates the<br />
374 See Cricket PN Comments, at 6 (stating that “[a]utomatic roaming agreements play a critical role in the wireless<br />
industry, plugging coverage holes that exist in every carrier’s network so that subscribers can obtain seamless<br />
coverage wherever they travel.”); T-<strong>Mobile</strong> Petition, Oct. 1, 2007, WT Docket No. 05-265, at 2 (stating that “on a<br />
geographic basis, no wireless carrier operating in the United States has close to a nationwide footprint using solely<br />
its own facilities”). One potential measure of the significance of roaming in the wireless industry is roaming<br />
revenues, which are discussed in detail below. See Section V.E.3, Intercarrier Roaming Rates and Revenue, infra.<br />
375 See Section III.B.1, Facilities-Based Providers, supra. For example, Leap and MetroPCS focus mainly on<br />
offering service to customers in metropolitan areas, while US Cellular offers regional coverage in 185 operating<br />
markets throughout 26 states.<br />
376 See, e.g., Cricket, Coverage, http://www.mycricket.com/coverage/cell-phone-coverage (visited Jan. 20, 2010)<br />
(stating that “Cricket <strong>Wireless</strong> offers nationwide cell phone coverage all over the U.S.”); Cricket, <strong>Wireless</strong> Coverage<br />
Maps, http://www.mycricket.com/coverage/maps/wireless (visited Jan. 20, 2010) (providing an interactive U.S. map<br />
showing Cricket’s roaming coverage); MetroPCS, Compare Plans, http://www.metropcs.com/plans/ (visited Jan. 20,<br />
2010) (showing MetroPCS plans that include nationwide coverage); MetroPCS, Coverage Map,<br />
http://www.metropcs.com/coverage/ (visited Jan. 20, 2010) (providing an interactive U.S. map showing the various<br />
types of coverage provided by MetroPCS in different geographic areas); US Cellular, Plans,<br />
http://www.uscc.com/uscellular/SilverStream/Pages/r_zip.html?call=2&tabPlan=2 (visited Jan. 20, 2010) (after<br />
entering a valid zip code, shows US Cellular national plans); US Cellular, Voice and Data Maps,<br />
http://www.uscc.com/uscellular/SilverStream/Pages/x_page.html?p=map_home (visited Jan. 20, 2010) (providing<br />
an interactive U.S. map depicting US Cellular “National Voice Coverage”).<br />
377 See RCA NOI Comments, at 11-12 (stating that smaller rural and regional carriers “must be in a position to meet<br />
their customers’ expectations,” which “increasingly include the provision of a nationwide footprint”);<br />
SouthernLINC NOI Reply, at 4 (stating that “[c]onsumers expect to be able to use their wireless handsets when they<br />
travel outside their local areas”).<br />
378 See RTG PN Reply, at 17 (stating that “[f]or each and every new market entrant to become fully deployed across<br />
their license area overnight, or at least prior to a commercial launch, is completely impractical”).<br />
379 See Roaming Obligations of Commercial <strong>Mobile</strong> Radio Service Providers, <strong>Report</strong> and Order and Further Notice<br />
of Proposed Rulemaking, 22 <strong>FCC</strong> Rcd 15817, 15828 27 (2007) (2007 Roaming Order and FNPRM) (“[W]e<br />
recognize that automatic roaming benefits mobile telephony subscribers by promoting seamless CMRS service<br />
around the country, and reducing inconsistent coverage and service qualities.”)<br />
380 Id. at 15818-19 2. The common carrier obligation to provide roaming extends to real-time, two-way switched<br />
voice or data services that are interconnected with the public switched telephone network and utilize an in-network<br />
switching facility that enables the provider to reuse frequencies and accomplish seamless hand-offs of subscriber<br />
calls. The Commission also extended the automatic roaming requirement to push-to-talk (PTT) and text messaging<br />
services, and in its Further Notice of Proposed Rulemaking sought comment on whether the roaming obligation<br />
should be extended to services that are classified as information services and services that are not CMRS.<br />
75
Federal Communications Commission <strong>FCC</strong> 10-81<br />
home roaming exclusion and establishes the same general obligation to provide automatic roaming,<br />
regardless of whether the carrier requesting roaming holds spectrum in an area. 381 In that Order, the<br />
Commission found that making automatic roaming arrangements available on just and reasonable terms<br />
and conditions will promote competition among multiple mobile wireless service providers, ensure that<br />
consumers have access to seamless coverage nationwide, and provide incentives for all providers to invest<br />
and innovate by using available spectrum and constructing wireless network facilities on a widespread<br />
basis. 382 At the same time, the Commission also adopted a Second Further Notice of Proposed<br />
Rulemaking seeking comment on whether to extend roaming obligations to data services such as mobile<br />
broadband and Internet access services and expanding the scope of the proceeding by seeking comment<br />
on obligations governing the provision of roaming for data services by providers that are not CMRS<br />
carriers, as well as by providers that also offer CMRS services. 383<br />
2. Advertising, Marketing, Sales Expenditures, and Retailing<br />
127. Product information and perception is a second area of non-price competition among<br />
mobile wireless service providers. Firms may engage in advertising and marketing either to inform<br />
consumers of available products or services or to increase sales by changing consumer preferences.<br />
<strong>Mobile</strong> wireless service is an “experience good,” 384 and in general, advertising for an experience good<br />
tends to be persuasive rather than informational in nature. CTIA, in its comments, cites economists who<br />
claim that advertising leads to lower prices, improved product quality, strong brands, and innovation. 385<br />
a. Advertising Expenditures<br />
128. Advertising spending by wireless service providers in 2008 and 2009 fell slightly from its<br />
2007 levels, and there is evidence that providers’ marketing efforts are becoming more segmented and<br />
less aimed at the mass market. According to Nielsen, advertising expenditures for mobile wireless<br />
service dropped eight percent from $3.7 billion in 2007 to $3.4 billion in 2008. 386 For the first three<br />
quarters of 2009, wireless advertising spending totaled $2.55 billion, down 5.4 percent from $2.69 billion<br />
during the first three quarters of 2008. 387<br />
129. Despite the drop in overall advertising spending, wireless service providers continued to<br />
spend more on advertising than firms in many other industries. In Nielsen’s rankings of advertising<br />
spending by product category, “wireless telephone service” rose from 7 th place in 2007 to 6 th place in<br />
2008 to fourth place in the first quarter through the third quarter of 2009. 388 Nielsen also found that<br />
381 Reexamination of Roaming Obligations of Commercial <strong>Mobile</strong> Radio Service Providers, Order on<br />
Reconsideration and Second Further Notice of Proposed Rulemaking, <strong>FCC</strong> 10-59 (rel. Apr. 21, 2010) (Roaming<br />
Order on Reconsideration).<br />
382 Id.<br />
383 Id.<br />
384 An experience good is a product or service that the customer must consume before determining its quality. See<br />
Dennis W. Carlton and Jeffrey M. Perloff, MODERN INDUSTRIAL ORGANIZATION (3 rd ed.), Addison, Wellsley,<br />
Longman, Inc., 1999, at 484.<br />
385 CTIA NOI Comments, at 53.<br />
386 Nielsen <strong>Report</strong>s 2008 U.S. Ad Spend Down 2.6%, NIELSEN WIRE, Mar. 13, 2009, available at<br />
http://blog.nielsen.com/nielsenwire/consumer/nielsen-reports-2008-us-ad-spend-down-26/.<br />
387 Ad Spending in U.S. Down 11.5 Percent in First Three Quarters of 2009, NIELSEN WIRE, Dec. 10, 2009,<br />
available at http://blog.nielsen.com/nielsenwire/consumer/ad-spending-in-u-s-down-11-5-percent-in-first-threequarters-of-2009/.<br />
388 Nielsen <strong>Report</strong>s 2008 U.S. Ad Spend Down 2.6%, NIELSEN WIRE, Mar. 13, 2009, available at<br />
http://blog.nielsen.com/nielsenwire/consumer/nielsen-reports-2008-us-ad-spend-down-26/; Ad Spending in U.S.<br />
Down 11.5 Percent in First Three Quarters of 2009, NIELSEN WIRE, Dec. 10, 2009, available at<br />
(continued….)<br />
76
Federal Communications Commission <strong>FCC</strong> 10-81<br />
wireless service has the second-highest amount of advertising spending, after the automobile industry, on<br />
Spanish-language advertising during the first three months of 2009. <strong>Wireless</strong> service providers increased<br />
their Spanish-language advertising nearly five percent during this period from $319 million to $335<br />
million. 389<br />
130. When looking at the advertising expenditures of individual firms, we see a similar<br />
picture: wireless and telecom advertising spending is significant, particularly in relationship to other<br />
industries, 390 but has been declining in recent years. According to data from TNS, Verizon and AT&T<br />
were the second and fourth largest U.S. advertisers during 2008, spending $2.39 billion and $1.98 billion<br />
respectively. 391 However, this was a 2.9 percent drop from the total advertising spending of these two<br />
companies in 2007. 392 Advertising spending by Verizon and AT&T declined further in 2009. During the<br />
first three quarters of that year, Verizon’s advertising spending fell 5.8 percent while AT&T’s fell 6.1<br />
percent, versus the same period in 2008. 393 On the other hand, during that period, Sprint Nextel rose to<br />
become the seventh largest U.S. advertiser, increasing its advertising spending 51 percent over the first<br />
three quarters of 2009. 394<br />
131. According to Forrester, one reason for the slight decline in advertising spending could be<br />
that wireless service providers are focusing their advertising efforts less on the mass market and more on<br />
niche segments, with the two key segments being: 1) consumers purchasing unlimited, prepaid service,<br />
and 2) higher-ARPU consumers purchasing smartphones. 395 Verizon targets its marketing efforts at<br />
various customer segments, including young adults, seniors, families, and small and large businesses. 396<br />
Leap also reports that its customer base is segmented; in Leap’s case, it is diversified geographically,<br />
ethnically, and demographically. 397 Leap reports that it has decentralized its marketing efforts to<br />
customize them for local markets. 398<br />
b. Marketing Campaigns<br />
132. In addition to investing in network infrastructure and acquiring spectrum, mobile wireless<br />
(Continued from previous page)<br />
http://blog.nielsen.com/nielsenwire/consumer/ad-spending-in-u-s-down-11-5-percent-in-first-three-quarters-of-<br />
2009/.<br />
389 Nielsen Ad Intelligence Spotlight on Multi-Cultural Advertising, Nielsen, Oct. 2009, available at<br />
http://blog.nielsen.com/nielsenwire/wp-content/uploads/2009/10/MultiCulturalSpotlight10.23.09.pdf, at 3.<br />
390 See AT&T PN Comments at 49.<br />
391 TNS Media Intelligence <strong>Report</strong>s U.S. Advertising Expenditures Declined 4.1 Percent in 2008, Press Release,<br />
TNS Media Intelligence, May 4, 2009, available at http://www.tns-mi.com/news/05042009.htm. The advertising<br />
expenditures of Verizon and AT&T include those companies’ wireline businesses as well.<br />
392 Id.<br />
393 TNS Media Intelligence <strong>Report</strong>s U.S. Advertising Expenditures Declined 14.7 Percent in First Nine Months of<br />
2009, Press Release, TNS Media Intelligence, Dec. 9, 2009, available at http://www.tns-mi.com/news/2009-Ad-<br />
Spending-Q3.htm.<br />
394 Id.<br />
395 Mike Shields, Calling on Niche Markets, BRANDWEEK, June 8, 2009 (citing Charles Golvin, principal analyst at<br />
Forrester Research, who stated, “There has been a lot of competition around the low end. Companies have been<br />
spending to get that message out, that they offer predictability. No hidden fees, no charges sneaking up,” and “At<br />
the high end, carriers are willing to spend on advertising. ... It’s worth it to get those highly profitable users. These<br />
are people who are better insulated against tough times and can handle expensive plans.”)<br />
396 Verizon Communications, Inc., SEC Form 10-K, filed Feb. 24, 2009, at 7.<br />
397 Leap <strong>Wireless</strong> International, Inc., SEC Form 10-K, filed Feb. 27, 2009, at 4.<br />
398 Id.<br />
77
Federal Communications Commission <strong>FCC</strong> 10-81<br />
service providers have pursued marketing strategies designed to highlight their network quality and to<br />
differentiate it from rival offerings. 2008 and 2009 saw a shift in the focus of several providers’<br />
marketing campaigns from voice quality and reliability to mobile broadband 3G network quality,<br />
coverage, speed, and reliability.<br />
133. As discussed in the Thirteenth <strong>Report</strong>, many mobile wireless service providers have<br />
highlighted the quality of their networks in various advertising campaigns in recent years, including<br />
Verizon <strong>Wireless</strong>’s “Can You Hear Me Now?” advertisements and “America’s most reliable wireless<br />
network” slogan, AT&T’s “fewest dropped calls of any wireless carrier” claim. While certain service<br />
providers continue to emphasize network quality in their marketing and branding efforts, in 2009, the<br />
focus of these efforts shifted from voice to 3G mobile broadband services. For example, in July 2008,<br />
with the launch of the Apple iPhone 3G, AT&T began claiming in its advertisements that it has the<br />
nation’s fastest 3G network. 399 Verizon <strong>Wireless</strong> countered this campaign by launching a series of<br />
advertisements, beginning in October 2009, comparing its 3G coverage to that of AT&T, parodying the<br />
Apple slogan, “There’s an app for that,” with its own version, “There’s a map for that.” 400 In addition,<br />
Sprint Nextel claims to have “the most reliable 3G network.” 401<br />
c. Retailing<br />
134. <strong>Mobile</strong> wireless service providers distribute and sell their products and services through a<br />
variety of direct and indirect retail channels in order to increase customer growth and reduce customer<br />
acquisition costs. 402 The various distribution channels include: 1) direct retail outlets, such as providerowned<br />
stores and kiosks; 2) indirect retail outlets, including mass-market electronics retailers such as Best<br />
Buy, Wal-Mart, Target, Costco, Radio Shack, and Amazon; 3) provider websites; and 4) telemarketers. 403<br />
Service providers report that those customers obtained through direct channels tend to be more loyal and<br />
generate higher revenue that those obtained through indirect channels. For instance, Verizon <strong>Wireless</strong><br />
had approximately 2,500 company-owned and operated stores and kiosks as of December 31, 2008, 404<br />
and reports that the customers obtained through these channels are less likely to cancel their service than<br />
399 AT&T Offers Nation’s Fastest 3G Network, Press Release, AT&T, July 10, 2008 (the claims are based on “data<br />
compiled by leading independent wireless research firms”). A 12-city test of 3G network speeds conducted by<br />
Gizmodo in December 2009 also found that AT&T had the fastest download speeds. See Our 2009 12-City 3G<br />
Data Mega Test: AT&T Won, GIZMODO, Dec. 22, 2009, available at http://gizmodo.com/5428343/our-2009-<br />
12+city-3g-data-mega-test-att-won.<br />
400 See Joshua Topolsky, Verizon Removes Gloves, Begins ‘There’s a Map for That’ Anti-AT&T Ad Campaign,<br />
ENGADGET MOBILE, Oct. 5, 2009, available at http://mobile.engadget.com/2009/10/05/verizon-removes-glovesbegins-theres-a-map-for-that-anti-atand/.<br />
In the ads, Verizon <strong>Wireless</strong> claims it has five times the 3G coverage as<br />
AT&T.<br />
401 Sprint Named Denver’s Most Reliable Network in PC World’s 3G Comparison Test, Press Release, Sprint<br />
Nextel, July 15, 2009. Similar press releases were issued for seven other cities and can be found at<br />
http://newsreleases.sprint.com/phoenix.zhtml?c=127149&p=irol-news_newsroom&nyo=1. See also, Mark Sullivan,<br />
A Day in the Life of 3G, PC WORLD, June 28, 2009, available at<br />
http://www.pcworld.com/article/167391/a_day_in_the_life_of_3g.html.<br />
402<br />
Verizon Communications, Inc., SEC Form 10-K, filed Feb. 24, 2009, at 7; Leap <strong>Wireless</strong> International, Inc., SEC<br />
Form 10-K, filed Feb. 27, 2009, at 6.<br />
403 Verizon Communications, Inc., SEC Form 10-K, filed Feb. 24, 2009, at 7; Sprint Nextel Corp., SEC Form 10-K,<br />
filed Feb. 27, at 3; CTIA PN Comments at 33-34. In addition, service providers use direct sales representatives to<br />
sell services to business and government customers. Id.<br />
404 Verizon Communications, Inc., SEC Form 10-K, filed Feb. 24, 2009, at 7. This included Verizon <strong>Wireless</strong>’s<br />
“store-within-a-store” kiosks within Circuit City and BJ’s Wholesale Club stores. On February 19, 2009, Verizon<br />
<strong>Wireless</strong> closed all of its Circuit City kiosks following Circuit City’s bankruptcy and liquidation of assets. Id.<br />
78
Federal Communications Commission <strong>FCC</strong> 10-81<br />
those obtained through mass-market channels. 405 In addition, as of December 31, 1008, Leap had 263<br />
company-owned stores and kiosks, which generated 23 percent of the company’s net adds in 2008, as<br />
well as 2,826 indirect distributor locations. 406 These indirect distributor locations included 1,036<br />
“premier” dealer stores, which are independently owned but usually sell Cricket products exclusively and<br />
look and function similar to company-owned stores. 407 Leap reports that the premier stores tend to<br />
generate more sales that the other indirect retail outlets. 408 The company also reports that its Internet and<br />
telephone sales are growing. 409<br />
3. Differentiation in <strong>Mobile</strong> <strong>Wireless</strong> Handsets/Devices<br />
135. In addition to network quality and advertising, a third component of non-price rivalry<br />
among mobile wireless service providers is the differentiation of the downstream products that they offer<br />
or that rely on their networks, including handsets/devices, operating systems, and mobile applications.<br />
With respect to handsets and devices, providers compete by introducing new handsets/devices,<br />
distinguishing their handset/device offerings from those of their competitors, responding to competitors’<br />
handset/device innovations with rival offerings, offering certain handset/device models on an exclusive<br />
basis, and allowing handsets/devices that they do not sell directly to be used on their networks. 410 The<br />
role of smartphone devices – such as the iPhone, Blackberry, Palm, and Android devices – in competition<br />
among mobile wireless service providers is discussed in detail below. The emergence of a handful of<br />
smartphone operating systems – Apple, Android, BlackBerry, Palm, and Windows <strong>Mobile</strong> – represents a<br />
shift in the mobile wireless ecosystem and one that is affecting the ability of mobile wireless service<br />
providers to differentiate themselves based on handsets and devices.<br />
136. Smartphones. As discussed in previous reports, the 2007 launch of the iPhone and 2008<br />
launch of the iPhone 3G catalyzed the development of a new type of device in the mobile wireless<br />
ecosystem, the smartphone. 411 Over the past two years, wireless service providers, handset<br />
manufacturers, and platform developers have introduced an array of smartphones to respond to consumer<br />
demand for devices with advanced data capabilities and to compete with and mimic the features of the<br />
iPhone. 412 While there is no industry standard definition of a smartphone, for purposes of this <strong>Report</strong>, we<br />
consider the distinguishing features of a smartphone to be an HTML browser that allows easy access to<br />
the full, open Internet; an operating system that provides a standardized interface and platform for<br />
application developers; and a larger screen size than a traditional handset. 413 Many smartphones also<br />
have touch screens and/or a QWERTY keypad, and, as discussed below, run an operating system that<br />
405 Verizon Communications, Inc., SEC Form 10-K, filed Feb. 24, 2009, at 7.<br />
406 Leap <strong>Wireless</strong> International, Inc., SEC Form 10-K, filed Feb. 27, 2009, at 6.<br />
407 Id.<br />
408 Id.<br />
409 Id. at 4.<br />
410<br />
See Verizon <strong>Wireless</strong> PN Comments at 15; AT&T PN Comments at 34, AT&T NOI Comments at 47; TIA NOI<br />
Comments at 8.<br />
411 See Thirteenth <strong>Report</strong>, 24 <strong>FCC</strong> Rcd at 6264-65, 165; Twelfth <strong>Report</strong> 23 <strong>FCC</strong> Rcd at 2315-16, 177.<br />
412 See CBW NOI Comments at 3; Bright House Networks NOI Comments at 10.<br />
413 See The <strong>Mobile</strong> Internet <strong>Report</strong>, Morgan Stanley, Morgan Stanley Research, Dec. 15, 2009, at 110 (Morgan<br />
Stanley <strong>Mobile</strong> Internet <strong>Report</strong>); Verizon Communications, Inc., SEC Form 10-K, filed Feb. 24, 2009, at 6;<br />
Wikipedia, Smartphone, http://en.wikipedia.org/wiki/Smartphone (visited Mar. 8, 2010). In addition to smartphones<br />
and traditional handsets, the third category of devices, for purposes of this <strong>Report</strong>, is data-centric devices, which<br />
includes devices with no inherent voice capability, such as USB wireless modem laptop cards, mobile Wi-Fi<br />
devices, and laptops and netbooks with embedded mobile wireless modems. The traditional handset category<br />
includes voice-centric handsets that do not allow or are not designed for easy web browsing.<br />
79
Federal Communications Commission <strong>FCC</strong> 10-81<br />
offers a standard platform for application developers to create and sell device software through an<br />
application store.<br />
137. Over the past two years, the industry has experienced an increase in smartphone<br />
adoption. As shown in Chart 6, smartphones accounted for 44 percent of total handset sales in the third<br />
quarter of 2009, up from 27 percent in the second quarter of 2008. 414 CTIA also reports that smartphones<br />
represented 23 percent of all U.S. handset sales in the fourth quarter of 2008, up from 12 percent in<br />
2007. 415<br />
60%<br />
50%<br />
40%<br />
30%<br />
20%<br />
10%<br />
0%<br />
27%<br />
29%<br />
24%<br />
Chart 6<br />
Smartphone Adoption Rates (2Q08-3Q09) 416<br />
30%<br />
29%<br />
30%<br />
39%<br />
31%<br />
35%<br />
80<br />
46%<br />
27%<br />
37%<br />
47%<br />
35%<br />
41%<br />
50%<br />
39%<br />
2Q2008 3Q2008 4Q2008 1Q2009 2Q2009 3Q2009<br />
Percentage of Smartphones as of Total Handset Sales<br />
Percentage of Smartphones as of Total Handset Upgrades<br />
Percentage of Smartphones as of Total Gross Adds<br />
138. AT&T began offering, on an exclusive basis, Apple’s iPhone 3G in July 2008. Unlike<br />
the first generation iPhone, the iPhone 3G runs on AT&T’s faster HSPA network and includes direct<br />
access to the Apple App Store, launched at the same time. 417 In June 2009, AT&T began selling the latest<br />
iPhone model, the iPhone 3GS. 418 The iPhone 3GS includes a camera, video camera, speaker phone,<br />
digital compass, more memory, longer battery life and a new version of the iPhone operating system, OS<br />
414 See Section VII.B.1, <strong>Mobile</strong> <strong>Wireless</strong> Handsets/Devices and Operating Systems, infra.<br />
415 CTIA PN Comments at 33. The market shares of the smartphone operating systems in use in the United States in<br />
December 2009 are shown in Table 33, infra.<br />
416 Simon Flannery and Daniel Gaviria, Survey: Smartphone Adoption Steadily Rising, Morgan Stanley, Nov. 13,<br />
2009, at 3 (Smartphone Adoption Steadily Rising).<br />
417 Thirteenth <strong>Report</strong>, 24 <strong>FCC</strong> Rcd at 6265-66, 165-166.<br />
418 iPhone 3GS Available at AT&T Tomorrow, Press Release, AT&T, June 18, 2009.<br />
44%
Federal Communications Commission <strong>FCC</strong> 10-81<br />
3.0. 419 The 3GS is also able to connect to AT&T’s HSPA 7.2 Mbps network. 420 As a sign that certain<br />
mobile consumers have switched to AT&T primarily to access an iPhone, AT&T reports that 40 percent<br />
of its iPhone customers switched to AT&T from another service provider. 421 iPhone’s share of<br />
smartphone business has grown as well from 5 percent in the first quarter of 2008 to 17 percent in the<br />
third quarter of 2009 (see Chart 7).<br />
Millions of iPhone Units Sold (worldwide)<br />
8<br />
7<br />
6<br />
5<br />
4<br />
3<br />
2<br />
1<br />
0<br />
Chart 7<br />
Apple iPhone Sales (1Q08-3Q09) 422<br />
Units Sold (Millions)<br />
Share of Smartphone Sales<br />
1Q08 2Q08 3Q08 4Q08 1Q09 2Q09 3Q09<br />
139. To capitalize on the growing consumer demand for smartphones and to compete with the<br />
functionalities offered by the iPhone, several wireless service providers, equipment manufacturers, and<br />
mobile platform developers introduced new smartphone devices in 2008 and 2009. Table C-5 in<br />
Appendix C shows selected smartphones launched over the past two years, and Chart 8 below shows the<br />
number of smartphone launches by the four largest service providers, based on the information in Table<br />
C-5. These launches represent not only an attempt by service providers to prevent their subscribers from<br />
switching to the iPhone, and hence to AT&T, but also an effort to migrate their traditional handset<br />
customers to smartphones. Smartphone users typically have lower churn rates and generate higher data<br />
ARPU, which can, from the service provider’s perspective, offset the slowing growth in subscriber<br />
penetration and declining voice ARPU. 423 On the other hand, smartphone users also typically have higher<br />
419 Apple Announces the New iPhone 3GS – The Fastest, Most Powerful iPhone Yet, Press Release, Apple, June 8,<br />
2009.<br />
420 Id. The iPhone 3.0 OS on the 3GS also includes automatic authentication at AT&T’s Wi-Fi hotspots, allowing<br />
customers to move seamlessly from AT&T’s 3G network to its Wi-Fi network without a call or data connection<br />
being dropped. iPhone 3GS Available at AT&T Tomorrow, Press Release, AT&T, June 18, 2009.<br />
421 Roger Entner, Is Handset Exclusivity Really the Issue of the Day?, NIELSEN WIRE, Aug. 27, 2009, available at<br />
http://blog.nielsen.com/nielsenwire/online_mobile/handset-exclusivity/.<br />
422<br />
See Tal Liani, et al., Finding Value in Smartphones, Bank of America/Merrill Lynch, Dec. 14, 2009, at 15<br />
(Finding Value in Smartphones).<br />
423 See Finding Value in Smartphones, at 7, 26; Smartphone Adoption Steadily Rising, at 1, 2.<br />
81<br />
18%<br />
16%<br />
14%<br />
12%<br />
10%<br />
8%<br />
6%<br />
4%<br />
2%<br />
0%<br />
iPhone Share of Global Smartphone Sales
Federal Communications Commission <strong>FCC</strong> 10-81<br />
bandwidth consumption levels, which can strain wireless network capacity. 424<br />
Chart 8<br />
Share of Smartphone Launches by Four Nationwide Service Providers in 2008-2009 425<br />
Verizon<br />
<strong>Wireless</strong><br />
27%<br />
T-<strong>Mobile</strong><br />
19%<br />
82<br />
Sprint Nextel<br />
22%<br />
AT&T<br />
32%<br />
140. Many of the features and capabilities of the smartphones introduced in the past two years<br />
– such as touch screens, automatic rotation of images, easy-to-use web browsers, and application stores –<br />
can be viewed as an attempt to compete with those features originally introduced on the iPhone. For<br />
example, the Motorola DROID automatically rotates images from portrait to landscape and allows users<br />
to zoom in on web pages by tapping on the screen. However, several service providers have introduced<br />
smartphones that attempt to differentiate themselves based on other functionalities. For example, RIM’s<br />
BlackBerry devices continue to offer integration with corporate e-mail servers, Palm’s devices allow<br />
users to multitask among applications and save documents, 426 and Windows <strong>Mobile</strong> devices have sought<br />
to replicate a Windows PC desktop experience on a mobile device. 427 As with the iPhone, a number of<br />
these other smartphones were launched subject to exclusive handset arrangements. 428<br />
141. A notable development in smartphone differentiation in 2008-2009 was the introduction<br />
of devices that use Google’s Android operating system. As discussed in the Thirteenth <strong>Report</strong>, the first<br />
Android device to be made available in the United States was T-<strong>Mobile</strong>’s G1, manufactured by HTC, in<br />
October 2008. 429 In 2009, T-<strong>Mobile</strong> unveiled the Android-based myTouch 3G, myTouch 3G Fender<br />
424 Smartphone Adoption Steadily Rising, at 1, 2.<br />
425 Based on Table C-5, Appendix C, infra.<br />
426 Steven Levy, Palm Pre, WIRED, June 4, 2009, at http://www.wired.com/reviews/product/palmpre; Tom Krazit,<br />
Can a Palm Pre Multitask Better Than an iPhone?, CNET NEWS, May 6, 2009, at http://news.cnet.com/8301-<br />
1035_3-10234043-94.html.<br />
427 See Finding Value in Smartphones, at 25. However, Windows <strong>Mobile</strong> 7, scheduled to be released later in 2010,<br />
will likely include additional features and functionalities, such as a touchscreen system with highly simplified<br />
menus, music syncing, and application support. David Liu, Can Windows 7 <strong>Mobile</strong> Compete in an iPhone World?,<br />
INFORMATIONWEEK SMB, Mar. 31, 2010, available at<br />
http://bmighty.informationweek.com/mobile/showArticle.jhtml?articleID=224200868.<br />
428 See infra Appendix C, Table C-5.<br />
429 See Thirteenth <strong>Report</strong>, 24 <strong>FCC</strong> Rcd at 6269, 174.
Federal Communications Commission <strong>FCC</strong> 10-81<br />
Limited Edition, Samsung Behold II, and Motorola CLIQ with MOTOBLUR, 430 while Sprint Nextel<br />
launched the HTC Hero and Samsung Moment. 431 In late 2009, Verizon <strong>Wireless</strong> began offering two<br />
Android devices: the HTC DROID Eris and Motorola DROID. 432 And in January 2010, Google began<br />
selling its own version of an Android-based smartphone, the Nexus One, directly to end users as a reseller<br />
of wireless network services.<br />
142. Like Apple, Google has been aiming to create an entire ecosystem of applications and<br />
services around its Android operating system. 433 As of December 2009, the Android Market had 15,000<br />
applications and 40 million downloads in 14 months, versus Apple App Store’s 100,000 applications and<br />
over 2 billion downloads in 17 months. 434 Android is made available free of charge to handset<br />
manufacturers and wireless service providers, and is available on multiple devices and multiple service<br />
providers. 435 Android is also an open source platform; the launch of applications and content by thirdparty<br />
developers through the Android Market application store requires no approval by either Google or<br />
the wireless service provider. 436 In addition, Android combines and supports Google’s web-based<br />
applications, including its search engine, Gmail e-mail product, web browser, and mapping application,<br />
all of which come pre-loaded on Android devices. 437 According to analysts, the Android operating<br />
system – because of the characteristics described above – is likely to compete more effectively with the<br />
Apple iPhone than handset manufacturers and mobile wireless service providers acting alone. 438<br />
143. As mobile operating systems and the functionalities they enable play a more prominent<br />
role in a consumer’s mobile wireless experience, consumers are showing an increasing loyalty to<br />
particular operating systems or device platforms. In cases where a particular mobile operating system is<br />
developed by a device manufacturer or vendor and available only on the devices produced by (or under<br />
contract for) that manufacturer or vendor, as with the Apple iPhone, a service provider can respond to<br />
demand for this consumer experience by making an arrangement with the manufacturer to be the<br />
exclusive network provider for those devices. AT&T’s arrangement to be the exclusive service provider<br />
430 T-<strong>Mobile</strong> myTouch 3G with Google Now Available for Pre-Sale for Current T-<strong>Mobile</strong> Customers, Press Release,<br />
T-<strong>Mobile</strong>, July 8, 2009; T-<strong>Mobile</strong> Unveils Holiday Handsets Including Broadest Selection of Android-Powered<br />
Devices, Press Release, T-<strong>Mobile</strong>, Oct. 7, 2009.<br />
431 Samsung’s First Android-Powered Phone, Samsung Moment with Google, Coming to America’s Most<br />
Dependable 3G Network, Press Release, Sprint Nextel, Oct. 7, 2009; The Innovation and Openness of a True <strong>Mobile</strong><br />
Internet Experience Coming Soon to America’s Most Dependable 3G Network from Sprint on HTC Hero with<br />
Google, Press Release, Sprint Nextel, Sept. 3, 2009; Sprint Nextel NOI Comments at 14..<br />
432 Bring an Android Device Home for the Holidays with DROID ERIS by HTC, Exclusively from Verizon <strong>Wireless</strong>,<br />
Press Release, Verizon <strong>Wireless</strong>, Nov. 5, 2009; Hello Humans: Droid by Motorola Arrives Next Week, Press<br />
Release, Verizon <strong>Wireless</strong>, Oct. 28, 2009. AT&T has announced plans to begin selling five Android devices during<br />
the first half of 2010. AT&T Announces Major Initiative to Bring ‘Apps to All’ Company Also Plans to Launch Five<br />
Android-Based Devices in First Half of 2010, Press Release, AT&T, Jan. 6, 2010.<br />
433 See Finding Value in Smartphones, at 9.<br />
434 Morgan Stanley <strong>Mobile</strong> Internet <strong>Report</strong>, at 157.<br />
435 See Thirteenth <strong>Report</strong>, 24 <strong>FCC</strong> Rcd at 6269, 172; Morgan Stanley <strong>Mobile</strong> Internet <strong>Report</strong>, at 158. <strong>Wireless</strong><br />
service providers are able to customize elements of the platform to promote their own services and content.<br />
Thirteenth <strong>Report</strong>, 24 <strong>FCC</strong> Rcd at 6269, 172. While it makes the operating system available for free, Google has<br />
focused on bringing in revenue through advertising and monetizing user usage information.<br />
436<br />
Morgan Stanley <strong>Mobile</strong> Internet <strong>Report</strong>, at 156. Customers are still subject to the terms and conditions of their<br />
contracts with wireless service providers.<br />
437<br />
Thirteenth <strong>Report</strong>, 24 <strong>FCC</strong> Rcd at 6269, 172; Morgan Stanley <strong>Mobile</strong> Internet <strong>Report</strong>, at 155; Finding Value in<br />
Smartphones, at 9-10.<br />
438 See Finding Value in Smartphones, at 9-10; Morgan Stanley <strong>Mobile</strong> Internet <strong>Report</strong>, at 159.<br />
83
Federal Communications Commission <strong>FCC</strong> 10-81<br />
for the Apple iPhone is the most notable example of such conduct. Of the 67 selected smartphone<br />
launches in 2008-2009, shown in Table C-5 in Appendix C, 32, including some of the most popular (e.g.,<br />
Apple iPhone, Motorola DROID, Palm Pre), were launched on an exclusive basis from one of the four<br />
largest service providers, nearly half of which were by AT&T (see Chart 9).<br />
Chart 9<br />
Exclusive Smartphone Launches by Four Nationwide Service Providers in 2008-2009 439<br />
15<br />
3<br />
AT&T Sprint Nextel T-<strong>Mobile</strong> Verizon<br />
<strong>Wireless</strong><br />
144. In some cases, service providers offer a device exclusively, yet the operating system on<br />
that device is available on other devices available from other operators. For example, the Android-based<br />
Motorola DROID is offered exclusively from Verizon <strong>Wireless</strong>, yet several other Android devices are<br />
available from T-<strong>Mobile</strong> and Sprint Nextel. In addition, with the RIM Blackberry devices, the operating<br />
system and device are bundled and made by the same company, yet several different BlackBerry device<br />
models are available from a range of service providers. In cases where a popular platform is not offered<br />
exclusively but is available from multiple providers, operators may focus on differentiating the features of<br />
a particular device, which the provider does offer exclusively, from the other devices with the same<br />
OS. 440<br />
145. Data-Only Devices. In addition to launching new smartphone devices during 2008 and<br />
2009, several service providers began offering a range of new devices to facilitate mobile broadband<br />
access on computers, including netbook computers with embedded modems, wireless data cards, and<br />
mobile Wi-Fi hotspots. 441 AT&T, Verizon <strong>Wireless</strong>, and Sprint Nextel began offering netbook computers<br />
with embedded mobile broadband modems during 2009. 442 The netbooks have typically been offered at a<br />
slightly lower upfront price than when purchased through an electronics retailer, but with the requirement<br />
that the customer purchase a $39.99-per-month or $59.99-per-month mobile broadband access plan with a<br />
two-year contract. 443 In addition to netbooks, certain service providers began offering mobile Wi-Fi, or<br />
439 Based on Table C-5, Appendix C, infra.<br />
440 Service providers may also focus on competing based on other factors, as described above: price, coverage, and<br />
network quality. See Sections IV.A, Price Rivalry: Developments in <strong>Mobile</strong> Service Pricing Plans and IV.B.1,<br />
Network Coverage and Technology Upgrades, supra. See also Niraj Sheth, AT&T Prepares Network for Battle,<br />
WALL STREET JOURNAL, Mar. 31, 2010, at B1.<br />
441 See Section V.A, Subscribership Levels, infra, for data on the number of mobile wireless subscribers by device<br />
type.<br />
442 AT&T to Offer New Suite of <strong>Mobile</strong> Broadband Netbooks Online and in Stores Nationwide, Press Release,<br />
AT&T, July 20, 2009; Stay Connected in More Places with <strong>Wireless</strong> Access on PC Cards, Mifi, Netbooks and More<br />
from Verizon <strong>Wireless</strong>, Press Release, Verizon <strong>Wireless</strong>, May 14, 2009.<br />
84<br />
5<br />
9
Federal Communications Commission <strong>FCC</strong> 10-81<br />
“Mi-Fi,” devices during 2009, which are credit card-sized, mobile Wi-Fi routers with mobile broadband<br />
wide-area connections that allow up to five Wi-Fi-enabled devices in short range to connect to the<br />
Internet via a Wi-Fi connection. Finally, most of the major mobile wireless service providers offer<br />
wireless data cards that can be attached to a desktop, laptop, or netbook computer through a USB port and<br />
provide mobile broadband connectivity for the computer.<br />
146. In addition, certain mobile wireless service operators provide data connections for<br />
electronic reading devices. 444 These devices, including the Amazon Kindle, are some of the most popular<br />
third-party, data-only devices used by U.S. consumers. Estimates of the number of Kindles sold as of<br />
January 2010 range from 2.5 million to 3 million. 445 Data access for the Kindle was originally provided<br />
by Sprint Nextel. However, in October 2009, Amazon switched to AT&T as the data connection provider<br />
for the Kindle 2. 446<br />
147. Machine-to-Machine (M2M) Devices. Related to service providers’ launch of data-only<br />
devices are their efforts to differentiate themselves by opening their networks to outside devices that they<br />
do not brand or sell directly. In 2008 and 2009, several mobile wireless service providers launched<br />
initiatives that create a streamlined process for data-only mobile computing and M2M devices to be<br />
certified for use on their networks. For instance, in July 2009, Sprint Nextel announced that it had<br />
certified 300 third-party mobile computing and machine-to-machine devices for use on its network<br />
through its Open Device Initiative. 447 In addition, as noted in the Thirteenth <strong>Report</strong>, Verizon <strong>Wireless</strong><br />
began its Open Development Initiative in 2008 following its 2007 announcement to open its network to a<br />
wider array of devices and applications. 448 The first third-party device was certified in July 2008, and<br />
several other devices have since been certified for use on the network and made commercially available,<br />
including data-only, M2M, and telemetry devices, as well as traditional handsets. 449 In April 2009,<br />
(Continued from previous page)<br />
443 Marguerite Reardon, Sprint Sells Netbooks for a Buck, CNET NEWS, July 7, 2009, available at<br />
http://news.cnet.com/8301-1035_3-10280886-94.html. Sprint Nextel and Best Buy sold the HP Mini for 99 cents as<br />
a promotion in July 2009, while the same netbook was offered through Verizon <strong>Wireless</strong> and AT&T for $199. In all<br />
cases, the service providers required the purchase of a two-year service contract. The non-bundled price for the<br />
netbook at that time was $389.99 from Best Buy. Id.<br />
444 See CTIA NOI Comments at 21-22.<br />
445 Douglas MacMillan, Amazon CEO: “Millions” of Kindles Sold, The Tech Beat, BUSINESSWEEK, Jan. 28, 2010,<br />
available at http://www.businessweek.com/the_thread/techbeat/archives/2010/01/amazon_ceo_mill.html.<br />
446 Priya Ganapati, Gadget Lab – Amazon Dumps Sprint for Kindle 2, Embraces AT&T, WIRED, Oct. 23, 2009,<br />
available at http://www.wired.com/gadgetlab/2009/10/sprint-kindle-att/. Analysts believe Amazon switched to<br />
AT&T because AT&T’s network uses the same technology standard (GSM/WCDMA) used in many other countries,<br />
and the per-unit equipment costs for Amazon are lower if the company can produce a single Kindle model that can<br />
be sold in multiple countries. Id (citing Forrester Research analyst, Charles Golvin).<br />
447 th<br />
Sprint Certifies 300 Embedded Device on the Now Network, Press Release, Sprint Nextel, July 23, 2009; Sprint<br />
Nextel NOI Comments at 13-14.<br />
448 See Thirteenth <strong>Report</strong>, 24 <strong>FCC</strong> Rcd at 6267, 168.<br />
449 Verizon Open Network Gets First, Unsexy Device, Press Release, Verizon <strong>Wireless</strong>, July 16, 2008. The device<br />
was a modem that connects to a sensor that dips into large storage containers, such as diesel tanks at construction<br />
sites. See Verizon <strong>Wireless</strong>, Open Development – Latest News Headlines,<br />
https://www22.verizon.com/opendev/media_room.aspx (visited Feb. 19, 2010). Verizon <strong>Wireless</strong> also has certified<br />
three labs for the testing of third party devices. Id; A Look Back at 2008: Open Development at Verizon <strong>Wireless</strong>,<br />
Press Release, Verizon <strong>Wireless</strong>, Jan. 5, 2009; Rajani Baburajan, Verizon <strong>Wireless</strong> Approves Intertek as the Testing<br />
Lab for Open Development Initiative, TMCNET.COM, Oct. 22, 2008, available at<br />
http://www.astricon.net/topics/broadband-mobile/articles/43611-verizon-wireless-approves-intertek-as-testing-labopen.htm.<br />
Some of the devices certified include tablet PCs, routers, SmartGrid equipment, <strong>Mobile</strong> Clinical<br />
Assistants, and the Jitterbug phone. See Verizon <strong>Wireless</strong>, Open Development – Latest News Headlines,<br />
https://www22.verizon.com/opendev/media_room.aspx (visited Feb. 19, 2010).<br />
85
Federal Communications Commission <strong>FCC</strong> 10-81<br />
Verizon <strong>Wireless</strong> released the initial set of technical specifications for devices seeking certification on the<br />
company’s LTE network to be deployed using 700 MHz Band spectrum, 450 and in October 2009, the<br />
company opened its LTE Innovation Center lab for the design and testing of products – such as consumer<br />
electronics, appliances, healthcare devices, and telematics – that would rely on the LTE network for data<br />
connections. 451 While service providers have undertaken programs to allow third-party devices to be used<br />
on their networks, 452 M2M devices still account for a relatively small percentage of all mobile wireless<br />
devices. According to one analyst, 4.3 percent of all mobile network connections in the United States<br />
were used for M2M communications at the end of 2009. 453<br />
4. Differentiation in <strong>Mobile</strong> Data Applications<br />
148. As mentioned above, one way mobile wireless service providers compete is by<br />
differentiating from their rivals the applications that they provide and allow on their networks. 454 Service<br />
providers offer applications both directly and indirectly to mobile customers: directly by having<br />
applications pre-loaded on the devices they sell or through provider-branded, “walled garden” mobile<br />
platforms, and indirectly by allowing applications to be downloaded via web browsers or application<br />
stores. 455 In recent years, there has been a shift from the former to the latter within the mobile wireless<br />
ecosystem. 456 The ability to access a wider variety of applications and content and to browse the web<br />
more openly has become increasing popular with consumers. Recognizing and capitalizing on this trend,<br />
service providers have made their networks more open to third-party applications and have begun selling<br />
devices, smartphones in particular, that allow easier web browsing and the downloading of applications<br />
through web browsers and applications stores. 457<br />
149. Many of the open network initiatives launched by service providers, described above, 458<br />
extend to applications as well as devices, and several mobile service providers have launched websites,<br />
testing labs, developer conferences, and other initiatives or efforts designed to assist application<br />
developers in creating products for the devices and platforms that run on their networks. 459 In addition to<br />
Verizon <strong>Wireless</strong>’s LTE Innovation Center described above, 460 AT&T has created a Developer Program<br />
450 Verizon <strong>Wireless</strong> Drives 4G LTE Innovation with Open Device Development Specifications, Press Release,<br />
Verizon <strong>Wireless</strong>, Apr. 17, 2009.<br />
451 Developers: The Verizon <strong>Wireless</strong> LTE Innovation Center Lab Opens, Press Release, Verizon <strong>Wireless</strong>, Oct. 5,<br />
2009.<br />
452 See CTIA NOI Comments at 55-56.<br />
453 Berg Insight Says Machines Account for 1.4 Percent of <strong>Mobile</strong> Network Connections Worldwide, Press Release,<br />
Berg Insight, Dec. 14, 2009.<br />
454 Applications can be narrowly defined as a software program that runs on a mobile device, or more broadly<br />
defined as any functionality on a mobile device, such as text messaging, voice, etc. Morgan Stanley <strong>Mobile</strong> Internet<br />
<strong>Report</strong>, at 134.<br />
455 CTIA NOI Comments at 28.<br />
456 Morgan Stanley <strong>Mobile</strong> Internet <strong>Report</strong>, at 5, 185, 214-215.<br />
457 See Mercatus NOI Comments at 17. <strong>Mobile</strong> wireless service providers often require that customers comply with<br />
terms and conditions of service, and may approve or reject certain applications developed by third-party application<br />
developers for certain devices or operating systems.<br />
458 See Section IV.B.3, Differentiation in <strong>Mobile</strong> <strong>Wireless</strong> Handsets/Devices, infra.<br />
459 Sprint Nextel NOI Comments at 13; CTIA NOI Comments at 56.<br />
460 The LTE Innovation Center lab and online portal are designed to facilitate the creation of non-traditional devices,<br />
as well as applications for those devices. Verizon <strong>Wireless</strong>, LTE Innovation Center – Frequently Asked Questions,<br />
https://www.lte.vzw.com/NewsResources/FrequentlyAskedQuestions/tabid/5780/Default.aspx#LTETIT1 (visited<br />
Feb. 21, 2010); Developers: the Verizon <strong>Wireless</strong> LTE Innovation Center Lab Opens, Press Release, Verizon<br />
(continued….)<br />
86
Federal Communications Commission <strong>FCC</strong> 10-81<br />
to assist application developers in getting their products to market. 461 In addition, in December 2008,<br />
Sprint Nextel launched an open software platform designed to extend desktop computing and “Web 2.0”<br />
capabilities to mobile devices operating on its mobile broadband network, and has been hosting annual<br />
developer conferences. 462<br />
150. The emergence of web-friendly smartphones and a handful of smartphone operating<br />
systems with application stores have influenced the ability of mobile wireless service providers to<br />
differentiate themselves based on mobile applications. Competing less on the basis of exclusive content<br />
or applications available from a provider-branded platform or walled garden, operators instead are<br />
competing to a greater extent on, among other factors, the devices they sell and the types and quantity of<br />
applications that can be easily accessed on those devices via the web or application stores. 463 According<br />
to CTIA, application stores allow consumers to have a direct role in the functionality of their handsets and<br />
devices. 464<br />
151. Many service providers have imposed certain restrictions on the types of mobile<br />
applications that consumers can access on their networks. For example, AT&T prohibits, as part of the<br />
terms and conditions of its wireless data service plans, the downloading of movies using peer-to-peer file<br />
sharing services because such applications can cause extreme network capacity issues and interference<br />
with the network. 465 In addition, Verizon <strong>Wireless</strong> states that the downloading of applications with its<br />
data plans is subject to certain terms related to protecting the network and maintaining the quality of<br />
service to all users. However, in recent months, providers have announced that certain high-bandwidth,<br />
and in some cases previously-prohibited, applications could be used on their networks. For example,<br />
AT&T reported in August 2009 that Apple had agreed not to allow the iPhone to use AT&T’s 3G<br />
network for VoIP calling without first obtaining AT&T’s consent. 466 However, in October 2009, AT&T<br />
reversed this decision and announced that it would allow iPhone customers to make VoIP calls on its 3G<br />
network. 467 AT&T also announced, in February 2010, that its mobile broadband network would support<br />
the video streaming application, SlingPlayer <strong>Mobile</strong>. 468 In February 2010, Verizon <strong>Wireless</strong> announced<br />
that all of its smartphone customers with a data plan would be able to use their device for unlimited Skype<br />
(Continued from previous page)<br />
<strong>Wireless</strong>, Oct. 5, 2009. As stated in the Thirteenth <strong>Report</strong>, Verizon <strong>Wireless</strong> is the licensee for the 700 MHz Upper<br />
C Block license and is therefore required to allow third-party application developers to develop applications of their<br />
choosing for networks in that band. Thirteenth <strong>Report</strong>, 24 <strong>FCC</strong> Rcd at 6267, 169<br />
461<br />
AT&T, Why AT&T Developer Program?, http://developer.att.com/developer/index.jsp?page=why (visited Feb.<br />
21, 2010).<br />
462 Sprint Launches Open Software Platform at Eighth Annual Application Developer Conference to Help Millions<br />
More Developers Create Products for Sprint Customers, Press Release, Sprint Nextel, Dec. 9, 2008. In October<br />
2009, Sprint outlined the tenets of its open approach: let consumers determine application winners, be easy to do<br />
business with, create a developer’s “garage,” use the proven open Internet model as a guide, and open networks still<br />
require management. Sprint Outlines “Open” Approach at Ninth Annual Developer Conference, Press Release,<br />
Sprint Nextel, Oct. 27, 2009.<br />
463 See T-<strong>Mobile</strong> NOI Comments at 15; Verizon <strong>Wireless</strong> NOI Comments at 127-132; Mercatus NOI Comments at<br />
17.<br />
464 CTIA NOI Comments at 57.<br />
465<br />
AT&T, <strong>Wireless</strong> Data Service Terms and Conditions, http://www.wireless.att.com/cell-phone-service/legal/planterms.jsp<br />
(visited Apr. 9, 2010).<br />
466 Letter from James W. Cicconi, Senior Executive Vice President – External and Legal Affairs, AT&T, to Ruth<br />
Milkman, Chief, <strong>Wireless</strong> Telecommunications Bureau, <strong>FCC</strong>, R-11361, RM-11497 (filed Aug. 21, 2009), at 6.<br />
467 AT&T Extends VoIP to 3G Network for iPhone, Press Release, AT&T, Oct. 6, 2009.<br />
468<br />
AT&T and Sling Media Collaborate on SlingPlayer <strong>Mobile</strong> App for 3G <strong>Mobile</strong> Broadband Network, Press<br />
Release, AT&T, Feb. 4, 2010.<br />
87
VoIP calling. 469<br />
Federal Communications Commission <strong>FCC</strong> 10-81<br />
152. Even in cases where service providers have taken steps to open their networks to a wider<br />
array of third-party applications, mobile operating system/platform developers may control consumer<br />
access to applications, particularly those available through their application stores. We note that the<br />
issues of consumer access to applications and content via mobile wireless Internet access and the<br />
application of nondiscrimination principles to mobile wireless broadband providers are the subject of<br />
another Commission proceeding. 470<br />
469 Verizon <strong>Wireless</strong> and Skype Join Forces to Create a Global <strong>Mobile</strong> Calling Community, Press Release, Verizon<br />
<strong>Wireless</strong>, Feb. 16, 2010.<br />
470 Preserving the Open Internet, Broadband Industry Practices, GN Docket No. 09-191, WC Docket No. 07-52,<br />
Notice of Proposed Rulemaking, 24 <strong>FCC</strong> Rcd 13064 (2009).<br />
88
Federal Communications Commission <strong>FCC</strong> 10-81<br />
V. MOBILE WIRELESS SERVICES: PERFORMANCE<br />
153. The structural and behavioral characteristics of a competitive market are desirable not as<br />
ends in themselves, but rather as a means of bringing tangible benefits to consumers such as lower prices,<br />
higher quality and greater choice of services. To determine if the market is producing these kinds of<br />
positive outcomes, in this section we analyze various metrics including pricing levels and trends,<br />
subscriber growth and penetration, MOUs, innovation and diffusion of services, and quality of service.<br />
154. As in previous reports, the market performance section of this <strong>Report</strong> tracks the pricing<br />
of mobile wireless services using various pricing measures or proxies, including RPM and average<br />
revenue per message. In addition, the market performance section of this <strong>Report</strong> supplements the analysis<br />
of pricing trends with an analysis of measures of subscribership, net adds, output/usage, revenue,<br />
profitability, and the economic impact of mobile wireless service. The analysis of revenue decomposes<br />
total service revenue into three segments: voice, messaging, and other data service revenue. The analysis<br />
of profitability uses measures of profitability that account for cost data that are not reflected in pricing and<br />
revenue data.<br />
A. Subscribership Levels<br />
155. <strong>Mobile</strong> wireless subscribership can be measured and segmented in various ways,<br />
including by type of service and device, by type of pricing plan, by age, and by geographic area. In<br />
looking at the number of subscribers using any type of mobile wireless device, we find that mobile<br />
wireless subscribership increased six percent in 2008 to 277.6 million subscribers, which translates into a<br />
nationwide penetration rates of 90 percent. Other sources indicate that there were 25 million subscribers<br />
to mobile high-speed services (Internet access at speeds over 200 kbps in at least one direction) and 86<br />
million mobile high-speed devices in service in the United States at the end of 2008. Prepaid and<br />
wholesale subscribers as a percentage of all mobile wireless subscribers increased slightly in 2008 from<br />
19.1 percent to 20.2 percent, and increased further in 2009 to 21.5 percent as of mid-2009. <strong>Mobile</strong><br />
wireless penetration rates are high among nearly every age group in United States, but are highest among<br />
young adults (96 percent) and lowest among adults over 65 (89 percent). Finally, we have analyzed subnational<br />
mobile wireless subscribership by estimating penetration rates by EAs. EA penetration rates<br />
range from a low of 68 percent in the La Crosse, WI-MN EA to a high of over 100 percent in six EAs. 471<br />
1. <strong>Mobile</strong> <strong>Wireless</strong> Subscribers by Type of Service<br />
156. <strong>Mobile</strong> wireless subscribership increased in 2008. According to the year-end 2008<br />
NRUF data, we estimate that there were 277.6 million mobile wireless subscribers at the end of 2008, 472<br />
which translates into a nationwide penetration rate of 90 percent. 473 This addition of 14.6 million<br />
subscribers from 263 million at the end of 2007 represents a 5.6 percent growth in the number of<br />
subscribers during 2008. Between 2005 and 2008, mobile wireless service subscribership has increased<br />
over 30 percent. We estimate the number of mobile wireless subscribers using NRUF data. NRUF tracks<br />
the number of phone numbers that have been assigned to mobile wireless devices and therefore serves as<br />
471 See Section V.B, Penetration Rates Across Economic Areas (EAs), infra.<br />
472 Commission estimate, based on preliminary year-end 2008 NRUF filings, adjusted for porting.<br />
473 The nationwide penetration rate is calculated by dividing total mobile wireless subscribers by the total U.S.<br />
population. According to the Bureau of the Census, the combined population of the 50 states, the District of<br />
Columbia, and Puerto Rico as of July 1, 2008 was estimated to be 308.3 million. See U.S. Census Bureau, National<br />
and State Population Estimates: Annual Population Estimates 2000 to 2009,<br />
http://www.census.gov/popest/states/tables/NST-EST2009-01.xls (visited Feb. 24, 2010).<br />
89
Federal Communications Commission <strong>FCC</strong> 10-81<br />
a proxy for mobile wireless subscribers. 474 With the increase in the use of mobile wireless devices –<br />
particularly the number of non-voice devices, such as access devices (e.g., wireless modem cards, mobile<br />
broadband-enabled laptops and netbooks, and mobile Wi-Fi hotspots), e-readers such as the Kindle, and<br />
telematics systems such as OnStar – many consumers have more than one mobile wireless device with a<br />
phone number assigned to it. 475 Therefore, the mobile wireless penetration rate is overstated in terms of<br />
the number of individuals that have at least one mobile wireless device. It is possible for the maximum<br />
national penetration rate to exceed 100 percent, and, indeed, it does currently exceed 100 percent in<br />
certain EAs, as discussed below. 476 The value of the calculated wireless penetration rate as a measure of<br />
subscribership lies more in the change observed from year to year, rather than the absolute value.<br />
Table 14<br />
NRUF and CTIA - Estimated <strong>Mobile</strong> <strong>Wireless</strong> Subscribers 477<br />
Subscribers<br />
(millions)<br />
NRUF CTIA<br />
Increase from<br />
previous year<br />
(millions)<br />
90<br />
Penetration<br />
Rate<br />
Subscribers<br />
(millions)<br />
2001 128.5 n/a 45 % 128.4<br />
2002 141.8 13.3 49 % 140.8<br />
2003 160.6 18.8 54 % 158.7<br />
2004 184.7 24.1 62 % 182.1<br />
2005 213.0 28.3 71 % 207.9<br />
2006 241.8 28.8 80 % 233.0<br />
2007 263.0 21.2 86 % 255.4<br />
2008 277.6 14.6 90 % 270.3<br />
157. CTIA reported similar growth in mobile wireless subscribership during 2008. 478 CTIA’s<br />
estimate for year-end 2008 was 270.3 million subscribers, a 5.8 percent increase over its estimate of 255.3<br />
474 In NRUF, carriers do not report numbers that have been ported to them. Therefore, in order to develop an<br />
estimate of mobile wireless subscribership, it is necessary to adjust the raw NRUF data to account for mobile<br />
wireless subscribers who have transferred their wireline numbers to wireless accounts. Porting adjustments are<br />
developed from the telephone number porting databases managed by Neustar, acting as the administrator of the<br />
regional Number Portability Administration Centers (NPACs). The databases contain all ported numbers currently<br />
in service. They also contain information about when the number was most recently ported (to a carrier other than<br />
the carrier to which the number originally was assigned) or, in some cases, when the database was updated to reflect<br />
a new area code. Trends in Telephone Service, <strong>FCC</strong>, Apr. 2005, at 8-2 – 8-3.<br />
475 See Section III.A, Introduction, supra.<br />
476 See Section V.B, Penetration Rates Across Economic Areas (EAs), infra.<br />
477 Commission estimates based on NRUF data. Robert F. Roche and Lesley O’Neill, CTIA’s <strong>Wireless</strong> Industry<br />
Indices, Semi-Annual Data Survey Results: A Comprehensive <strong>Report</strong> from CTIA Analyzing the U.S. <strong>Wireless</strong><br />
Industry, Year-End 2008 Results, May 2009, at 26-27 (CTIA Year-End 2008 <strong>Wireless</strong> Indices <strong>Report</strong>). See also,<br />
CTIA PN Comments at 42.<br />
478 While the Commission now uses NRUF data as the basis for its estimate of mobile wireless subscribership for<br />
the purposes of this <strong>Report</strong>, we continue to report the CTIA data as a benchmark for comparison because these<br />
figures are readily available and are used widely by industry analysts. A detailed explanation of the differences<br />
between the NRUF data and CTIA’s survey can be found in the Seventh <strong>Report</strong>, 17 <strong>FCC</strong> Rcd at 13004.
Federal Communications Commission <strong>FCC</strong> 10-81<br />
million subscribers as of year-end 2007. 479 According to CTIA, since the end of 2005, mobile wireless<br />
subscribers increased by approximately 30 percent. 480<br />
158. The Commission’s Form 477 data collection provides data on both the number of mobile<br />
wireless high-speed Internet access subscribers and the number of mobile high-speed-capable devices<br />
(those capable of sending or receiving information at speeds greater than 200 kbps in at least one<br />
direction) in service on a nationwide and state-by-state basis. 481 Under the Commission’s revised Form<br />
477 data collection adopted in 2008, terrestrial mobile wireless providers are required to report, on a stateby-state<br />
basis and by speed tier, their number of subscribers whose device and subscription permit them<br />
to access the lawful Internet content of their choice at data rates exceeding 200 kbps in at least one<br />
direction. 482 In addition, mobile broadband providers report, on a state-by-state basis, their number of<br />
devices in service that are capable of sending or receiving information at speeds greater than 200 kbps in<br />
at least one direction, regardless of whether the user subscribes to a mobile Internet access plan. 483 As of<br />
the end of 2008, the Commission reported that there were about 25 million mobile wireless high-speed<br />
Internet access service subscribers and 86 million mobile high-speed capable devices in service in the<br />
United States (see Chart 10). 484 Because reporting practices previously varied among providers to a<br />
largely unknown degree, neither of the December 2008 figures is directly comparable to mobile wireless<br />
high-speed connections reported for earlier dates.<br />
479 See Appendix A, Table A-1, infra.<br />
480 Id.<br />
481 See Table C-6, Appendix C, infra.<br />
482 Development of Nationwide Broadband Data to Evaluate Reasonable and Timely Deployment of Advanced<br />
Services to All Americans, Improvement of <strong>Wireless</strong> Broadband Subscribership Data, and Development of Data on<br />
Interconnected Voice over Internet Protocol (VoIP) Subscribership, WC Docket No. 07-38, <strong>Report</strong> and Order and<br />
Further Notice of Proposed Rulemaking, 23 <strong>FCC</strong> Rcd 9691, 9700, 20 (2008) (Broadband Data Order).<br />
483 Broadband Data Order, 23 <strong>FCC</strong> Rcd at 9703, 23. In addition, mobile wireless broadband providers are<br />
required to report the percentage of the total subscribers in each state that are residential (not billed to a corporate,<br />
business, government, or institutional account). Broadband Data Order, 23 <strong>FCC</strong> Rcd at 9703 24. Terrestrial<br />
mobile wireless providers are not required to submit their number of mobile high-speed Internet access subscribers<br />
broken down on a Census Tract basis, as other broadband providers are required to do. Broadband Data Order, 23<br />
<strong>FCC</strong> Rcd at 9698, 16. We note that the Form 477 mobile wireless broadband subscriber data do not capture those<br />
mobile data users who access the mobile Internet on a casual or a la carte basis but do not have a monthly or longerterm<br />
subscription to a mobile wireless Internet access service.<br />
484 For the year-end 2007 and prior reporting periods, mobile wireless broadband providers were instructed to report<br />
only “the number of subscribers whose mobile device was capable of sending or receiving data at speeds above 200<br />
kbps,” and not whether their subscriptions permitted broadband Internet access. High-Speed Services for Internet<br />
Access: Status as of December 31, 2008, Industry Analysis and Technology Division, Wireline <strong>Competition</strong> Bureau,<br />
<strong>FCC</strong>, Feb. 2010, at 3, available at http://hraunfoss.fcc.gov/edocs_public/attachmatch/DOC-296239A1.pdf.<br />
91
Millions<br />
100<br />
90<br />
80<br />
70<br />
60<br />
50<br />
40<br />
30<br />
20<br />
10<br />
0<br />
Federal Communications Commission <strong>FCC</strong> 10-81<br />
Chart 10<br />
<strong>Mobile</strong> <strong>Wireless</strong> High-Speed Subscribers and Devices in Use 485<br />
<strong>Mobile</strong> <strong>Wireless</strong> High-Speed Capable Devices in Use<br />
<strong>Mobile</strong> <strong>Wireless</strong> High-Speed Subscribers<br />
<strong>Mobile</strong> <strong>Wireless</strong> High-Speed Connections<br />
3<br />
22<br />
2005 2006 2007 2008<br />
159. In addition to the Form 477 data on mobile high-speed Internet access subscribership,<br />
CTIA estimates that, at the end of 2008, there were 228 million data-capable handsets in service, 227<br />
million SMS-capable handsets, 203 million web-enabled handsets, and 7.2 million wireless<br />
laptops/aircards (see Chart 11). 486 In 2009, CTIA began reporting data on the number of smartphones in<br />
use and reported that, as of June 30, 2009, there were 40.7 million smartphones in service. 487 According<br />
to a survey from ChangeWave Research, an estimated 42 percent of U.S. consumers owned a smartphone<br />
in December 2009, up from 32 percent in December 2008 and 21 percent in October 2007 (see Chart 12).<br />
485 Commission estimates based on Form 477 data.<br />
486 CTIA Year-End 2008 <strong>Wireless</strong> Indices <strong>Report</strong>; CTIA PN Comments at 48.<br />
487 CTIA Mid-Year 2009 <strong>Wireless</strong> Indices <strong>Report</strong>.<br />
92<br />
51<br />
86<br />
25
Federal Communications Commission <strong>FCC</strong> 10-81<br />
Chart 11<br />
<strong>Mobile</strong> <strong>Wireless</strong> Subscriber Metrics by Source<br />
<strong>Mobile</strong> <strong>Wireless</strong> Subscribers/Devices (NRUF)<br />
<strong>Mobile</strong> <strong>Wireless</strong> Subscribers (CTIA)<br />
Data-Capable Handsets/Devices (CTIA)<br />
SMS-Capable Devices (CTIA)<br />
Web-Capable Handsets (CTIA)<br />
<strong>Wireless</strong> Laptops, Aircards, Modems (CTIA)<br />
<strong>Mobile</strong> High-Speed Capable Devices (Form 477)<br />
<strong>Mobile</strong> High-Speed Subscribers (Form 477)<br />
Dec., 2009<br />
Sep., 2009<br />
Jun., 2009<br />
Mar., 2009<br />
Dec., 2008<br />
Sep., 2008<br />
Jun., 2008<br />
Mar., 2008<br />
Jan., 2008<br />
Oct., 2007<br />
Jul., 2007<br />
Apr., 2007<br />
Jan., 2007<br />
Oct., 2006<br />
0 50 100 150 200 250 300<br />
7.2<br />
25<br />
93<br />
86<br />
Chart 12<br />
Smartphone Penetration Rates 488<br />
Millions<br />
202.7<br />
228.4<br />
227.2<br />
US Consumers Who Own a Smartphone, October 2006-December 2009<br />
(Percent of Respondents)<br />
17%<br />
16%<br />
15%<br />
21%<br />
20%<br />
23%<br />
22%<br />
27%<br />
34%<br />
32%<br />
32%<br />
37%<br />
39%<br />
42%<br />
0% 5% 10% 15% 20% 25% 30% 35% 40% 45%<br />
488<br />
Paul Carton and Jean Crumrine, New Survey Shows Android OS Roiling the Smartphone Market, ChangeWave<br />
Research, Jan. 4, 2010, available at<br />
http://www.changewaveresearch.com/articles/2010/01/smart_phone_20100104.html.<br />
277.6<br />
270.3
Federal Communications Commission <strong>FCC</strong> 10-81<br />
160. Certain individual service providers have reported data on the number of data-capable<br />
devices in use by their subscribers. For instance, Verizon <strong>Wireless</strong> reported that, at the end of 2009, 15<br />
percent of its postpaid subscribers had a smartphone and 11 percent had a multimedia device. 489 In<br />
addition, AT&T has reported its number of 3G laptop connect cards in service for several quarters, as<br />
shown in Chart 13. The number of laptop cards increased significantly during 2007 and 2008, nearly<br />
doubling from 646,000 at the end of 2007 to 1.2 million at the end of 2008.<br />
Thousands<br />
1,400<br />
1,200<br />
1,000<br />
800<br />
600<br />
400<br />
200<br />
0<br />
310<br />
Chart 13<br />
AT&T 3G Laptop Connect Cards 490<br />
400<br />
517<br />
646<br />
94<br />
772<br />
938<br />
1,124<br />
1,245<br />
1Q07 2Q07 3Q07 4Q07 1Q08 2Q08 3Q08 4Q08<br />
161. In addition to the data on the number of subscribers by type of device, the Pew Internet<br />
& American Life Project (Pew) has released data on the percentage of mobile wireless subscribers who<br />
use different types of mobile wireless services and applications. Pew estimated that 69 percent of<br />
American adults used some type of non-voice, mobile data service in April 2009, up from 58 percent in<br />
December 2007. 491 Among the mobile data services used, Pew estimates that 43 percent of subscribers<br />
used text messaging, 15 percent used e-mail, 14 percent accessed the Internet, 10 percent used instant<br />
messaging, 9 percent used games, 3 percent obtained maps or directions, and 3 percent watched a video.<br />
Texting remains one of the highest use activities, with 74 percent of 18- to 29-year-olds and 51 percent of<br />
30-49 year olds using it on a typical day. 492<br />
162. Analysts at Credit Suisse have also estimated the number of mobile wireless data<br />
subscribers and the mobile wireless data penetration rates (see Chart 14). According to these estimates,<br />
489 Phil Goldstein, Verizon Benefits from Droid Momentum, FIERCEWIRELESS, Jan. 26, 2010, available at<br />
http://www.fiercewireless.com/story/verizon-notches-2-2m-subs-q4/2010-01-26#ixzz0h2Sz4kWV (citing Verizon<br />
CFO Jon Killian). Verizon noted that all of these devices now require a subscription to a data plan. The company<br />
expects to continue to see strong growth in wireless data. Id.<br />
490 AT&T Fourth Quarter 2008 Earnings Release.<br />
491 John Horrigan, <strong>Wireless</strong> Internet Use, More Than Half of Americans – 56% - Have Accessed the Internet<br />
<strong>Wireless</strong>ly on Some Device, Such as a Laptop, Cell Phone, MP3 Player, or Game Console, Pew Internet &<br />
American Life Project, July 2009 (survey conducted March 26 - April 19, 2009), at 21-22.<br />
492 Id.
Federal Communications Commission <strong>FCC</strong> 10-81<br />
there were 180 million mobile data subscribers at the end of 2009, which translates into a penetration rate<br />
of 63 percent. The number of mobile data subscribers has increased 11 percent from 160 million at the<br />
end of 2008, and 22 percent from 140 million at the end of 2007.<br />
Millions of Subscribers<br />
200<br />
180<br />
160<br />
140<br />
120<br />
100<br />
80<br />
60<br />
40<br />
20<br />
0<br />
19.7%<br />
21.6<br />
22.2%<br />
28.4<br />
Chart 14<br />
<strong>Mobile</strong> Data Subscribers and Penetration Rates 493<br />
Data Subscribers<br />
Data Penetration<br />
26.0%<br />
36.6<br />
29.4%<br />
46.7<br />
34.3%<br />
62.5<br />
95<br />
39.5%<br />
82.0<br />
47.4%<br />
110.4<br />
54.9%<br />
140.2<br />
59.3%<br />
2000 2001 2002 2003 2004 2005 2006 2007 2008 2009<br />
2. <strong>Mobile</strong> <strong>Wireless</strong> Subscribers by Pricing Plan<br />
163. As previously noted, prepaid subscribers as a percentage of total subscribers has been<br />
increasing over the past few years. 494 While the majority of subscribers in the United States today are in<br />
postpaid plans, the prepaid and resale/wholesale subscriber segments have been growing much faster than<br />
the postpaid segment. As shown in Chart 15, the postpaid subscribers as a percentage of total wireless<br />
subscribers decreased from 81.9 percent in the second quarter of 2007, to 78.5 percent in the second<br />
quarter of 2009. During this same period, the number of prepaid subscribers increased 37.6 percent,<br />
while the number of wholesale subscribers increased 32.5 percent. 495 As discussed above, increased<br />
prepaid subscribership levels may be a reflection of the lower prices and an increasing number of prepaid<br />
service plans, as well as a response to the economic recession. 496 One analyst has noted that consumers<br />
are purchasing prepaid plans “as a way to cut costs and avoid the lengthy contracts and occasional billing<br />
493 Data provided by Credit Suisse First Boston.<br />
494 See Section V.A.2, <strong>Mobile</strong> <strong>Wireless</strong> Subscribers by Pricing Plan, supra.<br />
495 US <strong>Wireless</strong> 411 3Q09, at 4.<br />
496 See Section V.A.2, <strong>Mobile</strong> <strong>Wireless</strong> Subscribers by Pricing Plan, supra.<br />
160.4<br />
63.1%<br />
180.0<br />
70%<br />
60%<br />
50%<br />
40%<br />
30%<br />
20%<br />
10%<br />
0%<br />
Data Penetration Rate
Federal Communications Commission <strong>FCC</strong> 10-81<br />
surprises that come with traditional cellphone plans.” 497 The increase in wholesale/reseller subscribers<br />
may indicate that the use of devices that use mobile wireless data service on a wholesale basis, such as ereaders,<br />
is growing as well. While these devices as a percentage of all mobile wireless devices is<br />
growing, the overall ARPU for these subscribers is often substantially lower than for postpaid<br />
subscribers. For example, average revenue per Kindle device is estimated at $2 per month. 498<br />
Subscribers Breakout<br />
per Sanford Berstein Research<br />
300,000<br />
250,000<br />
200,000<br />
150,000<br />
100,000<br />
50,000<br />
0<br />
Chart 15<br />
<strong>Mobile</strong> <strong>Wireless</strong> Subscribers by Type of Pricing Plan 499<br />
Q2 2006 Q4 2006 Q2 2007 Q4 2007 Q2 2008 Q4 2008 Q2 2009<br />
Total subscribers 213,340 225,934 236,431 247,793 255,124 262,467 269,337<br />
Total reseller subs 15,371 17,078 18,343 20,473 21,527 22,838 24,307<br />
Total pre-paid subs 19,007 21,785 24,423 26,887 28,700 30,248 33,595<br />
Total post-paid subs 178,963 187,070 193,666 200,434 204,898 209,380 211,435<br />
164. <strong>Mobile</strong> wireless service providers also offer family plans that give discounted rates for<br />
households with multiple handsets as a way to increase penetration on a household basis. 500 Most family<br />
plans include one line at an average of $45 per month for voice service for the first line and additional<br />
lines for approximately $10 per month per line, for up to four more lines. 501 As shown in Chart 16, Credit<br />
Suisse estimates that 67 percent of all mobile wireless subscribers were part of a family plan in 2009, up<br />
497 Jenna Wortham, More Customers Give Up the Cellphone Contract, NEW YORK TIMES, Feb. 20, 1009, available<br />
at http://www.nytimes.com/2009/02/21/technology/21prepaid.html.<br />
498 Lynnette Luna, Kindle May Generate $2 ARPU, But Is It Really That Bad?, FIERCE BROADBAND WIRELESS, May<br />
28, 2009, available at http://www.fiercebroadbandwireless.com/story/arpu/2009-05-28.<br />
499 US <strong>Wireless</strong> 411 3Q09, at 4.<br />
500 See Section IV.A, Price Rivalry: Developments in <strong>Mobile</strong> Service Pricing Plans, supra.<br />
501<br />
John C. Hodulik, et al., MetroPCS - Growth Stays Strong, +CF on the Way, UBS, UBS Investment Research,<br />
May 8, 2009, at 2.<br />
96
Federal Communications Commission <strong>FCC</strong> 10-81<br />
from just 35 percent in 2004. 502 In addition, Nielsen estimates that the 66 percent of all non-corporate<br />
wireless subscribers were family plan subscribers in the third quarter of 2009, up from 63 percent in the<br />
third quarter of 2008. 503 Family plan subscriber uptake is typical during non-promotional periods 504<br />
when, for example, couples or parents upgrade their handsets or children come of age. Family plans<br />
allow service providers to increase their subscribership levels to other members of the same household or<br />
family, such as children, grandparents, or other relatives. According to one analyst, in the second quarter<br />
of 2008, Sprint Nextel and T-<strong>Mobile</strong> made an effort to restructure their family plan pricing options in<br />
order to align them with their unlimited plans and to allow family groups to realize some of the value of<br />
unlimited plans. 505 Verizon <strong>Wireless</strong> and AT&T have not adopted this approach, requiring unlimited plan<br />
customers to take individual plans. 506<br />
Subscribers (Thousands)<br />
250000<br />
200000<br />
150000<br />
100000<br />
50000<br />
0<br />
Chart 16<br />
Family Plan Subscribers and Penetration of Postpaid Base 507<br />
0%<br />
Discounted Subs<br />
Regular Subs<br />
FP Penetration<br />
2%<br />
12%<br />
35%<br />
43%<br />
97<br />
51%<br />
63%<br />
65% 67%<br />
2001 2002 2003 2004 2005 2006 2007 2008 2009<br />
3. <strong>Mobile</strong> <strong>Wireless</strong> Subscribers by Age<br />
165. Morgan Stanley provides data on mobile wireless subscribership by age (see Chart 17).<br />
While penetration rates are high at nearly every age group, they are highest among 18- to 24-year-olds,<br />
where penetration has reached 96 percent. The only age group with a penetration rate less than 90 percent<br />
is the 65 and over age range, where penetration is 89 percent.<br />
502 In addition, UBS estimates that roughly two-thirds of AT&T’s and Verizon <strong>Wireless</strong>’s postpaid customers<br />
subscribe to family plans. John C. Hodulik, et al., Telecommunications - Prepaid Will Set the Pace in <strong>Wireless</strong>,<br />
UBS, UBS Investment Research, Mar. 23, 2009, at 6.<br />
503 The Nielsen Company: <strong>Mobile</strong> Insights 2009.<br />
504 Non-promotional periods occur when service providers are not running promotions, such as during the holiday<br />
season.<br />
505 Jonathan Epstein and Stephen Douglas, <strong>Wireless</strong> Service and Handset Pricing Analysis – Sprint-T-<strong>Mobile</strong> Reset<br />
Family Plans, iPhone Subsidy Not Huge in Context, Bank of America, June 19, 2008.<br />
506 Id.<br />
507 Data provided by Credit Suisse First Boston.<br />
0.7<br />
0.6<br />
0.5<br />
0.4<br />
0.3<br />
0.2<br />
0.1<br />
0<br />
FP Penetration Rate
100%<br />
90%<br />
80%<br />
70%<br />
60%<br />
50%<br />
96%<br />
95%<br />
Federal Communications Commission <strong>FCC</strong> 10-81<br />
Chart 17<br />
<strong>Mobile</strong> <strong>Wireless</strong> Penetration by Age 508<br />
94%<br />
95%<br />
93%<br />
98<br />
92%<br />
93%<br />
90%<br />
Average<br />
Penetration 92%<br />
18 to 24 25 to 29 30 to 34 35 to 39 40 to 44 45 to 49 50 to 54 55 to 59 60 to 64 65 and<br />
over<br />
Age<br />
166. In addition, a recent Pew study provides data on mobile wireless subscribership among<br />
teenagers (see Table 15). According to the Pew study, which reports data as of September 2009, age is an<br />
important factor in predicting mobile wireless subscribership. As the following table indicates, there is a<br />
substantial difference in mobile wireless penetration between 12-year-olds and 17-year-olds. 509 Among<br />
the 12- to 17-year-old age group as a whole, mobile wireless subscribership has increased from 45 percent<br />
in 2004 to 75 percent in 2009. 510 Pew found that, beyond age, there were differences in mobile wireless<br />
subscribership among demographic groups of teens, such as gender and race/ethnicity. 511 The one area<br />
where penetration rates varied was household income; 59 percent of teens in households earning less than<br />
$30,000 per year had a cell phone, as compared to more than 75 percent of teens from families with<br />
higher incomes. 512<br />
508 Data provided by Morgan Stanley Research, Morgan Stanley AlphaWise.<br />
509<br />
Amanda Lenhart, et al., Social Media & <strong>Mobile</strong> Internet Use Among Teens and Young Adults, Pew Internet &<br />
American Life Project, Feb. 3, 2010, at 9.<br />
510 Id.<br />
511 Id.<br />
512 Id.<br />
91%<br />
89%
Federal Communications Commission <strong>FCC</strong> 10-81<br />
Table 15<br />
<strong>Mobile</strong> <strong>Wireless</strong> Penetration Among Teenagers<br />
Age Penetration Rate<br />
12 yrs 58%<br />
13 yrs 73%<br />
14 yrs 76%<br />
15 yrs 79%<br />
16 yrs 82%<br />
17 yrs 83%<br />
167. The Pew study also indicates that young adults are more likely than older adults to own a<br />
cell phone, with 93 percent of adults in the 18- to 29-year-old age group owning a cell phone compared to<br />
83 percent of all adults over 18 years old owning a cell phone. 513 This compares to penetration figures in<br />
2004 of 71 percent and 65 percent, respectively, for these age groups. 514<br />
168. Also, one marketing analyst has reported that advanced mobile technology that enables<br />
web browsing, e-mail and use of applications is more frequently adopted by users in the 18 to 24 and 25<br />
to 44 year old age groups than by older users. 515 The smartphone ownership rate of mobile users by age<br />
group is shown in Table 16 below. This marketing analyst also reports that adoption of SMS is highest<br />
among users in the 18 to 24 year old age group, but that this adoption is reaching a plateau (see Table 16<br />
below). In addition, older age groups continue to show an increase in SMS adoption. 516<br />
Table 16<br />
Smartphone and SMS Adoption by Age Group 517<br />
Age Range Smartphone Ownership Rate SMS Adoption Rate<br />
18 to 24 year-olds 29% 83%<br />
25 to 44 year-olds 29% 65%<br />
45 to 54 year-olds 24% 52%<br />
55 to 64 year-olds 13% 33%<br />
B. Penetration Rates Across Economic Areas (EAs)<br />
169. To analyze mobile wireless subscribership across geographic areas, we have estimated<br />
mobile wireless penetration rates in the EAs of the United States using NRUF data. 518 As discussed<br />
513 Id. at 17.<br />
514 Id.<br />
515 Marketing Sherpa, Consumer Behavior in the <strong>Mobile</strong> Channel: 4 Trends Marketers Should Note, Dec. 22, 2009,<br />
available at https://www.marketingsherpa.com/sample.cfm?ident=31481.<br />
516 Id.<br />
517<br />
Marketing Sherpa, Consumer Behavior in the <strong>Mobile</strong> Channel: 4 Trends Marketers Should Note, Dec. 22, 2009,<br />
available at https://www.marketingsherpa.com/sample.cfm?ident=31481.<br />
518<br />
NRUF data is collected on a small area basis and thus allows the Commission to compare the spread of mobile<br />
wireless subscribership across different areas within the United States. NRUF data is collected by the area code and<br />
prefix (NXX) level for each provider, which enables the Commission to approximate the number of subscribers that<br />
each provider has in each of the approximately 18,000 rate centers in the country. Rate center boundaries generally<br />
(continued….)<br />
99
Federal Communications Commission <strong>FCC</strong> 10-81<br />
above, we use EAs as the geographic unit for measuring the level of concentration in the mobile wireless<br />
services industry in order to maintain continuity with past <strong>Report</strong>s 519 and ensure that we do not<br />
compromise the confidential information found in the NRUF data. 520<br />
170. Regional penetration rates for the 172 EAs covering all 50 states, as of December 2008,<br />
can be seen in Appendix C, Table C-3. In addition, a map showing regional penetration rates by EAs can<br />
be found in Appendix D. 521 Several EAs – including Detroit, MI; Birmingham, AL; Farmington, NM;<br />
Washington, DC; San Diego, CA; and Beaumont, TX – had penetration rates exceeding 100 percent,<br />
which is likely due to subscribers having more than one device. 522 In 53 of the 160 EAs, the penetration<br />
rates exceeded 90 percent, up from 24 EAs at the end of 2007. Only two EAs, with a combined<br />
population of just 415,000, had penetration rates under 70 percent. The EA with the lowest reported<br />
penetration rate was La Crosse, WI-MN (EA 105), with a penetration rate of 68 percent. 523 The EA with<br />
the lowest population density, Anchorage, AK (EA 171), had a penetration rate of 86 percent, while the<br />
EA with the highest density, Tampa-St. Petersburg-Clearwater, FL (EA 34), had a penetration rate of 92<br />
(Continued from previous page)<br />
do not coincide with county boundaries. However, for purposes of geographical analysis, rate centers (including<br />
those that cross county boundaries) can be associated with the county that contains the (usually) centralized<br />
geographic point for that rate center. Counties, for which population and other data exist, can be aggregated<br />
together and associated with several larger geographic areas based on counties, such as EAs and Cellular Market<br />
Areas (CMAs). Aggregation to larger geographic areas reduces the level of inaccuracy inherent in combining noncoterminous<br />
areas such as rate center areas and counties.<br />
519 There are 172 EAs, each of which is an aggregation of counties. Each EA is made up of one or more economic<br />
nodes and the surrounding areas that are economically related to the node. The main factor used in determining the<br />
economic relationship between the two areas is commuting patterns, so that each EA includes, as far as possible, the<br />
place of work and the place of residence of its labor force. See Kenneth P. Johnson, Redefinition of the EA<br />
Economic Areas, SURVEY OF CURRENT BUSINESS, Feb. 1995, at 75 (Redefinition of the EA). For its spectrum<br />
auctions, the Commission has defined four additional EAs: Guam and the Northern Mariana Islands (173); Puerto<br />
Rico and the U.S. Virgin Islands (174); American Samoa (175); and Gulf of Mexico (176). See <strong>FCC</strong>, <strong>FCC</strong><br />
Auctions: Maps, available at http://wireless.fcc.gov/auctions/data/maps.html (visited Dec. 15, 2008). In November<br />
2004, the Bureau of Economic Analysis released updated definitions of EAs; however, for consistency, we use the<br />
previous release of definitions. See New BEA Economic Areas For 2004, Bureau of Economic Analysis, Nov. 17,<br />
2004. As noted above, the Commission typically has used smaller geographic areas, such as CMAs, for analyzing<br />
mobile wireless transactions. See, e.g., Sprint Nextel-Clearwire Order, 23 <strong>FCC</strong> Rcd at 17591, 51-52; Verizon<br />
<strong>Wireless</strong>-Alltel Order, 23 <strong>FCC</strong> Rcd at 17472-73, 52.<br />
520 <strong>Wireless</strong> providers have considerable discretion in how they assign telephone numbers across the rate centers in<br />
their operating areas and, according to one analyst, assign numbers so as to minimize the access charges paid to<br />
local wireline companies. See Linda Mutschler et al., <strong>Wireless</strong> Number Portability, Merrill Lynch, Equity Research,<br />
Jan 9, 2003, at 8 (“For wireless operators, the standard practice is to aggregate phone numbers within the same area<br />
code onto the same or several rate centers, whose physical locations would result in the least amount of access<br />
charges paid to ILECs. Therefore, in each market, wireless operators are present in only a small number of rate<br />
centers. According to our industry sources, this percentage is probably below 20%, and could be meaningfully<br />
lower than 20%”). Therefore, a mobile wireless subscriber can be assigned a phone number associated with a rate<br />
center that is a significant distance away from the subscriber’s place of residence or usage, but generally still in the<br />
same EA. See Linda Mutschler, et al., US <strong>Wireless</strong> Services: <strong>Wireless</strong> Number Portability – Breaking Rules, Merrill<br />
Lynch, Equity Research, Feb. 28, 2003, at 3 (“Once the NPA-NXX (i.e., 212-449) is assigned to the wireless carrier,<br />
the carrier may select any one of its NPA-NXXs when allocating that number to a particular subscriber. Therefore,<br />
with regard to wireless, the subscriber’s physical location is not necessarily a requirement in determining the phone<br />
number assignment – which is very different from how wireline numbers are assigned”).<br />
521 See Map D-30, Appendix D, infra.<br />
522 We excluded New Orleans, LA-MS (EA 83) from this analysis due to what we believe to be an aberration with<br />
the statistics. See Appendix C, Table C-3: Economic Area Penetration Rates, note 1 infra.<br />
523<br />
In seven EAs, the penetration rate could not be reported for confidentiality reasons because the number of<br />
competing providers in the EA is less than four.<br />
100
Federal Communications Commission <strong>FCC</strong> 10-81<br />
percent. As previously stated, based on an analysis of NRUF data, the national penetration rate at the end<br />
of 2008 was 90 percent.<br />
C. Net Adds/Subscriber Growth<br />
1. Industry-Wide Subscriber Net Adds<br />
171. As the wireless industry has reached penetration levels nearing 90 percent of the US<br />
population, the growth of net new subscribers has decelerated. <strong>Mobile</strong> wireless service providers are<br />
reporting that net adds have slowed on both a quarterly and an annual basis.<br />
172. According to data from Bernstein Research, “2008 marked a new low in the wireless<br />
industry’s net additions and percentage growth.” 524 Total mobile wireless subscriber growth in 2008 was<br />
5.9 percent, down from 9.8 percent growth in 2007 and 12 percent growth in 2006. 525 According to the<br />
Commission’s NRUF data, there were 14.6 million mobile wireless subscriber net adds in 2008,<br />
compared to 21.2 million in 2007, which represents a 31 percent decline. 526 Quarterly net adds are shown<br />
in Chart 18 below.<br />
Chart 18<br />
Total <strong>Mobile</strong> <strong>Wireless</strong> Subscriber Quarterly Net Adds 527<br />
Millions<br />
8<br />
7<br />
6<br />
5<br />
4<br />
3<br />
2<br />
1<br />
0<br />
5.7<br />
4.7<br />
5<br />
6.5<br />
3.8<br />
101<br />
3.2<br />
3.5<br />
4.1 4<br />
Q1 2007 Q2 2007 Q3 2007 Q4 2007 Q1 2008 Q2 2008 Q3 2008 Q4 2008 Q1 2009 Q2 2009<br />
2. <strong>Mobile</strong> <strong>Wireless</strong> Net Adds by Pricing Plan<br />
173. In recent years, net adds have varied by type of pricing plan, as shown in Chart 19 below.<br />
The number of unlimited prepaid plan net adds has grown in recent quarters, both in terms of absolute<br />
numbers and as a percentage of total net adds. During the fourth quarter of 2007, unlimited prepaid<br />
subscribers accounted for 10.5 percent of total net adds. This figure grew to 21.1 percent in the fourth<br />
524 A Recipe for Disaster.<br />
525 Id.<br />
526 See Table 14, supra.<br />
527 Data provided by Bernstein Research.<br />
2.9
Federal Communications Commission <strong>FCC</strong> 10-81<br />
quarter of 2008 and to 50.1 percent in the second quarter of 2009. The number of unlimited prepaid net<br />
adds increased from 708,000 in the fourth quarter of 2007 to 854,000 in the fourth quarter of 2008, and to<br />
1.5 million in the second quarter of 2009. This trend may be a reflection of the lower prices and increased<br />
number of offerings for prepaid plans, as discussed above, and of the economic recession, which may<br />
have moved consumers to seek lower-priced, higher-value mobile wireless service with no long term<br />
contracts. 528<br />
Millions of Subscribers<br />
8.0<br />
7.0<br />
6.0<br />
5.0<br />
4.0<br />
3.0<br />
2.0<br />
1.0<br />
0.0<br />
5.7<br />
4.7<br />
Chart 19<br />
<strong>Mobile</strong> <strong>Wireless</strong> Net Adds by Pricing Plan 529<br />
5.3<br />
6.7<br />
3.9<br />
102<br />
3.4<br />
Wholesale (exc. Tracfone, VM)<br />
Traditional prepaid<br />
Unlimited prepaid<br />
Postpaid<br />
3.6<br />
4.0 4.0<br />
1Q07 2Q07 3Q07 4Q07 1Q08 2Q08 3Q08 4Q08 1Q09 2Q09<br />
174. The number of postpaid subscribers continued to grow during 2008 and the first half of<br />
2009, but at a slower rate than in previous years. There were 3.3 million postpaid net adds in the fourth<br />
quarter of 2007 versus just 2 million in the fourth quarter of 2008, a 39 percent decrease. Postpaid net<br />
adds also dropped from 2.4 million in the second quarter of 2008 to 1.2 million in the second quarter of<br />
2009. Postpaid net adds accounted for 70.6 percent of total net adds in the second quarter of 2008, versus<br />
just 43 percent in the second quarter of 2009, when unlimited prepaid dominated the net add mix.<br />
3. <strong>Mobile</strong> <strong>Wireless</strong> Net Adds by Service Provider<br />
175. As shown in Chart 20 below, the net subscriber additions have not been evenly<br />
distributed across all service providers. During 2009, AT&T and Verizon <strong>Wireless</strong> gained 8.1 million<br />
and 6 million net adds, respectively, while T-<strong>Mobile</strong> had just over 1 million net adds and Sprint Nextel<br />
had a 205,000 net subscriber loss. MetroPCS and Leap, while smaller than the top four providers,<br />
increased their subscriber bases by about 24 and 29 percent, respectively during 2009.<br />
528 See Section IV.A, Price Rivalry: Developments in <strong>Mobile</strong> Service Pricing Plans, supra.<br />
529 US <strong>Wireless</strong> 411 2Q09, at 4.<br />
2.9
Net Subscriber Additions (Thousands)<br />
10000<br />
8000<br />
6000<br />
4000<br />
2000<br />
0<br />
-2000<br />
-4000<br />
-6000<br />
8111<br />
7715<br />
7423<br />
7114<br />
6785 6740<br />
5974<br />
5558<br />
AT&T<br />
Verizon <strong>Wireless</strong><br />
Federal Communications Commission <strong>FCC</strong> 10-81<br />
Chart 20<br />
Net Adds by Service Provider 530<br />
3894<br />
830<br />
Sprint Nextel<br />
-205<br />
-4667<br />
3657<br />
3442<br />
2973<br />
1032<br />
1576<br />
722 870<br />
307<br />
74<br />
1404<br />
1022<br />
941<br />
981<br />
1273<br />
1109<br />
635<br />
561<br />
T-<strong>Mobile</strong><br />
103<br />
Alltel<br />
-181<br />
US Cellular<br />
-55<br />
2006<br />
2007<br />
2008<br />
2009<br />
MetroPCS<br />
Leap <strong>Wireless</strong><br />
D. Output and Usage Levels<br />
1. <strong>Mobile</strong> Voice<br />
176. As a measure of mobile voice usage, CTIA reports the average MOUs for six-month<br />
periods. 531 As shown in Chart 21 below, MOUs declined eight percent during 2008, from 769 for the<br />
second half of 2007 to 708 during the second half of 2008. When comparing the first half of 2008 with<br />
the first half of 2009, MOUs declined two percent from 751 to 735. The trend of declining voice minutes<br />
may be due to substitution by mobile messaging services. 532<br />
177. Chart 22 below shows the MOUs for the four nationwide mobile wireless service<br />
providers, and it reveals that T-<strong>Mobile</strong>’s MOU levels have been consistently higher than those of the<br />
other three providers but have been flat over the past several quarters. The average voice MOUs of<br />
530 See Company 2009 SEC 10-K Filings (2009 subscriber data); Table C-4, Appendix C (2008-2007 subscriber<br />
data); Thirteenth <strong>Report</strong>, 24 <strong>FCC</strong> Rcd at 6320-21, Table A-4 (2006 subscriber data); Twelfth <strong>Report</strong>, 23 <strong>FCC</strong> Rcd at<br />
2361-62, Table A-4 (2005 subscriber data). This research includes wholesale subscribers. Pro-forma calculations<br />
were made to account for mergers and show only “organic” net adds generated independent of mergers. Verizon<br />
<strong>Wireless</strong>’s reported net additions for 2009, including the subscribers acquired from Alltel, totaled 19,193,000.<br />
Verizon Communications, Inc., SEC Form 10-K (Portions of Verizon Annual <strong>Report</strong> to Shareholders), filed Feb. 26,<br />
2010, available at http://www.sec.gov/Archives/edgar/data/732712/000119312510041685/dex13.htm.<br />
531 CTIA aggregates all of the service providers’ MOUs from January 1 through June 30, or from July 1 through<br />
December 31, then divides by the average number of subscribers for the period, and then divides by six. See<br />
Thirteenth <strong>Report</strong>, 24 <strong>FCC</strong> Rcd at 6284, note 582.<br />
532 Simon Flannery, et al., 3Q Trend Tracker – Signs of Life for Telecom, Morgan Stanley, Morgan Stanley Research<br />
– North America, Dec. 4, 2009, at 60 (“MOU and text messages per user combined is rising as a result of the<br />
explosion in texts per subscriber each month. We believe that some of what would be voice minutes are now being<br />
replaced by text messages”). <strong>Mobile</strong> messaging traffic is discussed in Section V.D.2, <strong>Mobile</strong> Messaging, infra.
Federal Communications Commission <strong>FCC</strong> 10-81<br />
AT&T and Sprint Nextel subscribers have been declining slightly, while those of Verizon <strong>Wireless</strong> have<br />
increased slightly.<br />
Average MOUs Per Subscriber Per Month<br />
Monthly Minutes Minutes of of Use Use<br />
900<br />
800<br />
700<br />
600<br />
500<br />
400<br />
300<br />
200<br />
100<br />
0<br />
1,200<br />
1,150<br />
1,100<br />
1,050<br />
1,000<br />
950<br />
900<br />
850<br />
800<br />
750<br />
700<br />
650<br />
600<br />
623<br />
Chart 21<br />
Average MOUs Per Subscriber Per Month 533<br />
708 692<br />
714<br />
104<br />
734<br />
769 751<br />
Jun-05 Dec-05 Jun-06 Dec-06 Jun-07 Dec-07 Jun-08 Dec-08 Jun-09<br />
708<br />
Chart 22<br />
MOUs Per Subscriber: Four Nationwide Service Providers 534<br />
1,150<br />
960 960 960<br />
760<br />
1,123<br />
736<br />
1,170<br />
800 809 817<br />
800 809 817<br />
533 CTIA Mid-Year 2009 <strong>Wireless</strong> Indices <strong>Report</strong>.<br />
534 US <strong>Wireless</strong> 411 2Q09.<br />
743<br />
1,130<br />
1,150<br />
900 900<br />
826<br />
834<br />
711 703<br />
Q2 2007 Q4 2007 Q2 2008 Q4 2008 Q2 2009<br />
Verizon <strong>Wireless</strong> AT&T <strong>Wireless</strong><br />
Sprint Nextel T-<strong>Mobile</strong> USA<br />
735
2. <strong>Mobile</strong> Messaging<br />
Federal Communications Commission <strong>FCC</strong> 10-81<br />
178. <strong>Mobile</strong> text messaging traffic has grown significantly over the past two years. According<br />
to data reported by CTIA, which is presented in Chart 23, text messaging volumes grew 177 percent from<br />
a total of 363 billion in 2007 to just over 1 trillion in 2008. 535 In 2009, monthly text messaging traffic<br />
increased 92 percent from 385 billion messages during the first half of 2008 to 740.3 billion messages in<br />
the first half of 2009. 536 <strong>Mobile</strong> wireless subscribers are also sending more photo, video, and other<br />
multimedia messages (MMS) with their devices. As shown in Chart 24 below, CTIA reports that a total<br />
of 14.9 billion MMS messages were sent during 2008, a 144 percent increase from the 6.1 billion sent<br />
during 2007. MMS messages sent during the first half of 2009 rose 83 percent to 10.3 billion MMS<br />
messages from the 5.6 billion sent during the first half of 2008. 537<br />
179. We can estimate the number of text and MMS messages per subscriber per month by<br />
dividing the total number of messages by the average number of mobile wireless subscribers, while<br />
recognizing that not all mobile wireless subscriber use messaging services. As shown in Table 17, the<br />
average mobile wireless subscriber sent 388 text messages and 5.8 MMS messages per month during the<br />
second half of 2008. This represents a 169 percent increase in the average number of text messages per<br />
subscriber per month from the second half of 2007, and a 152 percent increase in the average number of<br />
MMS messages per subscriber per month during the same period.<br />
Billions<br />
900.0<br />
800.0<br />
700.0<br />
600.0<br />
500.0<br />
400.0<br />
300.0<br />
200.0<br />
100.0<br />
0.0<br />
Chart 23<br />
Monthly Text Messaging Traffic Volumes 538<br />
32.5 48.7 64.8<br />
93.8<br />
105<br />
147.0<br />
215.6<br />
385.0<br />
620.2<br />
740.3<br />
Jun-05 Dec-05 Jun-06 Dec-06 Jun-07 Dec-07 Jun-08 Dec-08 Jun-09<br />
Six-Month Period Ending<br />
535 CTIA Mid-Year 2009 <strong>Wireless</strong> Indices <strong>Report</strong>, at 201; CTIA PN Comments at 43.<br />
536 CTIA Mid-Year 2009 <strong>Wireless</strong> Indices <strong>Report</strong>, at 201.<br />
537 Id. at 203.<br />
538 CTIA Mid-Year 2009 <strong>Wireless</strong> Indices <strong>Report</strong>.
Billions<br />
12.0<br />
10.0<br />
8.0<br />
6.0<br />
4.0<br />
2.0<br />
0.0<br />
0.3<br />
0.8<br />
Federal Communications Commission <strong>FCC</strong> 10-81<br />
Chart 24<br />
Six-Month MMS Traffic Volumes 539<br />
1.1<br />
1.6<br />
106<br />
2.6<br />
3.5<br />
5.6<br />
9.3<br />
10.3<br />
Jun-05 Dec-05 Jun-06 Dec-06 Jun-07 Dec-07 Jun-08 Dec-08 Jun-09<br />
Six-Month Period Ending<br />
Table 17<br />
Average Text and MMS Messages Per Subscriber Per Month 540<br />
Six-Month<br />
Period<br />
Ending<br />
Average Text<br />
Messages<br />
Per User<br />
Per Month<br />
Average MMS<br />
Messages<br />
Per User<br />
Per Month<br />
Jun-05 29 0.3<br />
Dec-05 40 0.7<br />
Jun-06 51 0.9<br />
Dec-06 69 1.2<br />
Jun-07 103 1.8<br />
Dec-07 144 2.3<br />
Jun-08 248 3.6<br />
Dec-08 388 5.8<br />
Jun-09 451 6.3<br />
180. A major driver of growth in mobile messaging is intensive use among the teen segment.<br />
The results of a study conducted by Nielsen Media, presented in Chart 25 below, reveal that consumption<br />
of text messaging services among teenagers in the United States is extraordinarily high. 541 This study<br />
indicates that teenagers send an average of 3,146 messages per month, which is the equivalent of more<br />
than ten messages every hour that they are not sleeping or in school. In the under-12 age group, Nielsen<br />
estimates that children are sending an average of 1,146 messages per month. As discussed above, the<br />
average price per text messages has been declining as more subscribers have shifted to unlimited or<br />
539<br />
CTIA Mid-Year 2009 <strong>Wireless</strong> Indices <strong>Report</strong>; CTIA PN Comments at 43.<br />
540<br />
CTIA Mid-Year 2009 <strong>Wireless</strong> Indices <strong>Report</strong>; Commission estimates.<br />
541<br />
Roger Entner, Under-aged Texting: Usage and Actual Cost, NIELSEN WIRE, Jan. 27, 2010, available at<br />
http://blog.nielsen.com/nielsenwire/online_mobile/under-aged-texting-usage-and-actual-cost/.
ucket messaging plans. 542<br />
Federal Communications Commission <strong>FCC</strong> 10-81<br />
Chart 25<br />
Use of Texting by Children and Teenagers 543<br />
3. <strong>Mobile</strong> Data Traffic (Non-Messaging)<br />
181. Unlike voice and text messaging services, CTIA does not currently provide usage data for<br />
non-messaging mobile data and mobile Internet traffic. Therefore, we base our discussion of mobile data<br />
usage on information from other sources. Estimates from other sources indicate that mobile data usage is<br />
growing significantly both in the United States and globally. 544 For instance, Cisco estimates that global<br />
mobile data traffic grew 157 percent from 33 terabytes in 2008 to 85 terabytes in 2009. 545 In addition,<br />
Nokia Siemens Networks estimates that mobile data traffic grew fourfold during 2008. 546 Data traffic is<br />
542 According to Nielsen, only a small percentage of people who text message do so on a pay-as-you-go basis at the<br />
20 cent per message rate. Nielsen estimates that the average price per text message dropped 47 percent between the<br />
first quarter 2008 and third quarter 2009 and is now around 1 cent. Nielsen also argues that text messaging is<br />
offered in a similar way to newspapers and magazines in the United States. Newspaper and magazine subscriptions<br />
are offered at a 40 to 80 percent discount off the newsstand price, while text messaging subscriptions offer messages<br />
at a 95 percent discount off the a la carte rate. Roger Entner, Under-aged Texting: Usage and Actual Cost, NIELSEN<br />
WIRE, Jan. 27, 2010, available at http://blog.nielsen.com/nielsenwire/online_mobile/under-aged-texting-usage-andactual-cost/.<br />
543 Reproduced from: Roger Entner, Under-aged Texting: Usage and Actual Cost, NIELSEN WIRE, Jan. 27, 2010,<br />
available at http://blog.nielsen.com/nielsenwire/online_mobile/under-aged-texting-usage-and-actual-cost/.<br />
544 Cisco, Cisco Virtual Networking Index: Global <strong>Mobile</strong> Data Traffic Forecast Update, 2009-2014,<br />
http://www.cisco.com/en/US/solutions/collateral/ns341/ns525/ns537/ns705/ns827/white_paper_c11-520862.html<br />
(visited Mar. 15, 2010); Informa Industry Outlook, available at http://io2010.informatm.com/; <strong>Mobile</strong> Opportunity,<br />
The <strong>Mobile</strong> Data Apocalypse and What It Means to You, http://mobileopportunity.blogspot.com/2009/11/mobiledata-apocalypse-and-what-it.html<br />
(visited Apr. 28, 2010).<br />
545 Cisco Visual Networking Index: Global <strong>Mobile</strong> Traffic Forecast Update, Cisco, Jan. 29, 2009, at 6.<br />
546 Nick Wood, <strong>Mobile</strong> Data Traffic Growth 10 Times Faster Than Fixed Over Next Five Years – Nokia Siemens,<br />
TOTAL TELECOM, Sept. 7, 2009, available at http://www.totaltele.com/view.aspx?ID=448681 (citing Mika<br />
Vehvilainen, CTO, Nokia Siemens Networks); Dan Warren, Reality Check: All Roads Lead to LTE (Eventually),<br />
RCR WIRELESS, Sept. 29, 2009, available at<br />
http://www.rcrwireless.com/ARTICLE/20090929/FRONTPAGE/909289993/reality-check-all-roads-lead-to-lteeventually.<br />
107
Federal Communications Commission <strong>FCC</strong> 10-81<br />
increasing with the growth in smartphone subscribers, who use the Internet and send and receive content<br />
more than average mobile wireless users. 547<br />
182. Data on mobile data usage by type of device for the second half of 2009, based on<br />
estimates from Validas, is shown in Chart 26 below. 548 Traditional handset users had the lowest levels of<br />
data usage, averaging 25 MB per month. Data traffic from smartphone users was significantly higher,<br />
ranging from 54 MB per month for Blackberry users to 275 MB per month for iPhone users. <strong>Mobile</strong><br />
wireless subscribers using laptops and aircards/wireless modem cards had the highest data usage,<br />
averaging 1.4 GB per month. The Validas study also shows that the majority of Blackberry and other<br />
smartphone users had relatively low data levels of data usage, generating between 0 and 50 MB per<br />
month on average. Only 16 percent of iPhone users, on the other hand, generated between 0 and 50 MB<br />
per month; and 52 percent generated between 100 and 500 MB per month. Meanwhile, 59 percent of<br />
laptop/aircard users transferred over 500 MB of data traffic per month. As a point of comparison, Bank<br />
of America/Merrill Lynch estimated that, in leading mobile broadband markets around the world, percapita<br />
mobile data usage was around 100 MB per month as of December 2009. 549<br />
Average MBs per Month<br />
1600<br />
1400<br />
1200<br />
1000<br />
800<br />
600<br />
400<br />
200<br />
0<br />
Chart 26<br />
Estimated <strong>Mobile</strong> Data Usage by Type of Device 550<br />
25<br />
Traditional<br />
Handset<br />
54<br />
108<br />
150<br />
Blackberry Other<br />
Smartphone<br />
275<br />
1416<br />
iPhone Laptop/Aircard<br />
183. Individual mobile wireless service providers, such as AT&T and Verizon <strong>Wireless</strong>,<br />
confirm that their customers are migrating from voice-centric services to data-centric services. AT&T<br />
reported that its network experienced an 18-fold increase in mobile data traffic during the two-and-a-half<br />
547 Simon Flannery, et al., 3Q Trend Tracker – Signs of Life for Telecom, Morgan Stanley, Morgan Stanley Research<br />
– North America, Dec. 4, 2009, at 59. See Section VII.B.2, <strong>Mobile</strong> Applications, infra.<br />
548 Validas LLC, http://www.myvalidas.com/industryanalytics.aspx. Validas is a company that offers web-based<br />
wireless bill analysis and optimization services to consumers and businesses. See Jeff Blyskal, iPhones Hog Much<br />
More Data Than Other Smartphones, Consumer <strong>Report</strong>s Electronics Blog, Feb. 10, 2010, available at<br />
http://blogs.consumerreports.org/electronics/2010/02/iphone-data-usage-smart-phones-smartphones-blackberry-mbnetwork-att-carrier-istress.html.<br />
549 See Finding Value in Smartphones, at 28.<br />
550 Validas LLC, http://www.myvalidas.com/industryanalytics.aspx.
Federal Communications Commission <strong>FCC</strong> 10-81<br />
years after the iPhone was introduced, and that its mobile data traffic increased over four times between<br />
June 2008 and June 2009. 551 AT&T has also reported that its mobile data traffic increased 5000 percent<br />
from mid-2006 to mid-2009. 552 According to AT&T, three percent of its smartphone users are<br />
responsible for 40 percent of total data usage. 553 According to one analyst, the average iPhone user<br />
consumes five to ten times more bandwidth on a monthly basis than the average smartphone customer, 554<br />
while another analyst estimates that the average iPhone user consumes twice the monthly bandwidth of<br />
the average smartphone user and five to seven times the monthly bandwidth of the average wireless voice<br />
subscriber. 555 Verizon <strong>Wireless</strong> reported that the main drivers of data traffic growth on its network during<br />
the fourth quarter of 2008 were broadband access plans, e-mail, and messaging. 556<br />
184. According to a report by Allot Communications, mobile data traffic during the second<br />
quarter of 2009 was generated by the following applications: web browsing (35 percent), HTTP<br />
streaming (23 percent), messaging (21 percent), web downloads (16 percent) and other applications (5<br />
percent). 557<br />
E. Pricing Levels, Changes, and Trends<br />
1. Price Indicators<br />
185. Wide variations in the non-price terms and features of wireless service plans make it<br />
difficult to characterize the price of mobile wireless service; consequently, it is difficult to identify<br />
sources of information that track mobile wireless service prices in a comprehensive manner. 558 As<br />
documented in previous reports, there is ample evidence of a sharp decline in mobile wireless prices in<br />
the period since the launch of PCS service. However, after posting across-the-board declines in 2007, 559<br />
some indicators of mobile wireless service pricing showed price decreases in 2008, while others showed<br />
increases. 560 The price of mobile wireless service, as measured by the CPI for mobile services, decreased.<br />
However, unit prices of voice and messaging services show different trends. Voice RPM increased<br />
slightly in 2008, while the average revenue per text message decreased. It is possible that these trends are<br />
interrelated, as consumers substitute messaging for voice on some occasions. We note that it is not<br />
possible to calculate unit prices for non-messaging mobile data services because the industry does not<br />
report comparable mobile data revenue and traffic figures.<br />
186. Cellular CPI. One source of price information is the cellular telephone services’<br />
551 <strong>Mobile</strong>Data: Traffic Jam Ahead?, Bank of America/Merrill Lynch, Feb. 2, 2010. AT&T indicated that the<br />
Pandora and XM streaming music applications on the iPhone are two of the highest traffic drivers. Id.<br />
552 Presentation by Kris Rinne, Senior VP, AT&T, <strong>FCC</strong> National Broadband Plan Workshop: Technology-<strong>Wireless</strong>,<br />
Aug. 13, 2009; Michelle Megna, AT&T Faces 5000 Percent Surge in Traffic, INTERNETNEWS.COM, Oct. 8, 2009, at<br />
http://www.internetnews.com/mobility/article.php/3843001 (citing AT&T CTO John Donovan).<br />
553 Tom Kaneshige, AT&T IPhone Users Irate at Idea of Usage-Based Pricing, PCWORLD, Dec. 14, 2009.<br />
554 Id. (citing Nielsen’s Roger Entner, who told USA TODAY that the typical iPhone customer uses 400 MBs of<br />
wireless capacity per month, whereas the typical smartphone customer consumes about 40 to 80 MBs per month).<br />
555 Id. (citing Bernstein Research analyst Toni Sacconaghi).<br />
556<br />
Verizon Q4 2008 Earnings Conference Call, Jan. 27. 2009 (citing Doreen Toben, Verizon Executive Vice<br />
President and CFO).<br />
557 Allot Communications, Global <strong>Mobile</strong> Broadband Traffic <strong>Report</strong>, July 2009.<br />
558 See Fourth <strong>Report</strong>, 14 <strong>FCC</strong> Rcd at 10164-10165.<br />
559 See Thirteenth <strong>Report</strong>, 24 <strong>FCC</strong> Rcd at 6274-6276, 188-193.<br />
560 Only indicators of the price of mobile wireless services are discussed in this section. See Section VII.B.1,<br />
<strong>Mobile</strong> <strong>Wireless</strong> Handsets/Devices and Operating Systems, infra, for information on handset and device pricing.<br />
109
Federal Communications Commission <strong>FCC</strong> 10-81<br />
component of the CPI (Cellular CPI) produced by the United States Department of Labor’s Bureau of<br />
Labor Statistics (BLS). 561 Cellular CPI data is published on a national basis only. 562 From 2007 to 2008,<br />
the annual Cellular CPI decreased by approximately 0.2 percent while the overall CPI increased by 3.8<br />
percent. The Cellular CPI has declined 35.8 percent since December 1997, when BLS began tracking<br />
it. 563<br />
Table 18<br />
Change in CPI 564<br />
CPI Cellular CPI All Telephone CPI Local Telephone CPI Long Distance<br />
Telephone CPI<br />
Index Annual Index Annual Index Annual Index Annual Index Annual<br />
Value Change Value Change Value Change Value Change Value Change<br />
Dec 1997 100 100 100 100 100<br />
1998 101.6 95.1 100.7 101.6 100.5<br />
1999 103.8 2.2% 84.9 -10.7% 100.1 -0.6% 103.4 1.8% 98.2 -2.3%<br />
2000 107.3 3.4% 76.0 -10.5% 98.5 -1.6% 107.7 4.1% 91.8 -6.5%<br />
2001 110.3 2.8% 68.1 -10.4% 99.3 0.8% 113.3 5.2% 88.8 -3.3%<br />
2002 112.1 1.6% 67.4 -1.0% 99.7 0.4% 118.5 4.5% 84.9 -4.4%<br />
2003 114.6 2.3% 66.8 -0.9% 98.3 -1.4% 123.3 4.1% 77.8 -8.4%<br />
2004 117.7 2.7% 66.2 -0.9% 95.8 -2.5% 125.1 1.5% 70.9 -8.9%<br />
2005 121.7 3.4% 65.0 -1.8% 94.9 -0.9% 128.5 2.7% 67.5 -4.8%<br />
2006 125.6 3.2% 64.6 -0.6% 95.8 0.9% 131.1 2.1% 68.3 1.2%<br />
2007 129.2 2.8% 64.4 -0.3% 98.247 2.6% 136.2 3.8% 71.453 4.6%<br />
2008 134.1 3.8% 64.2 -0.2% 100.451 2.2% 141.0 3.6% 74.846 4.7%<br />
Dec 1997<br />
to 2008 34.1% -35.8% 0.5% 41.0% -25.2%<br />
561 See Table 18, infra. The CPI is a measure of the average change over time in the prices paid by urban consumers<br />
for a fixed market basket of consumer goods and services. The basket of goods includes over 200 categories<br />
including items such as food and beverages, housing, apparel, transportation, medical care, recreation, education,<br />
and communications. The CPI provides a way for consumers to compare what the market basket of goods and<br />
services costs this month with what the same market basket cost a month or a year ago. Starting in December of<br />
1997, this basket of goods included a category for cellular/wireless telephone services. All CPI figures discussed in<br />
this paragraph were taken from BLS databases found on the BLS Internet site available at http://www.bls.gov. The<br />
index used in this analysis, the CPI for All Urban Consumers (CPI-U), represents about 87 percent of the total U.S.<br />
population. Bureau of Labor Statistics, Consumer Price Index: Frequently Asked Questions, available at<br />
http://www.bls.gov/cpi/cpifaq.htm (visited Aug. 26, 2008). While the CPI-U is urban-oriented, it does include<br />
expenditure patterns of some of the rural population. Transcript, at 59. Information submitted by companies for the<br />
CPI is provided on a voluntary basis. Transcript, at 53.<br />
562 Transcript, at 50. The Cellular CPI includes charges from all telephone companies that supply “cellular<br />
telephone services,” which are defined as “domestic personal consumer phone services where the telephone<br />
instrument is portable and it sends/receives signals for calls by wireless transmission.” This measure does not<br />
include business calls, telephone equipment rentals, portable radios, and pagers. Bureau of Labor Statistics, How<br />
BLS Measures Price Change for Cellular Telephone Service in the Consumer Price Index, available at<br />
http://www.bls.gov/cpi/cpifactc.html (visited Sept. 26, 2008).<br />
563 From December 1997 compared to the annual index.<br />
564<br />
Bureau of Labor Statistics. All CPI figures were taken from BLS databases found on the BLS Internet site<br />
available at http://www.bls.gov.<br />
110
Federal Communications Commission <strong>FCC</strong> 10-81<br />
187. Blended Revenue per Minute. Alternatively, some analysts believe RPM is a good proxy<br />
for mobile pricing. 565 This metric is calculated by dividing an estimate of average monthly revenue per<br />
subscriber (often referred to as average revenue per unit, or “ARPU”) by average monthly minutes of use<br />
for the equivalent period. 566<br />
188. Using estimates of industry-wide ARPU 567 and MOUs from CTIA, shown in Table 19 we<br />
estimate that RPM was $0.07 in December of 2008, which is an increase of nine percent from the estimate<br />
of $0.06 in December of 2007. Prior to 2008, RPM had fallen almost steadily from $0.47 in December of<br />
1994 to $0.06 in December of 2007, which represented a decline of 87 percent. 568 The estimate of $0.07<br />
in December 2008 represents a decline of 85 percent from the December 1994 peak and a decline of<br />
approximately 30 percent since December 2003.<br />
189. Revenue per Voice Minute. As the contribution of data services to total revenues has<br />
increased, RPM has become an increasingly inaccurate measure of the pricing of mobile voice service.<br />
Until the last four years, revenues from wireless data services were a relatively insignificant portion of the<br />
average wireless subscriber’s bill. However, in recent years, data has become an ever increasing portion<br />
of that bill. Since the Twelfth <strong>Report</strong>, this <strong>Report</strong> has included a revised version of RPM, “Voice RPM,”<br />
which excludes that portion of ARPU generated by data services. 569 While RPM and Voice RPM have<br />
been mostly identical over time, in absolute value and trend, in 2004 they began to diverge somewhat,<br />
with the decline in Voice RPM steeper, and its absolute value slightly lower, than RPM.<br />
190. We estimate that Voice RPM was $0.05 in December of 2008. As indicated in Table 11,<br />
although this estimate of Voice RPM is unchanged from the previous year due to rounding, the absolute<br />
value of Voice RPM in December of 2008 represents an increase of two percent from its absolute value in<br />
December of 2007. Thus, Voice RPM also registered a slight increase from 2007 to 2008, but the rise in<br />
Voice RPM was much less steep than the rise in RPM. As a result, the gap between RPM and Voice<br />
RPM widened still further in 2008.<br />
565 See US <strong>Wireless</strong> Matrix 1Q07, at 52.<br />
566 The average monthly minutes of use figure reflects voice minutes used and captured as network traffic, rather<br />
than minutes paid for as part of a monthly service package.<br />
567 Note that this version of ARPU is CTIA’s “Average Local Monthly Bill” (“ALMB”), which does not include toll<br />
or roaming revenues where they are not priced into a calling plan. See infra note 585.<br />
568 See Table 19, infra; Thirteenth <strong>Report</strong>, 24 <strong>FCC</strong> Rcd at 6275-76, 192.<br />
569 To generate Voice RPM, we subtracted wireless data revenues, derived from CTIA’s survey, from ALMB (we<br />
assumed this was the same percentage of wireless data revenues in CTIA’s measure of total service revenues), then<br />
we divided that number by CTIA’s average MOUs per month. See also Twelfth <strong>Report</strong>, 23 <strong>FCC</strong> Rcd at 2323-24, <br />
200.<br />
111
Average<br />
Local<br />
Monthly<br />
Bill<br />
Minutes of<br />
Use Per<br />
Month<br />
Average<br />
Revenue Per<br />
Minute<br />
Federal Communications Commission <strong>FCC</strong> 10-81<br />
Table 19<br />
Average Revenue Per Minute 570<br />
Annual<br />
Change in<br />
Overall<br />
RPM<br />
<strong>Wireless</strong> Data<br />
Revenue as<br />
Percent of Total<br />
Service<br />
112<br />
Revenues<br />
Average Local<br />
Monthly Bill<br />
(excl. Data<br />
Revenues)<br />
Average<br />
Revenue Per<br />
Voice Minute<br />
Annual<br />
Change in<br />
Voice<br />
RPM<br />
1993 $61.49 140 $0.44 n/a $61.49 $0.44<br />
1994 $56.21 119 $0.47 8% n/a $56.21 $0.47 8%<br />
1995 $51.00 119 $0.43 -9% n/a $51.00 $0.43 -9%<br />
1996 $47.70 125 $0.38 -11% n/a $47.70 $0.38 -11%<br />
1997 $42.78 117 $0.37 -4% n/a $42.78 $0.37 -4%<br />
1998 $39.43 136 $0.29 -21% n/a $39.43 $0.29 -21%<br />
1999 $41.24 185 $0.22 -23% 0.2% $41.16 $0.22 -23%<br />
2000 $45.27 255 $0.18 -20% 0.4% $45.09 $0.18 -21%<br />
2001 $47.37 380 $0.12 -30% 0.9% $46.94 $0.12 -30%<br />
2002 $48.40 427 $0.11 -9% 1.2% $47.82 $0.11 -9%<br />
2003 $49.91 507 $0.10 -13% 2.5% $48.66 $0.10 -14%<br />
2004 $50.64 584 $0.09 -12% 4.8% $48.21 $0.08 -14%<br />
2005 $49.98 708 $0.07 -19% 8.3% $45.83 $0.06 -22%<br />
2006 $50.56 714 $0.07 0% 13.5% $43.73 $0.06 -5%<br />
2007 $49.79 769 $0.06 -9% 17.9% $40.88 $0.05 -13%<br />
2008 $50.07 708 $0.07 9% 23.2% $38.45 $0.05 2%<br />
191. Revenue per Text Message. A proxy for the pricing of text messages can be derived by<br />
dividing an estimate of text messaging revenues by an estimate of the number of text messages sent<br />
during a specified period.<br />
192. The average price for text messages continued to decline in 2008. Based on CTIA<br />
estimates of annual text messaging revenues and the annual volume of text messaging traffic, we estimate<br />
that the price per text message dropped to $0.011 in 2008, down from $0.025 in 2007 and $0.036 in<br />
2006. 571 This is likely the result of customers purchasing bucket or unlimited texting plans rather than<br />
paying for texting on a per-use basis. In such cases, the marginal price of sending an additional text<br />
message is nearly zero, and usage has increased dramatically. The average price of text messaging is<br />
decreasing, while text messaging ARPU is increasing, as discussed below.<br />
570 Dec 2008 CTIA Survey, at 115 (Chart 28: Data ARPU as a Percentage of Total ARPU), and at 191-92 (Table 79:<br />
Approximate Billable MOUs per Subscriber). See Appendix C, Table C-1 (ARPU). Data covers the last six months<br />
of each year. For purposes of this presentation in this table, RPM is rounded to two decimal places, but RPM<br />
change is based on absolute RPM.<br />
571 See CTIA Year-End 2008 <strong>Wireless</strong> Indices <strong>Report</strong>, at 115, 198-200.
Federal Communications Commission <strong>FCC</strong> 10-81<br />
Table 20<br />
Average Revenue Per Text Message 572<br />
Year Text Traffic Average Messages Text Messaging Average Revenue<br />
Volume<br />
Per User Revenues Per Text Message<br />
2005 81,208,225,767 476 $2,991,666,181 $0.037<br />
2006 158,648,546,798 779 $5,672,984,205 $0.036<br />
2007 362,549,531,172 1,572 $8,976,574,961 $0.025<br />
2008 1,005,144,143,136 4,183 $11,355,095,991 $0.011<br />
193. Broadband Price Unit Metrics. In contrast to mobile voice service, there is no single<br />
common unit of measure analogous to MOUs that can be used to track pricing trends for mobile<br />
broadband services on an aggregated basis. Although it is possible, using CTIA data, to derive average<br />
revenue per user for non-messaging data services (the numerator), CTIA does not report MB usage (the<br />
denominator). Therefore, we do not include a unit price measure for this increasingly important wireless<br />
service segment.<br />
2. Wholesale Pricing<br />
194. Resellers and MVNOs purchase minutes at wholesale prices from facilities-based mobile<br />
service providers. Contractual agreements between mobile network operators and resellers or MVNOs<br />
for wholesale prices differ among MVNOs because they depend upon rates that each MVNO negotiates<br />
with facilities based providers. These negotiated rates are generally not publicly available so it is difficult<br />
to track wholesale pricing in the mobile wireless sector in a comprehensive manner.<br />
195. One analyst has estimated the pricing for Sprint Nextel’s wholesale deal with Virgin<br />
<strong>Mobile</strong> USA prior to Sprint Nextel’s acquisition of Virgin <strong>Mobile</strong>. According to this analyst, Virgin paid<br />
Sprint Nextel approximately $0.02 per minute. 573 The analyst states that the pricing was almost all<br />
variable, and Sprint Nextel’s price structure was based on a tiered pricing system in which the company<br />
paid a certain per-minute rate for the first level of MOUs and then a lower per-minute rate for the next<br />
tiered level of usage, with the rate dropping for only the incremental minutes at the next tier level rather<br />
than for all the minutes used. Based on Virgin <strong>Mobile</strong>’s retail pricing structure, the analyst estimated that<br />
Sprint Nextel received about 25 percent of the revenues generated by a Virgin <strong>Mobile</strong> customer. 574<br />
3. Intercarrier Roaming Rates and Revenue<br />
196. Intercarrier roaming rates are set by contractual agreements that are confidential, and<br />
particular rates vary across agreements depending on what service providers have negotiated. However,<br />
an aggregate proxy for intercarrier roaming rates – average roaming revenue per minute of use of roaming<br />
service – can be derived from dividing reported annual roaming revenues by reported annual roaming<br />
minutes of use.<br />
197. CTIA reported that “outcollect” roaming revenues 575 for the entire mobile wireless<br />
industry decreased to $3.739 billion in 2008 from $3.742 billion in 2007. 576 This is consistent with the<br />
trend over the past decade where annual roaming revenues have fluctuated between $3.5 billion and $4.2<br />
billion. However, during this same period total industry revenues increased dramatically, from $40<br />
572 CTIA Year-End 2008 <strong>Wireless</strong> Indices <strong>Report</strong>, at 115, 198-200; Commission estimates.<br />
573 Slumdog Millionaires, at 22.<br />
574 Id. at 24.<br />
575 CTIA’s measure is one of “outcollect” roamer traffic revenues; in other words, the revenues generated by<br />
roamers in the providers’ markets. CTIA Year-End 2008 <strong>Wireless</strong> Indices <strong>Report</strong>, at 92-99.<br />
576 See also Table C-1, Appendix C, infra.<br />
113
Federal Communications Commission <strong>FCC</strong> 10-81<br />
billion to $148.1 billion. Therefore, the contribution of roaming revenues to total service revenues<br />
continued its decline: from 4.1 percent in 2004, to 3.3 percent in 2005, to 2.8 percent in 2006, to 2.7<br />
percent in 2007, and to 2.5 percent in 2008, which is down from over ten percent in 1999. 577<br />
198. Similarly, while reported annual roaming traffic has grown significantly during this same<br />
period, roaming minutes as a percentage of total minutes has dropped significantly. Roaming minutes<br />
increased from 13 billion minutes in 1999 to 121.4 billion minutes in 2008. Yet this growth has been<br />
much slower than overall traffic growth, which increased from 147.7 billion minutes to 2.2 trillion<br />
minutes. Therefore, roaming as a percentage of overall traffic has decreased from 8.8 percent in 1999 to<br />
5.5 percent in 2008, a nearly 40 percent relative decline. 578<br />
199. As reported in Table 21 below, average roaming revenue per minute has progressively<br />
declined over time, from just over 30 cents per minute in 1999 to between three and four cents per minute<br />
in recent years.<br />
Roaming<br />
Revenues<br />
(in $000s)<br />
Percent<br />
Change<br />
Table 21<br />
Roaming Revenues and Rates 579<br />
Percent of<br />
Total<br />
Service<br />
Revenues<br />
114<br />
Roaming<br />
MOUs<br />
Percent<br />
of Total<br />
MOUs<br />
Average<br />
Roaming<br />
Revenue<br />
Per Minute 580<br />
1999 $4,085,417 16.71% 10.2% 13,038,555,635 8.8% $0.31<br />
2000 $3,882,981 (4.96%) 7.4% 20,852,266,390 8.1% $0.19<br />
2001 $3,752,826 (3.35%) 5.7% 27,811,907,410 6.1% $0.13<br />
2002 $3,895,511 3.80% 5.1% 43,846,470,833 7.1% $0.09<br />
2003 $3,766,267 (3.32%) 4.3% 56,828,973,359 6.8% $0.07<br />
2004 $4,210,330 11.79% 4.1% 71,440,711,110 6.5% $0.06<br />
2005 $3,786,332 (10.07%) 3.3% 115,008,338,841 7.7% $0.03<br />
2006 $3,494,294 (7.71%) 2.8% 91,991,570,460 5.1% $0.04<br />
2007 $3,742,015 7.09% 2.7% 107,615,715,912 5.1% $0.03<br />
2008 $3,739,274 (0.07%) 2.5% 121,438,208,469 5.5% $0.03<br />
F. Revenue<br />
200. Revenues for the U.S. mobile wireless industry have increased each year between 2004<br />
and 2008, although the annual growth rate for industry revenues has been in decline since 2007 (see Chart<br />
27). In 2008, mobile wireless service providers generated approximately $150.6 billion in revenues, up<br />
6.9 percent from 2007. For the first half of 2009, industry revenue totaled $75.8 billion, a 4.3 percent<br />
increase over the first half of 2008. 581<br />
577 Id. This is for the entire 12-month period.<br />
578 CTIA Year-End 2008 <strong>Wireless</strong> Indices <strong>Report</strong>, at 185.<br />
579 CTIA Year-End 2008 <strong>Wireless</strong> Indices <strong>Report</strong>.<br />
580 This is a blended average.<br />
581 CTIA Mid-Year 2009 <strong>Wireless</strong> Indices <strong>Report</strong>.
U.S. <strong>Wireless</strong> Industry Total<br />
Revenues (Billions)<br />
180<br />
160<br />
140<br />
120<br />
100<br />
80<br />
60<br />
40<br />
20<br />
0<br />
104.2<br />
Federal Communications Commission <strong>FCC</strong> 10-81<br />
Chart 27<br />
<strong>Wireless</strong> Industry Service Revenues 582<br />
115.3<br />
201. We examine mobile wireless service revenues by dividing CTIA’s estimates of service<br />
revenue into three segments: voice, messaging, and other data services. 583 As shown in Chart 28, all three<br />
revenue categories – voice, text messaging, and other data revenues – continued to grow in 2008.<br />
However, the share of messaging and other data revenue in total service revenue rose while the share of<br />
voice revenue declined proportionally.<br />
582 CTIA Year-End 2008 <strong>Wireless</strong> Indices <strong>Report</strong>.<br />
127.1<br />
583 We estimate voice revenue by excluding CTIA’s estimate of wireless data revenue from its estimate of total<br />
service revenue. The estimate of text messaging revenue, which includes instant messaging and SMS, is collected<br />
and reported as a separate revenue category by CTIA. We estimate other data revenue by excluding CTIA’s<br />
estimate of text messaging revenue from its estimate of wireless data revenue. Other data revenue includes Internet<br />
access and various other data services such as games, ringtones, application downloads and multimedia messaging<br />
services. We estimate ARPU for voice, messaging and other data services by dividing each of the revenue estimates<br />
by CTIA’s yearly estimate for total subscribers.<br />
115<br />
140.9<br />
150.6<br />
2004 2005 2006 2007 2008<br />
18%<br />
16%<br />
14%<br />
12%<br />
10%<br />
8%<br />
6%<br />
4%<br />
2%<br />
0%<br />
Annual Revenue Growth (% Change)
Total Industry Revenues ($ Billion)<br />
$160<br />
$130<br />
$100<br />
$70<br />
$40<br />
$104.25<br />
$3.28<br />
$1.32<br />
$99.64<br />
Federal Communications Commission <strong>FCC</strong> 10-81<br />
Chart 28<br />
Total <strong>Mobile</strong> <strong>Wireless</strong> Industry Revenues 584<br />
$115.26<br />
$5.59<br />
$2.99<br />
$106.68<br />
116<br />
$127.11<br />
$9.54<br />
$5.67<br />
$111.89<br />
$140.90<br />
$14.25<br />
$8.98<br />
$150.60<br />
$20.97<br />
$11.36<br />
$117.67 $118.28<br />
2004 2005 2006 2007 2008<br />
Voice Revenues Text Messaging Revenues Other Data Revenues (MMS,Web Access, Downloads, Ringtones,etc)<br />
202. ARPU is a financial metric widely-used in analyzing the mobile wireless industry. In<br />
1999, one estimate of ARPU used by CTIA, average local monthly bill (ALMB), began increasing<br />
following a decade of declines, rising to $50.64 in December 2004, a 28 percent increase from the low of<br />
$39.43 in 1998 (see Table 19). 585 Since the 2004 peak, ALMB has fluctuated around the $50 level, and<br />
closed 2008 at $50.07. As seen in Table 19, declining industry-wide voice ARPU (as measured by<br />
ALMB excluding data revenues) continued to be offset by growth in data ARPU. According to CTIA, in<br />
the last half of 2008, data revenues amounted to 23.2 percent of total wireless service revenues, compared<br />
to 17.9 percent a year earlier.<br />
203. CTIA’s alternate measure of ARPU shows that both messaging and other data ARPU<br />
rose steadily between 2004 and 2008, while voice ARPU steadily declined during the same period (see<br />
Chart 29). In 2008, the increases in messaging ARPU and other data ARPU just offset the decline in<br />
voice ARPU, leaving blended ARPU virtually unchanged from 2007 at slightly more than $47.00. Of this<br />
total, voice ARPU represented nearly $37.00, with messaging ARPU at $3.55 and other data ARPU at<br />
$6.56. Messaging ARPU and other data ARPU represented a proportionally larger share of blended<br />
ARPU in 2008 as compared with 2007.<br />
584<br />
CTIA Year-End 2008 <strong>Wireless</strong> Indices <strong>Report</strong>.<br />
585<br />
There are different ways of calculating ARPU. The measure used here and shown in Table 19 is CTIA’s<br />
“average local monthly bill,” which does not include toll or roaming revenues (CTIA calls it “the equivalent of<br />
‘local ARPU’”). Robert F. Roche and John-Paul Edgette, CTIA’s <strong>Wireless</strong> Industry Indices, Semi-Annual Data<br />
Survey Results: A Comprehensive <strong>Report</strong> from CTIA Analyzing the U.S. <strong>Wireless</strong> Industry, Year-End 2007 Results,<br />
May 2008, at 183 (CTIA Year-End 2007 <strong>Wireless</strong> Indices <strong>Report</strong>). CTIA defines an alternative measure of ARPU,<br />
which includes roaming revenues but not toll revenue. For a comparison between these two measures, see Id. at<br />
185.
Monthly Average Revenue Per User (ARPU)<br />
$55.0<br />
$50.0<br />
$45.0<br />
$40.0<br />
$35.0<br />
$30.0<br />
$25.0<br />
$20.0<br />
$49.41<br />
$1.55<br />
$0.63<br />
$47.23<br />
Federal Communications Commission <strong>FCC</strong> 10-81<br />
Chart 29<br />
Monthly ARPU by Type of Service 586<br />
$47.72<br />
$2.31<br />
$1.24<br />
$44.17<br />
117<br />
$46.82 $47.08 $47.09<br />
$3.52<br />
$2.09<br />
$41.21<br />
$4.76<br />
$3.00<br />
$39.32<br />
$6.56<br />
$3.55<br />
$36.98<br />
2004 2005 2006 2007 2008<br />
Voice ARPU Text ARPU Other Data ARPU<br />
204. The growth in data revenue as a percentage of total revenue for the individual four<br />
nationwide service providers is shown in Chart 30. While data revenues have been growing at all four<br />
providers, data accounts for a larger percentage of total revenue at Verizon <strong>Wireless</strong> and AT&T. In the<br />
second quarter of 2009, data revenue accounted for close to 30 percent of Verizon <strong>Wireless</strong>’s and<br />
AT&T’s total revenue, as compared to 25 percent at Sprint Nextel and 21 percent at T-<strong>Mobile</strong>.<br />
586 CTIA Year-End 2008 <strong>Wireless</strong> Indices <strong>Report</strong>; Commission analysis. Voice ARPU calculation includes toll<br />
revenues.
Percent of Total Revenues<br />
35%<br />
30%<br />
25%<br />
20%<br />
15%<br />
10%<br />
Federal Communications Commission <strong>FCC</strong> 10-81<br />
Chart 30<br />
<strong>Wireless</strong> Data Revenue as a Percentage of Total Revenue 587<br />
Q2 06 Q4 06 Q2 07 Q4 07 Q2 08 Q4 08 Q2 09<br />
Verizon <strong>Wireless</strong> 12.6% 15.3% 18.4% 20.7% 24.0% 26.5% 29.3%<br />
AT&T 11.8% 14.6% 17.3% 19.9% 22.9% 26.6% 28.7%<br />
Sprint Nextel 10.9% 13.5% 14.9% 17.4% 19.5% 23.9% 25.0%<br />
T-<strong>Mobile</strong> 10.9% 12.5% 14.7% 15.8% 16.6% 18.5% 20.8%<br />
205. We believe the trends of declining voice ARPU and rising data ARPU are the result of<br />
several factors, including further declines in the per-minute price of mobile voice calls; an increase in the<br />
share of subscribers who typically spend less per month on mobile calls, such as prepaid and family plan<br />
customers; 588 and an increase in mobile data usage and subscribership. 589<br />
206. The ARPU data shown below do not reflect the unlimited plan pricing changes, discussed<br />
above, that Verizon <strong>Wireless</strong> and AT&T announced in January 2010, and it is unclear how these pricing<br />
changes will affect ARPU going forward. 590 While the shift of existing unlimited plan customers to the<br />
discounted plans would depress ARPU, this effect could be offset to the extent other customers respond to<br />
the reduction in the price of unlimited plans by migrating upward from lower-priced limited plans to<br />
unlimited offerings, and also to the extent new customers choose unlimited plans rather than less<br />
expensive limited plans. 591 In addition, Verizon <strong>Wireless</strong>’s pricing plan changes were accompanied by<br />
the introduction of a new data plan requirement for certain types of handsets. The resulting increase in<br />
587 Data provided by Sanford Bernstein Research.<br />
588 See, e.g., Simon Flannery et al., Deteriorating <strong>Wireless</strong> Trends, Revisited, Morgan Stanley, Equity Research, Jan.<br />
18, 2007, at 3 (“a growing portion of these net adds are coming from lower-ARPU family plans, prepaid customers,<br />
and others receiving larger buckets of minutes at lower per-minute prices.”)<br />
589<br />
See Sections V.D.3, <strong>Mobile</strong> Data Traffic (Non-Messaging), and V.A.1, <strong>Mobile</strong> <strong>Wireless</strong> Subscribers by Type of<br />
Service, infra.<br />
590 See Section IV.A, Price Rivalry: Developments in <strong>Mobile</strong> Service Pricing Plans, supra.<br />
591<br />
Simon Flannery et al., Quick Comment: Verizon’s Price Plan Changes Should Not Rattle Postpaid Market,<br />
Morgan Stanley, Equity Research, Jan. 15, 2010, at 1.<br />
118
Federal Communications Commission <strong>FCC</strong> 10-81<br />
data revenue may offset the revenue impact of the reduction in unlimited voice pricing, leaving revenue<br />
and ARPU unchanged or slightly higher. 592<br />
207. CTIA does not collect and report data on non-service revenue, specifically, revenue from<br />
the sale of handsets and other wireless equipment. Macquarie Research estimates that non-service<br />
revenue from equipment sales has also grown steadily since 2004, amounting to nearly $20 billion in<br />
2008. 593<br />
G. Investment<br />
208. Investment, as measured by capital expenditures, also referred to as “capital spending” or<br />
“CAPEX,” is funds spent during a particular period to acquire or improve long-term assets, such as<br />
property, plant, or equipment. 594<br />
209. Over the past decade, mobile wireless providers have invested significantly in wireless<br />
structures and equipment. Between 1998 and 2008, industry-wide capital expenditures by wireless<br />
providers exceeded $240 billion. 595 In the mobile wireless industry, CAPEX primarily consists of<br />
spending to upgrade and expand networks to increase data connection speeds, enable more reliable<br />
service, and improve coverage. 596<br />
210. Data from two sources reveal slightly different capital investment trends. As shown in<br />
Table 22, data from the Census Bureau suggests that, after decreasing by more than 20 percent between<br />
2006 and 2007, capital expenditures by wireless providers rebounded in 2008, increasing by<br />
approximately 15 percent over the previous year to more than $25.5 billion. However, data from CTIA<br />
suggests that, while the mobile wireless industry has continued to invest in network expansions and<br />
upgrades, capital investment has been declining over the past four years. CTIA reports that incremental<br />
capital investment by wireless operators totaled $20.2 billion in 2008, a 4.4 percent decrease from the<br />
$21.14 spent in 2007 and a 20 percent decrease from the $25.2 billion spent in 2005. 597 CTIA also<br />
reports that capital investment during the first half of 2009 totaled $8.9 billion for the wireless industry, a<br />
7.4 percent drop from the first half of 2008. 598<br />
592 Jonathan Chaplin, et al., Breaking View: VZ Pricing Changes Not Deflationary, Credit Suisse, Equity Research,<br />
Jan. 15, 2010, at 1. However, since, as discussed above, Verizon <strong>Wireless</strong> may have introduced the new data plan<br />
requirement as a means of recovering the cost of steeper handset subsidies, ARPU is not necessarily a reliable<br />
indicator of the net effect of these changes. See Section IV.A, Price Rivalry: Developments in <strong>Mobile</strong> Service<br />
Pricing Plans, supra.<br />
593 Data provided by Macquarie Research.<br />
594 A Dictionary of Finance and Banking (2 nd ed.), Oxford University Press, 1997, at 50-51. There are differing<br />
opinions on what constitutes capital spending versus non-capital spending.<br />
595 See U.S. Census Bureau, Annual Capital Expenditures Surveys, 1999-2008.<br />
596<br />
AT&T Inc., SEC Form 10-K, filed Feb. 25, 2009, at 8, 24; Sprint Nextel, SEC Form 10-K, filed Feb. 27, 2009, at<br />
17; CTIA NOI Comments at 32.<br />
597 CTIA Year-End 2008 <strong>Wireless</strong> Indices <strong>Report</strong>, at 124; CTIA PN Comments at 13; CTIA NOI Comments at 32.<br />
598 CTIA Mid-Year 2009 <strong>Wireless</strong> Indices <strong>Report</strong>, at 127.<br />
119
Federal Communications Commission <strong>FCC</strong> 10-81<br />
Table 22<br />
Annual Capital Expenditures by <strong>Wireless</strong> Service Providers 599<br />
Census Bureau: Total Annual Capital<br />
Expenditures (in billions)<br />
Census Bureau: Percent Change in Capital<br />
Expenditures from Previous Year<br />
CTIA: Total Annual Incremental Capital<br />
Investment (in billions)<br />
CTIA: Percent Change in Incremental Capital<br />
Investment from Previous Year<br />
120<br />
2004 2005 2006 2007 2008<br />
$24.0 $27.3 $27.9 $22.2 $25.5<br />
14.3% 13.9% 2.2% (20.5%) 15.1%<br />
$14.1 $25.2 $24.4 $21.1 $20.2<br />
(12.0%) 78.8% (3.2%) (13.4%) (4.6%)<br />
211. According to CTIA, incremental capital investment per subscriber has been declining as<br />
well over the past four years and at greater rates than total investment, as shown in Chart 31. During<br />
2008, capital investment per subscriber fell 11 percent to $76.73 from its 2007 level of $86.57. From<br />
2005 to 2008, annual capital investment per subscriber fell 40 percent.<br />
599 U.S. Census Bureau, Service Annual Survey Data, 2007-2008; U.S. Census Bureau, Annual Capital Expenditures<br />
Surveys, 2004-2008; CTIA Year-End 2008 <strong>Wireless</strong> Indices <strong>Report</strong>.
$160.00<br />
$140.00<br />
$120.00<br />
$100.00<br />
$80.00<br />
$60.00<br />
$40.00<br />
$20.00<br />
$-<br />
$148.46<br />
Federal Communications Commission <strong>FCC</strong> 10-81<br />
Chart 31<br />
Annual Incremental Capital Investment per Subscriber 600<br />
$107.12<br />
$82.80<br />
121<br />
$129.38<br />
$110.78<br />
$86.57<br />
$76.73<br />
2002 2003 2004 2005 2006 2007 2008<br />
212. Data from both CTIA and the Census Bureau show that annual capital investment as a<br />
percentage of total industry revenue has been declining (see Chart 32). According to CTIA data, CAPEX<br />
as a percentage of total revenue declined from 22 percent in 2005 to 14 percent in 2008. Census Bureau<br />
data shows that CAPEX as a percentage of total industry revenue fell from 19.5 percent in 2005 to 13.8<br />
percent in 2008.<br />
600 CTIA Year-End 2008 <strong>Wireless</strong> Indices <strong>Report</strong>.
25%<br />
20%<br />
15%<br />
10%<br />
5%<br />
0%<br />
Federal Communications Commission <strong>FCC</strong> 10-81<br />
Chart 32<br />
Annual Capital Investment as a Percentage of Industry Revenue 601<br />
14%<br />
19%<br />
22%<br />
20%<br />
19%<br />
122<br />
18%<br />
CTIA Census Bureau<br />
15%<br />
13%<br />
14% 14%<br />
2004 2005 2006 2007 2008<br />
213. As shown in Chart 33, CAPEX trends in recent years have varied from operator to<br />
operator. AT&T, for example, reported that its wireless CAPEX increased 42 percent in 2008 and was<br />
used primarily to expand the capacity of its network and for HSPA upgrades. 602 In addition, T-<strong>Mobile</strong>’s<br />
CAPEX increased 35 percent during 2008 as the company has been building out its 3G network. 603 On<br />
the other hand, Sprint Nextel’s CAPEX declined 53 percent in 2008 and an additional 52 percent in 2009.<br />
Sprint Nextel’s average quarterly CAPEX as a percentage of service revenue also dropped from 14.3<br />
percent in 2007 to 6.2 percent in 2008, and to 3.8 percent for the first three quarters of 2009. 604<br />
According to one analyst, the reasons for Sprint Nextel’s decrease in CAPEX include the company’s<br />
negative growth, which resulted in reduced capacity needs and reduced investment in cell sites, 605 and the<br />
company’s decision to resell 4G service, thereby reducing its need to invest directly in further network<br />
upgrades. As discussed below, Sprint Nextel has invested in Clearwire and holds an ownership interest in<br />
the company, and is currently reselling Clearwire’s 4G WiMAX service. 606<br />
601<br />
U.S. Census Bureau, Annual Capital Expenditures Surveys, 2004-2008; CTIA Year-End 2008 <strong>Wireless</strong> Indices<br />
<strong>Report</strong>.<br />
602 AT&T Inc., SEC Form 10-K, filed Feb. 25, 2009, at 8, 24.<br />
603 See Chart 33; The Haves and the Have-Nots Diverge, at 20.<br />
604 US <strong>Wireless</strong> 411 3Q09, at 50.<br />
605 Craig Moffett, et al., U.S. <strong>Wireless</strong> Industry Scorecard: The Haves and the Have-Nots Diverge... Industry<br />
Growth Stabilizes at 4.2% in Q3, Bernstein Research, Nov. 6, 2009, at 20; Sprint Nextel, SEC Form 10-K, filed Feb.<br />
27, 2009, at 55. Sprint stated that the decline in Capex in 2008 was also the result of fewer IT projects and the<br />
completion in 2007 of various wireless initiatives. Sprint Nextel, SEC Form 10-K, filed Feb. 27, 2009, at 55.<br />
606 See Section IV.B.1.a, Service Provider Technology Deployments, infra. Sprint Nextel, SEC Form 10-K, filed<br />
Feb. 27, 2009, at 3, 17, 24 (“[W]e are dependent on Clearwire to quickly build, launch and operate a viable, national<br />
4G network. . . . Our intention is to integrate these 4G services with our products and services”).
Capital Expenditures ($ Million)<br />
8000<br />
7000<br />
6000<br />
5000<br />
4000<br />
3000<br />
2000<br />
1000<br />
0<br />
H. Profitability<br />
Federal Communications Commission <strong>FCC</strong> 10-81<br />
Chart 33<br />
Capital Expenditures by Service Provider 607<br />
AT&T Sprint Nextel T-<strong>Mobile</strong> Verizon <strong>Wireless</strong><br />
214. In order to improve upon the competitive analysis of previous <strong>Report</strong>s, the <strong>Wireless</strong><br />
Telecommunications Bureau, in May 2009, released a Public Notice soliciting data and information on<br />
suitable profitability measures. 608 The Fourteenth <strong>Report</strong> Public Notice discussed measures of<br />
profitability including various rates of return, free cash flow, and EBITDA. 609 Measures of profitability<br />
and provider performance are widely used by industry observers and analysts. 610 They can provide useful<br />
indicators of absolute and relative provider performance, entry and exit conditions, growth conditions,<br />
costs, the intensity of rivalry, and provider pricing policies. Previous <strong>Report</strong>s have considered indicators<br />
of provider performance such as market share, exit from the industry, net additions, churn, and ARPU.<br />
For some purposes, measures of profitability and cash flow improve on these other indicators of provider<br />
performance because measures of profitability reflect firm costs and can be used to compute rates of<br />
return.<br />
1. Measuring Profitability<br />
123<br />
2006<br />
2007<br />
2008<br />
2009<br />
215. A true measure of economic profit, especially in a capital intensive industry such as the<br />
607 US <strong>Wireless</strong> 411 3Q09, at 47; John C. Hodulik, et al., US <strong>Wireless</strong> 411, Version 25.0, UBS, Sept. 18, 2009, at 67;<br />
Verizon Communications, Inc., SEC Form 10-K, filed Feb. 24, 2009.<br />
608 Fourteenth <strong>Report</strong> Public Notice 24 <strong>FCC</strong> Rcd at 5629. Discussions of profitability measures were included in<br />
Consumer Federation of America, et al. Comments at 38, and Mercatus Comments at 12-13.<br />
609 Fourteenth <strong>Report</strong> Public Notice 24 <strong>FCC</strong> Rcd at 5629.<br />
610 See, e.g., US <strong>Wireless</strong> 411 4Q08 and US <strong>Wireless</strong> 411 2Q09; Clearwire Corporation Subscriber Trends<br />
Encouraging, Churn a Concern, Morgan Stanley, Morgan Stanley Research, Feb. 25, 2010; Verizon <strong>Mobile</strong> Subs<br />
Strong But Wireline Disappoints, REUTERS, Jan. 26, 2010; MetroPCS, Leap Both Bitten By <strong>Competition</strong>, WALL<br />
STREET JOURNAL, Aug. 7, 2009.
Federal Communications Commission <strong>FCC</strong> 10-81<br />
mobile wireless industry, 611 would reflect cash flows over a period of time that is long enough to recoup<br />
investment costs, and would account for a firm’s weighted average cost of capital. Examples of such a<br />
measure include Return on Invested Capital (ROIC) 612 or Economic Value Added (EVA). 613 Such a<br />
metric would depart from the net income (i.e., accounting profits) that communication providers report to<br />
the Securities and Exchange Commission, in several respects. First, it may value capital costs on a basis<br />
that may differ from the depreciation methods providers use to calculate net income. 614 Second, it would<br />
require some data that is currently reported only in a consolidated statement, which includes non-wireless<br />
operating units, to be either reported or estimated at the level of the provider’s mobile wireless operating<br />
segment. 615 Because limitations on data availability make it difficult to measure true economic profit, we<br />
consider some proxy metrics in place of a true measure of profitability. Below we discuss three readily<br />
available measures of cash flow of mobile wireless segments that industry observers often use as<br />
indicators of mobile wireless segment profitability and as metrics to compare the performance of mobile<br />
wireless segments of different communication providers. Each of these indicators incorporates different<br />
elements of a firm’s costs.<br />
216. Earning Before Interest and Taxes (EBIT). EBIT is the accounting profit of a company<br />
before interest expenses and corporate taxes are deducted. 616 EBIT deducts from revenue the cost of<br />
equipment sold to users (e.g. the price paid by a provider for the handsets that it sells to consumers),<br />
service costs (e.g. network interconnection, roaming, and long-distance costs), selling, general, and<br />
administrative costs, but it does not deduct costs such as interest payments on debt and corporate income<br />
taxes. EBIT has the advantages of being a general indicator of the performance of mobile wireless<br />
segments and it deducts operating costs that would also be deducted in more detailed profitability<br />
estimates. However, as interest payments on debt and corporate income taxes are generally recurrent cash<br />
flow obligations, some experts argue that these measures may not always be good estimates of operating<br />
cash flow. 617 Federal and State corporate income taxes can be over one-third of pre-tax income and they<br />
are deducted in most profit formulas. 618 Further, EBIT data is sensitive to accounting practices for<br />
611 <strong>Mobile</strong> wireless networks are relatively capital intensive. See Section III.D.2., Non-Regulatory Entry and Exit<br />
Conditions, and Section IV.B.1, Network Coverage and Technology Upgrades, infra.<br />
612 nd<br />
See, Tom Copeland, et al., Valuation: Measuring and Managing the Value of Companies (2 ed.), John Wiley &<br />
Sons, 1995, at 163.<br />
613 See James Grant, Foundations of Economic Value Added (2 nd ed.), Wiley, 2002.<br />
614 For example, deducting CAPEX from EBITDA is an alternative to depreciating CAPEX over its useful lifetime.<br />
Depreciation assumptions and methods can vary across firms and not all depreciation methods are suitable for<br />
calculating profitability measures. See A Dictionary of Finance and Banking (2 nd ed.), Oxford University Press,<br />
1997, at 100. See also, Modern Industrial Organization, at 249-250.<br />
615<br />
For example, some providers report some interest and tax expenses only on a consolidated basis across their<br />
wireline, wireless, and other segments.<br />
616 See A Dictionary of Finance and Banking (2 nd ed.), Oxford University Press, 1997, at 112 (defining EBIT as<br />
“The profit of a company as shown on the profit and loss account, before deducting the variables of interest and tax.<br />
This figure, which is used in calculating many ratios, enables better comparisons to be made with other<br />
companies”).<br />
617 See, e.g., B. Tunick, In the GAAP/EBITDA World Nothing’s Easy, INVESTMENT DEALER’S DIGEST, Sept. 16,<br />
2002, Vol. 68, Issue 35, at 30; M. Fridson, EBITDA Is Not King, Journal of Financial Statement Analysis, Spring<br />
1998, Vol. 3, Issue 3, at 59; Let’s Agree to Agree on What EBITDA Means, Bank Loan <strong>Report</strong>, Vol. 23, No. 26, June<br />
30, 2008. See D. Shook, EBITDA’s Foggy Bottom Line, BUSINESSWEEK ONLINE, Jan. 14, 2003, available from the<br />
database Business Source Premier, (stating that if a firm has interest payments equal to 20 percent of EBITDA then<br />
EBITDA will ignore one of the firm’s largest expenses).<br />
618 The statutory federal corporation income tax is 35 percent for corporate income over $18,333,333. See IRS,<br />
Publication 542, Corporations, at 17, Rev. Feb. 2006, available at http://www.irs.gov/pub/irs-pdf/p542.pdf.<br />
124
depreciation and mergers. We do not discuss EBIT data in this <strong>Report</strong>.<br />
Federal Communications Commission <strong>FCC</strong> 10-81<br />
217. Earnings Before Interest, Taxes, Depreciation, and Amortization (EBITDA). EBITDA<br />
equals accounting profits before deducting interest expenses, corporate income taxes, depreciation, and<br />
amortization. 619 EBITDA differs from EBIT in that EBIT deducts depreciation and amortization. An<br />
advantage of EBITDA is that it is widely used by industry observers, such as equity analysts, as an<br />
indicator of profitability in the telecommunications sector. 620 However, EBITDA does not account for<br />
capital expenditures or cash flow expenses such as interest and taxes. To the extent that capital<br />
expenditures are proportionately similar across firms and over time, EBITDA can be a useful measure of<br />
relative performance. We discuss EBITDA data below.<br />
218. EBITDA minus Capital Expenditures (EBITDA minus CAPEX). EBITDA minus CAPEX<br />
equals EBITDA, discussed above, less the capital investment incurred in the same time period. EBITDA<br />
minus CAPEX incorporates capital spending into the profitability measure, and as such provides a rough<br />
approximation of free cash flow. 621 Although it is a better approximation of cash flow than EBITDA<br />
because it deducts capital expenditures, we note that capital expenditures may differ from estimates of<br />
annual capital costs that are often used to replace depreciation figures in estimates of economic profits. 622<br />
Also, EBITDA minus CAPEX does not account for purchases of spectrum licenses, a significant expense<br />
of mobile wireless providers. We discuss EBITDA minus CAPEX data below.<br />
219. EBITDA per subscriber data for selected service providers are presented in Chart 34.<br />
Standardizing EBITDA by subscribers facilitates cross-provider comparisons and makes EBITDA<br />
directly comparable to ARPU, another measure of provider performance discussed in this <strong>Report</strong>. As<br />
shown in Chart 34, in 2008, the difference between the provider with the highest EBITDA per subscriber<br />
(Verizon <strong>Wireless</strong>) and the provider with the lowest (Leap) was $14.09. Among the four national<br />
providers, AT&T and Verizon <strong>Wireless</strong> had the highest EBITDA per subscriber since 2007. Sprint<br />
Nextel has seen its EBITDA per subscriber decline significantly over the past several years. The<br />
differences in EBITDA per subscriber across providers may reflect many underlying factors including<br />
different characteristics of service and product offerings, different customer preferences, different<br />
network designs and capabilities, different cost structures, scale economies, and the degree of competitive<br />
rivalry. The changes in EBITDA per subscriber for individual providers can also reflect changes<br />
particular to the provider; for example, acquisitions of networks in mergers or changes in service and<br />
product offerings over time. It is possible that some of the correlated changes across providers reflect<br />
macroeconomic effects on demand.<br />
619 The definition of EBITDA is an extension of EBIT, also excluding Depreciation and Amortization. EBITDA is<br />
readily calculated from a provider’s SEC 10-K form even if the provider does not report EBITDA.<br />
620 See, e.g., US <strong>Wireless</strong> 411 2Q09, at 2 (EBITDA is the accounting definition used for operating cash flow).<br />
621 See Donald E. Kieso, et al., Intermediate Accounting (11 th ed.), John Wiley & Sons, Inc., 2004, at 197 (Defining<br />
free cash flow as net cash provided by operating activities less capital expenditures less dividends. Some companies<br />
do not subtract dividends because they believe these expenditures to be discretionary. Net cash provided by<br />
operating activities adjusts net income for depreciation and amortization, but not for interest expenses and tax<br />
expenses. Free cash flow is interpreted as the amount of discretionary cash flow a company has for purchasing<br />
additional investments, retiring its debt, purchasing treasury stock, or adding to its liquidity.) See, also, Tom<br />
Copeland, et al., Valuation: Measuring and Managing the Value of Companies (2 nd ed.), John Wiley & Sons, 1995,<br />
at 167 (stating that free cash flow is the total after-tax cash flow generated by the company and available to all<br />
providers of the company’s capital, both creditors and shareholders).<br />
622 See also, Modern Industrial Organization, at 247.<br />
125
$ Per Subscriber per Month<br />
$30.00<br />
$25.00<br />
$20.00<br />
$15.00<br />
$10.00<br />
$5.00<br />
$0.00<br />
Federal Communications Commission <strong>FCC</strong> 10-81<br />
Chart 34<br />
EBITDA per Subscriber (Selected Providers) 623<br />
2006 2007 2008 2009<br />
AT&T $16.90 $19.11 $18.12 $19.38<br />
Sprint Nextel $18.78 $14.10 $9.94 $9.81<br />
T-<strong>Mobile</strong> $15.89 $15.68 $16.11 $16.01<br />
Verizon <strong>Wireless</strong> $21.61 $22.20 $24.39 $23.67<br />
Leap <strong>Wireless</strong> $7.48 $12.84 $7.52 $9.58<br />
Metro PCS $13.24 $13.35 $12.68 $12.67<br />
US Cellular $12.09 $13.84 $11.20 $15.14<br />
220. EBITDA minus CAPEX per subscriber data for selected service providers, presented in<br />
Chart 35, may provide a sense of the relative profitability of the providers on a per subscriber basis. As<br />
with EBITDA per subscriber data, EBITDA minus CAPEX per subscriber data are directly comparable to<br />
ARPU data. Between 2006 and 2008, the EBITDA minus CAPEX per subscriber of the top four<br />
nationwide providers varied between a low of $5.9 for AT&T in 2006 to a high of $16.5 for Verizon<br />
<strong>Wireless</strong> in 2008. In these three years Sprint Nextel and T-<strong>Mobile</strong> have remained in a range between $6.5<br />
and $10. The difference between the highest and lowest EBITDA minus CAPEX per subscriber was $5.9<br />
in 2006, $6.2 in 2007, and $9.9 in 2008. Verizon <strong>Wireless</strong> experienced annual increases between 2006<br />
and 2008, whereas the other three nationwide providers have experienced both increases and decreases.<br />
ARPU, EBITDA, and EBITDA minus CAPEX are presented together in Chart 36 to facilitate comparison<br />
within this family of measures.<br />
623 UBS, US <strong>Wireless</strong> 411 <strong>Report</strong>s, 2006 – 2009.<br />
126
Federal Communications Commission <strong>FCC</strong> 10-81<br />
Chart 35<br />
EBITDA minus CAPEX per Subscriber per Month (Selected Providers) 624<br />
$ Per Subscriber per Month<br />
$20.0<br />
$15.0<br />
$10.0<br />
$5.0<br />
$0.0<br />
AT&T $5.91 $14.00 $12.38<br />
Sprint Nextel $9.67 $7.84 $8.52<br />
T-<strong>Mobile</strong> $7.37 $8.15 $6.61<br />
Verizon <strong>Wireless</strong> $11.77 $13.83 $16.52<br />
624 UBS, US <strong>Wireless</strong> 411 <strong>Report</strong>s, 2006 – 2009<br />
2006 2007 2008<br />
127
$ Per subscriber per month<br />
$60.00<br />
$50.00<br />
$40.00<br />
$30.00<br />
$20.00<br />
$10.00<br />
$0.00<br />
Federal Communications Commission <strong>FCC</strong> 10-81<br />
Chart 36<br />
Comparison of ARPU, EBITDA, and EBITDA minus CAPEX 625<br />
Verizon<br />
AT&T<br />
Sprint<br />
T-<strong>Mobile</strong><br />
Verizon<br />
AT&T<br />
2006 2007 2008<br />
ARPU EBITDA per SUB -UBS EBITDA-CAPEX per Subscriber<br />
221. EBITDA as a percentage of service revenue, also called EBITDA margin, appears in<br />
Chart 37 and provides another indicator of mobile wireless segment profitability. Standardizing EBITDA<br />
by service revenues facilitates cross-provider comparisons. In 2008, the difference between the provider<br />
with the highest EBITDA margin (Verizon <strong>Wireless</strong>) and the provider with the lowest (Leap) was 29.6<br />
percent. Since 2007, the two largest national providers were the only providers with EBITDA margins<br />
greater than 35 percent. Verizon <strong>Wireless</strong> has remained in a band between 43 percent and 48 percent<br />
since 2005, increasing in 2008 relative to 2007. AT&T has remained between 31 percent and 39 percent,<br />
decreasing in 2008 relative to 2007. Between 2004 and 2008, Sprint Nextel declined from nearly 35<br />
percent to approximately 22 percent. Since 2005, T-<strong>Mobile</strong> and MetroPCS remained between 28 percent<br />
and 33 percent.<br />
625 UBS, US <strong>Wireless</strong> 411 <strong>Report</strong>s, 2006 – 2009<br />
128<br />
Sprint<br />
T-<strong>Mobile</strong><br />
Verizon<br />
AT&T<br />
Sprint<br />
T-<strong>Mobile</strong>
Percent<br />
Federal Communications Commission <strong>FCC</strong> 10-81<br />
Chart 37<br />
<strong>Report</strong>ed EBITDA Margins: 2002 – 2009 (Selected Providers) 626<br />
60.0%<br />
50.0%<br />
40.0%<br />
30.0%<br />
20.0%<br />
10.0%<br />
0.0%<br />
US Cellular<br />
T-<strong>Mobile</strong><br />
129<br />
Verizon <strong>Wireless</strong><br />
Sprint Nextel<br />
Leap <strong>Wireless</strong><br />
Verizon <strong>Wireless</strong> 39.5% 39.7% 39.5% 46.8% 43.2% 43.6% 47.5% 46.3%<br />
T-<strong>Mobile</strong> 9.1% 16.5% 18.5% 32.0% 29.8% 29.8% 31.1% 33.1%<br />
Leap <strong>Wireless</strong> 5.7% 29.5% 29.4% 31.6% 17.1% 28.2% 17.7% 23.5%<br />
US Cellular 23.7% 25.9% 24.6% 21.0% 25.2% 26.4% 21.3% 28.9%<br />
Sprint Nextel 34.8% 34.6% 35.4% 28.7% 21.6% 21.7%<br />
AT&T 31.1% 34.4% 38.2% 35.8% 38.3%<br />
Metro PCS 28.9% 29.4% 29.9% 29.2% 30.5%<br />
I. Network Quality<br />
AT&T<br />
2002 (Q4) 2003 (Q4) 2004 (Q4) 2005 (Q4) 2006 (Q4) 2007 (Q4) 2008 (Q4) 2009 (Q2)<br />
222. A semi-annual study conducted by J.D. Power measures wireless call quality<br />
performance in terms of the number of problems per 100 calls (PP100), where a lower score reflects<br />
fewer problems and higher wireless call quality performance. 627 Prior to the 2009 study, the number of<br />
reported wireless call quality problems for the industry overall declined for three consecutive reporting<br />
periods and then remained relatively stable from 2007 to 2008 at 15 problems per 100 calls, the lowest<br />
626<br />
UBS, US <strong>Wireless</strong> 411 <strong>Report</strong>s, 2006 – 2009. Data is for the fourth quarter, except for 2009, which is second<br />
quarter data.<br />
627 J.D. Power and Associates <strong>Report</strong>s: The Gap in Call Quality Performance Among Carriers Narrows As<br />
<strong>Competition</strong> Intensifies Across the <strong>Wireless</strong> Service Industry, Press Release, J.D. Power, Mar. 18, 2009 (“Gap in<br />
Call Quality Performance Among Carriers Narrows”); J.D. Power, 2009 <strong>Wireless</strong> Call Quality Volume 1, available<br />
at http://jdpower.com/telecom/articles/2009-<strong>Wireless</strong>-Call-Quality-Volume-1 (2009 <strong>Wireless</strong> Call Quality Volume<br />
1). The study measures wireless call quality based on seven customer-reported problem areas that impact overall<br />
carrier performance: dropped calls; static/interference; failed connection on first try; voice distortion; echoes; no<br />
immediate voicemail notification; and no immediate text message notification. The 2009 <strong>Wireless</strong> Call Quality<br />
Volume 1 is based on responses from 27,754 wireless customers. The study was fielded between July and December<br />
2009.
Federal Communications Commission <strong>FCC</strong> 10-81<br />
level in the history of the study. 628 The J.D. Power 2009 <strong>Wireless</strong> Call Quality Performance Study<br />
(Volume 1) indicates that network quality for the industry overall has held steady since the 2008 study,<br />
with the number of problems reported by consumers remaining virtually unchanged at 15 problems per<br />
100 calls. 629<br />
223. The same study further indicates that, while overall industry performance has remained<br />
the same, the gap in call quality performance among the major providers included in the study has closed<br />
significantly as compared with previous years. 630 In particular, while call quality performance among<br />
wireless providers still varies at the regional level, the gap between the highest- and lowest-ranked<br />
providers for the overall industry has narrowed from eight problems per 100 calls in the 2008 Volume 2<br />
study to only five problems per 100 calls in the 2009 Volume 1 study. 631 According to J.D. Power, this<br />
trend toward greater parity is primarily the result of decreases in reported problems by customers of<br />
AT&T and Sprint Nextel and slight increases in reported problems by customers of both Verizon<br />
<strong>Wireless</strong> and Alltel. 632 Based on these findings, J.D. Power concludes that there is now less<br />
differentiation between the better-performing providers and those that struggle with network quality<br />
performance, compared with previous studies. 633 Nevertheless, despite experiencing a slight increase in<br />
reported problems, Verizon <strong>Wireless</strong> remains the industry leader in network performance overall. 634<br />
224. One challenge facing service providers is ensuring that bandwidth consumption by dataintensive<br />
smartphone users does not degrade the quality of service for those users and other mobile<br />
wireless subscribers on the network. 635 <strong>Report</strong>s suggest that iPhone users have experienced service<br />
quality problems on AT&T’s broadband network, including dropped calls, delayed text and voice<br />
messages, and slow download speeds, particularly during periods of peak use in dense urban areas with<br />
higher concentrations of iPhone users. 636 According to reports, the deterioration in service quality is due<br />
in part to the popularity of the iPhone and the challenges associated with architecting a network to keep<br />
up with the increased demand for data services. 637 As detailed above, AT&T is devoting the majority of<br />
its capital spending to various measures aimed at upgrading and expanding the capacity of its 3G network<br />
in order to fix these problems and meet the rising demands on the network from bandwidth-heavy data<br />
628 Thirteenth <strong>Report</strong>, 24 <strong>FCC</strong> Rcd at 6286-6287, 214-216.<br />
629 2009 <strong>Wireless</strong> Call Quality Volume 1.<br />
630 Id.<br />
631 Gap in Call Quality Performance Among Carriers Narrows.<br />
632 2009 <strong>Wireless</strong> Call Quality Volume 1.<br />
633 Id.<br />
634 Id.<br />
635 Tom Kaneshige, AT&T IPhone Users Irate at Idea of Usage-Based Pricing, PCWORLD, Dec. 14, 2009. As<br />
discussed above, iPhone and other smartphone users are responsible for a significant portion of data traffic and<br />
consume significantly more bandwidth than average mobile wireless subscribers. See Section V.D.3, <strong>Mobile</strong> Data<br />
Traffic (Non-Messaging), supra.<br />
636 Jenna Wortham, Customers Angered as iPhones Overload AT&T, NEW YORK TIMES, Sept. 3, 2009; Jared<br />
Newman, Network Woes? Hate the iPhone, Not AT&T, PCWORLD, Sept. 4, 2009. Service quality problems are<br />
reported to be particularly pronounced in the cities of New York and San Francisco, where Piper Jaffray analyst<br />
Gene Munster estimates that AT&T’s network “shoulders as much as 20 percent of all the iPhone users in the<br />
United States.” Jenna Wortham, Customers Angered as iPhones Overload AT&T, NEW YORK TIMES, Sept. 3, 2009.<br />
637<br />
<strong>Wireless</strong> Service and Handset Pricing – Pressure Building, at 2; Jenna Wortham, Customers Angered as iPhones<br />
Overload AT&T, NEW YORK TIMES, Sept. 3, 2009.<br />
130
Federal Communications Commission <strong>FCC</strong> 10-81<br />
applications. 638 Although reports have focused on the quality of service on AT&T’s network, rival<br />
service providers may confront the same network challenges as smartphone penetration increases.<br />
J. Economic Impact of <strong>Mobile</strong> <strong>Wireless</strong> Services<br />
225. <strong>Wireless</strong> industry contributions to the U.S. economy include investment, job creation,<br />
and increased productivity. According to CTIA, wireless services delivered close to $100 billion in<br />
“value added” contributions to the U.S. GDP in 2007. 639 In addition, one study estimates that during the<br />
fifteen years between 1992 and 2007, economic contributions from wireless services grew faster than the<br />
rest of the U.S. economy, averaging over 16 percent annual growth compared to approximately 3 percent<br />
for the remainder of the economy. 640 However, the same study also reveals that the average annual<br />
growth rate for economic contributions from wireless services decreased to 11.2 percent for the period<br />
from 2002 to 2007, down from 19.1 percent for the period between 1997 and 2002. 641<br />
226. As discussed above, mobile wireless service providers have invested heavily in network<br />
deployment and equipment, including mobile broadband networks. According to one recent study, there<br />
is a multiplier effect for investment in mobile wireless broadband networks, with a seven-to-tenfold<br />
increase in GDP compared to the initial investment. 642 As the authors explain, investment in wireless<br />
broadband infrastructure is similar to building a roadway in that it “not only generates jobs and income<br />
for the builders of the road, but provides opportunities for others to create new businesses and homes<br />
along the roadway.” 643 As a result, while investment in mobile wireless infrastructure increases the<br />
availability, capacity, speed, and reliability of services, it also provides indirect benefits, such as creating<br />
new businesses and sources of revenue, enhancing health care and public safety services, and helping<br />
consumers reach goods, services, jobs, and educational opportunities. 644 Moving forward, new<br />
investment in mobile broadband infrastructure may offer additional opportunities for investment and<br />
economic growth in both the wireless sector and economy as a whole.<br />
227. Investment and growth in the wireless sector in recent years has also spurred job creation<br />
and generated additional economic benefits through increased productivity. For instance, wireless<br />
providers directly employ more than 268,000 people, a number that has grown about six percent yearover-year<br />
for the last four years. 645 Beyond direct employment by wireless providers, CTIA claims that<br />
approximately 2.4 million American jobs are either directly or indirectly dependent upon the U.S.<br />
638<br />
See Section IV.B.1, Network Coverage and Technology Upgrades, supra. <strong>Wireless</strong> Service and Handset Pricing<br />
– Pressure Building, at 2; Jenna Wortham, Customers Angered as iPhones Overload AT&T, NEW YORK TIMES,<br />
Sept. 3, 2009.<br />
639<br />
Letter from Christopher Guttman-McCabe, CTIA, to Chairman Julius Genachowski, et al., <strong>FCC</strong>, GN Docket No.<br />
09-51, WT Docket Nos. 08-165, 09-66 (filed July 9, 2009) at 2.<br />
640<br />
Id. at Attach., Harold Furchtgott-Roth, The <strong>Wireless</strong> Sector: A Key to Economic Growth in America (Jan. 2009)<br />
at 1.<br />
641<br />
Letter from Christopher Guttman-McCabe, CTIA, to Chairman Julius Genachowski, et al., <strong>FCC</strong>, GN Docket No.<br />
09-51, WT Docket Nos. 08-165, 09-66 (filed July 9, 2009), Attach., Harold Furchtgott-Roth, The <strong>Wireless</strong> Sector: A<br />
Key to Economic Growth in America (Jan. 2009) at 27, Table 11.<br />
642<br />
Alan Pearce and Michael S. Pagano, Accelerated <strong>Wireless</strong> Broadband Infrastructure Deployment: The Impact on<br />
GDP and Employment, 18 MEDIA L. & POL’Y, Spring 2009, at 12, 15.<br />
643<br />
Id. at 13.<br />
644<br />
Id. at 15-18.<br />
645<br />
Letter from Christopher Guttman-McCabe, CTIA, to Chairman Julius Genachowski, et al., <strong>FCC</strong>, GN Docket No.<br />
09-51, WT Docket Nos. 08-165, 09-66 (filed July 9, 2009) at 18, citing CTIA Mid-Year 2009 <strong>Wireless</strong> Indices<br />
<strong>Report</strong>.<br />
131
Federal Communications Commission <strong>FCC</strong> 10-81<br />
wireless industry. 646 In addition, one study predicts that the U.S. wireless industry may create two to<br />
three million new jobs between 2005 and 2015. 647 <strong>Wireless</strong> services also create opportunities for<br />
increased productivity in American businesses, with one study projecting that productivity gains from the<br />
deployment and use of wireless broadband services could generate nearly $860 billion in additional GDP<br />
between 2005 and 2016. 648<br />
646 Letter from Christopher Guttman-McCabe, CTIA, to Chairman Julius Genachowski, et al., <strong>FCC</strong>, GN Docket No.<br />
09-51, WT Docket Nos. 08-165, 09-66 (filed July 9, 2009) at 18.<br />
647 Roger Entner and David Lewin, Ovum, The Impact of the U.S. <strong>Wireless</strong> Telecom Industry on the U.S. Economy –<br />
A Study for CTIA-The <strong>Wireless</strong> Association, Sept. 2005, at 3, 30.<br />
648 Roger Entner, Ovum, The Increasingly Important Impact of <strong>Wireless</strong> Broadband Technology and Services on the<br />
U.S. Economy: A Follow Up to the 2005 Ovum <strong>Report</strong> on the Impact of the U.S. <strong>Wireless</strong> Telecom Industry on the<br />
U.S. Economy – A Study for CTIA-The <strong>Wireless</strong> Association, 2008, at 4, 10.<br />
132
Federal Communications Commission <strong>FCC</strong> 10-81<br />
VI. MOBILE WIRELESS SERVICES: CONSUMER BEHAVIOR<br />
228. Consumer behavior in response to price increases and adverse changes in service is an<br />
important indicator of the level of competition in the mobile wireless services industry. If consumers are<br />
sufficiently well-informed to take prices and other non-price factors into account, they are in a better<br />
position to choose the provider that offers the best terms. If enough consumers have the ability and<br />
propensity to switch service providers in response to a change in price or non-price factors, then mobile<br />
wireless service providers will have an incentive to compete vigorously to gain customers and retain their<br />
current customers. Consumers will be more effective in constraining wireless service provider behavior<br />
when the transaction costs they incur in choosing and switching providers are low. Transaction costs<br />
depend on, among other factors, subscribers’ access to and ability to use information, and economic and<br />
non-economic barriers to switching providers.<br />
A. Consumer Switching Costs<br />
229. In the context of mobile wireless services, consumer switching costs are costs that a<br />
consumer incurs when past investment specific to her current service provider must be duplicated for a<br />
new service provider. First, there is the information cost associated with the consumer’s need to obtain<br />
sufficiently detailed information about the offerings of other service providers. Second, wireless service<br />
consumers that have entered into multi-month service subscriptions with their service providers may be<br />
liable for early termination fees (ETF) if they choose to prematurely terminate their contracts. Third,<br />
there are the costs associated with obtaining a new wireless handset or unlocking the old handset when<br />
changing service providers. A potentially related handset change cost is the cost of reacquiring<br />
applications purchased for their current handset that may not be transferrable to a new handset.<br />
230. A reasonable proxy to determine whether switching costs are high enough to prevent<br />
consumers from making changes is churn. As discussed below, churn refers to the percentage of current<br />
customers an operator loses over a given period of time, i.e., a company’s gross loss of customers during<br />
that time period. By examining the magnitude and trend over time of service provider churn, we can<br />
quantify the degree to which consumers have both the desire and the ability to change service providers to<br />
better meet their mobile wireless service needs. 649<br />
1. Access to Information on <strong>Mobile</strong> <strong>Wireless</strong> Services<br />
231. In order to make informed decisions, consumers need detailed information about the<br />
availability, quality, and features of mobile wireless services. Obtaining such information requires the<br />
expenditure of time and, in some cases, money on the part of the wireless service consumer. A number of<br />
third parties – such as Consumer <strong>Report</strong>s, trade associations, marketing and consulting firms, and several<br />
web sites – provide consumers with an overview and comparison of the mobile wireless services available<br />
in their area. 650 In addition, J.D. Power’s web site posts the results of its annual wireless user surveys,<br />
which rate wireless service providers by region based on overall customer satisfaction, call quality, and<br />
customer service. 651<br />
649<br />
Churn only measures consumers that have left a particular service provider; it does not measure consumers that<br />
wanted to switch, but were unable to do so.<br />
650 See Thirteenth <strong>Report</strong>, 24 <strong>FCC</strong> Rcd at 6270, 178; CTIA PN Comments at 36-37; CTIA NOI Comments at 67-<br />
69.<br />
651 J.D. Power, <strong>Wireless</strong>, www.jdpower.com (visited Jan. 14, 2010). For example, according to the J.D. Power 2009<br />
<strong>Wireless</strong> Consumer Smartphone Customer Satisfaction Study, Apple ranks highest in customer satisfaction with<br />
smartphone manufacturers, while LG ranks highest among traditional mobile phone users. Id. In addition, several<br />
websites, such as billshrink.com, myrateplan.com, reviews.cnet.com/cell-phone-buying-guide, and<br />
prepaidreviews.com, provide consumers with free and user-friendly means to identify the best wireless service to<br />
meet their needs. BillShrink states in recent comments to the Commission that the public needs increased access to<br />
service coverage maps, dropped call data, service plan and pricing transparency, service contract detail, and explicit<br />
(continued….)<br />
133
Federal Communications Commission <strong>FCC</strong> 10-81<br />
232. Implementation of initial trial periods in multi-month service subscriptions is a policy<br />
that may alleviate a “buyer’s regret” problem. Some wireless service providers have implemented formal<br />
procedures to permit consumers to use their service on a trial basis for periods ranging from 14 to 30<br />
days, consistent with one of the elements of CTIA’s Consumer Code. 652<br />
233. The Commission continues to receive consumer complaints about various aspects of<br />
mobile wireless service. As GAO notes in a November 2009 report about mobile wireless service, about<br />
84 percent of adult wireless users are very or somewhat satisfied with their wireless service, but<br />
approximately ten percent are very or somewhat dissatisfied. 653 The GAO <strong>Report</strong> also notes that 19 states<br />
have rules or regulations governing wireless service. 654 The Commission is working to address the issues<br />
raised in the GAO <strong>Report</strong> by improving consumer access to needed information and coordinating with<br />
states to more efficiently and effectively respond to consumer complaints about mobile wireless services.<br />
In August 2009, the Commission initiated a Notice of Inquiry proceeding seeking comment on consumer<br />
information, disclosure, and truth-in-billing practices for services it regulates. 655 The Commission now<br />
has a record that was created in response to that inquiry, which will help determine whether or not<br />
additional regulatory actions may be needed to ensure that consumers have sufficient information to make<br />
informed decisions about a mobile wireless service provider. 656 In addition, in May 2010, the <strong>FCC</strong>’s<br />
Consumer and Governmental Affairs Bureau sought comment on the feasibility of instituting usage alerts<br />
and cut-off mechanisms that would provide mobile wireless consumers with a way to monitor their voice,<br />
text, and data usage, as well as the various charges they may incur in connection with such usage. 657<br />
2. Early Termination Fees (ETFs)<br />
234. The practice of assessing ETFs against postpaid subscribers when they cancel their<br />
wireless service agreement or plan before the expiration of its term represents probably the largest<br />
quantifiable cost to consumers who wish to switch service providers. According to information obtained<br />
by the Commission from Telogical Systems, these charges are the same nationwide and range from $175<br />
to $350 per phone number among the four nationwide mobile wireless service providers. 658 Additional<br />
(Continued from previous page)<br />
information about additional charges on wireless bills such as taxes and various fees. See, e.g. BillShrink.com<br />
Comments to CG Docket No. 09-158, Oct. 13, 2009, at 1.<br />
652 See CTIA, Consumer Code for <strong>Wireless</strong> Service, http://files.ctia.org/pdf/ConsumerCode.pdf (visited Apr. 28,<br />
2010). The ability of consumers to terminate a wireless service contract within 14 days is also one of a number of<br />
provisions of the Assurance of Voluntary Compliance agreed to by AT&T (then Cingular), Sprint Nextel, and<br />
Verizon <strong>Wireless</strong> with the attorneys general of 32 states on June 25, 2004. See<br />
http://www.nasuca.org/archive/CINGULAR%20AVC%FINAL%20VERSION.pdf, visited Mar. 15, 2010.<br />
653 <strong>FCC</strong> Needs to Improve Oversight of <strong>Wireless</strong> Phone Service, GAO <strong>Report</strong>, Nov. 2009, at 8. (GAO <strong>Report</strong>)<br />
654 Id. at 27-8. The states that have rules or regulations that apply to wireless carriers are: Alaska, Arizona,<br />
California, Colorado, Connecticut, Hawaii, Indiana, Iowa, Louisiana, Massachusetts, Mississippi, Montana,<br />
Nebraska, New Mexico, North Dakota, Ohio, Rhode Island, South Dakota, and West Virginia.<br />
655 Consumer Information and Disclosure, Truth-in-Billing and Billing Format, IP-Enabled Services, CG Docket<br />
No. 09-158, Notice of Inquiry, 24 <strong>FCC</strong> Rcd 11380 (2009).<br />
656 Id.<br />
657 See “Comment Sought on Measures Designed to Assist U.S. <strong>Wireless</strong> Consumers to Avoid ‘Bill Shock,’” CG<br />
Docket No. 09-158, Public Notice, DA 10-803 (CGB rel. May 11, 2010). Similar usage alerts and notification<br />
mechanisms were adopted by the European Union in June 2009. Id.<br />
658 An exception is the new Google Nexus One handset. Those who terminate their contracts for this T-<strong>Mobile</strong><br />
Google phone will be charged $350, $200 by T-<strong>Mobile</strong> as an early service termination fee, and $150 by Google as<br />
an equipment recovery fee within the first 120 days of service. Amy Schatz, Google Lowers Nexus One Termination<br />
Fee, WALL STREET JOURNAL, Feb. 8, 2010, available at<br />
http://online.wsj.com/article/SB10001424052748703615904575053641103601412.html.<br />
134
Federal Communications Commission <strong>FCC</strong> 10-81<br />
ETFs may be imposed by certain authorized agents or third-party vendors. 659<br />
235. As discussed in previous <strong>Report</strong>s, all four nationwide providers have implemented<br />
policies to pro-rate ETFs over the course of the contract term, and pro-rated ETFs lower the costs to<br />
consumers who switch service providers by progressively reducing the fee they pay to cancel their service<br />
early. 660 However, the Consumer and Governmental Affairs Bureau (CGB) and the <strong>Wireless</strong><br />
Telecommunications Bureau (WTB) have sought information from certain mobile wireless providers<br />
regarding their assessment of ETFs, especially in connection with advanced devices and smartphones, and<br />
the impact such ETFs have on consumers’ ability to switch providers. Specifically, on December 4, 2009,<br />
the CGB and WTB requested information from Verizon <strong>Wireless</strong> regarding its assessment of a $350 early<br />
termination fee for advanced devices. CGB and WTB asked, among other things, why the provider<br />
decided to increase the ETF for smartphones from $175 to $350, how it defines a device as an “advanced<br />
device,” and how consumers receive information about the ETF. 661 Verizon <strong>Wireless</strong> responded to the<br />
CGB and WTB on December 18, 2009, stating in part that the “higher [ETF] associated with advanced<br />
devices reflects the higher costs associated with offering those devices to consumers at attractive prices,<br />
the costs and risks of investing in the broadband network to support these devices, and other costs and<br />
risks.” 662<br />
236. Subsequently, on January 26, 2010, the Chiefs of CGB and WTB sent letters to four<br />
mobile wireless service providers – Verizon <strong>Wireless</strong>, Sprint Nextel, AT&T, and T-<strong>Mobile</strong> – as well as<br />
Google, asking each company to detail how it determines and assesses the ETFs, as well as how it notifies<br />
consumers about ETFs. 663 The letters noted that “[o]ur discussions with wireless companies since<br />
December indicate that there is no standard framework for structuring and applying ETFs throughout the<br />
wireless industry,” noting that the ETFs are substantial (and in some cases are increasing) and have an<br />
important impact on consumers’ ability to switch providers. 664 CGB and WTB also stated that it is<br />
essential that consumers fully understand what they are signing up for – both in the short term and over<br />
the life of the contract – when they accept a service plan with an early termination fee. 665 In light of<br />
those concerns, the Bureaus requested, among other things, that each wireless company provide a<br />
659 See, e.g., Verizon <strong>Wireless</strong>, Service Agreement,<br />
http://www.verizonwireless.com/b2c/globalText?textName=CUSTOMER_AGREEMENT&jspName=footer/custo<br />
merAgreement.jsp (visited Jan. 14, 2010)<br />
660 See Thirteenth <strong>Report</strong>, 24 <strong>FCC</strong> Rcd at 6272-73, 185; CTIA PN Comments at 29-30; CTIA NOI Comments at<br />
43.<br />
661 WTB ETF Letter to Verizon <strong>Wireless</strong>, n. 239.<br />
662 Letter from Kathleen Grillo, Senior Vice President, Federal Regulatory Affairs, Verizon, to Ruth Milkman,<br />
Chief, <strong>Wireless</strong> Telecommunications Bureau, <strong>FCC</strong>, and Mark Stone, Acting Chief, Consumer and Government<br />
Affairs Bureau, <strong>FCC</strong>, WT Docket No. 05-194, CG Docket No. 09-158 (Dec. 18, 2009).<br />
663 See, e.g., Letter from Joel Gurin, Chief, Consumer and Government Affairs Bureau, and Ruth Milkman, Chief,<br />
<strong>Wireless</strong> Telecommunications Bureau, <strong>FCC</strong>, to Kathleen Grillo, Senior Vice President, Federal Regulatory Affairs,<br />
Verizon, DA 10-136 (Jan. 26, 2010); Letter from Joel Gurin, Chief, Consumer and Government Affairs Bureau, and<br />
Ruth Milkman, Chief, <strong>Wireless</strong> Telecommunications Bureau, <strong>FCC</strong>, to Robert W. Quinn, Jr., Esq., Senior Vice<br />
President-Federal Regulatory, AT&T Services, Inc., DA 10-132 (Jan. 26, 2010); Letter from Joel Gurin, Chief,<br />
Consumer and Government Affairs Bureau, and Ruth Milkman, Chief, <strong>Wireless</strong> Telecommunications Bureau, <strong>FCC</strong>,<br />
to Thomas J. Sugrue, Vice President, Government Affairs, T-<strong>Mobile</strong>, DA 10-135 (Jan. 26, 2010); Letter from Joel<br />
Gurin, Chief, Consumer and Government Affairs Bureau, and Ruth Milkman, Chief, <strong>Wireless</strong> Telecommunications<br />
Bureau, <strong>FCC</strong>, to Vonya B. McCann, Esq., Senior Vice President, Government Affairs, Sprint Nextel Corporation,<br />
DA 10-137 (Jan. 26, 2010); and Letter from Joel Gurin, Chief, Consumer and Government Affairs Bureau, and Ruth<br />
Milkman, Chief, <strong>Wireless</strong> Telecommunications Bureau, <strong>FCC</strong>, to Richard S. Whitt, Esq., Washington Telecom and<br />
Media Counsel, Google, Inc., DA 10-133 (Jan. 26, 2010).<br />
664 Id.<br />
665 Id.<br />
135
Federal Communications Commission <strong>FCC</strong> 10-81<br />
description of how it set up its ETFs, the rationales for the fees, and what options consumers have to learn<br />
about the fees and manage their obligations. 666 All of the five companies responded by February 23,<br />
2010, describing their practices regarding disclosure of ETFs to consumers and stating generally that they<br />
give consumers adequate notice about the applicable ETFs that apply; that ETFs allow them to subsidize<br />
handset purchases — including purchases of smartphones — for customers; and that wireless providers<br />
normally recover those subsidies over the life of a contract, but cannot do so when a customer ends a<br />
contract early. 667<br />
237. Some providers offer service plans that do not have ETFs. For example, in addition to its<br />
multi-month plans with ETFs, Verizon <strong>Wireless</strong> also offers a month-to-month agreement with all of its<br />
nationwide pricing plans that allows customers to terminate their plans at the end of any month without<br />
paying an ETF. 668 Customers who choose Verizon <strong>Wireless</strong>’s new month-to-month option either<br />
purchase new devices from Verizon <strong>Wireless</strong> at the full retail price, or procure their own CDMA<br />
devices. 669 Another way that consumers can avoid ETFs entirely is to purchase mobile wireless service<br />
on a prepaid basis, instead of agreeing to enter into a long-term service contract. 670 In addition, the five<br />
largest mobile wireless service providers have all implemented various policies that allow subscribers to<br />
change elements of their service contracts without triggering the start of a new contract term, thus<br />
reducing the likelihood these subscribers will be affected by an ETF. 671<br />
238. The emergence of a secondary market segment for mobile wireless service contracts may<br />
also help promote competition by facilitating consumers’ ability to switch service providers. In most<br />
cases, wireless service providers allow customers to get out of their contracts without paying an ETF by<br />
transferring the remaining contract term to someone else who meets the provider’s credit requirements. 672<br />
A number of websites exist to facilitate transfers of mobile wireless contracts under these provisions. 673<br />
In particular, the websites help mobile wireless customers avoid paying penalties for early termination by<br />
666 Letter from Kathleen Grillo, Senior Vice President, Federal Regulatory Affairs, Verizon, to Joel Gurin, Chief,<br />
Consumer and Government Affairs Bureau, and Ruth Milkman, Chief, <strong>Wireless</strong> Telecommunications Bureau, <strong>FCC</strong>,<br />
CG Docket No. 09-158 (Feb. 23, 2010); Letter from Robert W. Quinn, Jr., Esq., Senior Vice President-Federal<br />
Regulatory, AT&T Services, Inc., dated Feb. 23, 2010 in CG Docket No. 09-158 to Joel Gurin, Chief, Consumer<br />
and Government Affairs Bureau, and Ruth Milkman, Chief, <strong>Wireless</strong> Telecommunications Bureau, <strong>FCC</strong>; Letter<br />
from Thomas J. Sugrue, Vice President, Government Affairs, T-<strong>Mobile</strong>, dated Feb. 23, 2010 in CG Docket No. 09-<br />
158 to Joel Gurin, Chief, Consumer and Government Affairs Bureau, and Ruth Milkman, Chief, <strong>Wireless</strong><br />
Telecommunications Bureau, <strong>FCC</strong>; Letter from Vonya B. McCann, Esq., Senior Vice President, Government<br />
Affairs, Sprint Nextel Corporation, dated Feb. 23, 2010 in CG Docket No. 09-158 to Joel Gurin, Chief, Consumer<br />
and Government Affairs Bureau, and Ruth Milkman, Chief, <strong>Wireless</strong> Telecommunications Bureau, <strong>FCC</strong>; and Letter<br />
from Richard S. Whitt, Esq., Washington Telecom and Media Counsel, Google, Inc., dated Feb. 23, 2010 in CG<br />
Docket No. 09-158 to Joel Gurin, Chief, Consumer and Government Affairs Bureau, and Ruth Milkman, Chief,<br />
<strong>Wireless</strong> Telecommunications Bureau, <strong>FCC</strong>.<br />
667 Id.<br />
668 No Contract Required – New Month-to-Month Agreement Gives Verizon <strong>Wireless</strong> Customers Even More<br />
Freedom, Press Release, Verizon <strong>Wireless</strong>, Sept. 22, 2008.<br />
669 Id.<br />
670 See Section IV.A.2, Prepaid Service, supra.<br />
671 See Section IV.A, Price Rivalry: Developments in <strong>Mobile</strong> Service Pricing Plans, supra.<br />
672 Lauren Tara Lacapra, Breaking Free of a Cellular Contract, WALL STREET JOURNAL, Nov. 30, 2006, at D1<br />
(Breaking Free of a Cellular Contract) (noting that this “loophole” in mobile phone contracts is available “to nearly<br />
all customers with long-term plans”).<br />
673 Several web-based services that are available include: cellswapper (available at www.cellswapper.com, visited<br />
Jan. 12, 2010); trademycellular (available at www.trademycellular.com, visited Jan. 12, 2010); celltradeusa<br />
(available at www.celltradeusa.com, visited Jan. 12, 2010); and cashmoneylife (available at www.cashmoneylife,<br />
visited Jan. 12, 2010).<br />
136
Federal Communications Commission <strong>FCC</strong> 10-81<br />
putting them in touch with people seeking a mobile wireless contract. Although these sites charge<br />
existing mobile wireless customers a range of fees to transfer or cancel a mobile wireless service contract,<br />
the fees to transfer a contract through these web sites generally are much lower than the ETFs customers<br />
would otherwise have to pay. 674 As an additional enticement to potential contract buyers, many contract<br />
sellers offer to transfer their mobile handsets free of charge. 675 In addition to a possible free handset,<br />
other potential advantages to contract buyers include avoiding a service activation fee and obtaining a<br />
shorter contract than if they had contracted directly with a mobile wireless service provider. Finally, at<br />
least one wireless service provider, Cellular South, offers to pay the ETF to entice a consumer to move to<br />
its network, thus eliminating the ETF as a cost of switching. 676<br />
3. Handsets, Handset Locking, and Handset Applications<br />
239. Another potential cost of switching to a new service provider is the cost of replacing the<br />
handset when a consumer wishes to change from one wireless service provider to another that employs a<br />
different air interface. Even if both providers employ the same underlying air interface, handset<br />
replacement may be necessary because there is also the fact that many handset models are produced to the<br />
specifications of a single wireless service provider to enable certain functionalities unique to that service<br />
provider.<br />
240. In addition, most handsets sold in the United States are “locked,” meaning that they<br />
normally will operate only on a single wireless network. Locking can prevent a consumer from taking a<br />
handset from one service provider to another, unless the handset is reprogrammed. 677 The ability of a<br />
consumer to unlock a handset varies depending on the service provider. For example, GSM operators<br />
have different policies regarding handset unlocking. Whereas T-<strong>Mobile</strong> will provide an “unlock code”<br />
after the subscriber account has been active at least 90 days so that the same handset can be used on<br />
another operator’s GSM network, 678 AT&T only releases unlock codes to subscribers under certain<br />
circumstances, and will not do so at all for iPhones. 679 CDMA handsets are more difficult to unlock<br />
because they do not use a removable Subscriber Identification Module (SIM) card and must be<br />
reprogrammed by CDMA provider in order to be unlocked. 680<br />
241. Another increasingly important switching cost associated with smartphones is the<br />
stranding of mobile applications purchased for a particular handset that cannot be transferred to or used<br />
on a new handset. <strong>Mobile</strong> applications are typically tied to a single mobile wireless operating system. As<br />
a result, if a consumer with a smartphone were to contemplate switching either to a new service provider<br />
or to new handset using a different operating system with the same service provider, she would likely<br />
consider the cost associated with reacquiring applications purchased for use on the current handset that<br />
674 See Breaking Free of a Cellular Contract.<br />
675 Id.<br />
676<br />
See Cellular South, Three Reasons to Switch to Cellular South,<br />
https://www.cellularsouth.com/switchnow/index.html (visited Jan. 14, 2010).<br />
677<br />
Some handset manufacturers directly sell unlocked handsets in their Internet shops and through non-provider<br />
retailers. See, e.g., the manufacturer Internet shops selling unlocked handsets at<br />
http://www.motorola.com/Consumers/US-EN/Home, http://www.nokiausa.com/ and<br />
https://www.google.com/phone/choose?locale=en_US&s7e=. See also, Section VII.B.1, <strong>Mobile</strong> <strong>Wireless</strong><br />
Handsets/Devices and Operating Systems, infra.<br />
678<br />
See T-<strong>Mobile</strong>, SIM Cards and Unlocking Your Phone, http://search.tmobile.com/inquiraapp/ui.jsp?ui_mode=question&question_box=unlock<br />
(visited Apr. 28, 2010).<br />
679<br />
See AT&T, Answer Center – What is the Unlock Code for My Phone?, http://www.wireless.att.com/answercenter/main.jsp?solutionId=55002&t=solutionTab<br />
(visited Apr. 28, 2010).<br />
680<br />
See Cell Phone Forums, Unlocking a CDMA Phone, http://cellphoneforums.net/general-cell-phoneforum/t206579-unlocking-cdma-phone.html<br />
(visited 3/8/2010).<br />
137
could not be used on the new handset.<br />
4. Number Portability<br />
Federal Communications Commission <strong>FCC</strong> 10-81<br />
242. Local number portability (LNP) refers to the ability of users of telecommunications<br />
services to retain, at the same location, existing telecommunications numbers when switching from one<br />
telecommunications carrier to another. 681 Subscribers can port numbers between two mobile wireless<br />
service providers (intramodal porting) or between a mobile wireless provider and wireline carrier<br />
(intermodal porting). 682<br />
243. Prior to the Commission’s actions to require local number portability, the cost and<br />
inconvenience to consumers of changing to a new telephone number was considered a significant barrier<br />
to switching, reducing the likelihood a consumer would move to a new service provider and thus<br />
impeding competition. Now that consumers can retain their telephone numbers within a given geographic<br />
area, this switching cost has been significantly reduced as a consideration in determining whether or not<br />
to change mobile wireless service providers. In fact, the average number of wireless subscribers per<br />
month porting their phone number from one mobile wireless provider to another has been steadily<br />
increasing over the past few years to approximately 1.2 million per month in 2008. 683<br />
B. Churn as a Measure of Consumer Switching Costs<br />
244. Churn refers to the percentage of current customers an operator loses over a given period<br />
of time, i.e., a company’s gross loss of customers during that time period. 684 <strong>Mobile</strong> wireless service<br />
providers usually express churn in terms of a percent of their subscribers per month. For example, an<br />
operator might report an average monthly churn of two percent, which is equivalent to the loss of about<br />
24 percent of its current customers per year.<br />
245. Most providers report churn rates for postpaid subscribers of between 1.5 percent and 3.3<br />
percent per month (see Chart 38). 685 Churn rates had been decreasing for a number of years; however, the<br />
trend has shown a slight increase over the last few quarters, with the nationwide providers averaging a<br />
monthly churn rate of two percent in the fourth quarter of 2008. 686 Prepaid subscriber churn is typically<br />
significantly higher, over four percent per month, as seen in the graph of “comparative churn” below.<br />
Churn is a significant expense for the mobile wireless industry. The magnitude of this expense can be<br />
estimated by multiplying the number of subscribers lost by the average cost to acquire a new subscriber.<br />
For example, using data for the end of 2008, AT&T lost an estimated 1.2 million subscribers per month,<br />
multiplied by its estimated average cost to acquire a new subscriber of $528.93, yielding an estimated cost<br />
681 47 C.F.R. § 52.21(l).<br />
682 Under the Commission’s rules and orders, covered mobile wireless providers operating in the 100 largest MSAs<br />
were required to begin providing number portability by November 24, 2003. <strong>Mobile</strong> wireless providers outside of<br />
the top 100 MSAs were required to be LNP-capable by May 24, 2004. 47 C.F.R § 52.31(a); Verizon <strong>Wireless</strong>’s<br />
Petition for Partial Forbearance From Commercial <strong>Mobile</strong> Radio Services Number Portability Obligation and<br />
Telephone Number Portability, Memorandum Opinion and Order, 17 <strong>FCC</strong> Rcd 14972, 14986, 31 (2002). In an<br />
October 2007 ruling, the Commission also expanded local number portability to VoIP, among other things.<br />
Telephone Number Requirements for IP-Enabled Services Providers, <strong>Report</strong> and Order, Declaratory Ruling, Order<br />
on Remand, and Notice of Proposed Rulemaking, 22 <strong>FCC</strong> Rcd 19531 (2007).<br />
683<br />
Craig Stroup and John Vu, Numbering Resource Utilization in the United States, <strong>FCC</strong>, Sept. 2009, at 35 (March<br />
2009 NRUF <strong>Report</strong>).<br />
684<br />
CTIA defines it as “a measure of the number of subscribers disconnecting from service during the period.” CTIA<br />
Mid-Year 2009 <strong>Wireless</strong> Indices <strong>Report</strong>, at 70.<br />
685 US <strong>Wireless</strong> 411 3Q09, at 20 (Table 16: Monthly Churn). See also, CTIA NOI Comments at 69.<br />
686<br />
US <strong>Wireless</strong> 411 3Q09, at 6. See also Eleventh <strong>Report</strong>, 21 <strong>FCC</strong> Rcd 10947 at 11005, 145 for reasons for the<br />
earlier decline.<br />
138
Federal Communications Commission <strong>FCC</strong> 10-81<br />
to replace the 1.2 million lost subscribers in a month of almost $652 million. 687<br />
Monthly Churn Percentage<br />
3.5%<br />
3.0%<br />
2.5%<br />
2.0%<br />
1.5%<br />
1.0%<br />
0.5%<br />
0.0%<br />
Chart 38<br />
Blended Churn <strong>Report</strong>ed by Four Nationwide Service Providers 688<br />
2005 2006 2007 2008 2Q 2009<br />
AT&T Mobility Sprint Nextel<br />
T-<strong>Mobile</strong> Verizon <strong>Wireless</strong><br />
Industry Wtd. Average<br />
246. Comparative Churn. Many service providers report churn for postpaid subscribers<br />
separately from prepaid subscribers. As can be seen in the following graph of comparative churn rates,<br />
prepaid subscribers are more likely than a post paid subscriber to terminate a relationship with a wireless<br />
service provider because they are not constrained by a contract. 689 Chart 39 helps to illustrate the trends<br />
in churn for different subscriber types.<br />
687 Wireline & <strong>Wireless</strong> Telecom Services, Bank of America/Merrill Lynch, Mar. 26, 2009, at 14.<br />
688 Data provided by Bernstein Research. Annual churn is an average for each of the four quarters. Verizon<br />
<strong>Wireless</strong> is combined with Alltel.<br />
689 Leap <strong>Wireless</strong> & Metro PCS: Low Cost Prepaid <strong>Wireless</strong>…A Survival Story; Initiating Coverage at Outperform,<br />
Bernstein Research, Dec 14, 2009.<br />
139
Monthly Churn Percentage<br />
6.0%<br />
5.0%<br />
4.0%<br />
3.0%<br />
2.0%<br />
1.0%<br />
0.0%<br />
Federal Communications Commission <strong>FCC</strong> 10-81<br />
Chart 39<br />
Comparative Churn 690<br />
2005 2006 2007 2008 2Q 2009<br />
Post-paid churn Pre-paid/reseller churn<br />
Total (Blended) Churn<br />
247. Subscriber Lifetime. Based on industry and reported service provider churn, one can<br />
also calculate the number of months an average subscriber is expected to remain a customer of a<br />
particular wireless service provider. This measure is referred to as the subscriber lifetime, and is<br />
calculated by dividing one by the monthly churn rate. Subscriber lifetime can also be used to derive<br />
ancillary subscriber metrics (such as Total Lifetime Revenue per user, and Lifetime revenues for voice<br />
and data revenues). As indicated by Table 23, the national weighted average lifetime of a subscriber to<br />
one of the four national providers has recently ranged between 48 and 56 months. 691 The lifetime of<br />
subscribers to prepaid service providers, such as Leap and MetroPCS, is significantly lower at a range of<br />
19 to 30 months for Leap and 17 to 25 months for Metro PCS, reflecting the higher churn rates<br />
experienced by these companies. 692<br />
690<br />
Data provided by Bernstein Research. Annual churn is an average for each of the four quarters. Verizon<br />
<strong>Wireless</strong> is combined with Alltel.<br />
691<br />
Calculation of Monthly Lifetime is based on Blended Churn, thus postpaid and prepaid churn calculations would<br />
provide different measures.<br />
692 Id.<br />
140
Federal Communications Commission <strong>FCC</strong> 10-81<br />
Table 23<br />
Lifetime of Subscribers (Months) 693<br />
1Q07 2Q07 3Q07 4Q07 1Q08 2Q08 3Q08 4Q08 1Q09 2Q09<br />
National Operators<br />
AT&T 59 63 59 59 59 63 59 63 63 67<br />
Verizon <strong>Wireless</strong> 91 77 77 83 77 83 71 67 67 71<br />
Sprint Nextel 43 48 43 42 37 48 45 45 45 48<br />
T-<strong>Mobile</strong> 38 37 34 36 38 37 33 30 32 32<br />
National Wtd. Average<br />
Regional/Other Operators<br />
56 56 53 53 48 53 50 50 53 56<br />
US Cellular 59 48 45 48 56 53 48 50 53 45<br />
Alltel 56 59 53 56 56 53 50 -- -- --<br />
Centennial Cellular 45 56 43 42 43 50 37 40 45 45<br />
Centennial PCS 37 42 42 38 42 40 38 36 34 34<br />
Cincinnati Bell 29 28 28 29 30 27 25 23 29 31<br />
Leap 29 23 19 24 28 26 23 26 30 23<br />
MetroPCS 25 21 19 21 25 22 21 20 20 17<br />
Regional/Other Wtd. Avg. 45 42 37 40 37 34 30 30 31 26<br />
Industry Wtd. Average 53 53 50 53 48 53 48 48 50 53<br />
248. Churn can serve as a reasonable proxy to measure whether or not consumer switching<br />
costs are detrimental to competition among mobile wireless service providers. 694 Churn rates indicate that<br />
approximately one quarter of customers switch their service providers each year, thereby providing some<br />
indication that some customers are not locked in, although all consumers may incur costs when switching<br />
service providers.<br />
693 US <strong>Wireless</strong> 411 2Q09; Commission estimates.<br />
694 Mercatus NOI Comments at 11.<br />
141
Federal Communications Commission <strong>FCC</strong> 10-81<br />
VII. INPUT AND DOWNSTREAM SEGMENTS OF THE MOBILE WIRELESS<br />
ECOSYSTEM<br />
A. Input Segments<br />
249. In the following sections, we consider key factors of production of wireless services. We<br />
examine whether and how such “upstream” or input segments, including spectrum, infrastructure and<br />
backhaul facilities, affect market performance. As we observe below, these critical input segments may<br />
affect competition in the provision of mobile wireless service.<br />
1. Spectrum<br />
250. In this section, we briefly describe the Commission’s allocation and licensing of<br />
commercial wireless spectrum that is used for the provision of mobile voice, and mobile broadband and<br />
other data services. We then provide an overview of the overall spectrum holdings among different<br />
providers. We also discuss how spectrum in different frequency bands can affect an operator’s ability to<br />
provide broadband service.<br />
a. Availability of <strong>Mobile</strong> <strong>Wireless</strong> Services Spectrum<br />
251. Access to spectrum is a precondition to the provision of mobile wireless service.<br />
Ensuring that sufficient spectrum is available for incumbent licensees, as well as for entities that need<br />
spectrum to enter the market, is critical for promoting competition, investment, and innovation.<br />
Incumbent licensees may need additional spectrum to increase their coverage or capacity as they grow<br />
their subscriber bases and meet increasing demand, while new entrants need access to spectrum to enter<br />
the market and compete with established licensees. Through the years, the Commission has increased the<br />
amount of spectrum available for the provision of mobile wireless services. This spectrum has been made<br />
available in different frequency bands, in different bandwidths and licensing areas.<br />
252. Currently, mobile wireless operators primarily use licenses associated with three different<br />
frequency bands to provide mobile voice and, in most cases, mobile data services: Cellular (in the 850<br />
MHz band), SMR (in the 800/900 MHz band), and broadband PCS (in the 1.9 GHz band). Over the past<br />
several years, additional spectrum bands have become available – BRS/EBS in the 2.5 GHz band, AWS<br />
in the 1.7/2.1 GHz band, and the 700 MHz band – which are beginning to enable the provision of<br />
additional and competitive voice and mobile data services. 695 By examining the history of the available<br />
frequency bands and associated service rules, it is possible to trace the growth of the mobile wireless<br />
industry and the introduction of new competition in the mobile wireless marketplace. .696<br />
(i) Frequency Bands<br />
253. Cellular. The Commission began licensing Cellular spectrum in 1982, eventually<br />
making a total of 50 megahertz available. The band was divided into two blocks, licensed by Cellular<br />
Market Area (CMA). At the time of initial licensing, one of the two cellular channel blocks in each<br />
market was awarded to a local incumbent wireline carrier, while the other block was awarded to another<br />
entity in order to promote competition. The Commission completed licensing the majority of cellular<br />
operators in 1991. Cellular licensees provided the first widely-used mobile services. 697 Historically, they<br />
have held much of the share of mobile services provided in most markets across the country.<br />
254. SMR. By the early 1990s, mobile voice services were also provided using approximately<br />
695 A more detailed description of spectrum available for mobile wireless service is provided in Appendix A. There<br />
are other bands – including 2.3 GHz (WCS), 1670-1675 MHz, and 901-902 MHz (Narrowband PCS) – that are<br />
licensed under the Commission’s flexible Part 27 or Part 24 rules and can be used to provide CMRS. Appendix A<br />
also includes a discussion of the 3650-3700 MHz band, which can be used to provide wireless broadband service.<br />
696 Appendix A of this <strong>Report</strong> provides a more detailed discussion of these frequency bands.<br />
697 See Third <strong>Report</strong>, 13 <strong>FCC</strong> Rcd at 19749, 19779, pp. 3, 29.<br />
142
Federal Communications Commission <strong>FCC</strong> 10-81<br />
20 megahertz of SMR spectrum in the 800 and 900 MHz bands. The Commission had established SMR<br />
in 1974 to provide for land mobile communications on a commercial basis. The Commission initially<br />
licensed SMR spectrum in non-contiguous bands, on a site-by-site basis. 698 The Commission has since<br />
licensed additional SMR spectrum on an EA basis, through the auction process. Although the primary<br />
use for SMR traditionally was dispatch services, 699 providers such as Nextel acquired significant amounts<br />
of SMR spectrum and were successful in launching mobile telephony services in the 1990s, which<br />
competed with licensees using cellular spectrum in the provision of mobile telephony services. 700<br />
255. Broadband PCS. Between 1995 and 1999, the Commission auctioned 120 megahertz of<br />
broadband PCS, in different bandwidths and licensing areas, in the 1850-1910 MHz and 1930-1990 MHz<br />
bands. More efficient digital wireless technologies had been developed, representing an advancement<br />
over existing analog cellular networks. This newly available spectrum facilitated the growth and<br />
development of a more competitive mobile wireless marketplace. By 1998, 87 percent of the U.S.<br />
population (by Basic Trading Area) was served by three or more providers, and 54 percent by five or<br />
more providers; 701 by 2008, 96 percent of the U.S. population (by census block) was served by three or<br />
more providers, and 65 percent by five or more. 702 Between 1995 and 2008, the price per minute of<br />
mobile wireless service dropped 84 percent, 703 while the number of subscribers increased over 700<br />
percent. 704 With increased competition came increased innovation: broadband PCS service providers<br />
offered new pricing plans, introduced smaller handsets with increased functionality, and facilitated mass<br />
market acceptance of mobile wireless service. This heightened competition and investment was fueled by<br />
the great investment made by the mobile industry during this timeframe: cumulative investment in the<br />
industry more than tripled from $19 billion to over $70 billion from 1994 to 2000, 705 and the number of<br />
cell sites more than quadrupled, from 18,000 to over 80,000. 706<br />
256. BRS and EBS. In 2004, the Commission adopted revisions to the rules and band plan<br />
governing BRS and EBS in the 2.5 GHz band that restructured this band to facilitate the use of this<br />
spectrum, totaling approximately 194 megahertz, for mobile and fixed broadband services. 707 Since then,<br />
BRS and EBS licensees have been transitioning to the revised band plan, a process that is nearly<br />
complete. In 2008, Clearwire began deploying mobile broadband services using this spectrum in various<br />
698 The “900 MHz” SMR band refers to spectrum allocated in the 896-901 and 935-940 MHz bands; the “800 MHz”<br />
band refers to spectrum allocated in the 806-824 and 851-869 MHz bands. See 47 C.F.R. § 90.603; see also 47<br />
C.F.R. § 90.7 (defining “specialized mobile radio system”).<br />
699 Dispatch services allow two-way, real-time, voice communications between fixed units and mobile units (e.g.,<br />
between a taxicab dispatch office and a taxi) or between two or more mobile units (e.g., between a car and a truck).<br />
See Fifth <strong>Report</strong>, 15 <strong>FCC</strong> Rcd at 17727-28, for a detailed discussion.<br />
700 Nextel and Sprint combined their spectrum holdings in a merger completed in 2005, becoming Sprint Nextel<br />
Corporation. See http://www.sprint.com/companyinfo/history/ (visited Mar. 8, 2010).<br />
701 See Third <strong>Report</strong>, 13 <strong>FCC</strong> Rcd at 19768, p. B-4, Table 3A (1998).<br />
702 See Thirteenth <strong>Report</strong>, 24 <strong>FCC</strong> Rcd at 6210, 40, Table 1.<br />
703 See id. at 6277, 193, Table 12 (2009).<br />
704 See id. at 6314, Table A-1 (2009).<br />
705 CTIA Year-End 2008 <strong>Wireless</strong> Indices <strong>Report</strong>, at 126.<br />
706 Id. at 150.<br />
707 Since the release of the Thirteenth <strong>Report</strong>, the Commission completed Auction 86, which offered 78 BRS<br />
licenses: 75 licenses covering various Basic Trading Areas (BTAs), including one partial BTA, and 3 licenses<br />
covering BRS service areas in the Gulf of Mexico. The Commission completed the auction on October 30, 2009.<br />
See “Auction of Broadband Radio Service Licenses Closes; Winning Bidders Announced for Auction 86,” Public<br />
Notice, 24 <strong>FCC</strong> Rcd 13572 (2009).<br />
143
markets across the country. 708<br />
Federal Communications Commission <strong>FCC</strong> 10-81<br />
257. AWS. In 2006, the Commission auctioned a total of 90 megahertz of AWS spectrum.<br />
Since 2008, several licensees (e.g., T-<strong>Mobile</strong>, MetroPCS, and Leap) have begun to deploy AWS services<br />
across the country. 709 Several other major holders from the 2006 auction (e.g., Verizon <strong>Wireless</strong>, AT&T,<br />
and SpectrumCo) have not yet announced deployment plans for this spectrum.<br />
258. 700 MHz. The auctions of 700 MHz spectrum in 2003 and 2008, combined with the<br />
completion of the Digital Television transition in June 2009, have made an additional 74 megahertz of<br />
spectrum available for mobile and fixed commercial services. 710 Of this total, 58 megahertz is paired<br />
spectrum with sufficient channel widths to support mobile broadband. Beginning in 2010, Verizon<br />
<strong>Wireless</strong>, AT&T, and other licensees of 700 MHz spectrum are expected to begin rolling out services for<br />
mobile broadband in this band. 711<br />
259. Other Spectrum Bands. Other spectrum bands that are potentially available for the<br />
provision of mobile voice and broadband services include spectrum in the <strong>Wireless</strong> Communications<br />
Service (WCS) in the 2.3 GHz band, the 1.4 GHz band, and the 1670-1675 MHz band, 712 as well as MSS<br />
spectrum. 713 These bands are not discussed further here because, as yet, services offered in these bands<br />
do not impact competition in mobile wireless services.<br />
708 See Section IV.B.1.a, Service Provider Technology Deployments, supra.<br />
709 As mentioned in the Thirteenth <strong>Report</strong>, T-<strong>Mobile</strong> had launched HSPA service, using its AWS spectrum, in 13<br />
major U.S. markets as of September 2008. As of August 2009, T-<strong>Mobile</strong>’s HSPA network covered 121 million<br />
people in 176 cities, with anticipated coverage of 200 million people in an additional 100 cities by the end of 2009.<br />
MetroPCS has announced that it plans to begin deploying LTE beginning in the second half of 2010 using its AWS<br />
spectrum licenses. See Section IV.B.1.a, Service Provider Technology Deployments, supra.<br />
710 The 74 megahertz includes 4 megahertz of spectrum in the 700 MHz Guard Bands, which are not included in<br />
Table 24. Portions of the lower 700 MHz band were auctioned previously in Auctions 44, 49, and 60. See Tenth<br />
<strong>Report</strong>, 20 <strong>FCC</strong> Rcd at 15940, 80. The Digital Television transition ensured that the 700 MHz spectrum was<br />
cleared of broadcast use, and thus made available for commercial mobile services, no later than June 12, 2009.<br />
711 See Section IV.B.1.a, Service Provider Technology Deployments, supra, for a discussion of technological<br />
deployments in recently-licensed mobile wireless frequency bands.<br />
712 See Appendix A for additional discussion of WCS, the 1.4 GHz band, and the 1670-1675 MHz band.<br />
713 See Section III.B.4, <strong>Mobile</strong> Satellite Service Providers, supra, for a discussion of MSS.<br />
144
Federal Communications Commission <strong>FCC</strong> 10-81<br />
Table 24<br />
Flexible Use Spectrum Usable for <strong>Mobile</strong> <strong>Wireless</strong> Services 714<br />
Spectrum Band Megahertz (Rounded)<br />
Cellular 50<br />
SMR* 19<br />
Broadband PCS 120<br />
AWS-1 90<br />
700 MHz 70<br />
BRS/EBS** 194<br />
WCS 20<br />
1.4 and 1.6 GHz 13<br />
1910-15/1990-95 MHz*** 10<br />
* Includes post-800 MHz Band Reconfiguration ESMR spectrum at 817-824 MHz and 862-869 MHz.<br />
**BRS/EBS spectrum is calculated based on the post-transition band plan described in 47 C.F.R. §27.5(i)(2). EBS<br />
licenses must be held by educational institutions; however, EBS licensees can lease a significant portion of their<br />
spectrum to commercial operators.<br />
*** Held by Sprint Nextel as a result of the 800 MHz Band Reconfiguration.<br />
(ii) Facilitating Access to Spectrum Among Multiple Providers<br />
260. In addition to increasing the availability of commercial mobile wireless spectrum, the<br />
Commission has had different policies relating to service and technical rules, licensing and assignment,<br />
and spectrum aggregation that have affected market entry. We discuss here several prominent<br />
Commission policies that have affected spectrum holdings over the past two decades.<br />
261. Flexible Use Policies. Initially, the Commission’s rules restricted the use of cellular<br />
spectrum to analog service. More recently, the Commission has adopted a general policy of providing<br />
licensees with significant flexibility to decide which services to offer and what technologies to deploy on<br />
spectrum used for the provision of mobile wireless services. For example, licensees have the flexibility to<br />
deploy next-generation wireless technologies that allow them to offer high-speed mobile data services<br />
using their existing spectrum. 715<br />
262. Spectrum Aggregation. The Commission has adopted different policies through the years<br />
with regard to aggregation of commercial mobile spectrum. As mentioned above, when first licensing 50<br />
megahertz of Cellular spectrum, the Commission required that two different Cellular licensees serve each<br />
local market in order to promote competition between mobile telephony providers. In 1994, as the<br />
Commission prepared to make an additional 120 megahertz of spectrum available through broadband<br />
PCS auctions, it adopted a CMRS spectrum cap as a means to preserve competitive opportunities in the<br />
mobile communications marketplace, retain incentives for innovation, and promote the efficient use of<br />
spectrum. 716 Under these CMRS spectrum aggregation limits, which were modified in 1999, no entity<br />
could control more than 45 megahertz of Cellular, SMR, and broadband PCS spectrum (which altogether<br />
714 This table only includes the terrestrial, flexible use frequency bands discussed in this section of the <strong>Report</strong>.<br />
715 47 C.F.R § 24.3.<br />
716 Implementation of Sections 3(n) and 332 of the Communications Act, Third <strong>Report</strong> and Order, 9 <strong>FCC</strong> Rcd 7988,<br />
7999, 8100-8110, 16, 238-265 (1994) (CMRS Third <strong>Report</strong> and Order). In adopting spectrum aggregation limits,<br />
the Commission was “recognizing the possibility that mobile service licensees might exert undue market power or<br />
inhibit market entry by other service providers if permitted to aggregate large amounts of spectrum.” Id. at 8100 <br />
239. It stated that if firms were to aggregate sufficient amounts of spectrum, it is possible that they could<br />
unilaterally or in combination exclude efficient competitors, reduce the quality of service available to the public, and<br />
increase prices to the detriment of consumers. Id. at 8104 248.<br />
145
Federal Communications Commission <strong>FCC</strong> 10-81<br />
totaled approximately 190 megahertz) in any given cellular market. 717 The Commission eliminated the<br />
spectrum cap beginning in 2003, moving instead to a case-by-case market analysis of proposed merger<br />
transactions to address potential competitive concerns if providers sought to aggregate their spectrum<br />
holdings in particular markets. 718<br />
263. Spectrum Screen. In 2004, the Commission adopted a “spectrum screen” to assist in its<br />
analysis of potential competitive concerns raised by transactions in which providers were aggregating<br />
spectrum. This screen identified particular markets in which the spectrum aggregation exceeded a predetermined<br />
amount of spectrum, set at approximately one-third of the critical spectrum input. 719 In those<br />
markets, the Commission conducted further analysis to determine whether sufficient spectrum capacity<br />
would be available to other providers to compete effectively; in markets where this would not be the case,<br />
the Commission required divestiture of spectrum. 720 As additional spectrum has become available in<br />
recent years, the Commission has continued to revise its policies for analyzing spectrum aggregation,<br />
including modifications to its spectrum screen, as it seeks to ensure competition in the provision of<br />
mobile wireless services. 721<br />
264. Secondary Market Transactions and Spectrum Leasing. The Commission also has<br />
adopted secondary market policies to facilitate spectrum access. Subject to the Commission’s approval,<br />
which includes review of spectrum aggregation for potential competitive harm, licensees may buy and<br />
sell licenses, in whole or in part (through partitioning and/or disaggregation), on the secondary market. In<br />
2003, as part of its secondary market policies, the Commission adopted rules to permit mobile wireless<br />
licensees to lease all or a portion of their spectrum usage rights for any length of time within the license<br />
term, and over any geographic area encompassed by the license. 722 Further, the Commission’s secondary<br />
markets policies also allow licensees to enter into “dynamic” leasing arrangements, where the licensee<br />
and spectrum lessee can share use of the same spectrum through the use of cognitive radio<br />
technologies. 723 The Commission’s secondary market policies allow existing licensees to obtain<br />
717 CMRS Third <strong>Report</strong> and Order, 9 <strong>FCC</strong> Rcd at 8105-8110, 252-265. See also 1998 Biennial Regulatory<br />
Review, Spectrum Aggregation Limits for <strong>Wireless</strong> Telecommunications Carriers, WT Docket No. 98-205, <strong>Report</strong><br />
and Order, 15 <strong>FCC</strong> Rcd 9219, 9254-57 80-84 (2000). The CMRS spectrum cap only covered services that had<br />
spectrum of 5 megahertz or more (thus excluding narrowband CMRS) in order to ensure that providers using the<br />
spectrum could compete with one another. CMRS Third <strong>Report</strong> and Order, 9 <strong>FCC</strong> Rcd at 8105 252. For the<br />
purposes of calculating spectrum holdings under the CMRS cap, the Commission counted SMR spectrum as 10<br />
megahertz. Id. at 8113-14 275. In 1999, the Commission raised the CMRS spectrum cap to 55 megahertz in rural<br />
market areas (RSAs). Biennial Regulatory Review, Spectrum Aggregation Limits for <strong>Wireless</strong> Telecommunications<br />
Carriers, <strong>Report</strong> and Order, 15 <strong>FCC</strong> Rcd 9219, 9256-57 (1999).<br />
718 See 2000 Biennial Regulatory Review – Spectrum Aggregation Limits for Commercial <strong>Mobile</strong> Radio Services,<br />
WT Docket No. 01-14, <strong>Report</strong> and Order, 16 <strong>FCC</strong> Rcd 22668, 22669-71 2-6 (2001) (Second Biennial Review<br />
Order). The Commission also raised the spectrum cap to 55 megahertz in all markets during the sunset period. Id. at<br />
22671 6.<br />
719 Applications of AT&T <strong>Wireless</strong> Services, Inc. and Cingular <strong>Wireless</strong> Corporation For Consent to Transfer<br />
Control of Licenses and Authorizations, Memorandum Opinion and Order, 19 <strong>FCC</strong> Rcd 21522, 21568-69 109<br />
(2004).<br />
720 Id. at 21620-21, 255.<br />
721 See, e.g., AT&T-Dobson Order, 22 <strong>FCC</strong> Rcd at 20311, 26-30; Verizon <strong>Wireless</strong>-ALLTEL Order, 23 <strong>FCC</strong> Rcd<br />
at 17473, 53; Sprint Nextel-Clearwire Order, 23 <strong>FCC</strong> Rcd at 17591, 53.<br />
722 Ninth <strong>Report</strong>, 19 <strong>FCC</strong> Rcd at 20631, 84.<br />
723 Promoting Efficient use of Spectrum Through Elimination of Barriers to the Development of Secondary Markets,<br />
WT Docket No. 00-230, Second <strong>Report</strong> and Order, Order on Reconsideration, and Second Further Notice of<br />
proposed Rulemaking, 19 <strong>FCC</strong> Rcd 17503, 17547-49 87-90 (2004) (Secondary Markets Second R&O); Service<br />
Rules for the 698-746, 747-762 and 777-792 MHz Bands; Implementing a Nationwide, Broadband, Interoperable<br />
(continued….)<br />
146
Federal Communications Commission <strong>FCC</strong> 10-81<br />
additional spectrum capacity and expand their coverage areas to better meet the needs of their customers,<br />
while also providing new entrants with additional opportunities to access to spectrum so that they can<br />
compete.<br />
b. Analysis of Spectrum Holdings Overall<br />
265. Because spectrum is a key input to the provision of mobile wireless service, the different<br />
spectrum holdings of major providers potentially affect their ability to compete. These spectrum holdings<br />
include licenses obtained when the spectrum was first licensed for mobile services, such as through the<br />
original Cellular assignments or through the auction process (e.g., PCS, AWS, or 700 MHz spectrum), as<br />
well as spectrum obtained through various secondary market transactions. As the tables and charts below<br />
illustrate, several wireless providers hold significant amounts of spectrum that is usually considered<br />
viable for mobile service. 724<br />
266. Verizon <strong>Wireless</strong> and AT&T each hold significant amounts of 700 MHz, Cellular,<br />
broadband PCS, and AWS spectrum. Sprint Nextel holds SMR spectrum, acquired through its merger<br />
with Nextel in 2005, as well as substantial holdings of PCS licenses. T-<strong>Mobile</strong>’s spectrum holdings are in<br />
both the PCS and AWS bands. 725 Regional provider US Cellular holds Cellular, PCS, and AWS licenses,<br />
while MetroPCS and Leap chiefly hold PCS and AWS spectrum. Unlike the rest, Clearwire, which is<br />
affiliated with Sprint Nextel, 726 has holdings in the 2.5 GHz band, where it holds the predominant amount<br />
of BRS spectrum, and has access to much EBS spectrum through leasing arrangements. Finally, as the<br />
charts below reveal, smaller providers also hold Cellular, 700 MHz, PCS, and AWS licenses in parts of<br />
the United States.<br />
267. Table 25 reveals that five providers together – Verizon <strong>Wireless</strong>, AT&T, T-<strong>Mobile</strong>, as<br />
well as Sprint Nextel and Clearwire – hold more than 80 percent of all of the spectrum, measured on a<br />
MHz-POPs basis, that is suitable for the provision of mobile wireless services. Table 26 shows<br />
megahertz holdings for each provider, weighted by population. Finally, Chart 40 is a graph of providers’<br />
spectrum holdings by frequency band, measured on a MHz-POPs basis.<br />
(Continued from previous page)<br />
Public Safety Network in the 700 MHz Band, WT Docket Nos. 06-150, PS Docket No. 06-229, Second <strong>Report</strong> and<br />
Order, 22 <strong>FCC</strong> Rcd 15289, 15374-80 231-248 (2007).<br />
724 See infra Tables 25-26 and Charts 40-41. The data in these tables and charts generally reflect transactions<br />
through 2009. They include the AT&T/Centennial transaction as well as the divestitures required as part of the<br />
Verizon <strong>Wireless</strong>-Alltel transaction. With respect to the Verizon <strong>Wireless</strong>-Alltel divestitures, licenses that were<br />
divested have been included in the “Other” category.<br />
725 T-<strong>Mobile</strong> holds a very small amount of spectrum below 1 GHz.<br />
726 See Section III.E.1, Entry, supra.<br />
147
Licensee<br />
Federal Communications Commission <strong>FCC</strong> 10-81<br />
Table 25<br />
Percentage Spectrum Holdings, Measured on a MHz-POPs Basis<br />
by Provider, by Frequency Band*<br />
(Providers Listed by Number of Subscribers as of 2Q 2009)<br />
700<br />
MHz<br />
Cellular<br />
(850<br />
MHz)<br />
SMR<br />
(800/900<br />
MHz)<br />
148<br />
PCS<br />
(1.9 GHz)<br />
AWS<br />
(1.7/2.1<br />
GHz)<br />
BRS<br />
(2.5 GHz)<br />
EBS<br />
Leases<br />
(2.5 GHz)<br />
Verizon <strong>Wireless</strong> 42.7% 48.5% 0.0% 15.4% 15.0% 0.0% 0.0%<br />
AT&T 24.3% 42.3% 0.0% 25.9% 11.2% 0.0% 0.0%<br />
Sprint Nextel 0.0% 0.0% 93.0%* 26.8% 0.0% 0.0% 0.0%<br />
T-<strong>Mobile</strong> 0.0% 0.0%** 0.0% 19.7% 27.5% 0.0% 0.0%<br />
MetroPCS 0.5% 0.0% 0.0% 2.6% 5.9% 0.0% 0.0%<br />
US Cellular 2.7% 4.3% 0.0% 1.8% 2.0% 0.0% 0.0%<br />
Leap 0.0% 0.0% 0.0% 2.3% 8.8% 0.0% 0.0%<br />
Other 29.8% 4.9% 7.0%* 5.5% 29.6% 13.7%* 38.0%*<br />
Clearwire 0.0% 0.0% 0.0% 0.0% 0.0% 86.3%* 62.0%*<br />
Grand Total 100.0% 100.0% 100.0% 100.0% 100.0% 100.0% 100.0%<br />
* These are estimates based on the available data.<br />
** T-<strong>Mobile</strong> holds a very small amount of Cellular spectrum.<br />
Table 26<br />
Population-Weighted Average Megahertz Holdings*<br />
by Provider, by Frequency Band<br />
(Providers Listed by Number of Subscribers as of 2Q 2009)<br />
Licensee<br />
700<br />
MHz Cellular SMR PCS AWS BRS EBS<br />
Verizon <strong>Wireless</strong> 29.9 24.3 0.0 20.0 13.5 0.0 0.0<br />
AT&T 17.0 21.2 0.0 33.7 10.1 0.0 0.0<br />
Sprint Nextel 0.0 0.0 17.7 34.8 0.0 0.0 0.0<br />
T-<strong>Mobile</strong> 0.0 0.0** 0.0 25.6 24.8 0.0 0.0<br />
MetroPCS 0.4 0.0 0.0 3.4 5.3 0.0 0.0<br />
US Cellular 1.9 2.2 0.0 2.3 1.8 0.0 0.0<br />
Leap 0.0 0.0 0.0 3.0 7.9 0.0 0.0<br />
Other 20.9 2.5 1.3 7.2 26.6 10.1 42.8<br />
Clearwire 0.0 0.0 0.0 0.0 0.0 63.4 69.8<br />
* Weighted average megahertz is the sum of the provider’s MHz-POPs, divided by the U.S. population.<br />
** T-<strong>Mobile</strong> holds a very small amount of Cellular spectrum.
MHz-Pops (Billions)<br />
40<br />
35<br />
30<br />
25<br />
20<br />
15<br />
10<br />
5<br />
0<br />
Verizon<br />
<strong>Wireless</strong><br />
Federal Communications Commission <strong>FCC</strong> 10-81<br />
Chart 40<br />
<strong>Mobile</strong> <strong>Wireless</strong> Provider Spectrum Holdings by Band<br />
Weighted by Population<br />
AT&T Sprint<br />
Nextel<br />
T-<strong>Mobile</strong> MetroPCS US<br />
Cellular<br />
149<br />
EBS<br />
BRS<br />
AWS<br />
PCS<br />
SMR<br />
Cellular<br />
700 MHz<br />
Leap Other Clearwire<br />
c. Analysis of Spectrum Holdings by Spectrum Characteristics<br />
268. In addition to considering the quantity of spectrum to which providers have access, we<br />
also consider the characteristics of particular spectrum that is available for licensing and assignment.<br />
Two licensees may hold equal quantities of bandwidth but nevertheless hold very different spectrum<br />
assets. As discussed below, it has long been recognized that spectrum resources in different frequency<br />
bands can have widely disparate technical characteristics. In particular, in the United States, there are<br />
frequency bands suitable for mobile broadband services at very different frequencies: the 700 MHz and<br />
Cellular (850 MHz) bands fall below 1 GHz, 727 and the AWS, PCS, and BRS/EBS bands – at around 2<br />
and 2.5 GHz – are well above 1 GHz. The different propagation characteristics of these bands impact<br />
how they can be used to deliver mobile services to consumers. Bidders in recent auctions in the United<br />
States also appear to have recognized these differences, which helps explain the significantly different<br />
prices per MHz-POP in the AWS-1 and 700 MHz auctions. There may be important complementarities<br />
associated with a provider having access to spectrum in both the lower and higher frequency bands. Not<br />
only has the Commission recognized these differences in past proceedings, but regulators in other<br />
countries have also adopted policies taking these differences into account as additional spectrum becomes<br />
available.<br />
269. Lower frequency bands – such as the 700 MHz and Cellular bands – possess more<br />
727 Although SMR spectrum also falls below 1 GHz, broadband operations using this spectrum have not been shown<br />
to be viable pending completion of 800 MHz rebanding, as noted in the National Broadband Plan, given the<br />
interference protection provided to neighboring public safety operations per 47 CFR § 90.672. See National<br />
Broadband Plan, Chapter 5 n. 63. In addition, the commercial SMR spectrum in the 900 MHz band currently is<br />
interleaved with Business/Industrial/Land Transportation services, and thus is best suited for narrowband<br />
deployments.
Federal Communications Commission <strong>FCC</strong> 10-81<br />
favorable intrinsic spectrum propagation characteristics than spectrum in higher bands. 728 “Low-band”<br />
spectrum can provide superior coverage over larger geographic areas, through adverse climate and terrain,<br />
and inside buildings and vehicles. As the Commission has noted in the 700 MHz band proceeding, this<br />
lower frequency spectrum had “excellent propagation” characteristics that, in contrast to higher frequency<br />
bands such as PCS and AWS spectrum, “make it ideal for delivering advanced wireless services to rural<br />
areas.” 729 Several commenters in this and related proceedings also have noted the advantages of lower<br />
frequency spectrum for coverage and penetration. 730 In its consideration of mobile wireless competition<br />
issues, DOJ has noted the differences between the use of lower and higher frequency bands. 731<br />
Regulators in other countries also have recognized the distinctive characteristics between lower and<br />
higher frequency bands. As lower frequency spectrum is becoming available for mobile services in other<br />
countries, some regulators are adopting policies intended to help facilitate the wider distribution of this<br />
newly available spectrum. 732 Low-band spectrum is sometimes referred to as “beachfront” spectrum<br />
given its superior propagation features. 733<br />
728 See, e.g., Service Rules for the 698-746, 747-762, and 777-792 MHz Bands, WT Docket No. 06-150, 22 <strong>FCC</strong><br />
Rcd 15289, 15349 158, 15354-55 176, 15400-401 304 (2007) (700 MHz Band Second R&O) (recognizing the<br />
excellent propagation characteristics of 700 MHz band spectrum); White Spaces <strong>Report</strong> and Order, 23 <strong>FCC</strong> Rcd at<br />
16807, 16820-21 32 (propagation characteristics of the TV bands enable service at greater ranges than in the<br />
2.4GHz band).<br />
729 See, e.g., 700 MHz Band Second R&O, 22 <strong>FCC</strong> Rcd at 15349, 158.<br />
730 See, e.g., NTELOS comments at 9 (Cellular and 700 MHz licenses are the “optimum spectrum ranges for<br />
delivering mobile services”); Letter from Kathleen O’Brien Ham, T-<strong>Mobile</strong>, to Marlene H. Dortch, Secretary, <strong>FCC</strong>,<br />
WT Docket No. 09-66 (filed Nov. 25, 2009) (T-<strong>Mobile</strong> Nov. 25, 2009 Ex Parte Letter), Attachment at 8-9; Letter<br />
from Kathleen O’Brien Ham, T-<strong>Mobile</strong>, to Marlene H. Dortch, Secretary, <strong>FCC</strong>, WT Docket No. 09-66 (filed Apr.<br />
26, 2010) (T-<strong>Mobile</strong> Apr. 26, 2010 Ex Parte Letter); Letter from Tamara Preiss, Verizon <strong>Wireless</strong>, to Marlene H.<br />
Dortch, Secretary, <strong>FCC</strong>, WT Docket No. 09-66 (filed May 12, 2010) (Verizon <strong>Wireless</strong> May 12, 2010 Ex Parte<br />
Letter), at 2; Comcast Comments, GN Docket No. 09-157 (filed Sept. 30, 2009), at 9-12.<br />
731 See United States of America et al. v. Verizon Communications Inc. and ALLTEL Corporation, Competitive<br />
Impact Statement, Case No. 08-cv-1878, at 5-6 (filed Oct. 30, 2008), available at<br />
http://www.justice.gov/atr/cases/f238900/238947.pdf (“. . . because of the characteristics of PCS spectrum,<br />
providers holding this type of spectrum generally have found it less attractive to build out in rural areas.”); United<br />
States of America v. AT&T Inc. and Dobson Communications Corporation, Competitive Impact Statement, Case<br />
No. 1:07-cv-01952, at 5, 11, 13 (filed Oct. 30, 2007), available at<br />
http://www.justice.gov/atr/cases/f227300/227309.pdf (“ . . . the propagation characteristics of [1900 MHz PCS]<br />
spectrum are such that signals extend to a significantly smaller area than do 800 MHz cellular signals. The<br />
relatively higher cost of building out 1900 MHz spectrum, combined with the relatively low population density of<br />
the areas in question, make it unlikely that competitors with 1900 MHz spectrum will build out their networks to<br />
reach the entire area served by” the two 800 MHz Cellular providers).<br />
732 For instance, in its auction of mobile spectrum that began in April of 2010, Germany has placed restrictions on<br />
the amount of sub-1GHz spectrum (in the 800 MHz band) that any mobile service provider could obtain, depending<br />
on how much sub-1 GHz spectrum a particular mobile provider already holds. See Decision of the President’s<br />
Chamber of the Federal Network Agency for Electricity, Gas, Telecommunications, Post, and Railway, Oct. 16,<br />
2009, at 6, 9 available at<br />
http://www.bundesnetzagentur.de/cae/servlet/contentblob/138364/publicationFile/3682/DecisionPresidentChamberT<br />
enor_ID17495pdf.pdf. In March 2010, the United Kingdom (UK) Government similarly proposed a spectrum cap<br />
for the upcoming auction of sub-1 GHz spectrum (in the 800 MHz band). Draft Statutory Instruments, The<br />
<strong>Wireless</strong> Telegraphy Act 2006 (Directions to OFCOM), Mar. 2010, at 5, available at<br />
http://www.opsi.gov.uk/si/si2010/draft/pdf/ukdsi_9780111497319_en.pdf. The UK Government also proposed that<br />
there be a spectrum cap on total mobile services spectrum that any provider could hold.<br />
733 See, e.g., T-<strong>Mobile</strong> April 26, 2010 Ex Parte Letter (stating that lower band spectrum is widely considered<br />
“beachfront” spectrum because of its propagation characteristics).<br />
150
Federal Communications Commission <strong>FCC</strong> 10-81<br />
270. Low-band spectrum can enable the same level of service, at a lower cost, than higherfrequency<br />
bands, such as the 1.9 GHz PCS band, the 1.7/2.1 GHz AWS band, and the 2.5 GHz BRS/EBS<br />
band. 734 A licensee that exclusively or primarily holds spectrum in a higher frequency range generally<br />
must construct more cell sites (at additional cost) than a licensee with primary holdings at a lower<br />
frequency in order to provide equivalent service coverage, particularly in rural areas. 735 The National<br />
Institute of Standards and Technology (NIST) developed a propagation model comparing the 700 MHz,<br />
1.9 GHz, and 2.4 GHz spectrum bands. It concluded that the favorable propagation characteristics meant<br />
that coverage using the same transmission power differed significantly, translating into the need for less<br />
infrastructure: while it required nine cells at 2.4 GHz and four cells at 1.9 GHz to span 100 meters<br />
squared, it was projected to require only one cell at 700 MHz. 736 Similarly, an analysis using the<br />
Okumura-Hata model shows that rural, suburban, and urban cell sizes at 700 MHz are more than three<br />
times larger than cells in the PCS band. 737<br />
271. The higher value that many providers have placed on low-band spectrum with respect to<br />
the provision of mobile service – especially mobile broadband service – is demonstrated by a comparison<br />
of market valuations. The recent auctions of AWS and 700 MHz spectrum (Auctions 66 and 73,<br />
respectively) provide a basis for comparison, as both auctions involved large quantities of paired<br />
spectrum in a relatively close timeframe. In the 2008 auction of 700 MHz spectrum, the average price for<br />
the 700 MHz spectrum was $1.28 per MHz-pop. 738 This unit price was more than twice the average price<br />
of $0.54 per MHz-pop for AWS spectrum auctioned in 2006. 739<br />
272. Conversely, higher-frequency spectrum may be particularly effective for providing<br />
significant capacity, or increasing capacity, within a smaller geographic area. 740 In certain situations,<br />
higher frequency bands can achieve greater improvements in capacity. For instance, capacity<br />
734 See, e.g.¸ T-<strong>Mobile</strong> Nov. 25, 2009 Ex Parte Letter, Attachment at 8-9 (a network built using lower frequencies<br />
requires many fewer cell sites for the same coverage using higher frequencies). See also, Morgan Stanley <strong>Mobile</strong><br />
Internet <strong>Report</strong>, at 313-314 (lower spectrum allocations, such as 700 MHz spectrum, help lower capital expenditures<br />
by broadening reach); John Stankey, President and CEO, AT&T Operations, Inc., January 28, 2010 (Q4 2010<br />
Earnings Call) (noting that 850 MHz Cellular spectrum is “very high quality with terrific propagation<br />
characteristics. It is very effective penetrating buildings…As customers make the shift to more data-intensive<br />
devices, we think this is important for the perceived quality of their overall experience”).<br />
735 While propagation characteristics are important with regard to coverage in urban areas, especially in-building<br />
coverage, site spacing in these areas can also be driven by the need for capacity. AT&T, for instance, notes that it<br />
cannot be assumed that lower frequency bands will require fewer cells or be more economical to deploy because<br />
other factors also affect propagation – including the presence of large buildings in urban areas or other physical<br />
impediments. It states that “in areas that are capacity limited, there is likely to be no difference in the number of<br />
cells required at 700 MHz vs. 2.5 GHz.” AT&T NOI Comments at 81-83.<br />
736 NIST, 700 MHz Band Channel Propagation Model, http://www.nist.gov/itl/antd/emntg/700mhz.cfm (visited<br />
Apr. 29, 2010). See T-<strong>Mobile</strong> Apr. 26, 2010 Ex Parte Letter (stating that lower band spectrum is widely considered<br />
“beachfront” spectrum because of its propagation characteristics, and citing the NIST model).<br />
737<br />
Okumura-Hata is a widely used RF propagation. See John S. Seybold, Introduction to RF Propagation, Wiley-<br />
Interscience, 2005.<br />
738 See generally <strong>FCC</strong>, Auction 73 – 700 MHz Band,<br />
http://wireless.fcc.gov/auctions/default.htm?job=auction_summary&id=73.<br />
739 See generally <strong>FCC</strong>, Auction 66 – Advanced <strong>Wireless</strong> Services,<br />
http://wireless.fcc.gov/auctions/default.htm?job=auction_summary&id=66.<br />
740 Verizon <strong>Wireless</strong> May 12, 2010 Ex Parte Letter at 2-3. See also Letter from Jeanine Poltronieri, AT&T, to<br />
Marlene H. Dortch, Secretary, <strong>FCC</strong>, WT Docket No. 09-66 (filed May 6, 2010) (AT&T May 13, 2010 Ex Parte<br />
Letter) at 2-3.<br />
151
Federal Communications Commission <strong>FCC</strong> 10-81<br />
enhancement technologies such as MIMO may perform better at higher frequencies. 741 In addition, while<br />
spectral efficiency is the same for all spectrum bands when using a given technology (and bandwidth), 742<br />
there currently is significantly more spectrum above 1 GHz that is potentially available for use (as shown<br />
by Table 24, above). Further, in many parts of these higher bands, spectrum is licensed in larger<br />
contiguous blocks, 743 which can enable operators to deploy wider channels and simplify device design.<br />
Thus higher-frequency spectrum can be ideally suited for providing high capacity where it is needed, such<br />
as in high-traffic urban areas. 744<br />
273. Some analysts also have observed that there can be important complementarities that<br />
come with holding spectrum assets in different frequency bands, noting that combination of sub-1 GHz<br />
and higher frequency spectrum may be optimal. For example, low frequency spectrum can be deployed<br />
ubiquitously with relatively few cell sites, providing a base layer of coverage that extends to wide areas in<br />
rural America as well as deep into buildings in urban areas. However, in urban areas where traffic<br />
concentration is high, this base coverage layer may be complemented with a capacity layer using high<br />
frequency spectrum. 745 In this sense, higher-frequency spectrum is made more valuable by being<br />
combined with lower-frequency spectrum, and vice versa. Given these different spectrum characteristics,<br />
a licensee’s particular mix of spectrum holdings may affect its ability to provide efficient mobile wireless<br />
services.<br />
274. Spectrum Holdings Below 1 GHz. Three nationwide providers – Verizon <strong>Wireless</strong>,<br />
AT&T, and Sprint Nextel – hold licenses for CMRS/mobile broadband spectrum below 1 GHz, as do<br />
regional providers, such as US Cellular and Cellular South, MetroPCS, and several smaller companies,<br />
many of which have holdings in more rural areas of the country. T-<strong>Mobile</strong>, the fourth nationwide<br />
provider, has very few spectrum licenses below 1 GHz.<br />
275. Of the sub-1 GHz spectrum, Verizon <strong>Wireless</strong> and AT&T each hold a significant amount<br />
of the Cellular and 700 MHz spectrum, while Sprint Nextel holds the majority of SMR spectrum (see<br />
Table 25). Specifically, when measured on a licensed MHz-POP basis, Verizon <strong>Wireless</strong> holds 48.5<br />
percent of the Cellular spectrum and 42.7 percent of the 700 MHz spectrum, and AT&T holds 42.3<br />
percent of the Cellular spectrum and 24.3 percent of the 700 MHz band spectrum. Adding these two<br />
bands together, Verizon <strong>Wireless</strong> holds 45 percent of the licensed MHz-POPs of the combined Cellular<br />
and 700 MHz band spectrum, AT&T holds 33 percent, and US Cellular holds approximately 5 percent.<br />
Several other, smaller providers’ combined holdings total less than four percent of the Cellular but nearly<br />
a third of the 700 MHz spectrum. Meanwhile, Sprint Nextel holds nearly all of the SMR spectrum.<br />
276. As discussed in previous reports, providers have been utilizing Cellular spectrum for<br />
mobile voice and data services for many years, using CDMA-based and GSM-based technologies (which<br />
continue to evolve), while providers have been utilizing SMR spectrum to offer mobile voice and data<br />
services using iDEN-based technologies. In recent years, providers have been upgrading their Cellularbased<br />
networks from 2G and 2.5G technologies to 3G technologies in most markets across the United<br />
States. As discussed earlier, SMR spectrum generally is not as suitable for broadband operations. 746<br />
Deployment of networks in the 700 MHz unpaired spectrum blocks have generally be limited, to date, to<br />
741 Verizon <strong>Wireless</strong> May 12, 2010 Ex Parte Letter at 3; AT&T May 13, 2010 Ex Parte Letter at 3.<br />
742 AT&T May 13, 2010 Ex Parte Letter at 2.<br />
743 Id. at 3.<br />
744 See Alan Hadden, <strong>Mobile</strong> Broadband — Where The Next Generation Leads Us, Global <strong>Mobile</strong> Suppliers<br />
Association, Dec. 2009, available at http://www.gsacom.com/downloads/pdf/GSA_IEEE_articles1209.php4.<br />
745 Id. (“A combination of higher spectrum (e.g., 1.8 GHz, 2.1 GHz, 2.6 GHz) for the capacity layer, and sub-1 GHz<br />
spectrum for improved coverage in rural areas and for urban in-building, is considered optimal”).<br />
746 See Para 254, supra.<br />
152
Federal Communications Commission <strong>FCC</strong> 10-81<br />
mobile multichannel one-way video programming services. 747 Verizon <strong>Wireless</strong> and AT&T have<br />
announced plans to deploy 4G broadband networks in the 700 MHz paired spectrum blocks in the coming<br />
years. 748<br />
277. Spectrum Holdings Above 1 GHz. All four nationwide providers hold spectrum above 1<br />
GHz. Verizon <strong>Wireless</strong>, AT&T, and T-<strong>Mobile</strong> each hold a substantial number of PCS and AWS licenses,<br />
while Sprint Nextel holds significant amounts of PCS spectrum. Of the PCS and AWS spectrum held by<br />
nationwide providers, again based on MHz-POPs, Verizon <strong>Wireless</strong> holds approximately 15.3 percent of<br />
the PCS and 15 percent of the AWS spectrum, AT&T holds around 25.9 percent of the PCS and 11.2<br />
percent of the AWS spectrum, Sprint Nextel approximately 26.8 percent of the PCS and none of the<br />
AWS, and T-<strong>Mobile</strong> approximately 19.7 percent of the PCS and nearly 28 percent of the AWS. US<br />
Cellular, MetroPCS, and Leap each hold some PCS and a somewhat higher percentage of the more<br />
recently auctioned AWS spectrum. Finally, other smaller providers hold approximately 5.5 percent of the<br />
PCS spectrum and nearly 30 percent of the AWS spectrum. Each of the nationwide providers, along with<br />
many others, offers mobile broadband and data services on 3G networks using some of this spectrum.<br />
MetroPCS also has announced plans to deploy 4G services using its AWS spectrum. 749<br />
278. Finally, as noted above, Clearwire holds substantial amounts of 2.5 GHz spectrum,<br />
comprised of BRS and EBS spectrum. It has been offering 4G broadband data services, using WiMAX<br />
technology, in markets across the country. None of the nationwide providers hold BRS/EBS spectrum,<br />
although Sprint Nextel has a majority ownership interest in Clearwire. Several smaller providers,<br />
including Xanadoo and Digital Bridge, are, like Clearwire, deploying WiMAX in their BRS and EBS<br />
spectrum holdings. 750<br />
279. Relative Distribution of Spectrum Holdings Below and Above 1 GHz. Chart 41 shows the<br />
spectrum holdings of nationwide wireless providers by frequency – licensees’ holdings under 1 GHz<br />
versus licensees’ holdings above 1 GHz. It provides a side-by-side comparison of each licensee’s<br />
holdings, in terms of total population-weighted average megahertz under 1 GHz and above 1 GHz.<br />
747 See, e.g., MediaFLO, Enabling the <strong>Wireless</strong> Ecosystem, http://www.mediaflo.com/about_us.html (visited Apr.<br />
29, 2010).<br />
748 See Section IV.B.1.a, Service Provider Technology Deployments, supra.<br />
749 Id.<br />
750 Digital Bridge Communications, About DBC: Bringing Broadband to Underserved or Rural Communities<br />
Nationwide, http://www.digitalbridgecommunications.com/AboutDBC/tabid/84/Default.aspx (visited Apr. 29,<br />
2010); Xanadoo Company, About Xanadoo, http://www.xanadoo.com/about.html (visited Apr. 29, 2010).<br />
153
Federal Communications Commission <strong>FCC</strong> 10-81<br />
Chart 41<br />
Population-Weighted Average Megahertz Under/Over 1 GHz (Licensed Spectrum Only)<br />
Pop-Weighted Avg MHz<br />
140<br />
120<br />
100<br />
80<br />
60<br />
40<br />
20<br />
0<br />
Verizon<br />
<strong>Wireless</strong><br />
AT&T<br />
Sprint<br />
Nextel<br />
T-<strong>Mobile</strong> MetroPCS<br />
154<br />
Above 1 GHz<br />
Below 1 GHz<br />
US<br />
Cellular<br />
Leap Other Clearwire<br />
Above 1 GHz 32 42 33 48 8 4 10 33 125<br />
Below 1 GHz 53 38 17 0.05 0.32 4 0 22 0<br />
280. Distribution of Spectrum by Population Density. Chart 42 below shows how spectrum is<br />
nationally distributed by population density. Generally, as the population density decreases, the sub-1<br />
GHz spectrum holdings of the large providers decrease, and those of regional and smaller companies<br />
increase.
Average Sub 1 GHz Spectrum<br />
(Pop- Weighted MHz)<br />
70<br />
60<br />
50<br />
40<br />
30<br />
20<br />
10<br />
0<br />
1st<br />
Decile<br />
Federal Communications Commission <strong>FCC</strong> 10-81<br />
Chart 42<br />
Average Sub-1GHz Spectrum by Population Density Deciles<br />
2nd<br />
Decile<br />
3rd<br />
Decile<br />
4th<br />
Decile<br />
5th<br />
Decile<br />
6th<br />
Decile<br />
155<br />
7th<br />
Decile<br />
8th<br />
Decile<br />
US Population Deciles Sorted by County Population Density<br />
d. Competitive Effects of Spectrum Holdings<br />
9th<br />
Decile<br />
10th<br />
Decile<br />
Verizon<br />
AT&T<br />
Sprint Nextel<br />
US Cellular<br />
Cellular South<br />
MetroPCS<br />
T-<strong>Mobile</strong><br />
281. The Commission’s competition policies with respect to spectrum holdings have been<br />
designed to preserve competitive opportunities in the mobile wireless marketplace and retain incentives<br />
for efficiency and innovation. Its policies have evolved over the years as more and more spectrum has<br />
been made available for mobile services. These policies have also changed as the marketplace changes<br />
and technology evolves.<br />
282. The mobile CMRS marketplace for mobile telephone services in 1995, when the First<br />
<strong>Report</strong> was issued, was very different from today’s marketplace. Until 2007, the Commission’s<br />
competition policies concerning the spectrum input market for mobile services focused on spectrum<br />
associated with three frequency bands – Cellular, SMR, and broadband PCS. These were the specific<br />
frequency bands that, until that time, the Commission had determined to be spectrum “suitable” for the<br />
provision of mobile services in the relevant product market, which the Commission had defined as the<br />
product market for “mobile telephony” services. 751 For purposes of its competitive analysis, the<br />
Commission has evaluated whether particular spectrum bands are “suitable” for mobile wireless services<br />
by determining whether the spectrum is capable of supporting mobile services given its physical<br />
properties and the state of the equipment technology, whether the spectrum is licensed with a mobile<br />
allocation and corresponding service rules, and whether the spectrum is committed to another use that<br />
effectively precludes its uses for mobile telephony. 752 Since the Commission first began applying a<br />
“spectrum screen” as part of its competitive analysis, the Commission has determined that additional<br />
spectrum should be part of its spectrum input analysis – including 700 MHz, 753 AWS, and BRS<br />
751 See AT&T-Dobson Order, 22 <strong>FCC</strong> Rcd at 20311-312 26-27 (2007).<br />
752 Id. at 26.<br />
753 Id. at 31.<br />
Other
Federal Communications Commission <strong>FCC</strong> 10-81<br />
spectrum 754 – and has continued to modify the spectrum screen as more spectrum has become<br />
available. 755 The Commission also has recognized that the mobile services marketplace – including the<br />
product market – has evolved. In 2008, the Commission revised its competition policies, no longer<br />
limiting its competitive analysis to examination of the mobile telephony product market. Given the<br />
increasing prevalence of mobile broadband services, the Commission began examining a combined<br />
product market for both mobile telephony services and mobile broadband services. 756<br />
283. As discussed above, spectrum resources in different frequency bands have distinguishing<br />
features that can make some frequency bands more valuable or better suited for particular purposes. For<br />
instance, given the superior propagation characteristics of spectrum under 1 GHz, particularly for<br />
providing coverage in rural areas and for penetrating buildings, providers whose spectrum assets include a<br />
greater amount of spectrum below 1 GHz spectrum may possess certain competitive advantages for<br />
providing robust coverage when compared to licensees whose portfolio is exclusively or primarily<br />
comprised of higher frequency spectrum. As discussed above, holding a mix of frequency ranges may be<br />
optimal from the perspective of providing the greatest service quality at low cost.<br />
2. Infrastructure Facilities<br />
a. Background<br />
284. Infrastructure facilities are a major input into the provision of mobile wireless service.<br />
These facilities are comprised largely of cellular base stations and towers or other structures on which the<br />
base stations are situated. A base station generally consists of radio transceivers, antennas, coaxial cable,<br />
a regular and backup power supply, and other associated electronics. These base stations are generally<br />
placed atop a purpose-built communications tower, or on a tall building, water tower, or other structure<br />
providing sufficient height above the surrounding area. 757 The number of cell sites in use by wireless<br />
providers continues to grow in order to satisfy the increased demand created by new subscribers,<br />
accommodate additional airtime usage per subscriber largely caused by increased use of data services<br />
including broadband wireless and mobile Internet, expand geographic service area coverage and to<br />
improve coverage in existing service areas, and accommodate newer technologies. According to CTIA,<br />
the total number of cell sites in use by CTIA’s members was 245,912 as of June 30, 2009. 758 This<br />
represents an increase in the number of cell sites of 1.6 percent since December 31, 2008, 41 percent<br />
since June 30, 2004, and 66.5 percent since June 30, 2003. 759 According to company reports, 204,817 of<br />
these cell sites, or 83 percent, were associated with the four major wireless providers. 760 For the four<br />
major wireless service providers, the percentage increase in the number of cell sites in use between the<br />
754 Sprint Nextel-Clearwire Order, 23 <strong>FCC</strong> Rcd at 17596-17600, 61-73. As discussed above, in reviewing<br />
proposed merger transactions that involve spectrum aggregation, the Commission examines market participants’<br />
holdings of suitable spectrum to ensure that there is sufficient spectrum available to competitors.<br />
755 See id.<br />
756 See id. at 17596 61; Verizon <strong>Wireless</strong>-ALLTEL Order, 23 <strong>FCC</strong> Rcd at 17469-470, 45-47.<br />
757 An alternative to the use of tall structures for cell sites is distributed antenna systems (DAS). DAS are comprised<br />
of a relatively large network of small cells that are connected by fiber optic cable and can be placed on such<br />
locations as utility poles, buildings, or traffic signal poles, in geographic areas where either constructing towers is<br />
not feasible, or where wireless traffic demands are too great to be met with fewer, large cells. Because DAS sites<br />
are unobtrusive, they are particularly desirable in areas with stringent zoning regulations, such as historic districts.<br />
Two major providers of such networks are ADC Telecommunications (http://www.adc.com/us/en/), and NextG<br />
Networks (http://www.nextgnetworks.net/).<br />
758 See CTIA Mid-Year 2009 <strong>Wireless</strong> Indices <strong>Report</strong>, at 28; CTIA NOI Comments at 34-35.<br />
759 Id.<br />
760<br />
AT&T reported 51,470 cell sites, Sprint 66,250, T-<strong>Mobile</strong> 45,397, and Verizon <strong>Wireless</strong> 45,397, as of June 30,<br />
2009. US <strong>Wireless</strong> 411 3Q09, at 50.<br />
156
Federal Communications Commission <strong>FCC</strong> 10-81<br />
end of the September 2008 and the end of September 2009 has been as follows: AT&T (5.5 percent),<br />
Sprint Nextel (0.8 percent), T-<strong>Mobile</strong> (6.6 percent), and Verizon <strong>Wireless</strong> (39.5 percent). 761<br />
b. Communications Tower Industry<br />
285. The most visible cell sites are those that are situated on relatively tall communications<br />
towers. As noted above, cell sites may also be located on buildings, municipal water towers, and church<br />
steeples, and some cell sites are located inside buildings to fill indoor coverage gaps. In addition, cell<br />
sites may be located at the lower levels of taller towers built to support other communications services,<br />
such as broadcast or public safety. With the growth of cell sites required to meet the needs of wireless<br />
service providers and their subscribers, a communications tower industry has evolved. A typical<br />
communications tower can accommodate five to six tenants, though the industry average of wireless<br />
tenants per tower is currently approximately 2 to 2.5. 762 This industry includes companies that own large<br />
numbers of towers on which they lease space to wireless service providers. In addition, there are a<br />
number of companies that help wireless service providers identify available tower or building space in<br />
needed geographic areas or, alternatively, arrange to construct towers where no appropriate facilities<br />
exist. The five largest independent tower companies are American Tower Corporation (American<br />
Tower), Crown Castle International (Crown Castle), Global Tower Partners, SBA Communications<br />
(SBA), and TowerCo. 763 Additionally, the major wireless service providers own or lease a large number<br />
of cell sites. 764<br />
286. Analyst reports about the communications tower industry indicate that the financial<br />
health of this industry is dependent to a large extent on the wireless service providers and whether or not<br />
they have the capital resources to expand service to new geographic areas or to enhance the quality of<br />
service in current service areas. Analysts seem to be optimistic that the expansion of new wireless<br />
providers, such as Clearwire, into new markets, 765 together with the deployment of newer technologies by<br />
existing wireless service providers to, bodes well for growth of the tower industry. Clearwire is<br />
reportedly planning to deploy approximately 19,000 cell sites by the end of 2010, while Verizon <strong>Wireless</strong><br />
indicates it will need to have in place a total of between 60,000 and 70,000 cell sites in order to<br />
accommodate its current needs and the deployment of its LTE network, 766 a projected increase of between<br />
18,000 and 28,000 cell sites from June 30, 2009. 767 This growth potential, together with low churn – due<br />
to the high cost to wireless service providers of switching towers – and the annuity-like revenue stream<br />
from long-term leases, which include standard annual price escalators of 3-5 percent, contribute to a<br />
761<br />
US <strong>Wireless</strong> 411 3Q09, at 50. The significant increase in the number of Verizon <strong>Wireless</strong> cell sites is due largely<br />
to its acquisition of Alltel in January 2009.<br />
762 SBA Communications, Bank of America/Merrill Lynch, Mar. 27, 2009, at 10.<br />
763 The companies are listed in order of size based on the number of towers owned. American Tower is the largest<br />
and TowerCo is the fifth largest. American Tower, Crown Castle, and SBA Communications are public companies,<br />
while Global Tower and TowerCo are privately held. According to Verizon <strong>Wireless</strong>, no single tower company<br />
owns more than 21 percent of all towers nationwide. See Verizon <strong>Wireless</strong> NOI Comments at 102.<br />
764 Sprint sold many of its company-owned cell site structures in the past few years and then leased space on them,<br />
most recently selling approximately 3,000 towers to TowerCo. TowerCo Completes Acquisition Of 3,080 Towers<br />
From Sprint Nextel For $670 Million, Press Release, TowerCo, Sept. 24, 2008. It is not possible to determine from<br />
publicly-available information the number of cell sites still owned by Sprint Nextel or any of the wireless service<br />
providers.<br />
765 Wireline & <strong>Wireless</strong> Telecom Services, Bank of America/Merrill Lynch, Sept. 24, 2009, at 4.<br />
766<br />
Presentation by Nadine Manjaro, ABI Research, PCIA <strong>Wireless</strong> Infrastructure Show Debrief, at 2009 <strong>Wireless</strong><br />
Infrastructure Show, Oct. 1, 2009, available at<br />
http://www.rcrwireless.com/assets/pdf/PCIA_<strong>Wireless</strong>2009_Debrief.pdf.<br />
767 US <strong>Wireless</strong> 411 3Q09, at 50.<br />
157
Federal Communications Commission <strong>FCC</strong> 10-81<br />
favorable financial outlook for the tower industry. 768 For example, American Tower reported that its<br />
revenue increased 8.5 percent between the third quarter of 2008 and the third quarter of 2009, and 9.7<br />
percent between the fourth quarter of 2008 and the fourth quarter of 2009; 769 Crown Castle reported that<br />
its revenue increased 13 percent between the third quarter of 2008 and the third quarter of 2009, and 12<br />
percent between the fourth quarter of 2008 and the fourth quarter of 2009; 770 and SBA reported that its<br />
revenue increased 17.4 percent between the third quarter of 2008 and the third quarter of 2009, and 7.9<br />
percent between the fourth quarter of 2008 and the fourth quarter of 2009. 771<br />
c. Barriers to Cell Site Deployment<br />
287. Two significant constraints faced by wireless services providers that need to add or<br />
modify cell sites are obtaining the funds needed to finance the capital expenditure, and obtaining the<br />
necessary regulatory and zoning approvals from state and local authorities. 772<br />
288. Co-locating base station equipment on an existing structure is often the most efficient and<br />
economical solution for existing and new wireless service providers that need new cell sites. Co-location<br />
is also commonly encouraged by zoning authorities to reduce the number of new communications<br />
towers. 773 Due to the high cost to construct new towers, and the often considerable delay to obtain<br />
approvals from state and local authorities, wireless service providers will typically look first for existing<br />
towers or other suitable structures for new cell sites. Co-location is particularly useful in areas in which it<br />
is difficult to find locations to construct new towers.<br />
289. The issue of excessive delays in the zoning approval process was the subject of a Petition<br />
for Declaratory Ruling filed by CTIA in 2008. CTIA sought Commission assistance to alleviate<br />
unnecessary delays in the process of obtaining approval to construct a new cell site, or to modify an<br />
existing site. 774 The Commission solicited comments on the CTIA petition and developed a full and<br />
robust record. Based on the evidence in that record, the Commission agreed that the lack of timely action<br />
on a significant number of cell site applications was impeding the ability of wireless providers to improve<br />
and expand their service offerings. On November 18, 2009, the Commission adopted a Declaratory<br />
768<br />
SBA Communications, Bank of America/Merrill Lynch, Mar. 27, 2009, at 8.<br />
769<br />
American Tower Corporation <strong>Report</strong>s Third Quarter 2009 Financial Results, Press Release, American Tower,<br />
Nov. 3, 2009, available at http://phx.corporate-ir.net/phoenix.zhtml?c=98586&p=irolnewsArticle_Print&ID=1349946&highlight;<br />
American Tower Corporation <strong>Report</strong>s Fourth Quarter and Full Year<br />
2009 Financial Results, Press Release, American Tower, Feb. 24, 2009, available at http://phx.corporateir.net/phoenix.zhtml?c=98586&p=irol-newsArticle_Print&ID=1394632&highlight.<br />
770<br />
Crown Castle International <strong>Report</strong>s Third Quarter 2009 Results; Provides 2010 Outlook, Press Release, Crown<br />
Castle, Nov. 3, 2009, available at http://investor.crowncastle.com/phoenix.zhtml?c=107530&p=irolnewsArticle&ID=1350357&highlight;<br />
Crown Castle International <strong>Report</strong>s Fourth Quarter And Full Year 2009<br />
Results, Press Release, Crown Castle, Jan. 27, 2010, available at<br />
http://investor.crowncastle.com/phoenix.zhtml?c=107530&p=irol-news&nyo=0.<br />
771 rd<br />
SBA Communications Corporation <strong>Report</strong>s 3 Quarter 2009 Results, Press Release, SBA, Oct. 29, 2009,<br />
available at http://ir.sbasite.com/releasedetail.cfm?ReleaseID=420018; SBA Communications Corporation <strong>Report</strong>s<br />
3 rd Quarter 2009 Results, Press Release, SBA, Feb. 25, 2010, available at<br />
http://ir.sbasite.com/releasedetail.cfm?ReleaseID=447344.<br />
772<br />
There is no evidence that shortages of transmission equipment, including antennas, to install at cell sites, act as a<br />
barrier to cell site deployment.<br />
773<br />
See, e.g., Guilford County, NC, Development Ordinance on Cellular Tower Placement,<br />
www.co.guilford.nc.us/planning_cms (visited Jan. 25, 2010).<br />
774<br />
Petition for Declaratory Ruling to Clarify Provisions of Section 332(c)(7)(B) to Ensure Timely Siting Review<br />
and to Preempt under Section 253 State and Local Ordinances that Classify All <strong>Wireless</strong> Siting<br />
Proposals as Requiring a Variance, WT Docket No. 08-165, Petition for Declaratory Ruling, filed July 11, 2008.<br />
158
Federal Communications Commission <strong>FCC</strong> 10-81<br />
Ruling which, among other things, defined presumptively reasonable time parameters for state or local<br />
zoning authorities to decide whether or not to approve a cell site application. 775<br />
d. Competitive Effects of Infrastructure Costs and the Independent<br />
Communications Tower Industry<br />
290. Infrastructure capital expenses for a new entrant can be higher than those for existing<br />
service providers. Infrastructure capital expenses per cell site vary depending primarily on whether the<br />
infrastructure is to be added to an existing cell site or entails building a completely new cell site.<br />
Additionally, a new entrant would need to construct a core network that includes such components as<br />
switches to connect its cell sites, gateways to access other networks, authentication capabilities, and backoffice<br />
capabilities such as billing and customer service. The infrastructure operating expenses should be<br />
quite similar regardless of whether they are associated with an existing or new cell site for an existing<br />
wireless service provider, or a new cell site for a new wireless service provider.<br />
291. When communications towers are owned by independent companies rather than wireless<br />
service providers, it may increase efficiency in the industry, ease entry, and enhance wireless service<br />
competition. Unlike wireless service providers that may have an economic incentive to forestall<br />
competition in a given area by restricting or delaying competitors’ access to towers or antenna structures<br />
that they own, tower companies independent of wireless service providers have an incentive to maximize<br />
revenues by leasing space to as many service providers as possible. Therefore, it may be easier for<br />
wireless service providers to add cell sites on independently-owned towers in order to expand their<br />
geographic coverage area or to enhance service within a current coverage area. In addition, the ability of<br />
wireless service providers to lease space for new cell sites on established towers can ease and speed their<br />
entry into new geographic areas by eliminating the need to build a new tower. The use of existing towers<br />
also reduces the capital requirements for both new entrants and existing wireless service providers<br />
because they only need to finance the purchase and installation of the transmission equipment to be used<br />
at the cell site.<br />
292. However, we note that, in many geographic areas, the most desirable positions for<br />
antennas on communication towers are occupied by existing tenants, leaving subsequent tenants with a<br />
choice of antenna positions that may not be optimal for their needs. Even with the reduced entry costs<br />
associated with an independent tower industry, tower siting costs and scarcity of desirable antenna<br />
position may constitute significant entry barriers to new providers.<br />
3. Backhaul Facilities<br />
a. Background<br />
293. Backhaul connections are an integral component of a wireless service provider’s network.<br />
Backhaul facilities link mobile providers’ cell sites to wireline networks, carrying wireless voice and data<br />
traffic for routing and onward transmission. As wireless data services increase as a percentage of a<br />
mobile wireless provider’s overall traffic, consuming vastly greater bandwidth, existing backhaul<br />
solutions are increasingly strained. <strong>Wireless</strong> providers must have access to sufficient backhaul, in terms<br />
of capacity and speed, to avoid creating a communications bottleneck. 776 As discussed above, estimates<br />
of average monthly backhaul costs range from hundreds of dollars (for a T1 line) to several thousand<br />
775 Petition for Declaratory Ruling to Clarify Provisions of Section 332(c)(7)(B) to Ensure Timely Siting Review<br />
and to Preempt Under Section 253 State and Local Ordinances that Classify All <strong>Wireless</strong> Siting Proposals as<br />
Requiring a Variance, Declaratory Ruling, WT Docket No. 08-165, 24 <strong>FCC</strong> Rcd 13994, 14021 71 (2009), petition<br />
for recon. pending, petition for review pending, City of Arlington v. <strong>FCC</strong>, No. 10-60039 (5th Cir., filed Jan. 12,<br />
2010).<br />
776 Service providers must provide backhaul for increasing numbers of cell sites and ensure that the backhaul<br />
solutions they employ provide sufficient capacity to support increasing use of wireless data services.<br />
159
Federal Communications Commission <strong>FCC</strong> 10-81<br />
dollars per month. 777 Cell site backhaul capacity is forecast to increase fourfold between 2007 and<br />
2011. 778<br />
294. There currently are three major technologies for backhaul transmission: copper lines,<br />
microwave (fixed wireless), and optical fiber. 779 Historically, copper circuits have been the predominant<br />
choice for backhaul traffic. The heavy reliance on copper transmission is diminishing. For example, one<br />
study estimated that 70.9 percent of backhaul traffic in 2009 would be carried via copper, 16.8 percent via<br />
fiber, and 12.3 percent via fixed wireless (including microwave). 780 In comparison, in 2005, 85.5 percent<br />
of backhaul traffic was carried via copper, 5.8 percent by fiber, and 8.7 percent by fixed wireless. 781 In<br />
other words, the incidence of copper as the medium for backhaul transmission is estimated to have<br />
decreased by nearly 15 percent over four years.<br />
b. Competitive Landscape<br />
295. Providers of backhaul services include incumbent local exchange carriers, independent<br />
wireline companies, cable providers, and independent wireless operators. <strong>Wireless</strong> providers may<br />
purchase special access services, 782 including DS1s and DS3s, from third parties for backhaul. <strong>Wireless</strong><br />
providers that are unaffiliated with a wireline provider often purchase special access services from the<br />
incumbent local exchange carriers against whose wireless affiliates they compete. 783 One wireless service<br />
provider has claimed that over 98 percent of all DS1 circuits are purchased from incumbent local<br />
exchange carriers (LECs), as are the vast majority of DS3 connections. 784<br />
296. Backhaul costs currently constitute a significant portion of a mobile wireless operator’s<br />
network operating expense, and the demand for backhaul capacity is increasing. 785 <strong>Wireless</strong> providers<br />
unaffiliated with a wireline provider often must rely on their competitors’ affiliates for access. The<br />
Commission is examining the current state of competition for special access services to ensure that rates<br />
for these services are just and reasonable. 786 In light of the growing need for backhaul, cost-efficient<br />
access to adequate backhaul will be a key factor in promoting robust competition in the wireless<br />
marketplace.<br />
777 See MSV 700 MHz Comments (hundreds of a dollars for a T1 line to $2,000 for a DS3 connection); Space Data<br />
Corporation Comments, WT Docket No. 06-150, PS Docket No. 06-229, Exhibit A (filed June 20, 2008) (backhaul<br />
cost ranging from $2,500 to $6,000). See Section III.D, Entry and Exit Conditions, supra.<br />
778<br />
SNL Kagan, Communications Industry News, June 26, 2008, at 1 (citing Infonetics Research Analyst, Michael<br />
Howard).<br />
779 Different protocols for data transmission (e.g., TDM , Ethernet) can run over each type of physical facility.<br />
780 <strong>Wireless</strong> Backhaul Market Study, New Paradigm Resources, Oct. 2008.<br />
781<br />
Id. This study estimated that as of mid-2009, there were about 530,000 backhaul lines, for 230,000 cell sites in<br />
the United States. Id.<br />
782 Special access services do not use local switches; instead they employ dedicated facilities that run directly<br />
between two designated locations. See Special Access Rates for Price Cap Local Exchange Carriers, WC Docket<br />
No. 05-25, RM-10593, Order and Notice of Proposed Rulemaking, 20 <strong>FCC</strong> Rcd 1994, 1997, 7 (2005) (Special<br />
Access NPRM).<br />
783 Other options, including higher bandwidth Ethernet services, are currently unavailable in a number of markets.<br />
784 Sprint Nextel Comments, WC Docket No. 05-25 (filed Jan. 19, 2010), at ii.<br />
785 Verizon <strong>Wireless</strong> NOI Comments at 95-96 (citing a study by Raymond James which estimates that the size of the<br />
backhaul market will grow from $3 billion annually to $8 to $10 billion in the next three to fixe years, driven in<br />
large part by increases in wireless data traffic).<br />
786 See “Parties Asked to Comment on Analytical Framework Necessary to Resolve Issues in the Special Access<br />
NPRM,” Public Notice, 24 <strong>FCC</strong> Rcd 13638 (2009) (referring to the Special Access NPRM).<br />
160
Federal Communications Commission <strong>FCC</strong> 10-81<br />
c. The Growing Need for Backhaul Solutions and Alternatives<br />
297. Several recent trends in the mobile wireless market have led to the increased demands on<br />
backhaul capacity, making access to sufficient backhaul an increasingly central component of a mobile<br />
wireless provider’s overall performance. First, the increased adoption of Internet-connected mobile<br />
computing devices, incorporating such advanced functionalities as video and Internet browsing, is<br />
consuming greater amounts of bandwidth. As the smartphone penetration rate increases, bandwidthconsuming<br />
data services are becoming an increasing percentage of a mobile wireless provider’s overall<br />
traffic. As discussed above, it is estimated that global mobile data traffic grew 157 percent, from 33<br />
terabytes in 2008 to 85 terabytes in 2009. 787 Second, the proliferation of fixed-rate mobile Internet access<br />
plans enables subscribers to consume more services and greater bandwidth. As noted earlier, AT&T<br />
reported its network has seen an 18-fold increase in data traffic since the iPhone was introduced, with<br />
mobile data traffic increasing by over four times during the June 2008 to June 2009 period alone. 788<br />
Third, mobile wireless network data speeds have increased as technology has evolved, with the<br />
forthcoming 4G WiMAX and LTE technologies supporting even higher data throughput rates and lower<br />
latencies.<br />
298. In light of the foregoing factors, identifying solutions to satisfy the growing demand for<br />
mobile backhaul is taking on increasing importance. The special access proceeding affects services<br />
generally provided over copper or fiber by wireline carriers regulated under price caps. 789 Many wireless<br />
providers also use point-to-point microwave transmission. We note that the recently released National<br />
Broadband Plan recommends that the Commission take action to ensure that sufficient microwave<br />
spectrum is available to meet current and future demand for wireless backhaul, especially in the bands<br />
below 12 GHz. 790 The National Broadband Plan also recommends that the Commission take further<br />
actions to enhance the flexibility and speed with which companies can obtain access to spectrum to use<br />
for wireless backhaul, which is critical to the deployment of wireless broadband and other wireless<br />
services. 791 The National Broadband Plan also includes several recommendations to facilitate the more<br />
efficient and economic installation of fiber facilities that may be used to meet the rapidly increasing<br />
demand for additional wireless backhaul capacity. 792<br />
B. Downstream Segments<br />
1. <strong>Mobile</strong> <strong>Wireless</strong> Handsets/Devices and Operating Systems<br />
299. Handsets and devices are becoming increasingly central to the dynamics of the overall<br />
wireless market. Recent studies show handsets playing an increasingly important role for consumers as a<br />
basis for choosing providers, although these studies differ as to the level of importance of handsets to<br />
consumers. For example, a recent report from Consumers Union provides data that suggests that many<br />
consumers switched to new wireless service providers in order to obtain a particular handset.<br />
Specifically, the report states that during the two-year period of 2008 through 2009, 38 percent of<br />
respondents who had switched providers did so because it was the only way to obtain the handset that<br />
787<br />
See Section V.D.3, <strong>Mobile</strong> Data Traffic (Non-Messaging), infra; Cisco Visual Networking Index: Global <strong>Mobile</strong><br />
Traffic Forecast Update, Cisco, Jan. 29, 2009, at 6.<br />
788 <strong>Mobile</strong>Data: Traffic Jam Ahead?, Bank of America/Merrill Lynch, Feb. 2, 2010.<br />
789 We note that carriers are increasingly interested in transitioning from TDM to Ethernet and other packet based<br />
services, and that existing facilities – including copper and fiber facilities – may often be transitioned from TDM to<br />
IP to address increased demand at particular sites. In addition, evolving technologies may provide wireless carriers<br />
with more alternatives to using special access services, including deploying their own facilities.<br />
790 National Broadband Plan, at 93.<br />
791 Id.<br />
792 Id. at 130 and 132-3.<br />
161
Federal Communications Commission <strong>FCC</strong> 10-81<br />
they wanted. 793 The same report also indicates that 27 percent of all respondents had a specific wireless<br />
handset in mind when they went shopping for a new handset. 794 A first quarter 2009 survey by Nielsen<br />
Company shows handsets were the seventh most important reason consumers chose their existing<br />
wireless provider, although handset choice increased in importance to 6.4 percent from 2.9 percent in the<br />
third quarter of 2006. 795 Recent analyst reports also identify access to handsets as an increasing challenge<br />
faced by mid-sized and small providers. 796 An examination of the handsets/devices and operating<br />
systems segments reveals their importance to mobile wireless consumers and service providers.<br />
a. Handsets/Devices<br />
300. Number of Manufacturers. From 2006 to 2009 the number of mobile wireless handset<br />
manufacturers that distribute in the U.S. market has increased from eight to sixteen (Table 27). 797 In June<br />
2009, there were sixteen handset manufacturers offering a total of 260 handset models to mobile wireless<br />
service providers in the United States. 798 Nine of these handset manufacturers each offered at least ten<br />
handset models.<br />
Table 27<br />
Handset Manufacturers and Handset Models Offered, U.S., 2006-2009<br />
162<br />
2006<br />
(Nov.)<br />
2007<br />
(Nov.)<br />
2008<br />
(Dec.)<br />
2009<br />
(June)<br />
Total Number of <strong>Report</strong>ing Handset<br />
Manufacturers 8 12 12 16<br />
Total Number of <strong>Report</strong>ing Handset<br />
Manufacturers Offering Ten or More<br />
Handset Models 5 8 8 9<br />
Total Number of Handset Models Offered by<br />
<strong>Report</strong>ing Handset Manufacturers 124 168 346 260<br />
301. Innovation. Over the past two years handset manufacturers have introduced a growing<br />
number of smartphones with the following features: an HTML browser that allows easy access to the<br />
Internet, an operating system that provides a standardized interface and platform for application<br />
793 Best Cell Phone Service, CONSUMER REPORTS, Jan. 2010.<br />
794 Id.<br />
795 Roger Entner, When Choosing A Carrier Does the iPhone Really Matter?, NIELSEN WIRE, Aug. 10, 2009.<br />
796 See, e.g., USM/TDS, 4Q09 Preview: <strong>Wireless</strong> Remains Challenging, Morgan Stanley, Feb. 23, 2010; Company<br />
Update, Cincinnati Bell, Inc. (CCB), Goldman Sachs, Feb. 11, 2010)<br />
797 These figures based on data from hearing aid compatibility reports filed by handset manufacturers from 2006 to<br />
2009. For reports prior to July 2009, see <strong>FCC</strong> Docket 07-250; for reports after July 2009, see the <strong>FCC</strong> Hearing Aid<br />
Compatibility status reporting site at http://wireless.fcc.gov/hac/index.htm?job=home. These reports include<br />
information (such as handset maker, model name, starting available date and end available date) for each handset<br />
model offered by the handset manufacturer during the reporting period.<br />
798 Handset manufacturers filed their hearing aid compatibility status reports by July 15, 2009, for the reporting<br />
period from January 1 to June 30, 2009. Starting in July 2010, handset manufacturers are required to file their<br />
hearing aid compatibility status reports annually on July 15 for the twelve month reporting period from July 1 st of<br />
the prior year to June 30th of the reporting year. See also http://wireless.fcc.gov/hac/index.htm?job=home for more<br />
details on these reports. 47 C.F.R. § 20.19.
Federal Communications Commission <strong>FCC</strong> 10-81<br />
developers, and a larger screen size than a traditional handset. 799 In contrast to traditional handsets with<br />
applications that include voice and messaging, smartphones have more user-friendly interfaces that<br />
facilitate access to the Internet and software applications. Ten handset manufacturers offered a total of 56<br />
smartphones in June 2009. 800 Table 28 lists the top five smartphone and handset manufacturers, by<br />
number of models offered, that distributed in the United States in June 2009. RIM, HTC and Samsung<br />
offered the most smartphone models, while Samsung, Motorola and LG offered the most handset models<br />
in June 2009. 801<br />
Table 28<br />
Smartphone Manufacturers Offering Largest Number of Smartphone Models (U.S., June 2009)<br />
Top Five Smartphone Number of<br />
Manufacturers Smartphone Models<br />
RIM 13<br />
HTC 11<br />
Samsung 10<br />
LG 5<br />
Palm 4<br />
Total 38<br />
Table 29<br />
Handset Manufacturers Offering Largest Number of Handset Models (U.S., June 2009)<br />
Top Five Handset Number of Handset<br />
Manufacturers<br />
Models<br />
Samsung 72<br />
Motorola 52<br />
LG 31<br />
Sony Ericsson 22<br />
Nokia 21<br />
Total 177<br />
302. Since Apple entered the handset business in June 2007 with the touchscreen iPhone,<br />
many handset manufacturers have responded with their own touchscreen smartphones. For example,<br />
Sony Ericsson launched its first touchscreen smartphone, XPERIA X1, based on the Window <strong>Mobile</strong><br />
6.1 platform, in February 2008. 802 HTC introduced the smartphone G1, powered by the Android<br />
operating system, in September 2008. 803 Nokia unveiled its touchscreen smartphone 5800 XpressMusic<br />
799 See Section IV.B.3, Differentiation in <strong>Mobile</strong> <strong>Wireless</strong> Handsets/Devices, supra (defining smartphone for<br />
purposes of this report).<br />
800 Based on data from hearing aid compatibility status reports filed by handset manufacturers in July 2009,<br />
available at http://wireless.fcc.gov/hac/index.htm?job=home.<br />
801 Based on data from hearing aid compatibility status reports filed by handset manufacturers in July 2009,<br />
available at http://wireless.fcc.gov/hac/index.htm?job=home.<br />
802<br />
See Sony Ericsson Launches the New Brand XPERIA with the Unveiling of XPERIA X1, Press Release, Sony<br />
Ericsson, Feb. 10, 2008, available at<br />
http://www.sonyericsson.com/cws/companyandpress/pressreleases/pressrelease/pressreleaseoverview/xperiax1us-<br />
20080210?cc=us&lc=en.<br />
803 See T-<strong>Mobile</strong> Unveils the T-<strong>Mobile</strong> G1 – the First Phone Powered by Android, Press Release, T-<strong>Mobile</strong>, Sept.<br />
23, 2008, available at http://www.t-<br />
(continued….)<br />
163
Federal Communications Commission <strong>FCC</strong> 10-81<br />
based on the Symbian operating system in October 2008. 804 Palm launched its touchscreen smartphone<br />
Pre, based on the Palm webOS platform, in June 2009. 805 Motorola announced its touchscreen<br />
smartphone DROID based on the Android 2.0 platform in October 2009. 806 Garmin, a leading Global<br />
Positioning System (GPS) device provider, entered the smartphone business with its touchscreen<br />
Nuviphone G60 in October 2009. 807 Huawei introduced its touchscreen smartphone Tap in October<br />
2009. 808 Google recently started selling its own smartphone Nexus One (manufactured by HTC) in its<br />
online store. 809 LG offers at least 17 touchscreen smartphones 810 and Nokia offers at least six. 811<br />
303. With the convergence of mobile wireless handsets and portable computing technologies,<br />
other traditional computer manufacturers (besides Apple) have entered the handset/device business and<br />
are offering touchscreen smartphones. Acer, a computer manufacturer, entered the handset/device<br />
business when it unveiled multiple models at the World <strong>Mobile</strong> Congress trade show in Barcelona in<br />
January 2010. 812 Dell announced it will soon offer its first Android-based smartphone, Mini 3, for<br />
AT&T. 813 Lenovo, another computer manufacturer, introduced its first Android-based smartphone,<br />
LePhone, in January 2010. 814<br />
304. Share of <strong>Mobile</strong> Devices. According to comScore, a marketing information company, in<br />
December 2009, the top five handset manufacturers in the United States accounted for 82.8 percent of<br />
mobile devices currently in use, and all other manufacturers accounted for the remaining 17.2 percent<br />
(Table 30). 815<br />
(Continued from previous page)<br />
mobile.com/company/PressReleases_Article.aspx?assetName=Prs_Prs_20080923&title=T-<br />
<strong>Mobile</strong>%20Unveils%20the%20T-<strong>Mobile</strong>%20G1%20–%20the%20First%20Phone%20Powered%20by%20Android.<br />
804 See Nokia Amps Up Music Offering with New Nokia 5800 XpressMusic, Press Release, Nokia, Oct. 2, 2008,<br />
available at http://www.nokia.com/press/press-releases/archive/archiveshowpressrelease?newsid=1256590.<br />
805 See Sprint to Offer Palm Pre Nationwide on June 6, Press Release, Sprint Nextel, May 19, 2009, available at<br />
http://newsreleases.sprint.com/phoenix.zhtml?c=127149&p=irol-newsArticle_newsroom&ID=1289761&highlight.<br />
806 See Hello Humans: DROID by Motorola Arrives Next Week, Press Release, Motorola, Oct. 28, 2009, available at<br />
http://mediacenter.motorola.com/content/detail.aspx?ReleaseID=12058&NewsAreaID=2.<br />
807 See AT&T and Garmin Announce a New <strong>Mobile</strong> Navigation Era with Nuvifone, the Navigation Phone, Press<br />
Release, AT&T, Sept. 29, 2009, available at http://www.att.com/gen/pressroom?pid=4800&cdvn=news&newsarticleid=27177&mapcode.<br />
808<br />
See Brian James Kirk, T-<strong>Mobile</strong> Tap - a new affordable touchscreen handset, MOBILE BURN, Oct. 7, 2009 at<br />
http://www.mobileburn.com/news.jsp?Id=7976.<br />
809 See Google Offers New Model for Consumers to Buy a <strong>Mobile</strong> Phone, Press Release, Google, Jan. 5, 2010,<br />
available at http://www.google.com/intl/en/press/pressrel/20100105_phone.html.<br />
810 LG, All LG Phones, http://www.lg.com/au/mobile-phones/all-lg-phones/index.jsp (visited Apr. 29, 2010).<br />
811 Nokia USA, Compare Phones, http://www.nokiausa.com/find-products (visited Apr. 29, 2010).<br />
812 See Acer Enters the Smartphone Market, PCMAG.COM, Feb. 17, 2009, at<br />
http://www.pcmag.com/article2/0,2817,2341176,00.asp. See also ACER, Smartphone Series,<br />
http://www.acer.com/smartphone/ (visited on Jan. 12, 2010).<br />
813 See At CES Dell Unveils First All Powerful Ultra <strong>Mobile</strong> Gaming System, Next Generation Smart Phones, Tablet<br />
Concepts and a New Line of Design Inspired Laptops, Press Release, Dell, Jan. 7, 2010, available at<br />
http://content.dell.com/us/en/corp/d/press-releases/2010-01-07-dell-at-ces-2010.aspx.<br />
814 See Gabriel Madway, Lenovo Enters Smartphone Fracas with “LePhone,” REUTERS, Jan. 6, 2010, at<br />
http://www.reuters.com/article/idUSTRE6060JF20100107.<br />
815<br />
See comScore <strong>Report</strong>s December 2009 U.S. <strong>Mobile</strong> Subscriber Market Share, Press Release, comScore, Feb. 8,<br />
2010, available at<br />
(continued….)<br />
164
Federal Communications Commission <strong>FCC</strong> 10-81<br />
Table 30<br />
Share of <strong>Mobile</strong> Devices in Use, U.S., 2009<br />
Handset Share of <strong>Mobile</strong><br />
Manufacturer Devices in Use<br />
Motorola 23.5%<br />
LG 21.9%<br />
Samsung 21.2%<br />
Nokia 9.2%<br />
RIM 7.0%<br />
All Others 17.2%<br />
305. Technological Standards. Handsets are manufactured for each of the commonly used<br />
wireless families of air interface standards, including the CDMA family (including 1xRTT and EV-DO),<br />
the GSM/WCDMA family (including GSM, GPRS, EDGE, WCDMA, HSDPA, and HSUPA), and<br />
iDEN. As the technical standards within each of these families progress, handsets are often built to<br />
support multiple air interfaces common to that family. This facilitates backwards compatibility with older<br />
technologies and migration to more efficient air interfaces over time. Handsets that are manufactured for<br />
one air interface family usually do not function on competing families of standards, although some<br />
handsets are designed to operate over more than one family. As of June 2009, handset variety was<br />
greatest for the GSM/WCDMA family, followed by the CDMA 1xRTT/EV-DO family. The iDEN<br />
standard has a comparatively small number of handsets.<br />
Table 31<br />
Handset Models Offered by Air Interface, U.S., 2006-2009<br />
Total Handset Models Offered by <strong>Report</strong>ing Handset Manufacturers<br />
Air Interface 2006 (Nov.) 2007 (Nov.) 2008 (Dec.) 2009 (June)<br />
CDMA/1xRTT/<br />
EV-DO 816 81 118 146 115<br />
GSM/WCDMA 817 40 42 177 129<br />
GSM/CDMA 0 0 0 2<br />
iDEN 11 8 21 14<br />
Total 124 168 346 260<br />
(Continued from previous page)<br />
http://www.comscore.com/Press_Events/Press_Releases/2010/2/comScore_<strong>Report</strong>s_December_2009_U.S._<strong>Mobile</strong><br />
_Subscriber_Market_Share.<br />
816 Our data currently cannot separate 1xRTT with EV-DO handsets from 1xRTT only handsets.<br />
817<br />
The number of handset models with WCDMA was 50 in June 2009, 52 in December 2008, 9 in November 2007,<br />
and 3 in November 2006.<br />
165
Federal Communications Commission <strong>FCC</strong> 10-81<br />
Table 32<br />
Smartphone Models Offered by Handset Manufacturers by Air Interface, U.S., June 2009<br />
Air Interface Type Estimated Smartphone Models, June 2009<br />
CDMA/1xRTT/<br />
EV-DO<br />
GSM/WCDMA 818 35<br />
GSM/CDMA 1<br />
iDEN 1<br />
Total 56<br />
306. Operating Systems. The operating system of a smartphone is one of the major factors<br />
that determine the smartphone’s ability to support mobile applications and Internet-based services.<br />
Applications and services may not be available for all operating systems, and applications that work with<br />
one operating system may not be readily transferable to another operating system. Smartphone operating<br />
systems are discussed more extensively in the section on mobile applications. Table 33 states that 96.2<br />
percent of smartphones in use in December 2009 have an operating system from a top-five mobile<br />
operating system provider, while the remaining 3.8 percent of smartphones in use have other operating<br />
systems. 819<br />
Table 33<br />
Share of Smartphones in Use by Operating System, U.S., December 2009<br />
Operating System Share of<br />
Smartphones in Use<br />
RIM 41.6%<br />
Apple 25.3%<br />
Microsoft 18.0%<br />
Palm 6.1%<br />
Google 5.2%<br />
All Others 3.8%<br />
307. The prevailing model for the distribution of handsets to U.S. consumers is a provider-asretailer<br />
model in which manufacturers sell handsets in bulk quantities to service providers and then<br />
service providers sell them to consumers in handset-service bundles, either in pre-paid service plans or<br />
post-paid subscription service plans. Generally, handset manufacturers make their handsets available to<br />
many service providers and consumers have a wide choice of handsets from different service providers.<br />
However, there are two types of contractual arrangements that affect the distribution of handsets. The<br />
first is bundling contracts, which are contracts between a service provider and a consumer for a handsetservice<br />
subscription bundle; the second is exclusive handset arrangements, where handset manufacturers<br />
grant exclusive distribution territories to providers. Both of these types of contracts potentially affect<br />
outcomes in the handset/device and mobile wireless services businesses and are discussed below. 820<br />
308. Service providers carry diverse handset portfolios and offer their customers a wide<br />
selection of handsets. As shown in Table 34, the average number of handset models offered by the eight<br />
818 The number of smartphone models with WCDMA was 25 in June 2009.<br />
819<br />
See comScore <strong>Report</strong>s December 2009 U.S. <strong>Mobile</strong> Subscriber Market Share, Press Release, comScore, Feb. 8,<br />
2010, available at<br />
http://www.comscore.com/Press_Events/Press_Releases/2010/2/comScore_<strong>Report</strong>s_December_2009_U.S._<strong>Mobile</strong><br />
_Subscriber_Market_Share.<br />
820 See Section VII.B.1.b, Key Factors Affecting <strong>Mobile</strong> <strong>Wireless</strong> <strong>Competition</strong>, infra.<br />
166<br />
19
Federal Communications Commission <strong>FCC</strong> 10-81<br />
largest facilities-based mobile wireless service providers 821 increased from 28 in November 2006 to 43 in<br />
December 2009. The average number of handset models offered by non-top eight service providers<br />
increased from 10 in November 2006 to 23 in December 2009. 822 Chart 43 shows the number of handset<br />
models and smartphone models offered by each of the top eight facilities-based service providers. 823 All<br />
of the top eight providers sell at least one smartphone, except Leap, which, according to industry press<br />
reports, will begin offering its first 3G smartphone in 2010. 824 Table 35 shows the number of service<br />
providers (including resellers) offering a particular manufacturer’s smartphone models.<br />
Table 34<br />
Average Number of Handset Models Offered by <strong>Mobile</strong> <strong>Wireless</strong> Service Providers<br />
Average Number of Handset Models Offered by<br />
Top Eight Service Providers<br />
Average Number of Handset Models Offered by<br />
Non-Top Eight Service Providers<br />
167<br />
2006<br />
(Nov.)<br />
2007<br />
(Nov.)<br />
2008<br />
(Dec.)<br />
2009<br />
(Dec.)<br />
28 30 46 43<br />
10 12 20 23<br />
821 The top eight facilities-based providers include AT&T, Verizon <strong>Wireless</strong>, Sprint Nextel, T-<strong>Mobile</strong>, Alltel<br />
(merged with Verizon <strong>Wireless</strong> on January 9, 2009), US Cellular, MetroPCS, and Leap <strong>Wireless</strong>. Tracphone, the<br />
fifth largest service provider in the U.S., is not facilities-based.<br />
822 These figures are based on data from hearing aid compatibility status reports filed by service providers from<br />
2006 to 2009, available at http://wireless.fcc.gov/hac/index.htm?job=home.<br />
823 These figures are based on data from hearing aid compatibility status reports filed by service providers in January<br />
2010.<br />
824 <strong>Wireless</strong>, COMMUNICATIONS DAILY, Mar. 1, 2010, at 7.
Federal Communications Commission <strong>FCC</strong> 10-81<br />
Chart 43<br />
Total Handset and Smartphone Models Offered by the Top Eight Facilities-Based Service<br />
Providers, Dec. 2009<br />
80<br />
70<br />
60<br />
50<br />
40<br />
30<br />
20<br />
10<br />
0<br />
59<br />
25<br />
73<br />
17<br />
AT&T Verizon<br />
<strong>Wireless</strong><br />
55<br />
19<br />
Sprint-<br />
Nextel<br />
35<br />
17<br />
168<br />
Total Handsets in Dec. 2009<br />
Total Smartphones in Dec. 2009<br />
38 38<br />
15<br />
11<br />
T-<strong>Mobile</strong> Alltel US<br />
Cellular<br />
18<br />
2<br />
25<br />
0<br />
MetroPCS Leap<br />
<strong>Wireless</strong><br />
Table 35<br />
Number of Service Providers (including Resellers) Offering a Manufacturer’s Smartphones,<br />
Dec. 2009 825<br />
Manufacturer Number of Service Providers<br />
(including Resellers)<br />
HTC 128<br />
RIM 116<br />
Pantech 66<br />
Samsung 66<br />
Palm 55<br />
Nokia 44<br />
LG 40<br />
Hewlett Packard 27<br />
Motorola 14<br />
Apple 5<br />
Garmin 4<br />
Sony Ericsson 3<br />
Acer 1<br />
Sharp 1<br />
825<br />
Hearing aid compatibility annual status reports filed by Jan. 15, 2010. 220 service providers offered at least one<br />
handset model in December 2009.
Federal Communications Commission <strong>FCC</strong> 10-81<br />
309. Smartphone sales and adoption rates have increased in recent years, as shown in Chart<br />
44. Smartphones as a percentage of total handset sales increased from 27 percent in the second quarter of<br />
2008 to 44 percent in the third quarter of 2009. Fifty percent of total handset upgrades were smartphones<br />
in the third quarter of 2009, up from 29 percent in the second quarter of 2008; and 39 percent of gross<br />
additions were smartphone users in the third quarter of 2009, up from 24 percent in the second quarter of<br />
2008. 826 Another analyst reports that smartphone sales increased from 9 million units in 2006 to 37<br />
million units in 2008. 827<br />
60%<br />
50%<br />
40%<br />
30%<br />
20%<br />
10%<br />
0%<br />
27%<br />
29%<br />
24%<br />
Chart 44<br />
Smartphone Adoption Rates in the United States 2008-2009 828<br />
30%<br />
30%<br />
29%<br />
39%<br />
31%<br />
35%<br />
169<br />
46%<br />
27%<br />
37%<br />
47%<br />
35%<br />
41%<br />
50%<br />
39%<br />
2Q2008 3Q2008 4Q2008 1Q2009 2Q2009 3Q2009<br />
Percentage of Smartphones as of Total Handset Sales<br />
Percentage of Smartphones as of Total Handset Upgrades<br />
Percentage of Smartphones as of Total Gross Adds<br />
310. According to one analyst, the average retail prices for all handsets and the smartphone<br />
subset, net of provider subsidies, decreased between 2006 and 2009. Chart 45 shows that the average<br />
price of smartphones after discounts decreased from $220 in the fourth quarter of 2006 to $120 in the<br />
fourth quarter of 2009, while the average price of all handsets after discounts decreased from $85 in the<br />
fourth quarter of 2006 to $50 in the fourth quarter in 2009. 829 This analyst also estimates that the average<br />
discount offered on the original price (the advertised price before contract-related discounts) of available<br />
handsets was 80 percent for the U.S. wireless industry in the last quarter of 2009, up from an average<br />
discount of 60 percent in late 2006. 830<br />
826 Smartphone Adoption Steadily Rising, at 3.<br />
827 Finding Value in Smartphones, at 6.<br />
828 Smartphone Adoption Steadily Rising, at 3.<br />
829 <strong>Wireless</strong> Service & Handset Pricing – Tick Tock, at 8.<br />
830 Id. at 7.<br />
44%
$250<br />
$200<br />
$150<br />
$100<br />
$50<br />
$0<br />
Federal Communications Commission <strong>FCC</strong> 10-81<br />
Chart 45<br />
Average Price After Discount for PDAs/Smartphones and All Handsets 831<br />
$220<br />
$85<br />
$195<br />
$80<br />
170<br />
Average Price for Smartphones<br />
Average Price for All Handsets<br />
$140<br />
$65<br />
$120<br />
$50<br />
4Q2006 4Q2007 4Q2008 4Q2009<br />
b. Key Factors Affecting <strong>Mobile</strong> <strong>Wireless</strong> <strong>Competition</strong><br />
311. <strong>Competition</strong> among the mobile wireless handset manufacturers (discussed above) affects<br />
competitive outcomes in the mobile wireless service market through price and non-price competition by<br />
handset manufacturers and it is also shaped by the provider-as-retailer model of handset distribution.<br />
Bundling contracts and exclusive handset arrangements are firm conduct that occurs frequently in the<br />
provider-as-retailer model of handset distribution. 832 Bundling is discussed first, then exclusive handset<br />
arrangements.<br />
(i) Bundling of <strong>Wireless</strong> Service Subscriptions with the<br />
Purchase of Handsets<br />
312. In a bundling contract a provider conditions the sale of a handset upon the consumer’s<br />
agreement to purchase a multi-month wireless service subscription, typically for a minimum of one or two<br />
years. 833 In a bundling contract, the wireless handset and wireless service plan are effectively sold as a<br />
single bundled product, with the price distributed over the length of the subscription. Service providers<br />
typically enforce these contracts by “locking” subsidized devices, so that they cannot be easily ported to a<br />
competitor’s network, and by charging early termination fees for subscribers who break the contract early.<br />
313. These bundles have both disadvantages and advantages for consumers. Some of the<br />
disadvantages of buying a handset-service subscription bundle are “buyer’s remorse” at having entered a<br />
831 <strong>Wireless</strong> Service & Handset Pricing – Tick Tock, at 8.<br />
832 See FTC, An FTC Guide to Dealings in the Supply Chain,<br />
http://www.ftc.gov/bc/antitrust/factsheets/antitrustlawsguide.pdf, at 17-22 (FTC).<br />
833 See Antitrust Law and Economics, at 326 (“Under a tying arrangement, the seller of a product conditions the sale<br />
of one product upon the buyer’s agreement to purchase a second product”). In particular, the sale of the handset is<br />
conditioned on the subsequent purchase of the multi-month wireless service subscription.
Federal Communications Commission <strong>FCC</strong> 10-81<br />
multiyear contract after the commitment was made, opaqueness surrounding how the handset price and<br />
the monthly subscription price are aggregated to obtain the price of the bundle, and monthly subscription<br />
prices that are seemingly independent of how long the customer has been paying off the initial discount<br />
on the handset price. 834 Some of the advantages of buying a handset-service subscription bundle are the<br />
conveniences of one-stop shopping, access to better technical support for handsets supported by the<br />
provider vis-à-vis handsets that are not in the provider’s handset portfolio, obtaining a discount on the<br />
price of the handset, and distributing the price of expensive handsets over the course of the subscription.<br />
314. <strong>Wireless</strong> service plans are generally available without bundled contracts, but most<br />
postpaid plans consumers have strong incentives to buy a subsidized device. Most providers allow<br />
customers to use a compatible unlocked handset with a postpaid network service plan. 835 Unlocked<br />
devices, while not widely distributed through the major retail channels, are available in some specialty<br />
stores and through some manufacturer websites (e.g., Motorola and Nokia). 836 However, when customers<br />
bring an unlocked device to a postpaid plan, they generally do not receive a device subsidy from the<br />
provider nor do they typically receive a lower-priced service plan that would reflect the fact that the<br />
provider does not have to recoup the cost of the subsidy. Therefore, most customers have incentives to<br />
purchase subsidized devices from the provider and, indeed, this is the overwhelming U.S. industry<br />
practice.<br />
315. For pre-paid and pay-as-you-go service plans, the incentives are slightly different, and<br />
indeed, at least one provider (T-<strong>Mobile</strong>) has begun to emphasize this fact. Prepaid plans also typically<br />
involve handset subsidies, although they may be smaller since providers expect prepaid plans to have<br />
higher churn than postpaid plans. In 2009, T-<strong>Mobile</strong> introduced its “Even More Plus” plan that offers a<br />
lower monthly service price for customers that use unsubsidized handsets. 837 This appears to be the first<br />
attempt by a national provider to change the incentives associated with device subsidies and service plan<br />
rates in a way to encourage mass market customers to use an unsubsidized device.<br />
(ii) Exclusive Handset Arrangements<br />
316. An exclusive handset arrangement (EHA) is an arrangement in which a handset<br />
manufacturer or vendor agrees to sell a particular handset model to only one wireless service provider,<br />
usually for a specified period of time. EHAs fall within a class of contractual arrangements known as<br />
territorial restraints or exclusive territory agreements. 838 EHAs may also involve sharing financial<br />
commitments and sharing market risks, with the manufacturer typically assuming some research and<br />
development commitments and the provider typically assuming some marketing and minimum volume<br />
commitments. Territorial restraints between manufacturers and their distributors are not per se illegal, 839<br />
although they raise competitive issues.<br />
834 See, e.g., David Pogue, The Irksome Cell Phone Industry, THE NEW YORK TIMES, July 22, 2009, at B1.<br />
835<br />
T-<strong>Mobile</strong>, for example, offers SIM cards that can be inserted into any unlocked GSM phone, a common practice<br />
in Europe.<br />
836<br />
See, e.g., the online stores of handset manufacturers Motorola and Nokia at<br />
http://www.motorola.com/Consumers/US-EN/Home and http://www.nokiausa.com/, respectively. The unbundled<br />
model of handset manufacturers distributing unlocked handsets has not yet been widely embraced by U.S.<br />
consumers even though some handset manufacturers directly sell unlocked handsets in their Internet shops and<br />
through non-provider retailers.<br />
837 See T-<strong>Mobile</strong>, Plans, http://www.t-mobile.com/shop/plans/Cell-Phone-Plans-<br />
Overview.aspx?WT.z_HP=shop_plans_DL (visited Feb. 22, 1010).<br />
838 Territorial restraints involve manufacture-dealer relationships. They are distinct from exclusive dealing where<br />
the manufacturer requires the distributor not to distribute products of competing manufacturers. See Antitrust Law<br />
and Economics, at 308, 345. See FTC at 17. See also, <strong>Competition</strong> Policy, at 301.<br />
839 See FTC at 17.<br />
171
Federal Communications Commission <strong>FCC</strong> 10-81<br />
317. There is some data available on the prevalence and duration of EHAs, although<br />
confidentiality clauses in EHAs have restricted the availability of certain data. First, EHAs are often<br />
employed in the market launch of innovative handsets that are on the technological frontier, e.g.,<br />
smartphones. Second, the duration of EHAs, although typically private contractual information, appears<br />
to have ranged from six months or less 840 to a few years or more. 841 Third, many handset manufacturers<br />
use EHAs to distribute some, but not all, of their smartphones. EHAs apply to particular handset models;<br />
they do not prevent a manufacturer or vendor from selling other handset models to other providers, and<br />
they do not block a provider from selling handsets made by other manufacturers or vendors. 842 For<br />
instance, inspection of providers’ online stores reveals that many handset manufacturers and vendors –<br />
including RIM, HTC, LG, Palm, Samsung, Motorola, and Nokia – sell many of the same smartphone<br />
models, or variants, to multiple U.S. service providers, including non-nationwide service providers. 843 In<br />
contrast, Apple and Garmin, both relatively recent entrants to the handset business, distribute their<br />
handsets at present only through AT&T (and its affiliates). 844 Fourth, handset manufacturers generally<br />
employ EHAs with providers that have larger customer bases and extensive network penetration. For<br />
instance, all nationwide providers have some EHAs, while non-nationwide service providers typically do<br />
not have EHAs. Table C-5 in Appendix C lists 67 selected smartphone launches that occurred in 2008<br />
and 2009. Of the 67 smartphones listed, 32 were subject to EHAs at launch, including some of the most<br />
popular (e.g., Apple iPhone, Motorola DROID, Palm Pre), while 35 were not subject to EHAs.<br />
2. <strong>Mobile</strong> Applications<br />
318. A range of different communication functionalities is now available to mobile wireless<br />
consumers, depending on the capabilities of the device they use and the network to which they connect.<br />
These functionalities include both voice and data services, with devices increasingly being used for data<br />
services. Morgan Stanley estimates that, in 2008, the average mobile wireless subscriber spent 70 percent<br />
of his/her time on a mobile device making voice calls and 30 percent using a data application, with half of<br />
840 See Verizon <strong>Wireless</strong>, Written Ex Parte Presentation, RM-11497, July 17, 2009 (stating that, applicable to small<br />
wireless carriers (those with 500,000 customers or less), any new exclusivity arrangement it enters with handset<br />
makers will last no longer than six months – for all manufacturers and all devices). See also T-<strong>Mobile</strong> Reply<br />
Comments, RM-11497, Feb. 20, 2009, at 6-7 (stating that most of T-<strong>Mobile</strong>’s exclusive agreements last less than a<br />
year and some are as short as 90 days). In October 2008, the Commission sought comment on a petition for<br />
rulemaking, filed by the Rural Cellular Association, regarding exclusivity arrangements between commercial<br />
wireless service providers and handset manufacturers. See “<strong>Wireless</strong> Telecommunications Bureau Seeks Comment<br />
on Petition for Rulemaking Regarding Exclusivity Arrangements Between Commercial <strong>Wireless</strong> Carriers and<br />
Handset Manufacturers,” RM-11497, Public Notice, 23 <strong>FCC</strong> Rcd 14873 (WTB 2008).<br />
841 The original iPhone was released in June 2007. See Apple Inc., SEC Form 10-K, for fiscal year 2008, filed Nov.<br />
5, 2008, at 5. The third generation iPhone, called iPhone 3GS, was released in June 2009. Apple reports that the<br />
iPhone 3GS is sold in the United States through an exclusive arrangement. See Apple Inc., SEC Form 10-K, for<br />
fiscal year 2009, filed Oct. 27, 2009, at 4, 20.<br />
842<br />
Hence, EHAs do not involve exclusive dealing where the distributor is prohibited from carrying products of<br />
competing manufacturers.<br />
843 For example, on February 5, 2010, the HTC Touch smartphone (or a variant with similar capabilities) was carried<br />
by at least Cellular One, Cellular 29 Plus (Chatmobility), Cellular South, T-<strong>Mobile</strong>, Copper Valley <strong>Wireless</strong>, Golden<br />
State Cellular, Verizon <strong>Wireless</strong>, Cellcom, Illinois Valley Cellular, Alaska Digitel, Inland Cellular, AT&T, Iowa<br />
<strong>Wireless</strong> Services, Nex-Tech <strong>Wireless</strong>, North Eastern Pennsylvania <strong>Wireless</strong>, Northwest Missouri Cellular, Sprint<br />
Nextel, Appalachian <strong>Wireless</strong>, Carolina West <strong>Wireless</strong> (HTC Hero arriving soon), Panhandle Telecommunications<br />
Systems, Alaska Communications Systems, Leaco, Nemont Telephone Cooperative (Sagebrush Cellular), US<br />
Cellular, Bluegrass Cellular, Strata <strong>Wireless</strong>, Thumb Cellular, United <strong>Wireless</strong>, and West Central <strong>Wireless</strong>. This<br />
data was collected directly from the websites of these providers.<br />
844 See Apple, Apple Store – iPhone 3G,<br />
http://store.apple.com/us/browse/home/shop_iphone?mco=OTY2ODQyMQ (visited May 14, 2010); Garmin,<br />
Garminfone, https://buy.garmin.com/shop/shop.do?cID=138&pID=30018 (visited May 14, 2010).<br />
172
Federal Communications Commission <strong>FCC</strong> 10-81<br />
the data time spent on text messaging and the remaining time on a combination of e-mail, Internet access,<br />
games, music, and other applications. 845 Data use is higher among the growing segment of smartphone<br />
users in general and iPhone users in particular. In 2008, the estimated usage pattern of the average iPhone<br />
subscriber was 45 percent voice and 55 percent data. 846<br />
319. <strong>Mobile</strong> data functionalities include text and multimedia messaging, which typically do<br />
not require a highly sophisticated device or high mobile network speed, as well as e-mail access, web<br />
browsing, and mobile applications, which typically require a smartphone device and a mobile broadband<br />
network connection. Thousands of different mobile applications – software programs that can be used on<br />
a mobile device 847 – are now available to consumers through various channels. They may be accessed<br />
through web browsers, operating system application stores, or service provider-branded platforms. 848 In<br />
addition, certain applications may be native to, or pre-loaded on, a device, or may be side-loaded from a<br />
PC.<br />
320. Both the number of mobile applications launched and the number of applications<br />
downloaded by consumers has grown significantly over the past two years. For example, there were over<br />
100,000 applications available from the Apple App Store as of December 2009, and the number of<br />
applications downloaded from Apple’s App Store grew from 100,000 in 2008 to over 2 billion in 2009. 849<br />
In addition, Morgan Stanley has estimated that, as of December 2009, the Android Market had 15,000<br />
available applications and 40 million downloads; and the Nokia Ovi Store had 6,000 available<br />
applications and 50 million downloads. 850<br />
321. Many different types of mobile applications, developed by a range of different third-party<br />
developers, are available through mobile application stores and web browsers. The major categories of<br />
applications include: web searching, news and information, e-mail and messaging, games, social<br />
networking, location-based services, photo sharing, music and video streaming, and VoIP. Thousands of<br />
niche applications, each serving a unique purpose, have been designed for specific uses, hobbies,<br />
interests, and industries by various third-party application developers.<br />
322. Certain applications require a mobile Internet connection in order to be downloaded on a<br />
mobile device, but then may not rely on an Internet connection when used thereafter on the device. One<br />
example of such an application would be a non-networked game that is played only by the individual user<br />
on his or her device. Many other applications require a mobile Internet connection in order to function on<br />
a device. These would include applications related to specific web sites or web-based content, such as<br />
news and information content, mapping and location-based applications, and social networking sites.<br />
Moreover, certain applications – such as VoIP and video conferencing applications – may require a lowlatency<br />
Internet connection in order to function properly.<br />
323. In order to provide an overview of the structure of the mobile applications segment, we<br />
provide below data on the adoption and usage of different types of mobile applications across the entire<br />
845 Morgan Stanley <strong>Mobile</strong> Internet <strong>Report</strong>, at 92. Morgan Stanley estimated the percentage of time spent each day<br />
on a mobile device on each type of activity. The estimates are based on data from CTIA, which estimated that the<br />
average voice call time per day is 27 minutes, and iSuppli, which estimated the total time spent on a mobile handset<br />
each day is 40 minutes. Id.<br />
846 Id.<br />
847 Id. at 134.<br />
848 CTIA NOI Comments at 28.<br />
849 Morgan Stanley <strong>Mobile</strong> Internet <strong>Report</strong>, at 134, 136.<br />
850 Id. at 157. CTIA reports that in the year following the launch of the Apple App Store, more than 100,000<br />
applications were made available through the six different application download platforms from Apple, Google,<br />
Pocketgear, Blackberry, Palm, Samsung, and Sony Ericsson. CTIA NOI Comments at 25-27.<br />
173
Federal Communications Commission <strong>FCC</strong> 10-81<br />
U.S. market, regardless of the device or operating system used. In addition, because certain devices are<br />
designed to facilitate the use of mobile applications, we provide data on mobile application use and<br />
adoption by type of device as well.<br />
324. Adoption rates for mobile data services vary significantly by type of application.<br />
According to comScore, 63.1 percent of U.S. mobile subscribers used text messaging on their mobile<br />
devices in December 2009 (see Table 36). 851 In contrast, browsers were used by only 27.5 percent of<br />
U.S. mobile subscribers, while 21.6 percent of subscribers played mobile games and 15.9 percent<br />
accessed a social networking site or blog. 852 Nielsen <strong>Mobile</strong> estimates that, in May 2008, 40.4 million<br />
Americans had used the mobile Internet at least once in the past month, up from 22.4 million in July<br />
2006. 853<br />
Table 36<br />
<strong>Mobile</strong> Content Adoption Rates by Type of Application 854<br />
Sent text message to<br />
another phone<br />
Share (%) of U.S. <strong>Mobile</strong> Subscribers<br />
September 2009 December 2009<br />
174<br />
61.0% 63.1%<br />
Used browser 26.0% 27.5%<br />
Played games 21.4% 21.6%<br />
Used downloaded apps 16.7% 17.8%<br />
Accessed social networking<br />
site or blog<br />
13.8% 15.9%<br />
Listened to music on mobile phone 11.7% 12.1%<br />
325. Survey research also shows that mobile Internet usage is growing and that accessing the<br />
Internet via a mobile device is becoming a more frequent activity for many subscribers. According to<br />
comScore, the number of mobile subscribers who used their mobile devices to access news and<br />
information on the Internet rose to nearly 63.2 million in January 2009, up 71 percent from January<br />
2008. 855 In addition, among those subscribers who accessed news and information via their mobile<br />
devices in January 2009, comScore estimates that nearly 22.4 million, or 35 percent, did so daily, more<br />
than double the number of daily users in January 2008. 856<br />
326. ComScore found that the use of mobile search applications grew 68 percent in the United<br />
States between the second quarter of 2007 and the second quarter of 2008, from 5.8 percent to 9.2 percent<br />
851 comScore <strong>Report</strong>s December 2009 U.S. <strong>Mobile</strong> Subscriber Market Share, Press Release, comScore, Feb. 8, 2010.<br />
852 Id.<br />
853 Critical Mass: the Worldwide State of the <strong>Mobile</strong> Web, Nielsen <strong>Mobile</strong>, July 2008, available at<br />
http://www.nielsenmobile.com/documents/CriticalMass.pdf; CTIA PN Comments, Attach. A, at 16.<br />
854 comScore <strong>Report</strong>s December 2009 U.S. <strong>Mobile</strong> Subscriber Market Share, Press Release, comScore, Feb. 8, 2010.<br />
855<br />
comScore: <strong>Mobile</strong> Internet Becoming a Daily Activity For Many, Press Release, comScore, Mar. 16, 2009. See<br />
also, CTIA NOI Comments at 59.<br />
856 comScore: <strong>Mobile</strong> Internet Becoming a Daily Activity For Many, Press Release, comScore, Mar. 16, 2009.
Federal Communications Commission <strong>FCC</strong> 10-81<br />
of all mobile wireless subscribers. 857 And, according to comScore, 6.5 million Americans, or<br />
approximately two percent of all mobile wireless subscribers, watched video on a mobile device during<br />
August 2008. On-demand video was the most popular form of video content, with 3.6 million viewers. 858<br />
327. Analysts believe that one of the major applications driving mobile data usage is social<br />
networking. 859 Social networking saw the largest growth rate from August 2007 to August 2008 in<br />
comScore’s survey, growing 8.8 percent to 14.9 million users, or 6.6 percent of all mobile wireless<br />
subscribers, during this period. The major social networking sites include Facebook, MySpace, Twitter,<br />
LinkedIn, and Foursquare. Facebook is the segment leader with 430 million users worldwide as of<br />
October 2009, compared to 110 million for MySpace and 58 million for Twitter. 860 Facebook and<br />
MySpace are popular on the mobile Internet as well as on the wired Internet. Facebook and MySpace<br />
rank #4 and #9, respectively, among top web domains accessed on desktop computers in the United<br />
States, but rank #2 and #4, respectively, among top web domains accessed on mobile devices. 861<br />
Foursquare is a social networking site and that combines GPS and location functionalities, allowing users<br />
to see where their friends are located at any time. 862<br />
328. Certain mobile applications are available for download through mobile web browsers<br />
and/or through one or multiple mobile application stores, such as the Apple App Store, the Android<br />
Market, or the Blackberry App World. Users can access these application stores on mobile devices that<br />
run the operating system that supports them. The application stores are specific to particular operating<br />
systems, and, in many cases, the application stores may be available only on devices running a certain,<br />
more recent version of an operating system or on devices with certain hardware features. For instance,<br />
the Blackberry App World is available on Blackberry smartphones running BlackBerry Device Software<br />
v4.2 or higher with a trackball, trackpad, or touch screen. 863<br />
329. <strong>Mobile</strong> data application usage varies among iPhone users, smartphone users, and average<br />
mobile wireless subscribers, with iPhone user adoption rates leading average smartphone user adoption<br />
rates in every category. 864 The most popular paid applications downloaded from the Apple App store are<br />
games, while the most popular free applications are social networking applications. 865<br />
857 comScore M:Metrics <strong>Report</strong>s <strong>Mobile</strong> Search Grew 68 Percent in the U.S. and 38 Percent in Western Europe<br />
During Past Year, Press Release, comScore, Sept. 15, 2008.<br />
858 comScore <strong>Report</strong>s 6.5 Million Americans Watched <strong>Mobile</strong> Video in August, Press Release, comScore, Oct. 31,<br />
2008.<br />
859 Morgan Stanley <strong>Mobile</strong> Internet <strong>Report</strong>, at 185-221.<br />
860 Id. at 188.<br />
861 Id. at 212.<br />
862 Id. at 204.<br />
863 BlackBerry, BlackBerry App World Vendor Support - Frequently Asked Questions,<br />
http://na.blackberry.com/eng/developers/appworld/faq.jsp (visited Mar. 1, 2010).<br />
864 Morgan Stanley <strong>Mobile</strong> Internet <strong>Report</strong>, at 92.<br />
865 Id. at 136.<br />
175
Federal Communications Commission <strong>FCC</strong> 10-81<br />
Table 37<br />
<strong>Mobile</strong> Application Adoption Rates by Device<br />
iPhone Smartphone Average <strong>Mobile</strong> User<br />
Music 65% 35% 12%<br />
Games 61% 48% 21%<br />
Social Networking 58% 43% 14%<br />
Web Search 52% 40% 12%<br />
Instant Messaging 48% 42% 15%<br />
News 40% 31% 9%<br />
Video 23% 16% 4%<br />
Personal Banking 22% 16% 4%<br />
Restaurant Guides 18% 14% 4%<br />
Online Shopping 14% 9% 2%<br />
Source: Morgan Stanley <strong>Mobile</strong> Internet <strong>Report</strong><br />
330. In order to provide an application through an application store, third-party application<br />
developers must design their products in accordance with the specifications of a particular application<br />
store and operating system, and must abide by the conditions of the operating system and, in some cases,<br />
the mobile wireless service provider. As discussed below, the conditions set by the operating system<br />
developers and their level of control over the applications available through their application stores vary<br />
from provider to provider.<br />
331. Aside from the parameters placed on third-party applications by operating system<br />
developers, the emergence of mobile web browsers and a handful of mobile operating systems in recent<br />
years has brought greater efficiency and standardization to the mobile application segment, to the benefit<br />
of both third-party developers and consumers. Under the typical mobile application distribution model of<br />
previous years, an application developer seeking to provide a product to mobile consumers often had to<br />
design an application differently for each handset on each mobile network, and the launch of an<br />
application required the approval of the wireless service provider, which acted as a gatekeeper for its<br />
“walled garden” content. As discussed above, mobile wireless service providers have to some degree<br />
opened their networks to smartphone devices with web browsers and application stores. 866 With the<br />
emergence of applications stores, developers can design their products for each application store, rather<br />
than each device. While the application development system has become more accessible and less<br />
fragmented than in previous years, 867 some mobile wireless service providers and application stores act as<br />
gatekeepers, deciding which applications are allowed to run on particular devices or networks, and<br />
approval processes are not always transparent or predictable. 868<br />
332. <strong>Mobile</strong> applications are a downstream segment within the mobile wireless ecosystem.<br />
866 The Commission recently opened a proceeding to explore whether certain core principles could be applied to<br />
ensure greater openness that would allow for broadband innovation. That proceeding includes an examination of<br />
devices, applications and network management practices of wireless broadband Internet access providers. See<br />
Preserving the Open Internet, GN Docket No. 09-191, Broadband Industry Practices, WC Docket No. 07-52,<br />
Notice of Proposed Rulemaking, 24 <strong>FCC</strong> Rcd 13064 (2009).<br />
867 Morgan Stanley <strong>Mobile</strong> Internet <strong>Report</strong>, at 135.<br />
868 See, e.g., Jeffrey Glueck, Perspective of a <strong>Mobile</strong> Application Developer & Entrepreneur, Presentation at <strong>FCC</strong><br />
Workshop on Innovation, Investment and the Open Internet, Jan. 13, 2010), at 4-6, available at<br />
http://www.openinternet.gov/workshops/innovation-investment-and-the-open-internet.html (discussing the<br />
challenges that service provider and/or application store gatekeepers present to mobile application developers);<br />
iPhone Facebook App Developer Quits over Apple Process, Daily Tech, Nov. 12, 2009, available at<br />
http://www.dailytech.com/IPhone+Facebook+App+Developer+Quits+Over+Apple+Policies/article16805.htm.<br />
176
Federal Communications Commission <strong>FCC</strong> 10-81<br />
Factors influencing the development of mobile applications – such as the ways in which consumers can<br />
access applications, technological innovations, and the barriers to entry faced by application developers –<br />
are, for the most part, common across all applications. However, the entire mobile application segment is<br />
also fragmented into many different types of applications, and the applications themselves may be part of<br />
separate product markets. For instance, mobile mapping applications may compete with GPS devices and<br />
even printed maps in the larger market for road navigation. And mobile gaming applications may<br />
compete with portable and fixed gaming platforms as part of the larger gaming market.<br />
3. <strong>Mobile</strong> Commerce<br />
333. <strong>Mobile</strong> commerce refers to commercial transactions made using a mobile wireless<br />
device. It can include online banking and shopping via the mobile web, applications designed to enable<br />
mobile commerce, mobile advertising, mobile coupons, and using a mobile device to make payments as a<br />
substitute for credit cards and cash.<br />
334. With consumers using mobile devices to browse the web and access application stores,<br />
rather than only for simpler functionalities such as texting, there is a greater potential for these devices to<br />
be used for mobile commerce. 869 <strong>Mobile</strong> commerce is just emerging but is expected to grow quickly.<br />
Estimates of mobile commerce spending in 2009 range from $500 million to $1.3 billion in 2009 to $12<br />
billion in 2013. 870 Data from comScore shows that 10 percent of smartphones and 12 percent of iPhones<br />
have been used to access online retail sites, as compared to only one percent of traditional handsets. 871<br />
According to Morgan Stanley, mobile devices have distinct attributes that will enable them to expand<br />
electronic commerce beyond fixed devices. 872 For example, mobile devices can be used for locationbased<br />
services which enable real-time physical retail and service opportunities. 873 Certain mobile<br />
applications provide better, more transparent information on pricing by, for example, allowing consumers<br />
to compare instantly local and online prices. 874 <strong>Mobile</strong> devices can also offer instant gratification with<br />
immediate digital product and content delivery regardless of where a consumer is located. 875 Finally,<br />
mobile devices allow consumers to take advantage of time-based selective Internet sales more easily. 876<br />
335. Certain applications available from mobile browsers or mobile application stores are<br />
designed to enable various mobile commerce functionalities, including making online purchases from a<br />
mobile device, providing transparent pricing information, coupons, and mobile banking. For example,<br />
eBay offers an application for the iPhone which allows consumers to buy and sell products through its<br />
website and which generated $380 million in gross merchandise value during the first nine months of<br />
2009. 877 ShopSavvy and Amazon.com offer applications that allow users to scan a bar code using their<br />
device cameras and compare the price of a product in the physical store with its price online. 878 The<br />
Coupon Sherpa application allows consumers to scan a barcode with a smartphone camera and receive a<br />
869<br />
Finding Value in Smartphones, at 30.<br />
870<br />
Id. at 33.<br />
871<br />
Id. at 30.<br />
872<br />
Morgan Stanley <strong>Mobile</strong> Internet <strong>Report</strong>, at 218.<br />
873<br />
Id.<br />
874<br />
Id.<br />
875<br />
Id.<br />
876<br />
Id.<br />
877<br />
Finding Value in Smartphones, at 31-32.<br />
878<br />
Morgan Stanley <strong>Mobile</strong> Internet <strong>Report</strong>, at 218; Amazon, Amazon App for Android,<br />
http://www.amazon.com/gp/anywhere/sms/android (visited Apr. 28, 2010).<br />
177
Federal Communications Commission <strong>FCC</strong> 10-81<br />
discount at checkout. 879 In addition, Bank of America and Wells Fargo both offer banking applications<br />
for the iPhone. 880<br />
336. Using mobile wireless handsets and devices to replace credit cards or cash, by making<br />
on-the-spot, contactless payments via a short-range wireless link from the device, is another functionality<br />
that is emerging, largely in Japan and South Korea, although not yet widely available in the United<br />
States. 881 In order for mobile payment applications to be successful, analysts argue that they must offer<br />
greater functionality than simple credit card replacement. 882 According to a study by the Information<br />
Technology & Innovation Foundation (ITIF), mobile payment applications could be used to pay for taxis,<br />
movie tickets, parking meters, parking garages, vending machines, and subway rides. 883 They could also<br />
potentially be used for hotel and airport check-in, taking attendance at school, and entry into health clubs<br />
or apartment buildings. 884<br />
337. The widespread use of mobile payment applications requires investment, buy-in, and<br />
coordination from several stakeholders – including mobile wireless service providers, device<br />
manufacturers, third-party application developers, financial institutions, merchants, public transit<br />
authorities, government agencies, and consumers – in order to deploy both devices that are capable of<br />
making contactless mobile payments and terminals that can accept such payments. 885<br />
338. Over 500,000 contactless credit card terminals have been deployed in the United States<br />
by 140,000 merchants, and contactless credit cards have been issued to more than 100 million Americans.<br />
MasterCard has begun running pilot programs that allow mobile devices, linked to a customer’s account,<br />
to make contactless mobile payments at MasterCard’s PayPass terminals. 886<br />
879 Id.<br />
880 Finding Value in Smartphones, at 45.<br />
881 In Japan, 73 percent of mobile phones have a mobile payment capability, and 17 million people make contactless<br />
mobile payments from their mobile phones. In South Korea, 12 million mobile phones have mobile payment<br />
capability, and 4 million people use their mobile phones to make payments. A limited number of mobile payment<br />
trials have been conducted in a few U.S. cities. Stephen Ezell, Contactless <strong>Mobile</strong> Payments, The Information<br />
Technology & Innovation Foundation, Nov. 2009, at 2-3, 26.<br />
882<br />
Stephen Ezell, Contactless <strong>Mobile</strong> Payments, The Information Technology & Innovation Foundation, November<br />
2009, at 2.<br />
883 Id. at 11.<br />
884 Id.<br />
885 Id., at 2.<br />
886 Finding Value in Smartphones, at 45-46.<br />
178
Federal Communications Commission <strong>FCC</strong> 10-81<br />
VIII. INTERMODAL COMPETITION<br />
A. Voice Services<br />
339. The number of adults who rely exclusively on mobile wireless for voice service has<br />
increased significantly in recent years. According to the 2009 National Health Interview Survey (NHIS),<br />
21.1 percent of adults, or one out of every 5, lived in households with only wireless phones in the first<br />
half of 2009, up from 16.1 percent in the first half of 2008, 12.6 percent in the first half of 2007, and 9.6<br />
percent in the first half of 2006. The results of this survey, which are shown in Chart 46, reveal that the<br />
proportion of wireless-only adults aged 30 years and older has steadily increased in recent years. 887 In the<br />
first half of 2009, the majority of wireless-only adults (57.2 percent) were aged 30 and over, up from 48.4<br />
percent three years earlier. More than one-third of adults aged 18-24 years (37.6 percent) and nearly half<br />
of adults aged 25-29 years (45.8 percent) lived in households with only wireless telephones.<br />
Approximately one-third of adults aged 30-34 years (33.5 percent) also lived in households with only<br />
wireless telephones. However, as age increases above 35 years, the survey found that the percentage of<br />
adults living in households with only wireless telephones decreases: 21.5 percent for adults aged 35-44;<br />
12.8 percent for adults aged 45-64; and 5.4 percent for adults aged 65 years and over. Nevertheless, the<br />
percentage of wireless-only adults within each age group has increased over time.<br />
340. In the first half of 2009, according to the NHIS survey, 22.7 percent of households, or<br />
more than one out of every five, were wireless-only, up from 17.5 percent in the first half of 2008, 13.6<br />
percent in the first half of 2007, and 10.5 percent in the first half of 2006. 888 A recent Nielsen Company<br />
survey shows a similar rising trend in households who have “cut the cord.” 889 In the second quarter of<br />
2009, according to the Nielsen survey, 21 percent of households, or over one in five, reported they are<br />
wireless cellular only, a 16 percent increase from 18 percent of households in 2008, and up from 15<br />
percent of households in both 2006 and 2007. 890<br />
887 Stephen J. Blumberg and Julian V. Luke, <strong>Wireless</strong> Substitution: Early Release of Estimates From The Data from<br />
the National Health Interview Survey, January – June 2009, National Center for Health Statistics, Centers for<br />
Disease Control, Dec. 16, 2009, available at http://www.cdc.gov/nchs/data/nhis/earlyrelease/wireless200912.pdf.<br />
888 Id.<br />
889 Study: More Cellular-only Homes as Americans Expand <strong>Mobile</strong> Media Usage, NIELSEN WIRE, Dec. 21, 2009.<br />
890 Id. According to the Nielsen Company, the increase comes from the two-thirds of households who have dropped<br />
their landlines as well as from young adults who started new households with just a wireless phone service.<br />
179
B. Broadband Services<br />
Federal Communications Commission <strong>FCC</strong> 10-81<br />
Chart 46<br />
<strong>Wireless</strong>-Only Households 891<br />
341. As noted previously in this <strong>Report</strong>, the Commission estimates that there were<br />
approximately 25 million terrestrial mobile wireless high-speed Internet access connections in use at the<br />
end of 2008. 892 <strong>Mobile</strong> wireless connections represented nearly 25 percent of the more than 102 million<br />
high-speed connections in the United States in December 2008. 893 In addition, at the end of 2008, there<br />
were approximately 86 million mobile devices in use capable of sending or receiving information at<br />
speeds exceeding 200 kbps in at least one direction. 894<br />
342. It is not yet clear whether mobile wireless Internet access services can substitute<br />
completely for fixed wireline Internet access technologies such as cable modem, DSL, or fiber. 895 The<br />
extent to which mobile wireless services can impose some competitive discipline on wireline providers<br />
will depend on how technology, costs, and consumer preferences evolve, and on the business strategies of<br />
891 Stephen J. Blumberg and Julian V. Luke, <strong>Wireless</strong> Substitution: Early Release of Estimates From The Data from<br />
the National Health Interview Survey, January – June 2009, National Center for Health Statistics, Centers for<br />
Disease Control, Dec. 16, 2009, available at http://www.cdc.gov/nchs/data/nhis/earlyrelease/wireless200912.pdf.<br />
892 See Section V.A.1, <strong>Mobile</strong> <strong>Wireless</strong> Subscribers by Type of Service, supra. High-speed connections include<br />
lines or wireless channels that connect residential or business customers to the Internet at speeds exceeding 200 kbps<br />
in at least one direction. High-Speed Services for Internet Access: Status as of December 31, 2008, Industry<br />
Analysis and Technology Division, Wireline <strong>Competition</strong> Bureau, <strong>FCC</strong>, Feb. 2010, at 9, available at<br />
http://hraunfoss.fcc.gov/edocs_public/attachmatch/DOC-296239A1.pdf.<br />
893 Id. at 5.<br />
894 See Section V.A.1, <strong>Mobile</strong> <strong>Wireless</strong> Subscribers by Type of Service, supra.<br />
895<br />
National Broadband Plan, at 42-44; U.S. Department of Justice Ex Parte, GN Docket No. 09-51 (filed Jan. 4,<br />
2010), at 8, 10.<br />
180
Federal Communications Commission <strong>FCC</strong> 10-81<br />
providers that offer both wireless and wireline Internet access services. 896 <strong>Mobile</strong> wireless Internet access<br />
service could provide an attractive alternative to wireline offerings for consumers who are willing to trade<br />
off speed for mobility, and also consumers who are relatively indifferent with regard to the attributes,<br />
performance, and pricing of mobile and fixed platforms. 897 Moreover, while mobile wireless service<br />
currently is not competitive with wireline for those consumers who value high speeds over other<br />
attributes, advances in wireless technologies, coupled with increases in the supply of spectrum, have the<br />
potential to make mobile wireless service a more viable competitor at higher data speeds at some future<br />
date. 898<br />
C. <strong>Wireless</strong> Local Area Networks and <strong>Wireless</strong>-Wireline Convergence<br />
343. Using both unlicensed and licensed spectrum, wireless providers employ technologies,<br />
such as wireless local area networks (WLANs) and femtocells, which converge wireless and wireline<br />
networks and play an increasingly important role as a competitor and supplement to the services offered<br />
by the CMRS industry. WLANs, which are widely deployed and operate on an unlicensed basis, enable<br />
consumers to obtain high-speed wireless Internet connections within a range of 150 to 250 feet from a<br />
wireless access point. 899 The most prevalent WLAN technology is equipment manufactured in<br />
accordance with the IEEE 802.11 family of standards, commonly known as “Wi-Fi,” short for wireless<br />
fidelity. Peak WLAN data transfer rates range from speeds of up to 11 Mbps for 802.11b, up to 54 Mbps<br />
for 802.11a and 802.11g, and up to 600 Mbps for 802.11n.<br />
344. With off-the-shelf, “plug-and-play” equipment widely available, WLANs have<br />
proliferated in homes and businesses. 900 In addition, WLAN users can access high-speed Internet<br />
connections at so-called “hot spots,” including locations such as restaurants, coffee shops, hotels, airports,<br />
convention centers, and city parks. 901 Estimates of the number of public Wi-Fi hot spots in the United<br />
States vary considerably, and there are a number of Wi-Fi directories available on-line for consumers to<br />
find public Wi-Fi hot spots. 902 According to one study, there continues to be significant growth in Wi-Fi<br />
hot spots globally, with an estimated 47 percent increase in hot spot usage for 2009, bringing the total<br />
number of global hot spot connects to approximately 1.2 billion. 903<br />
345. Several mobile wireless providers have entered the hot spot operation business through<br />
896<br />
National Broadband Plan, at 42; National Broadband Plan, at 42-44; U.S. Department of Justice Ex Parte, GN<br />
Docket No. 09-51 (filed Jan. 4, 2010), at 8, 10, 11.<br />
897 National Broadband Plan, at 43 and 64, note 3; National Broadband Plan, at 42-44; U.S. Department of Justice<br />
Ex Parte, GN Docket No. 09-51 (filed Jan. 4, 2010), at 8.<br />
898 National Broadband Plan, at 43.<br />
899 Services provided over WLANs are not CMRS services. See 47 C.F.R. §§ 20.3, 20.9 for a discussion of<br />
commercial mobile radio services. WLANs are permitted to operate on an unlicensed basis under Part 15 of the<br />
Commission’s rules. See 47 C.F.R. §15, et seq.<br />
900 Off-the-shelf, “plug-and-play” WLAN network equipment sold by companies such as Linksys and Netgear has<br />
allowed consumers to easily extend the reach of their wireline broadband connections and enabled portability within<br />
and around the home.<br />
901 See Seventh <strong>Report</strong>, 17 <strong>FCC</strong> Rcd at 13062-13063. Hot spots typically rely on high-speed landline technologies,<br />
such as T-1 lines, DSL, or cable modems, to connect to the Internet.<br />
902 See Hotspotr, WiFi Cafes and Hotspots, available at http://hotspotr.com/wifi (16,813 hot spots) (visited Jan.13,<br />
2010); Jiwire, Global Wi-Fi Finder, available at http://www.jiwire.com/hot-spot-directory-browse-bystate.htm?country_id=1&provider_id=0<br />
(visited Jan. 13, 2010) (69,730 hot spots in the U.S.).<br />
903<br />
Hotspot Usage Is Increasingly Shifting Away From Notebooks and Laptops and Toward Handhelds, Press<br />
Release, In-Stat, Dec. 23, 2009.<br />
181
Federal Communications Commission <strong>FCC</strong> 10-81<br />
acquisitions, partnerships, or independent deployments. 904 For instance, AT&T, Verizon <strong>Wireless</strong>, and T-<br />
<strong>Mobile</strong> each currently offer Wi-Fi access at thousands of hot spot locations throughout the United<br />
States. 905 Furthermore, according to one estimate, AT&T has experienced 500 percent growth in hot spot<br />
usage from 2008 to 2009. 906 Whereas Verizon <strong>Wireless</strong>’ hot spot access requires a monthly broadband<br />
plan, both AT&T and T-<strong>Mobile</strong> offer hot spot access to consumers without a term contract. 907 In<br />
addition, both AT&T and Verizon <strong>Wireless</strong> provide hot spot access to select customers without additional<br />
charge, while T-<strong>Mobile</strong> offers the service to its existing customers at a discounted price of $9.99 per<br />
month. 908 While the mobile wireless providers’ hot spots are fixed wireless networks, they offer service<br />
that complements mobile broadband data services and could function as a competitive constraint on<br />
competing mobile broadband networks.<br />
346. As discussed in the Thirteenth <strong>Report</strong>, many retailers now offer Wi-Fi hot spot access in<br />
their stores as a way to attract customers. 909 For instance, through agreements with AT&T, national<br />
chains such as Starbucks, McDonald’s, and Barnes & Noble offer Wi-Fi access in their establishments. 910<br />
Starbucks offers complimentary two-hours per day of Wi-Fi access for Starbucks’ customers when they<br />
904 Ninth <strong>Report</strong>, 19 <strong>FCC</strong> Rcd at 20687, 221.<br />
905 See AT&T, AT&T Wi-Fi: At a Glance, http://www.att.com/Common/about_us/files/pdf/wifi/Wi-<br />
Fi_at_a_Glance.pdf (visited Jan. 25, 2010) (advertising the nation’s largest Wi-Fi network, with more than 20,000<br />
locations in all fifty states); Verizon <strong>Wireless</strong>, Hit the Hotspots with Verizon Wi-Fi,<br />
https://www.verizonwireless.com/b2c/mobilebroadband/?page=wifiaccess (visited Jan. 25, 2010) (advertising<br />
“thousands of Verizon Wi-Fi hotspots across the U.S., Canada and Mexico”); T-<strong>Mobile</strong>, T-<strong>Mobile</strong> HotSpot<br />
Locations, https://selfcare.hotspot.t-mobile.com/locations/viewLocationMap.do (visited Jan. 25, 2010) (advertising<br />
over 10,000 locations in the United States). See generally AT&T, AT&T Wi-Fi,<br />
http://www.att.com/gen/general?pid=5949 (visited Jan. 25, 2010); T-<strong>Mobile</strong>, <strong>Wireless</strong> Internet Access – T-<strong>Mobile</strong><br />
HotSpots, https://content.hotspot.t-mobile.com/AssetProcess.asp?asset= com.default.main.001 (visited Jan. 25,<br />
2010).<br />
906 Wi-Fi Hotspots: Cellular Handsets and Portable Devices Drive a Market Renaissance, In-Stat, Nov. 2009.<br />
907 See Verizon <strong>Wireless</strong>, Hit the Hotspots with Verizon Wi-Fi, available at https://www.verizonwireless.com/b2c/<br />
mobilebroadband/?page=wifiaccess (visited Jan. 25, 2010); AT&T, AT&T Wi-Fi: At a Glance,<br />
http://www.att.com/Common/about_us/files/pdf/wifi/Wi-Fi_at_a_Glance.pdf (visited Jan. 25, 2010) (stating that<br />
“[o]ne-time hot spot connections are available for as low as $2.95 for two hours”); T-<strong>Mobile</strong>, T-<strong>Mobile</strong> Hotspot –<br />
Service Plans, available at https://selfcare.hotspot.t-mobile.com/services_plans.do (visited Jan. 25, 2010)<br />
(advertising “DayPass” and “Pay As You Go” plans with no term commitment).<br />
908 See AT&T, AT&T Wi-Fi: At a Glance, http://www.att.com/Common/about_us/files/pdf/wifi/Wi-<br />
Fi_at_a_Glance.pdf (visited Jan. 25, 2010) (stating that “[u]nlimited access to AT&T Wi-Fi hotspots in the U.S. is<br />
included for millions of residential, small business and enterprise customers with select AT&T High Speed Internet,<br />
LaptopConnect, and smartphone plans”); Verizon <strong>Wireless</strong>, Hit the Hotspots with Verizon Wi-Fi,<br />
https://www.verizonwireless.com/b2c/mobilebroadband/?page=wifiaccess (visited Jan. 25, 2010) (stating that<br />
Verizon Wi-Fi is “included for our <strong>Mobile</strong> Broadband customers.”); T-<strong>Mobile</strong>, T-<strong>Mobile</strong> Hotspot – Service Plans,<br />
https://selfcare.hotspot.t-mobile.com/services_plans.do (visited Jan. 25, 2010) (advertising $9.99 per month as a<br />
“discount for qualifying T-<strong>Mobile</strong> voice plan customers only”).<br />
909 See Wi-Fi Hotspots Stay Hot In 2008, CELLULAR-NEWS.COM, July 17, 2008. ABI Research Vice President and<br />
Research Director, Stan Schatt stated, “Starbucks’ decision to go to a virtually free Wi-Fi hotspot model is having a<br />
profound impact. Hotspot owners are beginning to see Wi-Fi as a cost of doing business and an operation expense,<br />
rather than as a profit center.” Id.<br />
910 See Starbucks, High-speed Internet Access at Starbucks, http://www.starbucks.com/retail/ wireless.asp (visited<br />
Jan. 13, 2010) (High-speed Internet Access at Starbucks); McDonald’s, McDonald’s <strong>Wireless</strong> Connectivity,<br />
http://www.mcdonalds.com/wireless/general_info.html (visited Jan. 13, 2010) (advertising Wi-Fi hot spot access at<br />
more than 9,500 locations in the United States); Barnes & Noble, Now at Barnes & Noble, Complimentary Wi-Fi,<br />
http://www.barnesandnoble.com/u/Wi-fi-at-Barnes-and-Noble/379001240/ ?cds2Pid=27242&linkid=1508869<br />
(visited Jan. 25, 2010).<br />
182
Federal Communications Commission <strong>FCC</strong> 10-81<br />
register a Starbucks’ Card and use it once a month. 911 Additionally, AT&T’s Wi-Fi customers have<br />
complimentary access to the Starbucks’ hot spots, as do T-<strong>Mobile</strong>’s Wi-Fi customers through a roaming<br />
agreement between AT&T and T-<strong>Mobile</strong>. 912 Barnes & Noble and McDonald’s also both offer<br />
complimentary Wi-Fi access. 913 In addition, Borders recently signed an agreement with Verizon for<br />
Verizon to provide free Wi-Fi access in more than 500 of Borders’ stores nationwide. 914<br />
347. While fixed wireless hot spot usage continues to grow, several mobile wireless providers<br />
have also introduced mobile hot spot devices capable of creating a personal, portable Wi-Fi hot spot that<br />
can connect multiple Wi-Fi enabled devices to the provider’s mobile broadband network. For instance,<br />
the Sprint Personal Hotspot PHS300S tethers to Sprint Nextel USB modems to provide Wi-Fi access<br />
anywhere within Sprint Nextel’s mobile broadband coverage. 915 The Novatel <strong>Wireless</strong> MiFi 2200,<br />
available to both Verizon <strong>Wireless</strong> and Sprint Nextel customers, is “about the size of eight stacked credit<br />
cards” and supports up to five Wi-Fi enabled devices. 916 Additionally, Sprint Nextel has introduced the<br />
Overdrive 3G/4G <strong>Mobile</strong> Hotspot by Sierra <strong>Wireless</strong>, which functions similarly to the MiFi 2200 but also<br />
includes access to 4G data speeds. 917 In July of 2009, Novatel <strong>Wireless</strong> unveiled the MiFi 2372 HSPA, a<br />
newer version of its Intelligent <strong>Mobile</strong> Hotspot with multi-mode operation, including HSPA, UMTS,<br />
EDGE and GPRS. 918<br />
348. A number of mobile wireless providers now offer dual-mode handsets that operate on<br />
911<br />
High-speed Internet Access at Starbucks. By registering for complimentary Wi-Fi access, customers also agree<br />
to receive up to four e-mails per year from AT&T. Id.<br />
912<br />
High-speed Internet Access at Starbucks. For all other customers, Starbucks offers two consecutive hours of Wi-<br />
Fi service for $3.99. Id.<br />
913 Barnes & Noble, Now at Barnes & Noble, Complimentary Wi-Fi, http://www.barnesandnoble.com/u/Wi-fi-at-<br />
Barnes-and-Noble/379001240/ ?cds2Pid=27242&linkid=1508869 (visited Jan. 25, 2010); McDonald’s, Free Wi-Fi<br />
@ McDonald’s, http://www.mcdonalds.com/us/en/services/free_wifi.html (visited May 18, 2010). Prior to January<br />
2010, McDonald’s offered two hours of Wi-Fi Internet access for $2.95. See McDonald’s Plans to Offer Free Wi-<br />
Fi, CHICAGO TRIBUNE, Dec. 16, 2009, available at http://www.chicagotribune.com/business/chi-wed-mcdonalds-<br />
1216-dec16,0,1641922.story.<br />
914 Borders Signs Agreement with Verizon to Offer Free Wi-Fi, PR NEWSWIRE, Sept. 29, 2009, available at<br />
http://www.prnewswire.com/news-releases/borders-signs-agreement-with-verizon-to-offer-free-wi-fi-<br />
62675172.html (visited Jan. 25, 2010).<br />
915 Sprint Nextel, Sprint – All Accessories, http://nextelonline.nextel.com/NASApp/onlinestore/en/<br />
Action/OSBrowseAccessoriesDetail?PHONE_ID=FW300DOWMX&catRefName=Data+%26+Memory&selectedA<br />
ccessoryID=MNX3517Q (visited Jan. 25, 2010). The Sprint Personal Hotspot PHS300S currently sells for $159.99.<br />
Id.<br />
916 Verizon <strong>Wireless</strong>, Verizon <strong>Wireless</strong> – <strong>Mobile</strong> Broadband – Products, http://www.verizonwireless.com/b2c<br />
/mobilebroadband/?page=products_mifi (visited Jan. 25, 2010); Sprint Nextel, MiFi TM 2200 by Novatel <strong>Wireless</strong>,<br />
http://nextelonline.nextel.com/NASApp/onlinestore/en/Action/<br />
DisplaySelPhoneDetail?phoneSKU=NV2200WFDO&id16=iSearch_MA_060109_MiFi&id16=mifi (visited Jan. 25,<br />
2010).<br />
917 See Sprint Nextel, Overdrive TM 3G/4G <strong>Mobile</strong> Hotspot by Sierra <strong>Wireless</strong>,<br />
http://nextelonline.nextel.com/NASApp/onlinestore/en/Action/DisplayPhones?phoneSKU=SWW8013G4G&id16=o<br />
verdrive (visited Jan. 25, 2010).<br />
918 Novatel <strong>Wireless</strong> Announces MiFi 2372 Intelligent <strong>Mobile</strong> Hotspot Optimized for North American HSPA<br />
Broadband Networks, BUSINESS WIRE, July 28, 2009, available at http://www.businesswire.com/<br />
portal/site/home/permalink/?ndmViewId=news_view&newsId=20090728005338&newsLang=en (visited Jan. 25,<br />
2010).<br />
183
Federal Communications Commission <strong>FCC</strong> 10-81<br />
both cellular and Wi-Fi networks. 919 According to CTIA, consumers in the United States have access to<br />
29 different Wi-Fi enabled handsets, 920 and 20 percent of new devices are now equipped with Wi-Fi<br />
capability. 921 As one example, the Apple iPhone runs on AT&T’s EDGE and UMTS/HSDPA networks<br />
but can use a Wi-Fi connection when one is available. 922 With the increasing prevalence of Wi-Fi<br />
enabled handsets, such as the iPhone, hotspot usage by handsets has increased significantly as well. 923<br />
According to one study, handsets accounted for 35 percent of all hot spot connects in 2009, up from 20<br />
percent in 2008, and are projected to account for half of all hot spot connects by 2011. 924 Furthermore,<br />
with the recent growth of wireless data traffic, Wi-Fi provides a means for providers to offload some data<br />
traffic from their wireless networks. For example, studies suggest that about 40 percent of iPhone traffic<br />
in the United States is transmitted over a Wi-Fi connection. 925<br />
349. In addition to using Wi-Fi as a means of data access, certain mobile providers use<br />
919 Wi-Fi in <strong>Mobile</strong> Phones: Dual Mode Becomes the Thing, In-Stat, Nov. 2009. See, e.g., AT&T, Cell Phones &<br />
Devices – <strong>Wireless</strong> from AT&T, http://www.wireless.att.com/cell-phone-service/cell-phones/cellphones.jsp?feacondition=allphones&feapaytype=standard&startFilter=<br />
false&allTypes=on&feawifiCapable=wifiCapable&allManus=on (visited Jan. 25, 2010) (listing 24 Wi-Fi capable<br />
phones or devices from AT&T); T-<strong>Mobile</strong>, HotSpot Phones: Talk Away!, http://www.tmobile.com/templates/ListAllPhones.aspx/?features=4ce9c948-6b53-4b76-a3f7-<br />
9116f33bd25b&WT.mc_n=TMHSDevice_WiFiLP&WT.mc_t=Offsite (visited Jan. 25, 2010) (listing 11 handsets<br />
available to use with T-<strong>Mobile</strong>’s Unlimited HotSpot Calling service, which allows for unlimited nationwide calls<br />
over Wi-Fi); US Cellular, US Cellular – Phones,<br />
http://www.uscellular.com/uscellular/zipCode.jsp?type=phones&call=0 (visited Jan. 25, 2010) (Wi-Fi capable<br />
handsets from US Cellular can be found by entering a zip code for a valid service area and applying the filter for<br />
“Wi-Fi” to the list of available handsets); Cincinnati Bell <strong>Wireless</strong>, Cincinnati Bell <strong>Wireless</strong> Phones and Devices,<br />
http://www.cincinnatibell.com/consumer/wireless/phones_and_devices/ ?view=fusionwifi (visited Jan. 25, 2010)<br />
(listing five handsets available for use with Cincinnati Bell <strong>Wireless</strong>’ Fusion WiFi service).<br />
920<br />
Letter from Christopher Guttman-McCabe, CTIA, to Marlene H. Dortch, Secretary, <strong>FCC</strong>, GN Docket No. 09-51<br />
(filed May 12, 2009).<br />
921 CTIA NOI Reply at 11. In addition, Sprint Nextel has announced that it will be “embracing WiFi in all its major<br />
devices going forward.” Mike Dano, Sprint’s Blackberry Tour to Sprout WiFi Next Year, FIERCEWIRELESS, July 9,<br />
2009, at http://www.fiercewireless.com/story/sprints-blackberry-tour-sprout-wifi-next-year/2009-07-09 (visited Feb.<br />
2, 2010).<br />
922 See Walter S. Mossberg and Katherine Boehret, Testing Out the iPhone, WALL STREET JOURNAL, June 27, 2007,<br />
at D1. The first iPhone model was able to seamlessly switch from an EDGE to a Wi-Fi connection, and<br />
automatically displayed a list of new Wi-Fi networks in range as the user moves to a new location. Later models of<br />
the iPhone – the iPhone 3G and iPhone 3G S – have added 3G UMTS/HSDPA capability and similarly offer Wi-Fi<br />
connectivity. See Walter S. Mossberg, Newer, Faster, Cheaper iPhone 3G, WALL STREET JOURNAL, July 8, 2008,<br />
at D1; Walter S. Mossberg, Apple iPhone 3G S Is Better Model – Or Just Get OS 3.0, WALL STREET JOURNAL, June<br />
18, 2009, at D1.<br />
923 See AdMob <strong>Mobile</strong> Metrics <strong>Report</strong> (Nov. 2009), available at http://metrics.admob.com/wpcontent/uploads/2009/12/AdMob-<strong>Mobile</strong>-Metrics-Nov-09.pdf<br />
(visited Feb. 10, 2010). According to the study, the<br />
percentage of mobile advertising requests from devices with Wi-Fi capability increased from 19 percent to 55<br />
percent between November 2008 and November 2009. In addition, the percentage of requests over a Wi-Fi network<br />
in the United States tripled – from 8 percent to 24 percent – during the same period. Id. at 3.<br />
924<br />
Hotspot Usage Is Increasingly Shifting Away From Notebooks and Laptops and Toward Handhelds, Press<br />
Release, In-Stat, Dec. 23, 2009.<br />
925 See AdMob <strong>Mobile</strong> Metrics <strong>Report</strong> (Nov. 2009), available at http://metrics.admob.com/wpcontent/uploads/2009/12/AdMob-<strong>Mobile</strong>-Metrics-Nov-09.pdf<br />
(visited Feb. 10, 2010) at 3 (stating that 36 percent of<br />
U.S. iPhone traffic is transmitted via Wi-Fi); see also AdMob <strong>Mobile</strong> Metrics <strong>Report</strong> (Nov. 2008), available at<br />
http://www.admob.com/marketing/pdf/mobile_metrics_nov_08.pdf at 2 (stating that 42 percent of iPhone traffic was<br />
transported over Wi-Fi).<br />
184
Federal Communications Commission <strong>FCC</strong> 10-81<br />
WLANs to augment their CMRS-based voice services with voice connections at Wi-Fi hot spots. T-<br />
<strong>Mobile</strong> and Cincinnati Bell <strong>Wireless</strong> offer Wi-Fi-based services – “T-<strong>Mobile</strong> @Home” and “Fusion<br />
WiFi,” respectively – featuring dual-mode mobile handsets that offer seamless voice connections on both<br />
Wi-Fi and the operators’ GSM cellular networks for about $10 per month. 926 These services offer<br />
improved, in-building coverage and unlimited calling through a specified home or office Wi-Fi router or<br />
at provider-branded hot spot locations. Through these services, consumers can avoid using their GSM<br />
voice minutes from their monthly service plans when they use service through a Wi-Fi hot spot. 927<br />
350. Several other providers also supplement their network coverage with services similar to<br />
the Wi-Fi router services discussed above. However, instead of connecting calls through a home Wi-Fi<br />
router operating over unlicensed spectrum, these other providers rely on femtocell devices. A femtocell is<br />
a miniature base station that transmits in the licensed spectrum of the wireless provider offering the<br />
device and provides improved coverage within a subscriber’s home. It uses the subscriber’s home<br />
broadband connection for backhaul. Sprint Nextel’s femtocell service, called Airave, allows<br />
subscribers to make unlimited wireless calls from their homes for a monthly service fee. 928 Sprint Nextel<br />
began offering its Airave service nationwide on August 17, 2008. 929 In 2009, both Verizon <strong>Wireless</strong><br />
and AT&T introduced their own femtocell products. The Verizon <strong>Wireless</strong> Network Extender was<br />
unveiled in January of 2009 and allows customers to place calls using their current phones and calling<br />
plans. 930 In late 2009, AT&T conducted a public trial of its femtocell product – the AT&T 3G MicroCell<br />
– in Charlotte, North Carolina. 931 According to one study, approximately 350,000 femtocells were<br />
shipped in 2009, although the study also notes that the pace of adoption for femtocells has been slower<br />
926 See T-<strong>Mobile</strong>, T-<strong>Mobile</strong> @Home, http://www.t-mobile.com/shop/addons/services/<br />
information.aspx?PAsset=T<strong>Mobile</strong>AtHome&tp=Svc_Sub_TMobilAtHomeOvw (visited Jan. 13, 2010); Cincinnati<br />
Bell <strong>Wireless</strong>, Cincinnati Bell <strong>Wireless</strong> – Fusion WiFi, http://www.cincinnatibell.com/consumer/<br />
wireless/fusion_wifi/ (visited Jan. 25, 2010).<br />
927 Id. Unlicensed <strong>Mobile</strong> Access (UMA) technology enables the seamless mobility afforded by these services, in<br />
which calls are automatically switched or handed off from a Wi-Fi to a cellular network, or vice versa, without<br />
interruption as a subscriber moves from one location to another. Glenn Fleishman, T-<strong>Mobile</strong> Might Make Home<br />
VoIP Play on Top of Converged Calling, WI-FI NET NEWS, Aug. 10, 2007.<br />
928 Sprint Nextel, Sprint Airave, http://www.nextel.com/en/services/airave/index.shtml (visited Jan. 13, 2010).<br />
Customers pay $99.99 to purchase the Airave base station plus a $4.99 per month enhanced coverage charge as well<br />
as an optional monthly fee of $10 per line for unlimited calling. Id. See also Sprint Nextel, Airave Frequently<br />
Asked Questions, at 3, http://www.nextel.com/assets/pdfs/en/services/sprint_airave_faqs.pdf (visited Jan. 13, 2010).<br />
The Airave includes voice, not data, services. Id. at 3.<br />
929 Sprint Customers Nationwide Can Soon Get Enhanced Coverage, Unlimited Calling in Homes, Offices With The<br />
Award-Winning Sprint AIRAVE By Samsung, Press Release, Sprint Nextel, July 30, 2008.<br />
930 See Verizon <strong>Wireless</strong> “Network Extender” Enhances In-Home Call Capabilities, Press Release, Verizon<br />
<strong>Wireless</strong>, Jan. 26, 2009. See also Verizon <strong>Wireless</strong>, Verizon <strong>Wireless</strong> Network Extender,<br />
http://www.verizonwireless.com/b2c/store/accessory?action=gotoFeatures (visited Jan. 13, 2010). Customers pay<br />
$249.99 for the Network Extender base station but pay no additional monthly access fee. Id. See also Verizon<br />
<strong>Wireless</strong>, Answers to FAQs, http://support.vzw.com/faqs/Equipment/network_extender.html (visited Jan. 25, 2010).<br />
The Network Extender does not support EVDO data speeds. Id.<br />
931 See Prince McLean, AT&T MicroCell to Cost $150, Require No Monthly Fee, AppleInsider, Sept. 21, 2009, at<br />
http://www.appleinsider.com/articles/09/09/21/att_3g_microcell_to_cost_150_require_no_monthly_fees.html.<br />
Under AT&T’s trial pricing, AT&T wireless customers pay $20 per month for unlimited calling with the 3G<br />
Microcell, while AT&T landline phone or Internet customers pay $10 per month, and customers with all three<br />
services can use the device for free. Id. See also AT&T, AT&T 3G MicroCell,<br />
http://www.wireless.att.com/learn/why/3gmicrocell/ (visited Jan. 13, 2010). The AT&T 3G MicroCell supports 3G<br />
data speeds and is currently available for purchase and use in select markets. Id.<br />
185
than previously expected. 932<br />
Federal Communications Commission <strong>FCC</strong> 10-81<br />
932 2009 Femtocell Shipment Numbers Cut by 55%, Press Release, ABI Research, Nov. 12, 2009.<br />
186
Federal Communications Commission <strong>FCC</strong> 10-81<br />
IX. URBAN-RURAL COMPARISONS<br />
351. Since the release of the Sixth <strong>Report</strong>, 933 the Commission has attempted to obtain a better<br />
understanding of the state of competition below the national level, and particularly in rural areas. The<br />
Communications Act does not include a statutory definition of what constitutes a rural area. 934 The<br />
Commission used Rural Services Areas (RSAs) as a proxy for rural areas for certain purposes, such as the<br />
former cellular cross-interest rule and the former CMRS spectrum cap, stating that “other market<br />
designations used by the Commission for CMRS, such as [EAs], combine urbanized and rural areas,<br />
while MSAs and RSAs are defined expressly to distinguish between rural and urban areas.” 935 Since its<br />
2004 <strong>Report</strong> and Order concerning deployment of wireless services in rural areas, however, the<br />
Commission has adopted a “baseline” definition of rural as a county with a population density of 100<br />
persons or fewer per square mile. 936 For this reason, we adopt this same definition to analyze service<br />
availability in rural areas in this <strong>Report</strong>.<br />
352. By this definition, roughly 61 million people, or 21 percent of the U.S. population, 937 live<br />
in rural counties. These counties comprise 3.1 million square miles, or 86 percent of the geographic area<br />
of the United States. 938 The distribution of rural counties across the United States can be seen in Map 3<br />
below. Approximately 79 percent of the U.S. population lives on 14 percent of the land, while 21 percent<br />
live on the remaining 86 percent of the land.<br />
933 Sixth <strong>Report</strong>, 16 <strong>FCC</strong> Rcd at 13350.<br />
934 The federal government has multiple ways of defining rural, reflecting the multiple purposes for which the<br />
definitions are used. Eighth <strong>Report</strong>, 18 <strong>FCC</strong> Rcd at 14834; Facilitating the Provision of Spectrum-Based Service to<br />
Rural Areas and Promoting Opportunities for Rural Telephone Companies to Provide Spectrum-Based Services,<br />
Notice of Proposed Rulemaking, 18 <strong>FCC</strong> Rcd 20802, 20808-11 (2003).<br />
935 1998 Biennial Regulatory Review, Spectrum Aggregation Limits for <strong>Wireless</strong> Telecommunications Carriers,<br />
<strong>Report</strong> and Order, 15 <strong>FCC</strong> Rcd 9219, 9256 84, n.203 (1999).<br />
936 Facilitating the Provision of Spectrum-Based Services to Rural Areas and Promoting Opportunities for Rural<br />
Telephone Companies To Provide Spectrum-Based Services, <strong>Report</strong> and Order, 19 <strong>FCC</strong> Rcd. 19078, 19087-88<br />
(2004) (“We recognize, however, that the application of a single, comprehensive definition for ‘rural area’ may not<br />
be appropriate for all purposes. . . . Rather than establish the 100 persons per square mile or less designation as a<br />
uniform definition to be applied in all cases, we instead believe that it is more appropriate to treat this definition as a<br />
presumption that will apply for current or future Commission wireless radio service rules, policies and analyses for<br />
which the term ‘rural area’ has not been expressly defined. By doing so, we maintain continuity with respect to<br />
existing definitions of ‘rural’ that have been tailored to apply to specific policies, while also providing a practical<br />
guideline”).<br />
937 Including the populations of Puerto Rico and the Virgin Islands.<br />
938 Including the populations of Puerto Rico and the Virgin Islands.<br />
187
Federal Communications Commission <strong>FCC</strong> 10-81<br />
Map 3<br />
U.S. County Density 939<br />
353. Using coverage maps provided by American Roamer, we find that 98.5 percent of the<br />
U.S. rural population, based on census blocks, has coverage by at least one mobile wireless voice<br />
provider. 940 This is only slightly lower than the percentage of the entire U.S. population, 99.6 percent,<br />
with coverage by at least one mobile voice provider. As shown in Table 38 and Chart 47 below, the<br />
percentage of the rural population with coverage by one or more providers (98.5 percent), or two or more<br />
providers (94.5 percent) is comparable to coverage for entire U.S. population. 941 Just over 900,000<br />
people in rural areas have no mobile wireless coverage, and approximately 2.5 million have coverage by<br />
only one provider, down from approximately 2.6 million in July 2008. In addition, there is a disparity in<br />
the percentage of rural and total U.S. population covered by three or more, four or more, five or more, and<br />
six or more mobile voice providers. The largest gap is with five or more providers: 73 percent of the total<br />
U.S. population is covered by five or more mobile voice providers, while just 39 percent of the rural<br />
population is covered by five or more mobile voice providers. 942<br />
939 A larger version of this map may be found in Appendix D.<br />
940 As discussed above in Section III.C.1, Number of Competitors, supra, there are 8 million census blocks in the<br />
United States, and a census block is the smallest geographic area for which population data is available. However,<br />
we note that we consider a census block to be covered even when only a portion of the block has mobile wireless<br />
coverage. In addition, different service providers may provide coverage in different areas within a census block.<br />
Any over counting of coverage may be accentuated in rural areas where census blocks are larger. See RTG PN<br />
Comments, at 6.<br />
941 See Table 6 in Section III.C.1, Number of Competitors, for the nationwide analog of Table 38.<br />
942 Commission analysis, using American Roamer database, Oct. 2009, and Census 2000 population figures.<br />
188
Federal Communications Commission <strong>FCC</strong> 10-81<br />
Table 38<br />
Estimated <strong>Mobile</strong> Voice Providers in Rural Areas by Census Block<br />
Total Number of<br />
Providers in a block<br />
Number of<br />
Rural Census<br />
Blocks<br />
POPs Contained<br />
in Rural Census<br />
Blocks<br />
189<br />
% of Total<br />
U.S. POPs<br />
Square Miles<br />
Contained in<br />
Those Blocks<br />
% of Total<br />
U.S.<br />
Square<br />
Miles<br />
Total for Rural U.S. 4,169,790 60,836,650 21.3% 3,367,687 88.6%<br />
% of<br />
Total Rural<br />
US POPs<br />
% of<br />
Total Rural<br />
US Square<br />
Miles<br />
1 or More 3,937,968 59,907,519 98.5% 2,310,870 68.6%<br />
2 or More 3,575,744 57,469,158 94.5% 1,759,319 52.2%<br />
3 or More 2,831,795 50,527,557 83.1% 1,131,548 33.6%<br />
4 or More 1,978,475 39,828,360 65.5% 641,065 19.0%<br />
5 or More 979,198 23,413,805 38.5% 257,068 7.6%<br />
6 or More 220,472 5,327,376 8.8% 50,192 1.5%<br />
7 or More 17,056 369,429 0.6% 3,918 0.1%<br />
Source: Commission estimates based on data supplied by American Roamer, Oct. 2009.<br />
Notes: POPs are from the 2000 Census, and the square miles include the United States and Puerto Rico.<br />
There are approximately 8 million census blocks and 300 million people in the entire United States.<br />
Number of Providers<br />
1 or more<br />
2 or more<br />
3 or more<br />
4 or more<br />
5 or more<br />
6 or more<br />
7 or more<br />
0.7%<br />
0.6%<br />
Chart 47<br />
<strong>Mobile</strong> Voice Providers in Rural Areas<br />
Percentage of Population Covered<br />
0.0% 20.0% 40.0% 60.0% 80.0% 100.0%<br />
8.8%<br />
19.1%<br />
354. The figures on the percentage of the U.S. rural population covered by a certain number of<br />
providers are similar to those in the Thirteenth <strong>Report</strong>. 943 In that <strong>Report</strong>, the Commission estimated,<br />
based on July 2007 American Roamer coverage maps, that 94.2 percent of the rural population had a<br />
943 See Thirteenth <strong>Report</strong>, 24 <strong>FCC</strong> Rcd at 6239, 104.<br />
38.5%<br />
65.5%<br />
72.8%<br />
83.1%<br />
Total U.S. Population<br />
Rural U.S. Population<br />
99.6%<br />
98.5%<br />
98.6%<br />
94.5%<br />
95.8%<br />
90.8%
Federal Communications Commission <strong>FCC</strong> 10-81<br />
choice of at least two providers, compared to 94.5 percent in October 2009. In addition, 82.1 percent of<br />
the rural population had a choice of at least three providers in July 2007, compared to 83.1 percent in<br />
October 2009; and 65.2 percent had a choice of at least four providers in July 2007, compared to 65.5<br />
percent in October 2009.<br />
355. Looking at mobile broadband service, Table 39 and Chart 48 below show that 92 percent<br />
of the U.S. rural population, based on a census block analysis of American Roamer data, has coverage by<br />
at least one mobile wireless broadband provider, compared 98 percent of the entire U.S. population. 944<br />
The U.S. population in rural areas is not served by as many providers as other areas of the country. While<br />
76 percent of the total U.S. population lives in census blocks with three or more mobile broadband<br />
providers, only 30 percent of the rural population is served by at least three broadband providers. In<br />
addition, 58 percent of the total U.S. population lives in census blocks with four or more mobile<br />
broadband providers; in rural areas, only ten percent of the population is served by four or more<br />
providers. 945<br />
Table 39<br />
Estimated <strong>Mobile</strong> Broadband Providers in Rural Areas by Census Block<br />
Total Number of<br />
Providers in a<br />
Block<br />
Number of<br />
Blocks<br />
POPs Contained<br />
in Those Blocks<br />
190<br />
% of Rural<br />
U.S. POPs<br />
Square Miles<br />
Contained in<br />
Those Blocks<br />
% of Rural<br />
U.S.<br />
Square<br />
Miles<br />
1 or More 3,422,482 55,990,890 92.0% 1,688,928 50.2%<br />
2 or More 1,889,535 37,592,392 61.8% 706,670 21.0%<br />
3 or More 635,043 18,032,174 29.6% 142,609 4.2%<br />
4 or More 160,703 6,350,563 10.4% 24,500 0.7%<br />
Source: Commission estimates based on data supplied by American Roamer, Nov. 2009 (EV-<br />
DO/HSDPA/WiMAX Coverage).<br />
Notes: POPs are from the 2000 Census, and the square miles include the United States and Puerto Rico.<br />
944 Commission analysis, using American Roamer database, Nov. 2009, and Census 2000 population figures.<br />
945 See Table 7 in Section III.C.1, Number of Competitors, supra.
Number of Providers<br />
1 or more<br />
2 or more<br />
3 or more<br />
4 or more<br />
Federal Communications Commission <strong>FCC</strong> 10-81<br />
Chart 48<br />
<strong>Mobile</strong> Broadband Providers in Rural Areas<br />
10.4%<br />
Percentage of Population Covered<br />
0.0% 20.0% 40.0% 60.0% 80.0% 100.0%<br />
29.6%<br />
191<br />
61.8%<br />
58.0%<br />
76.1%<br />
98.1%<br />
92.0%<br />
89.5%<br />
Total U.S. Population<br />
Rural U.S. Population<br />
356. In the fall of 2008, the National Telecommunications Cooperative Association (NTCA)<br />
surveyed its members regarding their provision of wireless services. 946 Population density in most NTCA<br />
member service areas is extremely rural, between one and five persons per square mile. 947 According to<br />
the survey report, 59 percent of survey respondents are offering wireless service to their customers. 948<br />
Among those respondents, 78 percent indicated that “competition from national carriers” was a major<br />
concern, and the average respondent indicated that their company competes with between one and four<br />
other providers, down from two to five other providers in the 2007 report. 949 In addition, the percentage<br />
of respondents who claim that obtaining financing is “very difficult” or “virtually impossible” rose from<br />
13 percent in 2007 to 34 percent in 2008. 950<br />
357. When looking at the features and services offered to wireless customers, a large<br />
percentage of the NTCA survey respondents that provide mobile wireless service offer family plans (92<br />
percent), text messaging (83 percent), and unlimited local calling (75 percent). 951 A smaller, though still<br />
significant, percentage offer Internet access (67 percent), e-mail (58 percent), prepaid service (58<br />
percent), and games by subscription (42 percent). 952 RTG claims that many rural service providers<br />
946 See NTCA, NTCA 2008 <strong>Wireless</strong> Survey <strong>Report</strong>, Jan. 2009, at 3 (Jan. 2008), available at<br />
http://www.ntca.org/images/stories/Documents/Advocacy/Survey<strong>Report</strong>s/2008ntcawirelesssurveyreport.pdf (2008<br />
NTCA <strong>Wireless</strong> Survey).<br />
947 2008 NTCA <strong>Wireless</strong> Survey, at 4.<br />
948 2008 NTCA <strong>Wireless</strong> Survey, at 6; NTCA PN Comments at 2.<br />
949 2008 NTCA <strong>Wireless</strong> Survey, at 9.<br />
950 2008 NTCA <strong>Wireless</strong> Survey, at 8.<br />
951 2008 NTCA <strong>Wireless</strong> Survey, at 10.<br />
952 2008 NTCA <strong>Wireless</strong> Survey, at 10.
Federal Communications Commission <strong>FCC</strong> 10-81<br />
continue to offer regional rate plans, a practice nearly abandoned by nationwide providers. 953 RTG also<br />
argues that mobile consumers in rural areas do not have the same choices that are available to consumers<br />
in urban and suburban areas, especially with respect to mobile broadband services. 954<br />
358. As discussed above, key inputs for the provision of mobile wireless services include<br />
spectrum, infrastructure, and backhaul, and such access to such inputs can affect entry into the mobile<br />
wireless services market in both urban and rural areas. 955 Areas with low population density, such as<br />
rural areas, tend to have fewer facilities-based competitors than areas with higher population densities<br />
because the market may not be large enough for a potential entrant to recoup its network deployment<br />
costs over time from service revenues. 956 Spectrum below 1 GHz can be crucial for the deployment of<br />
mobile wireless service in rural areas because its excellent propagation characteristics allow providers to<br />
cover a relatively large geographic area with a relatively small number of cell sites. 957 Therefore, we<br />
have examined the current spectrum holdings of service providers in rural areas in the frequency bands<br />
both above and below 1 GHz. Chart 49 below shows that 58 percent of the MHz-POPs in the spectrum<br />
below 1 GHz in rural areas are held by the two largest service providers, Verizon <strong>Wireless</strong> and AT&T. 958<br />
The spectrum holdings above 1 GHz, on the other hand, are less concentrated and held by a range of<br />
different service providers. As shown in Chart 50, the two largest providers hold only 23 percent of the<br />
MHz-POPs in the frequencies above 1 GHz.<br />
Chart 49<br />
MHz-POP Shares in Rural Areas: Below 1 GHz 959<br />
Verizon <strong>Wireless</strong><br />
39%<br />
Other<br />
25%<br />
953 RTG NOI Comments at 7.<br />
954 RTG NOI Comments at 8.<br />
192<br />
MetroPCS<br />
0.05%<br />
AT&T<br />
19%<br />
955 See Sections III.D, Entry and Exit Conditions, and VII.A, Input Segments, supra.<br />
956 See Section III.D.2, Non-Regulatory Entry and Exit Conditions, supra.<br />
957 See Section VII.A.1, Spectrum, supra.<br />
T-<strong>Mobile</strong><br />
0.1%<br />
US Cellular<br />
4%<br />
Sprint Nextel<br />
13%<br />
958 Although the chart reflects Verizon’s acquisition of Alltel, it does not reflect the divestiture of certain markets to<br />
other providers. See also, Table 25, Chart 41, and Chart 42 in Section VII.A.1, Spectrum, supra.<br />
959 Commission estimates.
Verizon <strong>Wireless</strong><br />
10%<br />
US Cellular<br />
2%<br />
T-<strong>Mobile</strong><br />
14%<br />
960 Commission estimates.<br />
Federal Communications Commission <strong>FCC</strong> 10-81<br />
Chart 50<br />
MHz-POP Shares in Rural Areas: Above 1 GHz 960<br />
AT&T<br />
13%<br />
Sprint Nextel<br />
12%<br />
193<br />
Clearwire<br />
27%<br />
Other<br />
16%<br />
Leap<br />
4%<br />
MetroPCS<br />
2%
Federal Communications Commission <strong>FCC</strong> 10-81<br />
X. INTERNATIONAL COMPARISONS<br />
359. This section compares mobile market structure and performance in the United States,<br />
Western Europe and Asia-Pacific countries of comparable income levels. 961 To ensure that a consistent<br />
methodology is used to compile the data for different countries, the comparison is based on international<br />
cross-section data compiled by Bank of America Merrill Lynch. 962 Consequently, the estimates of mobile<br />
penetration, MOUs, average RPM, and concentration (as measured by HHI) for the U.S. mobile market<br />
cited in this section differ somewhat from estimates provided in previous sections of the <strong>Report</strong> because<br />
they come from different sources. 963 In general, the comparison shows the following: (1) market<br />
structure is converging to three or four national competitors per market in many countries; (2) the calling<br />
party pays system used in most other countries tends to result in lower average voice usage (MOUs) and<br />
higher revenue per minute of voice service (RPM) than the receiving party pays system used in the United<br />
States; 964 (3) the average monthly subscriber bill in the United States is much higher than the average bill<br />
in Western Europe, although Japan has a higher average monthly bill than either the United States or<br />
Western Europe; and (4) international differences in regulatory policy and business environment have<br />
produced a wide variety of successful models for the mobile sector, with no one model dominating on all<br />
dimensions of market performance.<br />
961 In accordance with established practice in using international benchmarking to assess effective competition in<br />
mobile markets, the comparison of mobile market performance is restricted to Western Europe and parts of the Asia-<br />
Pacific in order to ensure that the countries being compared are roughly similar to the United States with regard to<br />
their level of economic and telecommunications infrastructure development. See, for example, UK regulator Oftel’s<br />
review of effective competition in the mobile market: Effective <strong>Competition</strong> Review: <strong>Mobile</strong>, Office of<br />
Telecommunications, Feb. 2001, at 7.<br />
962 See Glen Campbell et al., Global <strong>Wireless</strong> Matrix 4Q08, Bank of America/Merrill Lynch, Global Equity<br />
Research, Apr. 13, 2009 (Global <strong>Wireless</strong> Matrix 4Q08). The Merrill Lynch HHI calculations are used in this<br />
<strong>Report</strong> only for the purposes of the international comparison. The HHI calculation for the United States in Section<br />
III.C.2, Concentration Measures, supra, differs from the Merrill Lynch estimate discussed in Section X.E,<br />
Concentration, infra.<br />
963 In addition, Merrill Lynch has noted that these data have certain limitations for comparing countries that use<br />
calling party pays (CPP) versus mobile party pays (also known as receiving party pays). For reasons explained<br />
below, the figures for minutes of use may be somewhat understated, and the revenue figures used to calculate<br />
average revenue per minute may be somewhat overstated, in markets where CPP is used relative to non-CPP<br />
markets.<br />
964 See Thirteenth <strong>Report</strong>, 24 <strong>FCC</strong> Rcd at 6290, 223.<br />
194
Federal Communications Commission <strong>FCC</strong> 10-81<br />
Table 40<br />
<strong>Mobile</strong> Market Performance in Selected Countries 965<br />
Country Penetration Prepaid MOUs Revenue per ARPU Data<br />
(% of Pops) (% of Subs)<br />
Minute ($) ($) (% of ARPU)<br />
Receiving Party Pays<br />
USA 88.9 17.1 829 0.05 51.54 25.5<br />
Canada 64.8 21.2 444 0.09 49.24 17.8<br />
Hong Kong 147.6 44.9 447 0.04 20.40 26.7<br />
Singapore 135.8 48.6 377 0.06 32.08 27.3<br />
Calling Party Pays<br />
UK 125.5 62.0 192 0.12 35.35 27.8<br />
Germany 130.6 56.6 102 0.16 20.59 25.3<br />
Italy 152.7 88.3 131 0.16 26.87 24.7<br />
Sweden 123.6 35.0 206 0.10 28.05 20.9<br />
France 91.9 34.2 246 0.14 44.37 18.3<br />
Finland 127.5 12.7 244 0.12 33.91 18.9<br />
Japan 85.7 1.4 139 0.26 56.82 41.0<br />
South Korea 93.9 3.0 320 0.08 30.34 17.0<br />
Australia 109.9 44.9 218 0.11 34.57 32.4<br />
A. ARPU<br />
360. The average monthly subscriber bill (ARPU) in the United States, at $51.54, is much<br />
higher than the Western European average of $33.45. 966 As explained below, however, although U.S.<br />
subscribers on average spend more per month for mobile services than their European counterparts, they<br />
also consume more mobile service, on average, compared to Europe. We note that Japan has a higher<br />
ARPU than either the United States or Western Europe. As indicated below and in the Table 42 above,<br />
the relatively high average monthly subscriber bill in Japan reflects two key factors – a relative high price<br />
per minute of voice service and relatively higher monthly spending per subscriber on data services.<br />
B. Average Revenue Per Minute<br />
361. As noted above, some analysts regard RPM as a good proxy for mobile pricing. 967 RPM<br />
in Western Europe averaged about $0.16 in the fourth quarter of 2008, and ranged from a low of $0.10 in<br />
Sweden to a high of $0.29 in Switzerland. 968 At $0.05, RPM in the United States during the same period<br />
965 Global <strong>Wireless</strong> Matrix 4Q08.<br />
966 Global <strong>Wireless</strong> Matrix 4Q08, at 2.<br />
967 See Section V.E.1, Price Indicators, supra. Average RPM is calculated by dividing monthly voice-only ARPU<br />
by MOUs. Service revenues included in ARPU reflect the fees mobile operators collect from other network<br />
operators for terminating incoming calls on their networks as well as monthly service charges and usage fees paid by<br />
mobile subscribers. As noted above, MOUs figures may be somewhat understated in CPP markets relative to non-<br />
CPP markets (due to the aforementioned double-counting of on-net mobile-to-mobile minutes in non-CPP markets),<br />
and the revenue figures used to calculate ARPU may be somewhat overstated in CPP markets relative to non-CPP<br />
markets (due to double-counting of mobile termination revenues for off-net mobile-to-mobile calls in CPP markets).<br />
Consequently, the RPM figures (ARPU divided by MOUs) probably overstate the difference between RPM in the<br />
United States and CPP markets. The potential for service revenues to be somewhat overstated in CPP markets was<br />
brought to the Commission’s attention by Professor Stephen Littlechild, and confirmed by Merrill Lynch through email<br />
correspondence.<br />
968 Global <strong>Wireless</strong> Matrix 4Q08, at 2.<br />
195
Federal Communications Commission <strong>FCC</strong> 10-81<br />
remained less than one-third of the European average. 969 Revenue per minute in Japan, at $0.26, was<br />
more than five times the U.S. figure at the end of 2008. 970<br />
C. Usage<br />
362. Bank of America Merrill Lynch estimates that U.S. mobile subscribers talked an average<br />
of 829 minutes per month on their mobile phones in the fourth quarter of 2008. 971 This compares with<br />
139 MOUs in Japan and an average across Western Europe of 158 MOUs, with estimated MOUs in<br />
individual European countries ranging from a low of 102 in Germany to a high of 246 in France. 972<br />
D. Penetration Rates<br />
363. According to Bank of America Merrill Lynch, mobile penetration in the United States<br />
was almost 89 percent in the fourth quarter of 2008. 973 In comparison, Japan finished 2008 with mobile<br />
penetration nearing 86 percent, while mobile penetration averaged an estimated 127.7 percent in Western<br />
Europe at the end of 2008 and ranged from 92 percent in France to nearly 202 percent in Greece. 974 In<br />
most West European countries, estimated mobile penetration exceeded 100 percent at the end of 2008,<br />
due in part to a high percentage of prepaid subscribers and ownership of multiple devices or subscriber<br />
identity module (SIM) cards. 975<br />
E. Concentration<br />
364. Bank of America/Merrill Lynch’s Global <strong>Wireless</strong> Matrix provides a cross-country<br />
969 Global <strong>Wireless</strong> Matrix 4Q08, at 2. In e-mail correspondence, Merrill Lynch has indicated that RPM figures<br />
may overstate the difference between RPM in CPP and non-CPP markets by about 15 percent due to the two factors<br />
mentioned above. See also, AT&T PN Comments at 16.<br />
970 Global <strong>Wireless</strong> Matrix 4Q08, at 2.<br />
971 Global <strong>Wireless</strong> Matrix 4Q08, at 2. This is higher than the 708 average monthly MOUs estimated by CTIA for<br />
the second half of 2008. See Section V.D, Output and Usage Levels, supra. For purposes of comparing metrics in<br />
different countries, average MOUs include both incoming and outgoing minutes, and usually exclude traffic related<br />
to mobile data services. Figures for MOUs are potentially somewhat understated in markets that employ CPP as<br />
compared to the U.S. mobile market and other non-CPP markets due to double-counting of same-network (“on-net”)<br />
mobile-to-mobile minutes under the mobile party pays system used in the United States and other non-CPP markets.<br />
The double counting occurs because each minute of an on-net call is billed to both the caller and the receiver under<br />
the mobile party pays system, whereas under CPP each on-net minute is billed only to the calling party, and<br />
therefore counted only once. See Tenth <strong>Report</strong>, 20 <strong>FCC</strong> Rcd at 15976, n.457.<br />
972 Global <strong>Wireless</strong> Matrix 4Q08, at 2.<br />
973 Global <strong>Wireless</strong> Matrix 4Q08, at 2.<br />
974 Global <strong>Wireless</strong> Matrix 4Q08, at 2.<br />
975 Global <strong>Wireless</strong> Matrix 4Q08, at 2. <strong>Report</strong>ed mobile subscriber figures and penetration may be overstated in<br />
some countries, particularly those with a high percentage of prepaid subscribers, due in part to a combination of<br />
factors: (1) slow clearing out of inactive users (for example, subscribers who have switched service providers) from<br />
their former provider’s subscriber base; (2) multiple device ownership (for example, users of a Blackberry plus a<br />
mobile phone); and (3) multiple SIM card ownership (for example, users who switch between operators in order to<br />
take advantage of different tariffs at different times of the day or week). See Jeff Kvaal et al., <strong>Wireless</strong> Equipment<br />
Industry Update: Strong Net Adds Drive Higher Phone Units, Lehman Brothers, Equity Research, Jan. 16, 2007, at<br />
4. As noted in previous reports, carriers have widely different policies to determine when to cut off inactive<br />
subscribers and to remove them from their reported subscriber base. In addition, it is becoming more prevalent for<br />
people to subscribe to multiple mobile service providers. See, e.g., Eleventh <strong>Report</strong>, 21 <strong>FCC</strong> Rcd at 11021, 190<br />
n.506; Tenth <strong>Report</strong>, 20 <strong>FCC</strong> Rcd at 15976, n.452; Seventh <strong>Report</strong>, 17 <strong>FCC</strong> Rcd at 13033, and Sixth <strong>Report</strong>, 16 <strong>FCC</strong><br />
Rcd at 13391.<br />
196
Federal Communications Commission <strong>FCC</strong> 10-81<br />
comparison of HHIs calculated at national level. 976 For the United States, the HHI at the national level is<br />
calculated by summing the squares of the subscriber market shares of the four nationwide operators and<br />
the residual subscriber market share of all remaining regional and local operators combined. Overall, this<br />
methodology understates concentration in industries, such as mobile wireless service, where the relevant<br />
geographic market is sub-national, and where the choice of competing providers is not relatively uniform<br />
throughout the country. 977 The U.S. mobile market, for instance, is characterized by significant regional<br />
variation in choice of competing providers.<br />
365. The Bank of America/Merrill Lynch study estimated that the U.S. mobile market had an<br />
HHI of 2220 at the end of 2008, the lowest among comparable countries in Western Europe and the Asia<br />
Pacific region, as shown in Table 41. 978 As discussed above, we estimated an average HHI for the<br />
United States of 2848 at the end of 2008, based on EA subscriber market shares. 979<br />
Table 41<br />
<strong>Mobile</strong> Market Structure in Selected Countries (Merrill Lynch Calculation) 980<br />
Country Nationwide HHI Number of<br />
Competitors 981<br />
Top 2 Share<br />
(%)<br />
USA 2220 4 55.2%<br />
UK 2240 5 50.6%<br />
Germany 2920 4 70.2%<br />
Italy 3020 4 71.7%<br />
Canada 3110 3 67.4%<br />
Australia 3120 4 73.3%<br />
Sweden 3370 4 75.9%<br />
France 3390 3 78.1%<br />
Finland 3490 3 77.0%<br />
Japan 3590 3 77.6%<br />
366. The relatively low level of concentration in the UK mobile market reflects the presence<br />
of five national operators and the roughly equal market shares of the top four operators. 982 However, in<br />
976 See Global <strong>Wireless</strong> Matrix 4Q08, at 2. This section discusses HHI measures for different countries but does not<br />
discuss or account for any regulatory measures taken in other countries that are designed to protect consumers from<br />
potential anti-competitive provider conduct in a concentrated market.<br />
977 This methodology essentially treats all regional and local operators as if they comprised a single fifth competing<br />
nationwide operator. Since a certain percentage of the U.S. population lives in areas with more than five competing<br />
operators and a certain percentage lives in areas with less than five, the Merrill Lynch estimate of HHI at the<br />
national level overstates concentration in some local geographic markets, while understating concentration in others.<br />
978 Global <strong>Wireless</strong> Matrix 4Q08, at 2. See also, AT&T PN Comments at 16 (Compared to the 26 industrialized<br />
countries tracked by the OECD, the United States is the least concentrated.)<br />
979 See Section III.C, Horizontal Concentration, supra.<br />
980 Global <strong>Wireless</strong> Matrix 4Q08. As noted above, HHI is calculated based on national market share. The average<br />
HHI in the U.S. is 2848 as described in Section III.C, Horizontal Concentration, supra.<br />
981 While there are four nationwide mobile providers in the United States, the HHI for the United States, as<br />
described above, is calculated by summing the squares of the subscriber market shares of the four nationwide<br />
operators and the residual subscriber market share of all remaining regional and local operators combined, treating<br />
all regional and local operators as if they comprised a single fifth competing operator. For countries other than the<br />
United States, the HHI generally is calculated by summing the squares of all of the mobile operators, regardless of<br />
whether the operator’s network covers a nationwide footprint. If this same methodology were used for the United<br />
States, the U.S. HHI would be considerably lower, given the large number of regional and local mobile operators in<br />
the United States with sub-national footprints.<br />
982 Id., at 184.<br />
197
Federal Communications Commission <strong>FCC</strong> 10-81<br />
September 2009, Deutsche Telekom and France Telecom announced a deal to merge their UK<br />
subsidiaries, third and fourth largest mobile operators in the UK – T-<strong>Mobile</strong> UK and Orange UK – to<br />
form the country’s largest mobile wireless operator, with a combined subscriber market share of roughly<br />
38 percent. 983 The European Commission approved the transaction, with conditions, on Mar. 1, 2010. 984<br />
This merger will likely result in a significant increase in the national HHI for the UK mobile market.<br />
367. The higher levels of concentration in the other Western European countries and Japan<br />
reflect two factors. One is the smaller number of competitors per market, with four national operators in<br />
Germany, Italy and Sweden and three national operators in France, Finland and Japan. Second, each<br />
market tends to be dominated by the top two competitors, which have a combined market share ranging<br />
from approximately 70-72 percent in Germany and Italy to approximately 77-78 percent in France,<br />
Finland and Japan. 985<br />
983 Kathy Sandler and Geraldine Amiel, U.K. <strong>Mobile</strong> Deal Unveiled, WALL STREET JOURNAL, Sept. 9, 2009.<br />
984 Mergers: Commission Approves Proposed Merger Between UK Subsidiaries France Telecom and Deutsche<br />
Telekom, Subject to Conditions, Press Release, European Commission, Mar. 1, 2010. The merger approval was<br />
conditioned upon the amendment of a network sharing agreement with Hutchison 3G UK and the divestiture of a<br />
quarter of the combined spectrum of the merging parties in the 1800 MHz Band. Id.<br />
985 Global <strong>Wireless</strong> Matrix 4Q08.<br />
198
Federal Communications Commission <strong>FCC</strong> 10-81<br />
XI. CONCLUSION<br />
368. In the Thirteenth <strong>Report</strong>, the Commission found effective competition in the CMRS<br />
market based on a variety of metrics, including the number of providers, subscribers, usage, and<br />
prices. Since the period covered by the Thirteenth <strong>Report</strong>, CMRS competition has grown stronger by<br />
some of the measures previously considered, but weaker by others. To better comply with Congress’s<br />
mandate to assess market conditions, this <strong>Report</strong> looks beyond the metrics considered in the Thirteenth<br />
<strong>Report</strong> and undertakes a more expansive and detailed analysis of the mobile wireless industry than past<br />
reports. This <strong>Report</strong> concludes that CMRS is now one class of services that are part of the larger mobile<br />
wireless services industry. For instance, many providers of CMRS also offer a variety of mobile data<br />
services, including mobile broadband Internet access service, which is not classified as a “commercial<br />
mobile radio service.” Therefore, this <strong>Report</strong> integrates the analysis of CMRS competition into a more<br />
comprehensive analysis of competition across all mobile wireless services, including voice, messaging,<br />
and broadband services. This <strong>Report</strong> is also more expansive in terms of the scope of its competitive<br />
analysis. As with past reports, this <strong>Report</strong> examines the structure of the mobile wireless industry, the<br />
conduct of service providers, industry performance metrics, and consumer responses to mobile wireless<br />
service offerings. For the first time, the Fourteenth <strong>Report</strong> analyzes competition throughout the entire<br />
mobile wireless ecosystem, expanding its analysis to include key mobile wireless service inputs – such as<br />
spectrum and backhaul facilities – as well as downstream products, such as handsets/devices and mobile<br />
applications. Key findings of this <strong>Report</strong> are discussed in Section I, Executive Summary.<br />
XII. PROCEDURAL MATTERS<br />
369. This Fourteenth <strong>Report</strong> is issued pursuant to authority contained in Section 332(c)(1)(C)<br />
of the Communications Act of 1934, as amended, 47 U.S.C. § 332(c)(1)(C).<br />
370. It is ORDERED that copies of this <strong>Report</strong> be sent to the appropriate committees and<br />
subcommittees of the United States House of Representatives and the United States Senate.<br />
371. It is FURTHER ORDERED that the proceeding in the WT Docket No. 09-66 IS<br />
TERMINATED.<br />
199<br />
FEDERAL COMMUNICATIONS COMMISSION<br />
Marlene H. Dortch<br />
Secretary
Federal Communications Commission <strong>FCC</strong> 10-81<br />
APPENDIX A<br />
Spectrum Bands Available for <strong>Mobile</strong> <strong>Wireless</strong> Service<br />
1. Currently, mobile telephone operators primarily use market based spectrum licenses to<br />
provide mobile voice and, in most cases, mobile data services. These licenses are issued by a competitive<br />
bidding process for a range of predefined spectrum blocks (e.g., 10 megahertz, 20 megahertz or some<br />
other amount) over a defined geographic area (e.g., a Major Economic Area as outlined in section 27.6 of<br />
the Rules). Initially, the Commission authorized up to eight different mobile telephone licenses (two<br />
cellular in the 800 MHz band and six broadband PCS in the 2 GHz band) in every geographical area of<br />
the country. 1 However, over the years, additional services have been created that allow similar operations<br />
in different bands – including 700 MHz, AWS-1, BRS/EBS, WCS, and 1670-1675 MHz,– that are<br />
licensed under the Commission’s flexible Part 90, Part 27 or Part 24 rules and can be used to provide<br />
CMRS services. 2 Under Commission rules, licensees may lease spectrum resources to a third party for a<br />
period of time; or may disaggregate (divide the spectrum into smaller amounts of bandwidth) and/or<br />
partition (divide the license into smaller geographical areas) their licenses to other entities. 3 Many<br />
licensees hold more than one license in a particular market. 4 We discuss in more detail below spectrum<br />
bands potentially available for terrestrial CMRS. Band plan diagrams for each spectrum band depict<br />
where the frequencies are located. Spectrum described in this section may be used for a variety of CMRS<br />
products including mobile telephony, broadband data and mobile video services. In addition to the<br />
terrestrial spectrum described in this section, there is an additional 157.7 megahertz of mobile satellite<br />
spectrum available for CMRS voice and data services.<br />
A. Cellular<br />
2. The Commission began licensing commercial cellular providers in 1982 and completed<br />
licensing the majority of operators by 1991. The Commission divided the United States and its<br />
possessions into 734 cellular market areas (CMAs), including 305 Metropolitan Statistical Areas (MSAs),<br />
428 Rural Service Areas (RSAs), and a market for the Gulf of Mexico. 5 Two cellular systems were<br />
1 As a result of partitioning and disaggregation, there often are more than eight cellular and broadband PCS licenses<br />
in a market. However, in a few areas, there may be fewer than eight active licenses because certain auction winners<br />
or licensees have defaulted on payments to the Commission, because some licensees did not meet their buildout<br />
requirements, some licensees returned their licenses, or some licenses remained unsold in an auction.<br />
2 The discussion in this <strong>Report</strong> is to be distinguished from the identification of the relevant spectrum input markets<br />
in the context of Commission review of individual wireless license transfers and assignments. For example, in<br />
wireless transactions, the Commission includes, in its evaluation of potential competitive harm, spectrum in<br />
particular bands that is “suitable” for the provision of services in a relevant product market. See Applications of<br />
AT&T Inc. and Dobson Communications Corporation, Memorandum Opinion and Sprint Nextel/Clearwire Order,<br />
<strong>FCC</strong> 07-19608-259, at 17 26 (rel. Nov. 19, 2007) 53; Verizon <strong>Wireless</strong>/Alltel Order, <strong>FCC</strong> 08-258, at 53<br />
(“[S]uitability is determined by whether the spectrum is capable of supporting mobile service given its physical<br />
properties and the state of equipment technology, whether the spectrum is licensed with a mobile allocation and<br />
corresponding service rules, and whether the spectrum is committed to another use that effectively precludes its uses<br />
for mobile telephony/broadband service.”)<br />
3 See 47 C.F.R. §§ 1.948(e), (f), 22.948, 24.104, 27.15, 24.714, 27.904, 90.813, 90.911.<br />
4 While no longer in operation, at one time the Commission’s CMRS spectrum cap restricted the distribution of<br />
certain spectrum licenses. Recently, licensees have requested that the Commission take measures to restrict the<br />
ability of current major 700 MHz license holders to acquire additional 700 MHz spectrum rights.<br />
5 Under the original cellular licensing rules, one of the two cellular channel blocks in each market (the B block) was<br />
awarded to a local wireline carrier, while the other block (the A block) was awarded competitively to a carrier other<br />
than a local wireline incumbent. After awarding the first 30 MSA licenses pursuant to comparative hearing rules,<br />
the Commission adopted rules in 1984 and 1986 to award the remaining cellular MSA and RSA licenses through<br />
(continued….)<br />
200
Federal Communications Commission <strong>FCC</strong> 10-81<br />
licensed in each market area. The Commission designated 50 megahertz of spectrum in the 800 MHz<br />
frequency band for the two competing cellular systems in each market (25 megahertz for each system).<br />
Initially, cellular systems offered service using analog technology, but today cellular systems use digital<br />
modulation technologies for increased capacity and service options.<br />
698<br />
700 MHz Band<br />
B. Broadband PCS<br />
698-940 MHz: Cellular Spectrum<br />
700 MHz Public Safety<br />
700 MHz Public Safety<br />
806<br />
800 MHz Public Safety*<br />
824<br />
817<br />
201<br />
800 MHz SMR* 900 MHz SMR<br />
Cellular Cellular<br />
849<br />
800 MHz Public Safety*<br />
869<br />
862<br />
901<br />
896<br />
894<br />
Narrow-<br />
Band<br />
PCS<br />
3. The Broadband PCS was established in the mid 1990s to expand spectrum options and<br />
the competitive marketplace for mobile services beyond the cellular service. Broadband PCS systems<br />
operate in different spectrum bands and have been designed from the beginning to use a digital format.<br />
Broadband PCS licenses have been assigned through auction, beginning in 1995. 6 The Commission has<br />
set aside the spectrum between 1850 MHz and 1990 MHz for broadband PCS. While this spectrum (120<br />
megahertz total) originally accommodated telephony and limited messaging services, many licensees<br />
have evolved their networks to now provide third generation mobile services, which include broadband<br />
applications such as internet access and media applications. This spectrum was divided originally into<br />
three blocks of 30 megahertz each (blocks A, B, and C) and three blocks of 10 megahertz each (blocks D,<br />
E, and F). 7 Two of the 30 megahertz blocks (A and B blocks) are assigned on the basis of 51 Major<br />
Trading Areas (MTAs). 8 One of the 30 megahertz blocks (C block) 9 and all three of the 10 megahertz<br />
(Continued from previous page)<br />
lotteries. By 1991, lotteries had been held for every MSA and RSA, and licenses were awarded to the lottery<br />
winners in most instances. In some RSA markets, however, the initial lottery winner was disqualified from<br />
receiving the license because of a successful petition to deny or other Commission action. Implementation of<br />
Competitive Bidding Rules to License Certain Rural Service Areas, <strong>Report</strong> and Order, 17 <strong>FCC</strong> Rcd 1960, 1961-62<br />
(2002). In 1997, the Commission auctioned cellular spectrum in areas unbuilt by the original cellular licensees. See<br />
<strong>FCC</strong>, Auction 12: Cellular Unserved, http://wireless.fcc.gov/auctions/12 (visited Mar. 16, 2010). In 2002, the<br />
Commission auctioned three RSA licenses where the initial lottery winner had been disqualified. See <strong>FCC</strong>, Auction<br />
45: Cellular RSA, http://wireless.fcc.gov/auctions/45 (visited Mar. 16, 2010). In 2008, the Commission held a<br />
closed auction for unserved cellular spectrum that was the subject of two groups of pending mutually exclusive<br />
long-form applications. See <strong>FCC</strong>, Auction 77: Closed Cellular Unserved, http://wireless.fcc.gov/auctions/477<br />
(visited Mar. 16, 2010).<br />
6 The first auction was for two license blocks of 30 megahertz each in 51 Major Trading Areas (MTAs). <strong>FCC</strong><br />
Grants 99 Licenses for Broadband Personal Communications Services in Major Trading Areas, News Release, <strong>FCC</strong>,<br />
June 23, 1995. However, in New York, Washington/Baltimore, and Los Angeles/San Diego, only one license block<br />
was auctioned, because one license in each market was awarded as part of a pioneer preference program in 1994.<br />
Three Pioneer Preference PCS Applications Granted, News Release, <strong>FCC</strong>, Dec. 14, 1994. The Commission has<br />
since had numerous additional broadband PCS auctions. See <strong>FCC</strong>, Auctions Home, http://wireless.fcc.gov/auctions/<br />
(visited Mar. 16, 2010).<br />
7 Initially, the Commission’s broadband PCS allocation included 20 megahertz of spectrum at 1910 MHz - 1930<br />
MHz for unlicensed broadband PCS. Ten megahertz has since been allocated on a nationwide basis to Sprint<br />
Nextel. See Improving Public Safety Communications in the 800 MHz Band, <strong>Report</strong> and Order, Fifth <strong>Report</strong> and<br />
Order, Fourth Memorandum Opinion and Order, 19 <strong>FCC</strong> Rcd 14969, 15083 (2004).<br />
8 Major Trading Areas are Material Copyright (c) 1992 Rand McNally & Company. Rights granted pursuant to a<br />
license from Rand McNally & Company through an arrangement with the <strong>FCC</strong>. Rand McNally’s MTA<br />
(continued….)<br />
940<br />
935
locks are assigned on the basis of 493 Basic Trading Areas (BTAs). 10<br />
1710<br />
1700 1700<br />
1755<br />
Federal Communications Commission <strong>FCC</strong> 10-81<br />
1700-2200 MHz: Broadband PCS Spectrum<br />
AWS-1 Broadband Broadband MSS AWS-1 AWS MSS<br />
PCS<br />
PCS<br />
3<br />
C. SMR<br />
1850<br />
Proposed AWS-2 Block<br />
Sprint Nextel<br />
1930<br />
1920<br />
1910<br />
202<br />
Sprint Nextel<br />
2000<br />
1990<br />
2025<br />
2020<br />
Proposed AWS-2 Block<br />
4. The Commission first established SMR in 1979 to provide for land mobile<br />
communications on a commercial basis. The Commission initially licensed spectrum in the 800 and 900<br />
MHz bands for this service, in non-contiguous bands, on a site-by-site basis. 11 The Commission has since<br />
licensed additional SMR spectrum through auctions. 12 In total, the Commission has licensed 19<br />
megahertz of SMR spectrum, plus an additional 7.5 megahertz of spectrum that is available for SMR as<br />
well as other services. 13 While Commission policy permits flexible use of this spectrum, including the<br />
(Continued from previous page)<br />
specification contains 47 geographic areas covering the 50 states and the District of Columbia. For its spectrum<br />
auctions, the Commission has added three MTA-like areas: Guam and the Northern Mariana Islands, Puerto Rico<br />
and the U.S. Virgin Islands, and American Samoa. In addition, Alaska was separated from the Seattle MTA into its<br />
own MTA-like area. MTAs are combinations of two or more Basic Trading Areas.<br />
9 The Commission also has reconfigured returned C block licenses. See Tenth <strong>Report</strong>, 20 <strong>FCC</strong> Rcd at 15935, 71,<br />
n.150.<br />
10 Basic Trading Areas (BTAs) are Material Copyright (c) 1992 Rand McNally & Company. Rights granted<br />
pursuant to a license from Rand McNally & Company through an agreement with the <strong>FCC</strong>. BTAs are geographic<br />
areas drawn based on the counties in which residents of a given BTA make the bulk of their shopping goods<br />
purchases. Rand McNally’s BTA specification contains 487 geographic areas covering the 50 states and the District<br />
of Columbia. For its spectrum auctions, the Commission added additional BTA-like areas for: American Samoa;<br />
Guam; Northern Mariana Islands; San Juan, Puerto Rico; Mayagüez/Aguadilla-Ponce, Puerto Rico; and the U.S.<br />
Virgin Islands.<br />
11 The “900 MHz” SMR band refers to spectrum allocated in the 896-901 and 935-940 MHz bands; the “800 MHz”<br />
band refers to spectrum allocated in the 806-824 and 851-869 MHz bands. See 47 C.F.R. § 90.603; see also 47<br />
C.F.R. § 90.7 (defining “specialized mobile radio system”).<br />
12 The Commission has held multiple auctions for SMR licenses. See <strong>FCC</strong>, Auctions Home,<br />
http://wireless.fcc.gov/auctions/ (visited Mar. 16, 2010).<br />
13 There are five megahertz in the 900 MHz band (200 paired channels x 12.5 kHz/channel). See 47 C.F.R.<br />
§ 90.617, Table 4B. There are 21.5 megahertz in the 800 MHz band: 14 megahertz in the 800 SMR Service (280<br />
paired channels x 25 kHz/channel) and 7.5 megahertz in the 800 MHz General Category (150 paired channels x 25<br />
kHz/channel). See 47 C.F.R. § 90.615, Table 1 (SMR General Category) and 47 C.F.R. § 90.617, Table 4A (SMR<br />
Service). In 2000, the Commission amended its rules to allow Business and Industrial/Land Transportation<br />
licensees in the 800 MHz band to use their spectrum for CMRS operations under certain conditions.<br />
Implementation of Sections 309(j) and 337 of the Communications Act of 1934 as Amended Promotion of Spectrum<br />
Efficient Technologies on Certain Part 90 Frequencies; Establishment of Public Service Radio Pool in the Private<br />
<strong>Mobile</strong> Frequencies Below 800 MHz; Petition for Rule Making of The American <strong>Mobile</strong> Telecommunications<br />
Association, <strong>Report</strong> and Order and Further Notice of Proposed Rule Making, 15 <strong>FCC</strong> Rcd 22709, 22760-61 (2000).<br />
This could make up to five megahertz of additional spectrum available for digital SMR providers: 2.5 megahertz in<br />
the Industrial/Land Transportation Category (50 paired channels x 25 kHz/channel) and 2.5 megahertz in the<br />
Business Category (50 paired channels x 25 kHz/channel). See 47 C.F.R. § 90.617, Tables 2A and 3A. As<br />
discussed in Section I.A.1.a(iii)(a), 800 MHz Band Reconfiguration and 1.9 GHz Spectrum Exchange, infra, the<br />
configuration of the 800 MHz band is changing as a result of a new band plan adopted by the Commission.<br />
2110<br />
2155<br />
2180<br />
2175<br />
2200
Federal Communications Commission <strong>FCC</strong> 10-81<br />
provision of paging, dispatch, mobile voice, mobile data, facsimile, or combinations of these services, 14<br />
the primary use for SMR traditionally was dispatch services. 15 With the development of digital<br />
technologies that increased spectral efficiency, SMR providers such as Sprint Nextel (on its iDEN<br />
network) and SouthernLINC <strong>Wireless</strong>, a unit of the energy firm Southern Company, became more<br />
significant competitors in mobile telephony, while also maintaining dispatch functionality as a part of<br />
their service offerings. Furthermore, in apparent response to the dispatch functionality of SMR services,<br />
many cellular and broadband PCS providers now offer push-to-talk (PTT) functionality on their networks,<br />
including Verizon <strong>Wireless</strong> and AT&T. SMR spectrum is also used for certain data-only networks.<br />
698<br />
700 MHz Band<br />
698-940 MHz: SMR Spectrum<br />
700 MHz Public Safety<br />
* Post-800 MHz Band Reconfiguration<br />
700 MHz Public Safety<br />
806<br />
800 MHz Public Safety*<br />
824<br />
817<br />
203<br />
800 MHz SMR* 900 MHz SMR<br />
Cellular Cellular<br />
849<br />
800 MHz Public Safety*<br />
869<br />
862<br />
901<br />
896<br />
894<br />
Narrow-<br />
Band<br />
PCS<br />
940<br />
935<br />
1. 800 MHz Band Reconfiguration and 1.9 GHz Spectrum Exchange<br />
5. On July 8, 2004, the Commission adopted a new band plan for the 800 MHz band to<br />
resolve the problem of interference to public safety radio systems operating in the band from CMRS<br />
providers operating systems on channels in close proximity to those utilized by public safety entities. 16<br />
The new band plan addresses the root cause of the interference problem by separating generally<br />
incompatible technologies, with the costs of relocating 800 MHz incumbents to be paid by Sprint Nextel.<br />
To accomplish the reconfiguration, the Commission required Sprint Nextel to give up rights to certain of<br />
its licenses in the 800 MHz band and all of its licenses in the 700 MHz band. In exchange, the<br />
Commission modified Sprint Nextel’s licenses to provide the right to operate on two five-megahertz<br />
blocks in the 1.9 GHz band – specifically 1910-1915 MHz and 1990-1995 MHz – conditioned on Sprint<br />
Nextel fulfilling certain obligations specified in the Commission’s decision. As a new entrant in the 1.9<br />
GHz band, Sprint Nextel is also obligated to fund the transition of incumbent users to comparable<br />
facilities. The Commission determined that the overall value of the 1.9 GHz spectrum is $4.8 billion, less<br />
the cost of relocating incumbent users. In addition, the Commission decided to credit to Sprint Nextel the<br />
value of the spectrum rights that Sprint Nextel is relinquishing and the actual costs Sprint Nextel incurs to<br />
relocate all incumbents in the 800 MHz and 1.9 GHz bands. To the extent that the total of these<br />
combined credits is less than the assessed value of the 1.9 GHz spectrum rights, Sprint Nextel will make<br />
an anti-windfall payment equal to the difference to the United States Department of the Treasury at the<br />
conclusion of the relocation process.<br />
14<br />
Principles for Reallocation of Spectrum to Encourage the Development of Telecommunications Technologies for<br />
the New Millennium, Policy Statement, 14 <strong>FCC</strong> Rcd 19868 (1999); see also Applications of Various Subsidiaries<br />
and Affiliates of Geotek Communications, Inc., Debtor-In-Possession, Assignors, and Wilmington Trust Company<br />
or Hughes Electric Corporation, Assignees, For Consent to Assignment of 900 MHz Specialized <strong>Mobile</strong> Radio<br />
Licenses, Memorandum Opinion and Order, 15 <strong>FCC</strong> Rcd 790, 802 (2000).<br />
15<br />
Dispatch services allow two-way, real-time, voice communications between fixed units and mobile units (e.g.,<br />
between a taxicab dispatch office and a taxi) or between two or more mobile units (e.g., between a car and a truck).<br />
See Fifth <strong>Report</strong>, 15 <strong>FCC</strong> Rcd at 17727-28, for a detailed discussion. Dispatch and SMR are often used<br />
interchangeably, although SMR refers to specific spectrum ranges.<br />
16<br />
<strong>FCC</strong> Adopts Solution to Interference Problem Faced by 800 MHz Public Safety Radio Systems, News Release,<br />
<strong>FCC</strong>, July 8, 2004.
Federal Communications Commission <strong>FCC</strong> 10-81<br />
6. Significant progress has been made reconfiguring licensees to the new 800 MHz band<br />
plan in non-border regions of the country. In addition, the Public Safety and Homeland Security Bureau<br />
released an order, on May 9, 2008, establishing a reconfigured 800 MHz band plan for U.S. licensees<br />
along the U.S. – Canada border. 17 Furthermore, the Commission, in conjunction with the State<br />
Department, is continuing to discuss a modified 800 MHz band plan with Mexico for U.S. licensees<br />
operating along the U.S.-Mexico border.<br />
D. 700 MHz Band<br />
7. The 698-806 MHz band (the “700 MHz band”) was reclaimed from use by broadcast<br />
services in connection with the transition of the analog television service to digital television (DTV). 18<br />
The Digital Television Transition and Public Safety Act of 2005 (DTV Act) 19 set a deadline of February<br />
17, 2009 for the 700 MHz band spectrum to be cleared of analog transmissions and made available for<br />
public safety and commercial services as part of the DTV transition. This deadline subsequently was<br />
extended to June 12, 2009. 20 This spectrum is being made available for wireless services, including<br />
public safety and commercial services. 21<br />
8. The DTV Act also established two specific statutory deadlines for the auction of licenses<br />
for recovered spectrum in the 700 MHz band: (1) the auction was required to begin no later than January<br />
28, 2008; and (2) the auction proceeds were required to be deposited in the Digital Television Transition<br />
and Public Safety Fund by June 30, 2008. 22 The Commission met both of these statutory deadlines.<br />
698<br />
698-940 MHz: 700 MHz Band Spectrum<br />
700 MHz Band<br />
700 MHz Public Safety<br />
700 MHz Public Safety<br />
806<br />
800 MHz Public Safety*<br />
824<br />
817<br />
204<br />
800 MHz SMR* 900 MHz SMR<br />
Cellular Cellular<br />
849<br />
800 MHz Public Safety*<br />
869<br />
862<br />
901<br />
896<br />
894<br />
Narrow-<br />
Band<br />
PCS<br />
9. Prior to holding the auction, the Commission revisited the rules governing the 700 MHz<br />
band in light of the DTV Act, recent developments in the market for commercial wireless<br />
communications, and the evolving needs of the public safety community for advanced broadband<br />
communications. 23 Specifically, in the 700 MHz Second <strong>Report</strong> and Order, the Commission adopted a<br />
17 See generally Improving Public Safety Communications in the 800 MHz Band; New 800 MHz Band Plan for U.S.<br />
– Canada Border Regions, Second <strong>Report</strong> and Order, 23 <strong>FCC</strong> Rcd 7605 (2008).<br />
18 See 700 MHz Second R&O, 22 <strong>FCC</strong> Rcd at 15291, 1.<br />
19 Deficit Reduction Act of 2005, Pub. L. No. 109-171, 120 Stat. 4 (2006) (DRA). Title III of the DRA is the DTV<br />
Act.<br />
20 DTV Delay Act, S. 328, 111 th Cong. (2009), amending 47 U.S.C. §§ 309, 337(3)(1).<br />
21 See 700 MHz Second R&O, 22 <strong>FCC</strong> Rcd at 15291, 1 & 15295-96, 14.<br />
22 See DRA. Congress also extended the Commission’s auction authority to September 30, 2011. DTV Act §<br />
3003(b).<br />
23 See Service Rules for the 698-746, 747-762 and 777-792 MHz Bands; Revision of the Commission’s Rules to<br />
Ensure Compatibility with Enhanced 911 Emergency Calling Systems; and Section 68.4(a) of the Commission’s<br />
Rules Governing Hearing Aid-Compatible Telephones, Notice of Proposed Rule Making, Fourth Further Notice of<br />
Proposed Rule Making, and Second Further Notice of Proposed Rule Making, 21 <strong>FCC</strong> Rcd 9345 (2006).<br />
940<br />
935
Federal Communications Commission <strong>FCC</strong> 10-81<br />
new band plan and revised certain of the service rules relating to both the commercial and public safety<br />
spectrum in the 700 MHz band. 24 The new band plan provided a balanced mix of geographic service area<br />
licenses and spectrum blocks sizes for the commercial spectrum to be auctioned. 25 Among other service<br />
rules, the Commission provided that licensees for one of the commercial blocks of spectrum in the 700<br />
MHz band, the Upper 700 MHz C Block would be subject to an “Open Platform” condition. 26<br />
Accordingly, licensees must “allow customers, device manufacturers, third-party application developers,<br />
and others to use or develop the devices and applications of their choosing in C Block networks, so long<br />
as they meet all applicable regulatory requirements and comply with reasonable conditions related to<br />
management of the wireless network (i.e., do not cause harm to the network).” 27 In addition, C Block<br />
licensees “may not block, degrade, or interfere with the ability of end users to download and utilize<br />
applications of their choosing on the licensee’s C Block network, subject to reasonable network<br />
management.” 28 The Commission also took two steps to promote the rapid construction and deployment<br />
of a nationwide, interoperable broadband public safety network. First, in the public safety spectrum, the<br />
band plan established a spectrum block designated for broadband communications, the public safety<br />
broadband spectrum, and provided that the spectrum would be licensed on a nationwide basis to a nonprofit<br />
entity (the Public Safety Broadband Licensee) representative of the public safety community in<br />
accordance with a specific selection process. 29 Second, the Commission established a block in the<br />
commercial spectrum, the Upper 700 MHz D Block (D Block), to be licensed on a nationwide basis to a<br />
single entity, and required the winning bidder for the D Block to enter into a public/private partnership<br />
with the Public Safety Broadband Licensee to enable the construction of a nationwide network operating<br />
over the spectrum associated with both licenses and providing broadband services to both commercial and<br />
public safety users. 30<br />
10. The auction of the 700 MHz Band licenses, designated Auction 73, closed on March 18,<br />
2008. 31 The auction concluded with provisionally winning bids covering 1091 licenses. While the bids<br />
for licenses associated with four of the five Upper 700 MHz Band blocks (the A, B, C, and E Blocks)<br />
exceeded the applicable reserve prices, bids for the fifth block (the D Block) license did not meet the<br />
reserve price and thus, there was no winning bid in Auction 73 for that license. Accordingly, the Auction<br />
73 winning bids totaled $19,120,378,000 and the net winning bids (reflecting bidders’ claimed bidding<br />
credit eligibility) totaled $18,957,582,150 . 32<br />
24 See 700 MHz Second R&O, 22 <strong>FCC</strong> Rcd at 15291-95, 1-13; Service Rules for the 698-746, 747-762 and 777-<br />
792 MHz Bands, <strong>Report</strong> and Order and Further Notice of Proposed Rulemaking, 22 <strong>FCC</strong> Rcd 8064 (2007) (700<br />
MHz <strong>Report</strong> and Order).<br />
25 The Commission changed the location of existing 700 MHz Guard Band licenses, provided for a 1-megahertz<br />
shift of the other commercial blocks in the Upper 700 MHz band and in the spectrum allocated to public safety, and<br />
reduced the size of the Guard Band B Block to make two additional megahertz of commercial spectrum available for<br />
auction. 700 MHz Second <strong>Report</strong> and Order, 22 <strong>FCC</strong> Rcd at 15292-93, 3. In addition, the Commission afforded<br />
all Guard Band A Block licensees the same technical rules that apply to the adjacent commercial spectrum and the<br />
ability to deploy cellular architectures. Id. at 15294, 9.<br />
26 See 700 MHz Second R&O, 22 <strong>FCC</strong> Rcd at 15361, 195.<br />
27 See id. at 15360, 206.<br />
28 Id.<br />
29 See Service Rules for the 698-746, 747-762 and 777-792 Bands; Implementing a Nationwide, Broadband,<br />
Interoperable Public Safety Network in the 700 MHz Band, Second Further Notice of Proposed Rulemaking, 23<br />
<strong>FCC</strong> Rcd 8047, 8052 8 (2008) (700 MHz Second Further Notice).<br />
30 See 700 MHz Second <strong>Report</strong> and Order, 22 <strong>FCC</strong> Rcd at 15295, 13.<br />
31 <strong>FCC</strong>, Auction 73, http://wireless.fcc.gov/auctions/73 (visited Sept. 18, 2008).<br />
32 “Auction of 700 MHz Band Licenses Closes,” Public Notice, 23 <strong>FCC</strong> Rcd 4572, 4572-73 2 (2008).<br />
205
Federal Communications Commission <strong>FCC</strong> 10-81<br />
11. The total 84 megahertz of commercial spectrum in the 700 MHz band will generally be<br />
available for a broad range of flexible uses. 33 This spectrum has many permissible uses: new licensees<br />
may use the spectrum for fixed, mobile (including mobile wireless commercial services), and broadcast<br />
services. 34 In addition, the Commission optimized the power rules in the remaining paired spectrum<br />
specifically for mobile use. 35 The Commission expects that many of the new technologies to be<br />
developed and deployed in this band will support advanced wireless applications. 36<br />
12. Because the auction of the D Block did not result in a winning bid, on May 14, 2008, the<br />
Commission issued the 700 MHz Second Further Notice, revisiting the rules governing the D Block<br />
licensee, the mandatory public/private partnership, and the Public Safety Broadband Licensee. 37 The<br />
Commission sought comment broadly on how it might modify those rules to achieve the goal of a<br />
nationwide, interoperable public safety network, whether it should continue to mandate a public/private<br />
partnership between the D Block licensee and Public Safety Broadband Licensee, and if so, under what<br />
terms and conditions. 38<br />
13. On September 25, 2008, the Commission adopted the 700 MHz Third Further Notice that<br />
proposed licensing the D Block spectrum as part of a revised 700 MHz Public/Private Partnership, with<br />
modifications to the rules governing both the D Block and the Public Safety Broadband License, in order<br />
to maximize the public safety and commercial benefits of a nationwide, interoperable broadband network<br />
in the 700 MHz band. 39 Although the D Block proceeding still is pending, in its recent National<br />
Broadband Plan report to Congress, the Commission contended that the D Block should be auctioned for<br />
commercial use with limited technical requirements that would ensure technical compatibility between<br />
the D Block and the adjacent public safety broadband spectrum block. The Commission also contended<br />
that the commercial D Block should enable, but not obligate, the licensee to enter into a spectrum-sharing<br />
partnership with the neighboring Public Safety Broadband Licensee. 40<br />
33 See Lower 700 MHz <strong>Report</strong> and Order; Service Rules for the 746-764 and 776-794 MHz Bands, and Revisions to<br />
Part 27 of the Commission’s Rules, Third <strong>Report</strong> and Order, 16 <strong>FCC</strong> Rcd 2703 (2001); Service Rules for the 746-<br />
764 and 776-794 MHz Bands, and Revisions to Part 27 of the Commission’s Rules, Second Memorandum Opinion<br />
and Order, 16 <strong>FCC</strong> Rcd 1239 (2001); Service Rules for the 746-764 and 776-794 MHz Bands, and Revisions to Part<br />
27 of the Commission’s Rules, Memorandum Opinion and Order and Further Notice of Proposed Rulemaking, 15<br />
<strong>FCC</strong> Rcd 20845 (2000); Service Rules for the 746-764 and 776-794 MHz Bands, and Revisions to Part 27 of the<br />
Commission’s Rules, Second <strong>Report</strong> and Order, 15 <strong>FCC</strong> Rcd 5299 (2000) (Upper 700 MHz Second <strong>Report</strong> and<br />
Order); 700 MHz Second R&O; 700 MHz <strong>Report</strong> and Order. The 82 megahertz of spectrum does not include the<br />
reconfigured Guard Band B Block spectrum at 775-776/805-806 MHz. See 700 MHz Second R&O, 22 <strong>FCC</strong> Rcd at<br />
15294 9, 15388-89 266-69.<br />
34 See generally id. In addition, in February 2010, the Commission sought comment on a petition for rulemaking<br />
requesting that the Commission require that all mobile units for the 700 MHz band be capable of operating over all<br />
frequencies in the band. “<strong>Wireless</strong> Telecommunications Bureau Seeks Comment on Petition for Rulemaking<br />
Regarding 700 MHz Band <strong>Mobile</strong> Equipment Design and Procurement Practices,” RM-11592, Public Notice, 25<br />
<strong>FCC</strong> Rcd 1464 (WTB 2010).<br />
35 See 700 MHz <strong>Report</strong> and Order, 22 <strong>FCC</strong> Rcd at 8067-68, 6.<br />
36 See, e.g., Lower 700 MHz <strong>Report</strong> and Order, 17 <strong>FCC</strong> Rcd at 1032, 20.<br />
37 See 700 MHz Second Further Notice, 23 <strong>FCC</strong> Rcd at 8047..<br />
38 Id. The Commission also indicated that, prior to adopting final rules, it would present for public comment a<br />
detailed proposal regarding specific proposed rules to address these issues. Id. at 8052, 7.<br />
39 See generally Service Rules for the 698-746, 747-762 and 777-792 MHz Bands, WT Docket No. 06-150,<br />
Implementing a Nationwide, Broadband, Interoperable Public Safety Network in the 700 MHz Band, PS Docket No.<br />
06-229, Third Further Notice of Proposed Rulemaking, 23 <strong>FCC</strong> Rcd 14301 (2008).<br />
40 See National Broadband Plan, at 86, 315-316.<br />
206
E. 1710 – 2180: Advanced <strong>Wireless</strong> Services<br />
Federal Communications Commission <strong>FCC</strong> 10-81<br />
14. To further the goal of promoting the deployment of advanced services, the Commission<br />
has made efforts to allocate and license additional spectrum suitable for offering AWS. 41 As noted in the<br />
Eleventh <strong>Report</strong>, in 2002 the Commission, together with the National Telecommunications and<br />
Information Administration (“NTIA”), allocated 90 megahertz of spectrum in the 1710-1755 MHz and<br />
2110-2155 MHz (“AWS-1”) bands that can be used to offer advanced wireless services, including 3G<br />
services. 42<br />
1710<br />
1700<br />
AWS-1 Broadband Broadband MSS AWS-1 AWS MSS<br />
PCS<br />
PCS<br />
3<br />
1755<br />
1700-2200 MHz: Advanced <strong>Wireless</strong> Services Spectrum<br />
1850<br />
Proposed AWS-2 Block<br />
Sprint Nextel<br />
1930<br />
1920<br />
1910<br />
207<br />
Sprint Nextel<br />
2000<br />
1990<br />
2025<br />
2020<br />
Proposed AWS-2 Block<br />
15. Subsequently, the Commission completed the process of establishing service rules for the<br />
1710-1755 MHz and 2110-2155 MHz bands. This included a the spectrum could be used for any wireless<br />
service that is consistent with the spectrum’s fixed and mobile allocations and would be licensed under<br />
the Commission’s flexible, market-oriented Part 27 rules, 43 and also a band plan that provided for a<br />
significant amount of the spectrum to be licensed on a small geographic basis to encourage the<br />
participation of small and rural providers in the AWS auction. 44<br />
16. The Commission held Auction 66 in 2006. 45 Of the 1,122 licenses offered, 104 winning<br />
bidders won 1,087 licenses, with net bids of more than $13.7 billion, 46 and all 1,087 licenses were<br />
awarded in 2007. In August 2008 the Commission’s Auction 78 included the 35 AWS-1 licenses for<br />
which no winning bids were submitted in Auction 66. 47 Winning bids were submitted for all 35 AWS-1<br />
licenses, with net winning bids for those licenses of $13,372,850. 48 As of early March 2010, the<br />
Commission has granted licenses to 9 out of 14 AWS applicants.<br />
17. The Commission also has taken significant steps toward licensing other bands of<br />
41 47 C.F.R. § 24.3. Advanced <strong>Wireless</strong> Services (AWS) is the collective term we use for new and innovative fixed<br />
and mobile terrestrial wireless applications using bandwidth that is sufficient for the provision of a variety of<br />
applications, including those using voice and data (such as Internet browsing, message services, and full-motion<br />
video) content.<br />
42 Eleventh <strong>Report</strong>, 21 <strong>FCC</strong> Rcd at 10977, 73. The Commercial Spectrum Enhancement Act, signed into law on<br />
December 23, 2004, establishes a Spectrum Relocation Fund to reimburse federal agencies operating on certain<br />
frequencies that have been reallocated to non-federal use, including the 1710-1755 MHz band, for the cost of<br />
relocating their operations. See Commercial Spectrum Enhancement Act, Pub. L. No. 108-494, 118 Stat. 3986, Title<br />
II (2004).<br />
43 Eleventh <strong>Report</strong>, 21 <strong>FCC</strong> Rcd at 10977-10978, 74; 47 C.F.R. Part 27.<br />
44 Eleventh <strong>Report</strong>, 21 <strong>FCC</strong> Rcd at 10978, 74.<br />
45<br />
See “Auction of Advanced <strong>Wireless</strong> Services Closes: Winning Bidders Announced for Auction 66,” <strong>Report</strong> AUC-<br />
06-66-F, Public Notice, 21 <strong>FCC</strong> Rcd 10521 (2006).<br />
46 Id.<br />
47<br />
See “Auction of AWS-1 and Broadband PCS Licenses Rescheduled for August 13, 2008,” Public Notice, 23 <strong>FCC</strong><br />
Rcd 7496 (2008).<br />
48 See “Auction of AWS-1 and Broadband PCS Licenses Closes,” Public Notice, 23 <strong>FCC</strong> Rcd 12749 (2008).<br />
2110<br />
2155<br />
2180<br />
2175<br />
2200
Federal Communications Commission <strong>FCC</strong> 10-81<br />
spectrum for use by AWS. In 2004, the Commission allocated an additional twenty megahertz of<br />
spectrum in the 1915-1920 MHz, 1995-2000 MHz, 2020-2025 MHz and 2175-2180 MHz bands (“AWS-<br />
2”). 49 The Commission additionally released the AWS-2 Service Rules NPRM, which sought comment on<br />
appropriate service rules for the1915-1920 MHz, 1995-2000 MHz, 2020-2025 MHz and 2175-2180 MHz<br />
bands, and also offered some tentative conclusions consistent with existing AWS service rules, such as<br />
allowing flexible use of this spectrum and licensing this spectrum under Part 27 of the Commission’s<br />
rules.<br />
18. In 2005, the Commission designated yet another 20 MHz of spectrum for AWS,<br />
specifically the 2155-2175 MHz band (“AWS-3”), thus establishing 70 MHz of contiguous AWS<br />
spectrum in the 2.1 GHz band (from 2110 to 2180 MHz). 50 On September 19, 2007, the Commission<br />
released a Notice of Proposed Rulemaking (NPRM), seeking comment on service rules for the AWS-3<br />
spectrum. 51 On June 20, 2008, the Commission released a Further Notice of Proposed Rulemaking<br />
(FNPRM), seeking comment on the Commission’s proposed AWS-3 rules, which include adding 5<br />
megahertz of spectrum (2175-80 MHz) to the proposed AWS-3 band (2155-75 MHz). The FNPRM<br />
proposes to require licensees of that spectrum to provide – using up to 25 percent of its wireless network<br />
capacity – free, two-way broadband Internet service at engineered data rates of at least 768 kbps<br />
downstream. 52 In October 2008, the Commission’s Office of Engineering and Technology released the<br />
Advanced <strong>Wireless</strong> Service Interference Tests Results and Analysis, which analyzed data from earlier<br />
laboratory bench tests performed by <strong>FCC</strong> staff together with interested parties. 53<br />
F. Broadband Radio Service<br />
19. The Commission has transformed the 2496-2690 MHz band by providing licensees with<br />
greater flexibility and establishing a more functional band plan. 54<br />
49 Amendment of Part 2 of the Commission’s Rules to Allocate Spectrum Below 3 GHz for <strong>Mobile</strong> and Fixed<br />
Services to Support the Introduction of New Advanced <strong>Wireless</strong> Services, Including Third Generation <strong>Wireless</strong><br />
Systems, Sixth <strong>Report</strong> and Order, Third Memorandum Opinion and Order and Fifth Memorandum Opinion and<br />
Order, 19 <strong>FCC</strong> Rcd 20720 (2004); Service Rules for Advanced <strong>Wireless</strong> Services in the 1915-1920 MHz, 1995-<br />
2000 MHz, 2020-2025 MHz and 2175-2180 MHz Bands; Service Rules for Advanced <strong>Wireless</strong> Services in the 1.7<br />
GHz and 2.1 GHz Bands, Notice of Proposed Rulemaking, 19 <strong>FCC</strong> Rcd 19263 (2004).<br />
50 See Amendment of Part 2 of the Commissions Rules to Allocate Spectrum Below 3 GHz for <strong>Mobile</strong> and Fixed<br />
Services to Support the Introduction of New Advanced <strong>Wireless</strong> Services, Including Third Generation <strong>Wireless</strong><br />
Systems, Eighth <strong>Report</strong> and Order, Fifth Notice of Proposed Rule Making and Order, 20 <strong>FCC</strong> Rcd 15866 (2005).<br />
51<br />
Service Rules for Advanced <strong>Wireless</strong> Services in the 2155-2175 MHz Band, Notice of Proposed Rulemaking, 22<br />
<strong>FCC</strong> Rcd 17035 (2007).<br />
52 Service Rules for Advanced <strong>Wireless</strong> Services in the 2155-2175 MHz Band; and Service Rules for Advanced<br />
<strong>Wireless</strong> Services in the 1915-1920 MHz, 1995-2000 MHz, 2020-2025 MHz and 2175-2180 MHz Bands, Further<br />
Notice of Proposed Rulemaking, 23 <strong>FCC</strong> Rcd 9859 (2008).<br />
53 See Advanced <strong>Wireless</strong> Service Interference Tests Results and Analysis, October 10, 2008 (WT Docket Nos. 07-<br />
195 and 04-356). See also “The <strong>FCC</strong>’s Office of Engineering and Technology Releases Analysis of AWS-3<br />
Interference Tests,” WT Docket Nos. 07-195 and 04-356, Public Notice, 23 <strong>FCC</strong> Rcd 14669 (OET 2008).<br />
54 Amendment of Parts 1, 21, 73, 74, and 101 of the Commission’s Rules to Facilitate the Provision of Fixed and<br />
<strong>Mobile</strong> Broadband Access, Educational, and Other Advanced Services in the 2150-2162 and 2500-2690 MHz<br />
Bands, <strong>Report</strong> and Order and Further Notice of Proposed Rulemaking, 19 <strong>FCC</strong> Rcd 14165 (2004). The rules for<br />
this band were initially established in 1963 but have evolved significantly since that time.<br />
208
WCS WCS<br />
2305<br />
2300<br />
2320 2320<br />
2345<br />
2360<br />
2400<br />
Federal Communications Commission <strong>FCC</strong> 10-81<br />
2300-2700 MHz: BRS/EBS Spectrum<br />
License-<br />
Exempt<br />
ISM Band<br />
(e.g. Wi-Fi)<br />
Big<br />
LEO<br />
2483<br />
2496<br />
209<br />
BRS/EBS<br />
2700<br />
2690<br />
The Commission has taken several steps to restructure the BRS/EBS band and facilitate more efficient<br />
use of the spectrum. First, the Commission created a new BRS/EBS band plan for the 2496-2690 MHz<br />
band that eliminated the use of interleaved channels and created distinct band segments for high power<br />
operations, such as one-way video transmission, and low power operations, such as two-way fixed and<br />
mobile broadband applications. By grouping high and low power users into separate portions of the band,<br />
the new band plan reduces the likelihood of interference caused by incompatible uses. The new band plan<br />
also creates incentives for the development of low-power, cellularized broadband operations, which were<br />
inhibited by the prior band plan.<br />
20. In addition, the Commission provided licensees with the flexibility to employ the<br />
technologies of their choice in the band and to lease spectrum under the Commission’s secondary market<br />
spectrum leasing policies and procedures. The Commission also implemented geographic area licensing<br />
for all licensees in the band, which will allow increased flexibility while reducing administrative burdens<br />
on both licensees and the Commission.<br />
21. In April 2006, the Commission continued its transformation of the rules governing BRS<br />
and EBS by revising the mechanism for transition from the existing band configuration to the new band<br />
plan. 55 BRS and EBS licensees have largely completed the process of transitioning the 2.5 GHz band to<br />
the new band plan. As of March 8, 2010, the transition has been completed in 438 out of 493 BTAs. 56 In<br />
the remaining BTAs, virtually all other licensees are subject to a pending transition plan or have filed selftransition<br />
plans.<br />
22. The Commission has continued to revise the rules relating to the 2.5 GHz band in 2008<br />
and 2009 by clarifying its policies concerning leasing of EBS stations, setting forth auction rules for<br />
unassigned BRS spectrum, seeking further comment on how to license the available and unassigned<br />
“white spaces” in the EBS spectrum band, issuing a Declaratory Ruling clarifying the “splitting-thefootball”<br />
methodology that licensees should use to divide overlapping geographic service areas for<br />
licenses that expired and are later reinstated, and proposing to give new BRS licensees four years from the<br />
date of initial license grant to demonstrate substantial service. 57 The Commission held Auction 86, the<br />
auction of available BRS licenses, in the fourth quarter of 2009. 58 Of the 78 licenses offered in Auction<br />
55 Amendment of Parts 1, 21, 73, 74, and 101 of the Commission’s Rules to Facilitate the Provision of Fixed and<br />
<strong>Mobile</strong> Broadband Access, Educational, and Other Advanced Services in the 2150-2162 and 2500-2690 MHz<br />
Bands, Order on Reconsideration and Fifth Memorandum Opinion and Order and Third Memorandum Opinion and<br />
Order and Second <strong>Report</strong> and Order, 21 <strong>FCC</strong> Rcd 5606 (2006).<br />
56 See WT Docket No. 06-136.<br />
57 Amendment of Parts 1, 21, 73, 74 and 101 of the Commission’s Rules to Facilitate the Provision of Fixed and<br />
<strong>Mobile</strong> Broadband Access, Educational and Other Advanced Services in the 2150-2162 and 2500-2690 MHz Bands,<br />
Third Order on Reconsideration and Sixth Memorandum Opinion and Order and Fourth Memorandum Opinion and<br />
Order and Second Further Notice of Proposed Rulemaking and Declaratory Ruling, 23 <strong>FCC</strong> Rcd 5992 (2008); Fifth<br />
Memorandum Opinion and Order and Third Further Notice of Proposed Rulemaking and Declaratory Ruling, 24<br />
<strong>FCC</strong> Rcd 12558 (2009).<br />
58 The auction started on October 27, 2009 and closed on October 30, 2009. See “Auction of Broadband Radio<br />
Service Licenses Closes; Winning Bidders Announced for Auction No. 86,” Public Notice, 24 <strong>FCC</strong> Rcd 13572<br />
(WTB 2009).
Federal Communications Commission <strong>FCC</strong> 10-81<br />
86, ten winning bidders won 61 licenses, with net bids of $19,426,600. 59<br />
23. The changes made to the 2496-2690 MHz band, together with technological and business<br />
developments, is facilitating the development of a nationwide WiMAX network by Clearwire that has the<br />
potential to compete with cable and DSL broadband providers. The 2496-2690 MHz band can speed the<br />
arrival of a wireless broadband pipe that will increase competition and consumer choice, make possible<br />
new services, and promote the availability of broadband for all Americans. This band also can play an<br />
important role in extending broadband service to rural and underserved areas. Moreover, the changes to<br />
this band have enabled BRS/EBS providers to use this spectrum in a more technologically and<br />
economically efficient manner.<br />
G. <strong>Wireless</strong> Communications Service (WCS)<br />
24. The Commission has licensed 30 megahertz of spectrum in the 2.3 GHz band, at 2305-<br />
2320 MHz and 2345-2360 MHz, for the <strong>Wireless</strong> Communications Service (“WCS”). While the service<br />
rules governing WCS allow for both fixed and mobile applications, the technical limits imposed to protect<br />
adjacent Satellite Radio operations have not permitted the development of mobile equipment for the band,<br />
but these rules are the subject of a rulemaking proceeding before the Commission.<br />
WCS WCS<br />
2305<br />
2300<br />
2320<br />
2345<br />
2360<br />
2400<br />
2300-2700 MHz: WCS Spectrum<br />
License-<br />
Exempt<br />
ISM Band<br />
(e.g. Wi-Fi)<br />
Big<br />
LEO<br />
2483<br />
2496<br />
210<br />
BRS/EBS<br />
2700<br />
2690<br />
25. The WCS spectrum was auctioned in 1997 and licensed on a Major Economic Area<br />
(“MEA”) and Regional Economic Area Grouping (“REAG”) basis. The WCS spectrum is adjacent to<br />
and separated by the spectrum band for the Satellite Digital Audio Radio Service (“SDARS”), which is<br />
used by Sirius XM Radio Inc. to provide satellite radio service. On December 18, 2007, the Commission<br />
released a Notice of Proposed Rulemaking and Second Further Notice of Proposed Rulemaking seeking<br />
comment on appropriate rules and policies for licensing SDARS digital repeaters and considering changes<br />
to the technical rules governing WCS licenses. [1] In particular, the Commission sought to consider what<br />
changes may be necessary to facilitate the coexistence of SDARS and WCS licensees in such a way that<br />
will enable the continued provision of high-quality satellite radio service as well as the deployment of<br />
new broadband services to the public.<br />
H. 1.4 GHz Bands<br />
26. The Commission completed the auction of licenses in the paired 1392-1395 MHz and<br />
1432-1435 MHz bands and in the unpaired 1390-1392 MHz band. 60 The paired spectrum was offered as<br />
two 3-megahertz blocks in the six REAGs. 61 The unpaired spectrum was auctioned as one 2-meghertz<br />
block in each MEA. 62 Like other spectrum bands under Part 27 of the Commission’s rules, the service<br />
rules for the 1.4 GHz band are flexible. In the auction, two winning bidders won a total of 64 licenses,<br />
59 Id.<br />
60 See “Auction of 1.4 GHz Band Licenses Closes,” Public Notice, 22 <strong>FCC</strong> Rcd 4714 (2007).<br />
61 See “Auction of 1.4 GHz Bands Licenses Scheduled for February 7, 2007,” Public Notice, 21 <strong>FCC</strong> Rcd 9494<br />
(2006)<br />
62 Id.
aising a total of $123,599,000. 63<br />
I. 1670-1675 MHz<br />
Federal Communications Commission <strong>FCC</strong> 10-81<br />
27. In April 2003, the <strong>FCC</strong> auctioned five megahertz of unpaired spectrum in the 1670-1675<br />
MHz band as a single, nationwide license. As with the other spectrum bands licensed under Part 27 of the<br />
Commission’s rules, such as AWS and WCS, the service rules for the 1670-1675 MHz band are flexible,<br />
and licensees can use the spectrum to deploy a variety of fixed or mobile wireless services. The license<br />
was won at auction by Crown Castle. In July 2007, Crown Castle entered into a long-term agreement to<br />
lease the spectrum to a wholly-owned subsidiary of TVCC Holding Company, LLC (“TVCC Holding”). 64<br />
In late 2008, control of TVCC Holding was transferred, so that 13.13 percent was held by a company<br />
wholly owned by Rajendra Singh and the Singh family; 11.86 percent by Columbia Capital IV, LLC,<br />
subsidiaries; and 75 percent by Harbinger-related entities. 65<br />
1500-1700 MHz: 1670-1675 MHz Spectrum<br />
1500<br />
L-band<br />
1525<br />
1559<br />
211<br />
Big<br />
L-band<br />
LEO<br />
1610<br />
1626<br />
1675<br />
1670<br />
1660<br />
63<br />
See “Auction of 1.4 GHz Band Licenses Closes,” Public Notice, 22 <strong>FCC</strong> Rcd 4714 (2007).<br />
64<br />
Long-Term De Facto Transfer Lease Application, File No. 0003108073 (filed July 17, 2008). Crown Castle<br />
Announces Long-Term Modeo Spectrum Lease, Press Release, Crown Castle, July 23, 2007; ULS Lease ID<br />
L000002305.<br />
65<br />
Transfer of Control of a Lessee Application, File No. 0003573463 (filed Sept. 10, 2008); TVCC Holding<br />
Company, LLC, Form 602, File No. 0003635816 (filed Nov. 3, 2008).<br />
1700
J. 3650-3700 MHz<br />
Federal Communications Commission <strong>FCC</strong> 10-81<br />
28. The Commission adopted service rules for the 3650 – 3700 MHz band in June 2007 66 and<br />
began accepting applications licenses in the service in November 2007. 67 Terrestrial operations in the<br />
band are licensed on a nationwide, non-exclusive basis, with all licensees registering their fixed and base<br />
stations in a common data base (ULS) prior to operation. Licensees are subject to restrictions on their<br />
operations in geographic areas occupied by grandfathered Fixed Satellite Service (FSS) and Federal<br />
Government stations. The rules also provide that terrestrial licensees have the mutual obligation to<br />
cooperate and avoid harmful interference to one another, and are required to use one of two types of<br />
“contention-based” technologies (restricted or unrestricted) that accommodate shared use of the band by<br />
multiple users. Equipment using “restricted” contention-based protocols (i.e., equipment capable of<br />
avoiding interference only to other devices using the same protocol) is allowed to operate only on the<br />
lower 25 megahertz portion of the band (3650 – 3675 MHz). Unrestricted equipment (i.e., equipment<br />
capable of avoiding interference to other devices, even those that use a different protocol) is allowed to<br />
operate within the entire 50 megahertz of the band. <strong>Mobile</strong> stations are required to positively receive and<br />
decode an enabling signal transmitted by a base station. Devices certified by the <strong>FCC</strong> as mobiles or<br />
portables do not require a separate license or registration. 68<br />
3650<br />
3650 - 3700 MHz Service<br />
Restricted<br />
Unrestricted<br />
66 See <strong>Wireless</strong> Operations in the 3650-3700 MHz Band, ET Docket No. 04-151, Rules for <strong>Wireless</strong> Broadband<br />
Services in the 3650-3700 MHz Band, WT Docket No. 05-96, <strong>Report</strong> and Order, 20 <strong>FCC</strong> Rcd 6502 (2005)<br />
(3650 MHz Order), recon. granted in part, Memorandum Opinion and Order, 22 <strong>FCC</strong> Rcd 10421 (2007).<br />
3675<br />
67 See “<strong>Wireless</strong> Telecommunications Bureau Announces Start State for Licensing and Registration Process for the<br />
3650 – 3700 MHz Band,” Public Notice, 22 <strong>FCC</strong> Rcd 19802 (WTB 2007).<br />
68 See 47 C.F.R. § 90.1307. <strong>Mobile</strong> and portable stations that operate with a peak EIRP of 1 Watt/25 megahertz and<br />
receive and decode an enabling signal from a base station are not required to be registered even if used in a fixed<br />
mode. See 3650 MHz Order, 20 <strong>FCC</strong> Rcd at 6513, 31, n.54; 47 C.F.R. § 90.1333.<br />
212<br />
3700
Federal Communications Commission <strong>FCC</strong> 10-81<br />
APPENDIX B<br />
<strong>Mobile</strong> <strong>Wireless</strong> Network Technologies<br />
1. Cellular, PCS, and digital SMR networks use the same basic design. All use a series of lowpower<br />
transmitters to serve relatively small areas (“cells”), and reuse spectrum to maximize efficiency. 1<br />
In the past, cellular and SMR networks have used both analog and digital cellular technologies, while<br />
PCS and AWS networks were designed from the start to use a digital format. Digital technology provides<br />
better sound quality and increased spectral efficiency than analog technology. From a customer’s<br />
perspective, digital service in the cellular band or SMR bands is virtually identical to digital service in the<br />
PCS and AWS bands. After the sunset of analog cellular service in February 2008, only digital cellular<br />
technologies are used in the mobile wireless industry.<br />
2. The two main digital technologies used in the United States are Code Division Multiple<br />
Access (“CDMA”) and Global System for <strong>Mobile</strong> Communications (GSM). In addition, there are two<br />
other, less-widely used (by subscribers), technologies: integrated Digital Enhanced Network (“iDEN”)<br />
and the once-common Time Division Multiple Access (TDMA). These four technologies are commonly<br />
referred to as Second Generation, or 2G, because they succeeded the first generation of analog cellular<br />
technology, Advanced <strong>Mobile</strong> Phone Systems (AMPS). 2 U.S. carriers have been phasing out TDMA<br />
service over the past several years. 3<br />
3. Beyond the 2G digital technologies, mobile telephone providers have been deploying<br />
next-generation, or 2.5G and 3G, network technologies 4 that allow them to offer mobile data services at<br />
higher data transfer speeds and, in some cases, to increase voice capacity. 5 For GSM/TDMA providers,<br />
the first step in the migration to next-generation network technologies is General Packet Radio Service<br />
(GPRS), a packet-based data-only network upgrade that allows for faster data rates by aggregating up to<br />
1 PCS, digital SMR, and cellular networks are all “cellular” systems since all divide service regions into many small<br />
areas called “cells.” Cells can be as small as an individual building or as large as 20 miles across. Each cell serves<br />
as a base station for mobile users to obtain connection to the fixed network and is equipped with its own radio<br />
transmitters/receivers and associated antennas. Service regions are divided into cells so that individual radio<br />
frequencies may be reused in different cells (“frequency reuse”), in order to enhance frequency efficiency. When a<br />
person makes a call on a wireless phone, the connection is made to the nearest base station, which connects with the<br />
local wireline phone network or another wireless operator. When a person is using a wireless phone and approaches<br />
the boundary of one cell, the wireless network senses that the signal is becoming weak and automatically hands off<br />
the call to the base station in the next cell. See Sixth <strong>Report</strong>, 16 <strong>FCC</strong> Rcd at 13361, n.55.<br />
2 See infra note 307 for a discussion of the cellular analog requirement and its sunset.<br />
3 AT&T, for example, discontinued TDMA service on February 18, 2008, and on Mar. 1, 2008 TDMA service was<br />
discontinued on the former Dobson TDMA network. AT&T, Answer Center, http://wireless.att.com/answer-center<br />
(visited Sept. 19, 2008). Cincinnati Bell <strong>Wireless</strong> discontinued its TDMA service in June 2006. Cincinnati Bell,<br />
Inc., SEC Form 10-K, filed Mar. 1, 2007, at 5.<br />
4 For purposes of this <strong>Report</strong>, all of the network technologies beyond 2G that carriers have deployed, as well as<br />
those that they plan to deploy in the future, are generally referred to as “next-generation network technologies.” The<br />
International Telecommunication Union (ITU) has defined 3G network technologies as those that can offer<br />
maximum data transfer speeds of 2 Mbps from a fixed location, 384 kbps at pedestrian speeds, and 144 kbps at<br />
traveling speeds of 100 kilometers per hour. See Fifth <strong>Report</strong>, 15 <strong>FCC</strong> Rcd at 17695. There is ambiguity among<br />
other industry players, however, as to which network technologies constitute 3G and which constitute interim<br />
technologies, often labeled “2.5G.” See Seventh <strong>Report</strong>, 17 <strong>FCC</strong> Rcd at 12990 and 13038. Therefore, this <strong>Report</strong><br />
uses a more general label to describe all of the technologies beyond 2G.<br />
5 See Section IV.B.1, Network Coverage and Technology Upgrades, supra.<br />
213
Federal Communications Commission <strong>FCC</strong> 10-81<br />
eight 14.4 kbps channels. 6 Beyond GPRS, many U.S. GSM/TDMA providers deployed Enhanced Data<br />
Rates for GSM Evolution (EDGE) technology, which offers average data speeds of 100-130 kbps.<br />
Wideband CDMA (WCDMA, also known as Universal <strong>Mobile</strong> Telecommunications System, or UMTS)<br />
is the next migration step for GSM providers beyond EDGE and allows maximum data transfer speeds of<br />
up to 2 Mbps and average user speeds of 220-320 kbps. 7 Finally, deployment of WCDMA with HSPA<br />
(High Speed Packet Access, which includes both High Speed Downlink Packet Access, HSDPA, and<br />
High Speed Uplink Packet Access, HSUPA) technology allows average download speeds of 400-700<br />
kbps with burst rates of up to several Mbps, 8 average upload speeds of 500-800 kbps, when HSUPA<br />
technology is deployed. 9 Some service providers have deployed, or announced plans to deploy,<br />
additional HSPA upgrades that allow for faster peak and average data transfer speeds, such as HSPA 7.2<br />
Mbps and HSPA+, which allows a peak download speed of 21 Mbps. 10<br />
4. Many CDMA providers have upgraded their networks to CDMA2000 1xRTT (also<br />
referred to as CDMA2000 1X or 1xRTT), CDMA2000 EV-DO (evolution-data optimized, EV-DO)<br />
Revision 0, and EV-DO Revision A (Rev. A) technologies. 1xRTT doubles voice capacity and delivers<br />
peak data rates of 307 kbps in mobile environments and typical speeds of 40-70 kbps. 11 EV-DO allows<br />
maximum data throughput speeds of 2.4 Mbps, while EV-DO Rev. A increases maximum data<br />
throughput speeds to 3.1 Mbps. 12 Typical, user-experienced download speeds with EV-DO range from<br />
400 to 800 kbps, while upload speeds average 50-70 kbps. 13 The EV-DO Rev. A network upgrade<br />
increases average download speeds to 600 kbps to 1.4 Mbps and significantly improves average upload<br />
speeds to 350-800 kbps. 14 Whereas WCDMA and WCDMA/HSDPA are incompatible with earlier<br />
technologies on the GSM migration path, the more advanced technologies on the CDMA migration path<br />
are backwards compatible. 15 Deployment of these various technologies by service providers is discussed<br />
above. Maps showing CDMA and GSM network coverage, as well as mobile broadband coverage, can<br />
be found in Appendix D.<br />
6<br />
See Seventh <strong>Report</strong>, 17 <strong>FCC</strong> Rcd at 12990. This upgrade is also labeled GSM/GPRS because many GSM/TDMA<br />
carriers are upgrading their TDMA markets with GSM and GPRS simultaneously.<br />
7<br />
Tenth <strong>Report</strong>, 20 <strong>FCC</strong> Rcd at 15951, 111. Although WCDMA and WCDMA/HSPA are not backwards<br />
compatible with GPRS/EDGE, wireless modem cards that are compatible with both WCDMA/HSPA and<br />
GPRS/EDGE, and enable handoff between the two types of networks, are available for use with laptop computers.<br />
See, e.g., Novatel <strong>Wireless</strong>, Products: Merlin U730 <strong>Wireless</strong> PC Modem Card, available at<br />
www.novatelwireless.com (visited Oct. 8, 2008).<br />
8<br />
Tenth <strong>Report</strong>, 20 <strong>FCC</strong> Rcd at 15951, 111.<br />
9<br />
AT&T Nears Completion of 3G <strong>Wireless</strong> Technology Deployment that Delivers Broadband <strong>Wireless</strong> Speeds – For<br />
Downloads and Uploads, Press Release, AT&T, May 21, 2008.<br />
10<br />
See Section IV.B.1, Network Coverage and Technology Upgrades, supra.<br />
11<br />
See Seventh <strong>Report</strong>, at 12990; Ninth <strong>Report</strong>, 19 <strong>FCC</strong> Rcd at 20650, 129.<br />
12<br />
Id. See also, CDMA Development Group NOI Comments at 3-4.<br />
13<br />
Sprint Powers Up Faster <strong>Mobile</strong> Broadband Network in 10 More Markets, Upgraded Coverage Reaches 60<br />
Million People, News Release, Sprint Nextel, Dec. 12, 2006; 3G Americas, 3G Technologies, available at<br />
http://www.3gamericas.com/English/PDFs/3G_technology_comparison.pdf (visited Dec. 15, 2008), (3G<br />
Technology Comparison). The maximum peak download speed for EV-DO is 2.4 Mbps. Id.<br />
14<br />
America’s Largest and Fastest <strong>Mobile</strong> Broadband Network Just Got Even Larger – Sprint Customers Can Do<br />
More, In More Places, And At Fast Speeds, News Release, Sprint Nextel, June 19, 2007; Verizon <strong>Wireless</strong>: 100<br />
Percent of <strong>Wireless</strong> Broadband Network Now Enhanced with Faster Speeds, News Release, Verizon <strong>Wireless</strong>, June<br />
29, 2007. The maximum peak download speed for EV-DO Rev A is 3.1 Mbps. 3G Technology Comparison.<br />
15<br />
Standards in <strong>Wireless</strong> Telephone Networks, at 328.<br />
214
Federal Communications Commission <strong>FCC</strong> 10-81<br />
5. Beyond WCDMA/HSDPA/HSUPA and EV-DO, there are two main competing<br />
technologies for next-generation wireless broadband networks: Long Term Evolution (LTE) and<br />
WiMAX. Both of these technologies, which are often referred to as fourth-generation (4G) technologies,<br />
are generally based on the Orthogonal Frequency Division Multiple Access (OFDMA) modulation<br />
technology. 16 LTE can support up to 58 Mbps for upper link transmission and 173 Mbps for downlink<br />
transmission with 20 MHz spectrum and a 2x2 Multiple Input Multiple Output (MIMO) antenna<br />
structure. 17 The <strong>Mobile</strong> WiMAX technology can support peak downlink data rates up to 63 Mbps and<br />
peak upper link data rates up to 28 Mbps in a 10 MHz channel. 18<br />
16 See EDGE, HSPA and LTE—The <strong>Mobile</strong> Broadband Advantage, Rysavy Research and 3G Americas, Sept. 2007,<br />
at 16, available at http://www.3gamericas.com/pdfs/2007_Rysavy_091007.pdf. Because OFDM allows signals to<br />
pass through buildings and trees, providers can use the technology to offer wireless broadband services without a<br />
direct line-of-sight between the transmitter and the end user’s receiver. Eleventh <strong>Report</strong>, 21 <strong>FCC</strong> Rcd at 10995, <br />
119.<br />
17 See EDGE, HSPA and LTE—The <strong>Mobile</strong> Broadband Advantage, Rysavy Research and 3G Americas, Sept. 2007,<br />
at 81, available at http://www.3gamericas.com/pdfs/2007_Rysavy_091007.pdf.<br />
18<br />
See <strong>Mobile</strong> WiMAX – Part I: A Technical Overview and Performance Evaluation, <strong>Mobile</strong> WiMAX Forum,<br />
August 2006, at 10, available at<br />
http://www.wimaxforum.org/documents/downloads/<strong>Mobile</strong>_WiMAX_Part1_Overview_and_Performance.pdf.<br />
215
Federal Communications Commission <strong>FCC</strong> 10-81<br />
APPENDIX C<br />
Tables<br />
Table of Contents<br />
Table C-1: CTIA’s Semi-Annual <strong>Mobile</strong> <strong>Wireless</strong> Industry Survey.....................................................217<br />
Table C-2: <strong>FCC</strong>’s Semi-Annual Local Telephone <strong>Competition</strong> Survey:<br />
<strong>Mobile</strong> Telephone Subscribership .........................................................................................................218<br />
Table C-3: Economic Area Penetration Rates .......................................................................................219<br />
Table C-4: Top 16 <strong>Mobile</strong> <strong>Wireless</strong> Operators by Subscribers ............................................................ 223<br />
Table C-5: Selected Smartphone Launches in 2008-2009.....................................................................224<br />
Table C-6: <strong>Mobile</strong> <strong>Wireless</strong> High-Speed Capable Devices and Subscribers by State...........................234<br />
Table C-7: <strong>Mobile</strong> <strong>Wireless</strong> Resellers and <strong>Mobile</strong> Virtual Network Operators (MVNOs)...................235<br />
216
Date Estimated<br />
Total<br />
Subscribers<br />
Federal Communications Commission <strong>FCC</strong> 10-81<br />
Table C-1: CTIA’s Semi-Annual <strong>Mobile</strong> <strong>Wireless</strong> Industry Survey<br />
Year End over<br />
Year End<br />
Subscriber<br />
Increase<br />
12-Month<br />
Total Service<br />
Revenues (in<br />
$000s)<br />
12-Month<br />
Roamer Services<br />
Revenues (in<br />
$000s)<br />
217<br />
Cell Sites Direct Service<br />
Provider<br />
Employees<br />
1985 340,213 248,613 $482,428 N/A 913 2,727 N/A<br />
1986 681,825 341,612 $823,052 N/A 1,531 4,334 N/A<br />
1987 1,230,855 549,030 $1,151,519 N/A 2,305 7,147 $96.83<br />
1988 2,069,441 838,586 $1,959,548 N/A 3,209 11,400 $98.02<br />
1989 3,508,944 1,439,503 $3,340,595 $294,567 4,169 15,927 $83.94<br />
1990 5,283,055 1,774,111 $4,548,820 $456,010 5,616 21,382 $80.90<br />
1991 7,557,148 2,274,093 $5,708,522 $703,651 7,847 26,327 $72.74<br />
1992 11,032,753 3,475,605 $7,822,726 $973,871 10,307 34,348 $68.68<br />
1993 16,009,461 4,976,708 $10,892,175 $1,361,613 12,805 39,775 $61.48<br />
1994 24,134,421 8,124,960 $14,229,922 $1,830,782 17,920 53,902 $56.21<br />
1995 33,785,661 9,651,240 $19,081,239 $2,542,570 22,663 68,165 $51.00<br />
1996 44,042,992 10,257,331 $23,634,971 $2,780,935 30,045 84,161 $47.70<br />
1997 55,312,293 11,269,301 $27,485,633 $2,974,205 51,600 109,387 $42.78<br />
1998 69,209,321 13,897,028 $33,133,175 $3,500,469 65,887 134,754 $39.43<br />
1999 86,047,003 16,837,682 $40,018,489 $4,085,417 81,698 155,817 $41.24<br />
2000 109,478,031 23,431,028 $52,466,020 $3,882,981 104,288 184,449 $45.27<br />
2001 128,374,512 18,896,481 $65,316,235 $3,752,826 127,540 203,580 $47.37<br />
2002 140,766,842 12,392,330 $76,508,187 $3,895,512 139,338 192,410 $48.40<br />
2003 158,721,981 17,955,139 $87,624,093 $3,766,267 162,986 205,629 $49.91<br />
2004 182,140,362 23,418,381 $102,121,210 $4,210,331 175,725 226,016 $50.64<br />
2005 207,896,198 25,755,836 $113,538,221 $3,786,331 183,689 233,067 $49.98<br />
2006 233,040,781 25,144,583 $125,456,825 $3,494,294 195,613 253,793 $50.56<br />
2007 255,395,599 22,354,818 $138,869,304 $3,742,014 213,299 266,782 $49.79<br />
2008 270,333,881 14,938,282 $148,084,170 $3,739,274 242,130 268,528 $50.07<br />
Average Local<br />
Monthly Bill (Dec.<br />
Survey<br />
Periods)<br />
Source: CTIA, Background on CTIA’s Semi-Annual <strong>Wireless</strong> Industry Survey<br />
(Annualized <strong>Wireless</strong> Industry Survey<br />
Results – December 1985 To December 2008: Reflecting Domestic U.S. Commercially-Operational Cellular, ESMR<br />
and PCS Providers).
Federal Communications Commission <strong>FCC</strong> 10-81<br />
Table C-2: <strong>FCC</strong>’s Semi-Annual Local Telephone <strong>Competition</strong> Survey:<br />
<strong>Mobile</strong> Telephone Subscribership<br />
Source: Local Telephone <strong>Competition</strong>: Status as of June 30, 2008, Federal Communications Commission, August 2009 (Table 14: <strong>Mobile</strong><br />
<strong>Wireless</strong> Telephone Subscribers).<br />
218
Federal Communications Commission <strong>FCC</strong> 10-81<br />
Table C-3: Economic Area Penetration Rates<br />
EA EA Name Subscribers<br />
219<br />
2008<br />
Estimated<br />
EA<br />
Population<br />
2008<br />
Penetration<br />
Rate<br />
2008<br />
HHI<br />
2007<br />
HHI<br />
EA<br />
Density<br />
57 Detroit-Ann Arbor-Flint, MI 7,279,508 6,949,314 105% 2971 2822 364.07<br />
78 Birmingham, AL 1,750,967 1,661,353 105% 2542 2714 137.13<br />
155 Farmington, NM-CO 224,144 213,552 105% 3877 3817 16.04<br />
13 Washington-Baltimore, DC-MD-VA-WV-PA 9,567,739 9,215,733 104% 2731 2734 402.76<br />
82 Biloxi-Gulfport-Pascagoula, MS 397,022 387,725 102% 2465 2255 143.45<br />
83 New Orleans, LA-MS (see note 1) 1,602,718 1,576,305 102% 3247 3038 171.93<br />
161 San Diego, CA 3,062,637 3,001,072 102% 2574 2605 660.48<br />
87 Beaumont-Port Arthur, TX 451,330 446,851 101% 3037 3094 89.2<br />
31 Miami-Fort Lauderdale, FL 6,060,744 6,114,085 99% 2250 2557 483.2<br />
135 Odessa-Midland, TX 401,917 406,313 99% 3671 3512 10.13<br />
85 Lafayette, LA 617,580 629,216 98% 4660 4436 99.99<br />
122 Wichita, KS-OK 1,163,451 1,182,342 98% 2798 1967 20.49<br />
10 New York-North New Jersey-Long Island, NY-NJ-CT-PA 25,840,149 26,646,432 97% 2640 2632 890.56<br />
81 Pensacola, FL 668,261 686,522 97% 2657 2085 154.06<br />
20 Norfolk-Virginia Beach-Newport News, VA-NC 1,748,338 1,818,132 96% 2775 2058 289.89<br />
22 Fayetteville, NC 530,982 554,048 96% 2857 1988 164.57<br />
90 Little Rock-North Little Rock, AR 1,615,294 1,689,753 96% 4210 4044 46.09<br />
172 Honolulu, HI 1,239,506 1,288,198 96% 2365 2369 187.2<br />
12 Philadelphia-Wilmington-Atlantic City, PA-NJ-DE-MD 7,186,730 7,570,454 95% 2614 2652 778.84<br />
80 <strong>Mobile</strong>, AL 677,754 710,168 95% 3106 2801 74.75<br />
97 Springfield, IL-MO 490,209 514,014 95% 3910 3800 58.2<br />
131 Houston-Galveston-Brazoria, TX 6,378,099 6,691,432 95% 2279 2278 169.25<br />
133 McAllen-Edinburg-Mission, TX 1,138,690 1,202,189 95% 3025 3803 221.96<br />
141 Denver-Boulder-Greeley, CO-KS-NE 4,313,611 4,540,177 95% 2339 2326 52.02<br />
170 Seattle-Tacoma-Bremerton, WA 4,344,695 4,566,164 95% 2615 2571 190.45<br />
29 Jacksonville, FL-GA 2,036,509 2,156,622 94% 2381 2228 112.52<br />
86 Lake Charles, LA 506,078 539,898 94% 3354 3154 52.41<br />
132 Corpus Christi, TX 524,058 559,249 94% 2471 2850 46.47<br />
15 Richmond-Petersburg, VA 1,475,224 1,593,807 93% 3206 2355 124.03<br />
79 Montgomery, AL 457,762 494,455 93% 2531 1838 66.86<br />
121 North Platte, NE-CO 55,308 59,249 93% 5577 6272 4.95<br />
128 Abilene, TX 202,179 216,950 93% 3457 3371 20.35<br />
143 Casper, WY-ID-UT 407,544 439,965 93% 5256 5031 5.17<br />
160 Los Angeles-Riverside-Orange County, CA-AZ 18,348,656 19,635,950 93% 2488 2542 286.1<br />
163 San Francisco-Oakland-San Jose, CA 8,886,433 9,606,859 93% 2610 2526 271.07<br />
34 Tampa-St. Petersburg-Clearwater, FL 2,519,668 2,733,761 92% 2291 1801 890.99<br />
37 Albany, GA 457,309 497,476 92% 3040 2228 62.74<br />
40 Atlanta, GA-AL-NC 6,254,177 6,776,384 92% 2411 2342 246.04<br />
42 Asheville, NC 447,936 488,874 92% 4132 3930 128.63<br />
59 Green Bay, WI-MI 625,112 681,496 92% 2837 2708 34.15<br />
93 Joplin, MO-KS-OK 255,563 277,263 92% 3584 3404 74.68<br />
99 Kansas City, MO-KS 2,426,298 2,651,516 92% 2290 2237 88.73<br />
127 Dallas-Fort Worth, TX-AR-OK 8,238,206 8,944,362 92% 2623 2479 119<br />
3<br />
Boston-Worcester-Lawrence-Lowewell-Brockton, MA-<br />
NH<br />
7,477,030 8,182,770 91% 2800 2700 421.83
EA EA Name Subscribers<br />
Federal Communications Commission <strong>FCC</strong> 10-81<br />
220<br />
2008<br />
Estimated<br />
EA<br />
Population<br />
2008<br />
Penetration<br />
Rate<br />
2008<br />
HHI<br />
2007<br />
HHI<br />
EA<br />
Density<br />
26 Charleston-North Charleston, SC 622,882 683,525 91% 2969 1961 149.8<br />
28 Savannah, GA-SC 685,861 756,214 91% 2433 1795 91.95<br />
30 Orlando, FL 4,044,360 4,435,636 91% 2486 2539 265.84<br />
55 Cleveland-Akron, OH-PA 4,179,189 4,591,498 91% 3773 2641 427.84<br />
70 Louisville, KY-IN 1,370,748 1,509,949 91% 2520 2534 180.92<br />
71 Nashville, TN-KY 2,525,249 2,785,768 91% 2679 2699 105.12<br />
84 Baton Rouge, LA-MS 738,091 807,491 91% 4999 4686 140.3<br />
89 Monroe, LA 301,514 329,618 91% 4320 4271 56.12<br />
136 Hobbs, NM-TX 178,509 196,227 91% 3073 3548 11.21<br />
23 Charlotte-Gastonia-Rock Hill, NC-SC 2,214,894 2,473,299 90% 3059 2273 240.5<br />
24 Columbia, SC 915,227 1,013,410 90% 3634 2235 125.95<br />
25 Wilmington, NC-SC 916,535 1,018,797 90% 2760 1910 107.39<br />
35 Tallahassee, FL-GA 710,634 786,450 90% 3084 2287 63.51<br />
39 Columbus, GA-AL 463,777 515,179 90% 2888 2122 84.08<br />
44 Knoxville, TN 978,794 1,091,091 90% 2816 2739 165.64<br />
51 Columbus, OH 2,255,320 2,517,488 90% 3080 2839 190.4<br />
64 Chicago-Gary-Kenosha, IL-IN-WI 9,758,562 10,863,175 90% 2140 2151 556.54<br />
73 Memphis, TN-AR-MS-KY 1,758,238 1,959,370 90% 2709 2593 102.99<br />
153 Las Vegas, NV-AZ-UT 2,090,698 2,311,014 90% 2297 2517 23.74<br />
95 Jonesboro, AR-MO 273,192 305,662 89% 5032 4778 51.3<br />
130 Austin-San Marcos, TX 1,578,703 1,765,864 89% 2640 2632 156.06<br />
134 San Antonio, TX 2,250,096 2,518,581 89% 2220 2481 82.99<br />
137 Lubbock, TX 343,283 387,146 89% 2832 2878 27.17<br />
142 Scottsbluff, NE-WY 78,969 88,903 89% 6801 5666 7.81<br />
41 Greenville-Spartanburg-Anderson, SC-NC 1,204,661 1,364,738 88% 4047 2792 183.62<br />
50 Dayton-Springfield, OH 986,040 1,116,999 88% 2615 2590 318.52<br />
69 Evansville-Henderson, IN-KY-IL 759,745 861,317 88% 4433 4340 75.31<br />
124 Tulsa, OK-KS 1,275,769 1,451,768 88% 3222 3227 72.44<br />
126 Western Oklahoma, OK 121,529 137,340 88% 3170 3110 12.04<br />
19 Raleigh-Durham-Chapel Hill, NC 1,939,647 2,232,251 87% 2965 2141 188.38<br />
53 Pittsburgh, PA-WV 2,510,463 2,891,964 87% 3157 3079 284.77<br />
67 Indianapolis, IN-IL 2,838,314 3,264,138 87% 3033 2983 171.37<br />
77 Jackson, MS-AL-LA 1,283,565 1,480,716 87% 3333 3225 49.67<br />
88 Shreveport-Bossier City, LA-AR 507,029 580,798 87% 3810 3374 57.96<br />
96 St. Louis, MO-IL 3,214,497 3,681,336 87% 2674 2708 127.01<br />
107 Minneapolis-St. Paul, MN-WI-IA 4,179,353 4,824,484 87% 2588 2061 82.98<br />
111 Minot, ND 91,788 105,574 87% 4304 4117 7<br />
5 Albany-Schenectady-Troy, NY 1,037,835 1,202,416 86% 3352 3289 134.71<br />
27 Augusta-Aiken, GA-SC 543,513 634,830 86% 3781 2203 89.79<br />
32 Fort Myers-Cape Coral, FL 777,730 908,394 86% 2429 2515 234.27<br />
36 Dothan, AL-FL-GA 301,007 349,130 86% 2536 2080 53.7<br />
38 Macon, GA 705,680 818,370 86% 3662 2958 62.88<br />
43 Chattanooga, TN-GA 674,119 784,456 86% 3494 3294 145.32<br />
45 Johnson City-Kingsport-Bristol, TN-VA 515,676 598,600 86% 3936 2293 144.51<br />
98 Columbia, MO 338,299 395,491 86% 4082 3843 58<br />
103 Cedar Rapids, IA 360,877 420,766 86% 2561 2600 101.33<br />
138 Amarillo, TX-NM 422,603 489,740 86% 2668 2644 11.79
EA EA Name Subscribers<br />
Federal Communications Commission <strong>FCC</strong> 10-81<br />
221<br />
2008<br />
Estimated<br />
EA<br />
Population<br />
2008<br />
Penetration<br />
Rate<br />
2008<br />
HHI<br />
2007<br />
HHI<br />
EA<br />
Density<br />
167 Portland-Salem, OR-WA 2,842,754 3,286,569 86% 2469 2315 76.01<br />
171 Anchorage, AK 587,874 686,293 86% 3927 3873 1.07<br />
18 Greensboro-Winston-Salem-High Point, NC-VA 1,693,560 1,995,855 85% 2786 1985 189.09<br />
101 Peoria-Pekin, IL 449,514 526,468 85% 3424 3366 90.99<br />
125 Oklahoma City, OK 1,547,547 1,811,951 85% 3444 3486 65.04<br />
154 Flagstaff, AZ-UT 408,492 478,450 85% 3833 2835 8.24<br />
156 Albuquerque, NM-AZ 883,070 1,035,714 85% 2843 2103 20.89<br />
164 Sacramento-Yolo, CA 2,278,601 2,680,240 85% 2621 2600 188.08<br />
2 Portland, ME 657,097 782,854 84% 2812 2493 98.56<br />
8 Buffalo-Niagara Falls, NY-PA 1,212,940 1,447,692 84% 3324 3222 212.89<br />
11 Harrisburg-Lebanon-Carlisle, PA 1,013,427 1,208,890 84% 3235 3130 292.42<br />
17 Roanoke, VA-NC-WV 720,763 857,872 84% 2439 1831 97.83<br />
21 Greenville, NC 730,656 874,488 84% 2641 2235 87.74<br />
56 Toledo, OH 1,076,840 1,275,362 84% 4566 3258 163.94<br />
63 Milwaukee-Racine, WI 1,965,243 2,331,492 84% 2123 2200 366.88<br />
75 Tupelo, MS-AL-TN 526,224 627,150 84% 5403 5275 49.76<br />
102 Davenport-Moline-Rock Island, IA-IL 469,626 558,029 84% 2585 2548 108.27<br />
151 Reno, NV-CA 643,698 768,870 84% 2556 2282 7.56<br />
6 Syracuse, NY-PA 1,559,887 1,884,621 83% 4002 3884 104.74<br />
33 Sarasota-Bradenton, FL 720,731 871,874 83% 2733 2074 273.56<br />
49 Cincinnati-Hamilton, OH-KY-IN 1,935,674 2,337,216 83% 2247 2225 294.08<br />
66 Fort Wayne, IN 613,053 741,382 83% 3038 3088 158.5<br />
118 Omaha, NE-IA-MO 912,444 1,100,498 83% 3495 2128 62.4<br />
120 Grand Island, NE 236,032 284,487 83% 6672 5989 11.56<br />
157 El Paso, TX-NM 863,810 1,045,239 83% 2370 2050 33.04<br />
158 Phoenix-Mesa, AZ-NM 3,664,125 4,440,500 83% 2683 2108 93.91<br />
159 Tucson, AZ 985,051 1,183,947 83% 2622 2006 60.03<br />
7 Rochester, NY-PA 1,214,616 1,478,494 82% 4389 4247 167.21<br />
68 Champaign-Urbana, IL 513,173 629,200 82% 3378 3265 73.47<br />
91 Fort Smith, AR-OK 286,419 347,505 82% 4121 4114 46.51<br />
94 Springfield, MO 782,275 951,629 82% 3690 3514 48.14<br />
108 Wausau, WI 401,743 489,282 82% 2477 2371 34.13<br />
123 Topeka, KS 386,173 468,643 82% 2623 1850 35.62<br />
169 Richland-Kennewick-Pasco, WA 624,145 759,564 82% 2723 2516 27.68<br />
72 Paducah, KY-IL 186,310 229,282 81% 5938 5846 70.02<br />
106 Rochester, MN-IA-WI 271,204 335,650 81% 3272 2799 55.65<br />
139 Santa Fe, NM 221,840 272,281 81% 4568 2806 13.06<br />
147 Spokane, WA-ID 742,292 914,396 81% 3338 3076 23.63<br />
152 Salt Lake City-Ogden, UT-ID 2,060,297 2,533,880 81% 2265 2226 35.68<br />
9 State College, PA 636,118 798,593 80% 4204 4238 92.41<br />
60 Appleton-Oshkosh-Neenah, WI 368,450 458,449 80% 2618 1927 143.62<br />
100 Des Moines, IA-IL-MO 1,378,065 1,727,108 80% 2982 2679 47.32<br />
119 Lincoln, NE 324,131 403,030 80% 4909 4251 50.24<br />
140 Pueblo, CO-NM 231,849 291,066 80% 2986 2646 8.71<br />
150 Boise City, ID-OR 572,748 711,937 80% 2856 2703 13.69<br />
144 Billings, MT-WY 347,514 441,859 79% 5375 5062 4.89<br />
46 Hickory-Morganton, NC-TN 425,021 548,060 78% 2742 2646 131.9
EA EA Name Subscribers<br />
Federal Communications Commission <strong>FCC</strong> 10-81<br />
222<br />
2008<br />
Estimated<br />
EA<br />
Population<br />
2008<br />
Penetration<br />
Rate<br />
2008<br />
HHI<br />
2007<br />
HHI<br />
EA<br />
Density<br />
48 Charleston, WV-KY-OH 924,959 1,178,626 78% 3442 2999 85.35<br />
52 Wheeling, WV-OH 238,554 306,292 78% 4538 4436 124.54<br />
62 Grand Rapids-Muskegon-Holland, MI 1,521,485 1,961,947 78% 2935 2709 206.76<br />
65 Elkhart-Goshen, IN-MI 743,583 955,560 78% 2571 2332 185.73<br />
129 San Angelo, TX 161,249 206,905 78% 2237 2464 10.05<br />
166 Eugene-Springfield, OR-CA 664,561 847,451 78% 2322 1850 43.1<br />
4 Burlington, VT-NY 478,471 620,023 77% 8263 4776 57.62<br />
14 Salisbury, MD-DE-VA 313,773 409,070 77% 5507 5263 111.17<br />
16 Staunton, VA-WV 271,405 350,536 77% 2881 2093 50.99<br />
47 Lexington, KY-TN-VA-WV 1,473,102 1,921,072 77% 3807 3683 80.39<br />
61 Traverse City, MI 230,588 300,465 77% 2882 4178 50.67<br />
104 Madison, WI-IA-IL 774,390 1,002,884 77% 3442 3530 71.33<br />
117 Sioux City, IA-NE-SD 192,264 248,114 77% 4240 4025 39.51<br />
148 Idaho Falls, ID-WY 271,012 350,332 77% 4361 2388 10.85<br />
149 Twin Falls, ID 135,160 176,400 77% 4175 2232 14.08<br />
165 Redding, CA-OR 279,110 361,915 77% 2888 2273 14.36<br />
1 Bangor, ME 408,137 533,602 76% 4250 4365 20.94<br />
116 Sioux Falls, SD-IA-MN-NE 420,355 554,970 76% 5179 4288 15.11<br />
162 Fresno, CA 1,233,651 1,633,280 76% 2962 2932 98.64<br />
92 Fayetteville-Springdale-Rogers, AR-MO-OK 378,621 506,212 75% 4729 4629 88.43<br />
113 Fargo-Moorhead, ND-MN 288,111 384,153 75% 4313 3286 16.4<br />
115 Rapid City, SD-MT-ND-NE 165,888 224,401 74% 5140 4952 5.04<br />
54 Erie, PA 371,032 509,551 73% 4241 4120 116.41<br />
168 Pendleton, OR-WA 144,625 204,130 71% 2894 2150 8.67<br />
76 Greenville, MS 158,768 226,125 70% 3575 3491 40.96<br />
145 Great Falls, MT 112,542 163,194 69% 4910 4685 4.23<br />
105 La Crosse, WI-MN 170,756 252,006 68% 3823 3815 53.67<br />
58 Northern Michigan, MI * 267,688 * 4261 4270 28.53<br />
74 Huntsville, AL-TN (see note 2) * 1,066,914 * 2550 * 119.14<br />
109 Duluth-Superior, MN-WI * 348,380 * 4107 3504 18.53<br />
110 Grand Forks, ND-MN * 220,264 * 4755 3848 10.16<br />
112 Bismarck, ND-MT-SD * 179,144 * 5015 4891 6.26<br />
114 Aberdeen, SD * 77,619 * 5000 4983 5.39<br />
146 Missoula, MT * 436,309 * 6327 6043 10.79<br />
*Data withheld to maintain firm confidentiality.<br />
Source: Federal Communications Commission internal analysis based on year-end 2008 filings for Numbering<br />
Resource Utilization in the United States. Density is persons per square mile. EA populations are based on Census<br />
estimates as of July 1, 2008.<br />
Note 1: As discussed in the Twelfth <strong>Report</strong>, the penetration rate in EA83 (New Orleans) appears to be an aberration.<br />
That EA lost over 260,000 people between 2000 and 2006, while its subscriber count remained relatively<br />
unchanged, creating a large increase in its penetration rate. One explanation for this may be that, after the flooding,<br />
people leaving the area took their cell phones (and cell phone numbers) with them. Thus, those numbers may still<br />
be associated with New Orleans rate centers, even though the people actually no longer live anywhere near there.<br />
Note 2: We believe there was a discrepancy in the data for this EA, making the subscriber data and HHI for this<br />
market unreliable.
Federal Communications Commission <strong>FCC</strong> 10-81<br />
Table C-4: Top 16 <strong>Mobile</strong> <strong>Wireless</strong> Operators by Subscribers<br />
(with publicly-available subscriber counts, in thousands)<br />
Year-End 2007 Year-End 2008<br />
Operator Total Operator Total<br />
1 AT&T (1) 70,052 AT&T (1) 77,009<br />
2 Verizon <strong>Wireless</strong> (1) 65,707 Verizon <strong>Wireless</strong> (1) 72,056<br />
3 Sprint Nextel (1) 53,003 Sprint Nextel (1) 48,338<br />
4 T-<strong>Mobile</strong> 28,685 T-<strong>Mobile</strong> (1) 32,758<br />
5 Alltel (1, 2) 13,400 Alltel (1, 2) 13,219<br />
6 US Cellular (1) 6,122 US Cellular (1) 6,196<br />
7 MetroPCS 3,963 MetroPCS 5,367<br />
8 Leap 2,864 Leap 3,845<br />
9 Centennial 1,093 Centennial (3) 1,100<br />
10 América Móvil / Claro (4) 3,496 América Móvil / Claro (4) 4,809<br />
11 Cellular South (6) 700 Cellular South (6) 800<br />
12 iPCS 630 iPCS (5) 691<br />
13 Cincinnati Bell <strong>Wireless</strong> 571 Cincinnati Bell <strong>Wireless</strong> 551<br />
14 Clearwire 394 Clearwire 475<br />
15 Ntelos 407 Ntelos 435<br />
16 Pocket Comm. (7) 200 Pocket Comm. 300<br />
Sources: For 2007, see Thirteenth <strong>Report</strong>, Table A-4 at xxxx. Some numbers in 2007 were adjusted or corrected as<br />
noted below. For 2008, publicly-available company documents such as operators’ news releases and SEC filings.<br />
Subscriber information for privately-held companies is taken from news reports, as noted below.<br />
Notes:<br />
(1) For 2008, AT&T number includes 60,098 (in thousands) postpaid and 16,911 prepaid customers. Verizon<br />
number includes 70,021 retail customers and 2,035 wholesale customers. SprintNextel number includes 36,678<br />
direct post-paid customers and 3,597 direct pre-paid customers (Boost subscribers), 8,063 wholesale subscribers,<br />
but not 927 affiliated company subscribers. (SprintNextel number in 2007 was correctly due to a mistake in the<br />
Thirteenth <strong>Report</strong>.) T-<strong>Mobile</strong> number includes 26,806 postpaid and 5,952 prepaid customers. Alltel includes<br />
12,813 retail customers and 406 wholesale customers derived from Verizon’s pro forma numbers. US Cellular<br />
number includes 5,420 postpaid, 287 prepaid, and 489 wholesale customers. Cincinnati Bell includes 404<br />
postpaid and 147 prepaid subscribers.<br />
(2) On January 5, 2009, Verizon <strong>Wireless</strong> completed its acquisition of Alltel. Alltel number in 2007 is substituted<br />
by its number in the first quarter of 2008. Alltel numbers are derived from Verizon’s pro forma numbers.<br />
(3) On November 6, 2009, AT&T completed its acquisition of Centennial with estimated 1.1 million subscribers.<br />
(4) This includes Claro subscribers in Dominican Republic, Puerto Rico and Jamaica. No separated subscriber<br />
counts were reported. The number for 2007 was adjusted accordingly from the Thirteenth <strong>Report</strong>. Tracfone’s<br />
subscriber counts were not included.<br />
(5) On October 19, 2009, SprintNextel announced it is acquiring its wireless affiliate iPCS.<br />
(6) For 2008 subscriber counts, see TRDaily, January 20, 2010; for 2007 subscriber counts, see<br />
http://memphis.bizjournals.com/memphis/stories/2007/12/10/daily7.html.<br />
(7) Pocket Communications subscriber count in 2007 was corrected from 175 to 200.<br />
223
Smartphone Date<br />
Launched<br />
BlackBerry<br />
8820 2<br />
BlackBerry<br />
Pearl 8120 3<br />
BlackBerry<br />
Curve 8330 4<br />
BlackBerry<br />
Pearl 8110 5<br />
Federal Communications Commission <strong>FCC</strong> 10-81<br />
Table C-5: Selected Smartphone Launches in 2008-2009<br />
<strong>Wireless</strong> Service<br />
Provider(s)<br />
Mar. 2008 AT&T<br />
T-<strong>Mobile</strong><br />
Cellular One<br />
Apr. 2008 AT&T<br />
T-<strong>Mobile</strong><br />
Corr<br />
Apr. 2008 Sprint Nextel<br />
Verizon <strong>Wireless</strong><br />
ACS<br />
Alltel<br />
Appalachian<br />
Bluegrass<br />
Boost<br />
Carolina West<br />
Cbeyond<br />
Cellcom<br />
Cellular One<br />
(Montana)<br />
Cellular South<br />
Closecall<br />
Credo <strong>Mobile</strong><br />
Metro PCS<br />
nTelos<br />
Pioneer<br />
US Cellular<br />
Apr. 2008 AT&T<br />
Cellular One of<br />
NEPA<br />
Long Lines<br />
Viaero<br />
West Central<br />
1 Based on reviewing company websites and press releases.<br />
Offered<br />
Exclusively at<br />
Launch? 1<br />
No RIM<br />
224<br />
Handset<br />
Manufacturer<br />
Platform/<br />
Operating System<br />
BlackBerry<br />
No RIM BlackBerry<br />
No RIM BlackBerry<br />
No RIM BlackBerry<br />
2 T-<strong>Mobile</strong> USA Launches Blackberry 8820, Press Release, RIM, Mar. 24, 2008, available at<br />
http://press.rim.com/release.jsp?id=1478). U.S. providers carrying the 8820 listed on Blackberry’s page for the<br />
device at http://na.blackberry.com/eng/devices/blackberry8800.<br />
3 T-<strong>Mobile</strong> and RIM Announce the BlackBerry Pearl 8120, Press Release, RIM, Apr. 1, 2008, available at<br />
http://press.rim.com/release.jsp?id=1484). U.S. providers carrying the Pearl 8120 listed on RIM’s page for the<br />
device at http://na.blackberry.com/eng/devices/blackberrypearl8100.<br />
4 Sprint Bolsters Industry-Leading BlackBerry Portfolio with Addition of the BlackBerry Curve 8330, Press Release,<br />
RIM, Apr. 1, 2008, available at http://press.rim.com/release.jsp?id=1494). U.S. providers carrying the Curve 8330<br />
listed on RIM’s page for the device at http://na.blackberry.com/eng/devices/blackberrycurve8300.<br />
5 AT&T Launches the GPS-Enabled BlackBerry Pearl 8110 Smartphone, Press Release, RIM, Apr. 23, 2008,<br />
available at http://press.rim.com/release.jsp?id=1522). U.S. providers carrying the Pearl 8110 listed on RIM’s page<br />
for the device at http://na.blackberry.com/eng/devices/blackberrypearl8100.
Smartphone Date<br />
Launched<br />
XV6900 6<br />
Federal Communications Commission <strong>FCC</strong> 10-81<br />
<strong>Wireless</strong> Service<br />
Provider(s)<br />
Apr. 2008 Verizon <strong>Wireless</strong><br />
Offered<br />
Exclusively at<br />
Launch? 1<br />
Yes; phone is no<br />
longer available<br />
from provider<br />
225<br />
Handset<br />
Manufacturer<br />
Platform/<br />
Operating System<br />
HTC Windows <strong>Mobile</strong> 6<br />
Professional<br />
N78 7 June 2008 Unlocked No Nokia Symbian OS 9.3, S60<br />
rel. 3.2<br />
iPhone 3G 8 July 2008 AT&T Yes Apple iPhone OS<br />
Treo 800w 9 July 2008 Sprint Nextel Yes; phone is no<br />
longer available<br />
from carrier<br />
Palm Windows <strong>Mobile</strong> 6.1<br />
Professional<br />
E71 10 July 2008 Unlocked No Nokia Symbian OS 9.2, S60<br />
rel. 3.1 UI<br />
Q Global 11 Aug. 2008 AT&T Yes Motorola Windows <strong>Mobile</strong> 6.1<br />
Treo Pro 12 Sept. 2008 Unlocked<br />
Sprint Nextel<br />
Alltel<br />
No Palm Windows <strong>Mobile</strong> 6.1<br />
6 Verizon <strong>Wireless</strong> Unveils Stylish, Intuitive XV6900 For <strong>Mobile</strong> Professionals, Press Release, Verizon <strong>Wireless</strong>,<br />
Mar. 31, 2008, available at http://news.vzw.com/news/2008/03/pr2008-03-28k.html. Product no longer available<br />
through Verizon <strong>Wireless</strong> website, but HTC’s page for the device at http://www.htc.com/us/products/verizonxv6900<br />
indicates that, when the device was available, it was available exclusively from Verizon <strong>Wireless</strong>.<br />
7 A Perfect Fusion Of Features And Services – The Nokia N78 Now Available In US, Press Release, Nokia, June 24,<br />
2008, available at http://www.nokia.com/press/press-releases/showpressrelease?newsid=1230590.<br />
8 AT&T to Offer Next-Generation iPhone on Its High-Performance 3G Network, Press Release, AT&T, June 9,<br />
2008, available at http://www.att.com/gen/press-room?pid=4800&cdvn=news&newsarticleid=25791&mapcode.<br />
Press release indicates U.S. exclusivity through AT&T.<br />
9 Palm and Sprint Introduce the 800w Smartphone, Press Release, Palm, July 14, 2008, available at<br />
http://investor.palm.com/releasedetail.cfm?ReleaseID=321781). Press release indicates exclusive Sprint content, but<br />
product no longer available through Palm or Sprint.<br />
10 Nokia E71 makes its US debut at the Nokia Flagship Store in New York, Press Release, Nokia, July 29, 2008,<br />
available at http://www.nokia.com/press/press-releases/showpressrelease?newsid=1238972.<br />
11 MOTO Q Global with Windows <strong>Mobile</strong> 6.1 Now Available from AT&T, Press Release, Motorola, Sep. 2, 2008,<br />
available at http://mediacenter.motorola.com/content/detail.aspx?ReleaseID=5862&NewsAreaId=2). Press release<br />
indicates U.S. exclusivity through AT&T.<br />
12 Treo Pro by Palm, Now Available, Offers True End-to-End Enterprise Solution, Press Release, Palm, Sep. 26,<br />
2008, available at http://investor.palm.com/releasedetail.cfm?ReleaseID=337019. The Treo Pro was initially<br />
available unlocked from Palm directly. Subsequently, Alltel began offering the device in March 2009. See Alltel<br />
<strong>Wireless</strong> Now Offers Treo Pro Smartphone by Palm, Press Release, Palm, Mar. 5, 2009, available at<br />
http://investor.palm.com/releasedetail.cfm?ReleaseID=369034). Later in March, 2009, Sprint also began offering<br />
the Treo Pro on its network. See Sprint and Palm Announce Upcoming Availability of Treo Pro on America’s Most<br />
Dependable 3G Network, Press Release, Palm, Mar. 4, 2009, available at<br />
http://investor.palm.com/releasedetail.cfm?ReleaseID=368795.
Smartphone Date<br />
Launched<br />
BlackBerry<br />
Pearl Flip<br />
8220 13<br />
Federal Communications Commission <strong>FCC</strong> 10-81<br />
<strong>Wireless</strong> Service<br />
Provider(s)<br />
Oct. 2008 T-<strong>Mobile</strong><br />
Cellular One<br />
(Montana)<br />
Iowa <strong>Wireless</strong><br />
Viaero<br />
West Central<br />
Offered<br />
Exclusively at<br />
Launch? 1<br />
226<br />
Handset<br />
Manufacturer<br />
Platform/<br />
Operating System<br />
No RIM BlackBerry<br />
Epix 14 Oct. 2008 AT&T Yes Samsung Windows <strong>Mobile</strong> 6.1<br />
G1 15 Oct. 2008 T-<strong>Mobile</strong> Yes HTC Google Android<br />
Touch Pro 16 Oct. 2008 Sprint Nextel No; phone is no HTC Windows <strong>Mobile</strong> 6.1<br />
Verizon <strong>Wireless</strong> longer available<br />
Professional<br />
Alltel<br />
US Cellular<br />
from providers<br />
N96 17 Nov. 2008 Unlocked No Nokia Symbian OS 9.3, S60<br />
rel. 3.2<br />
BlackBerry<br />
Bold 9000 18<br />
Nov. 2008 AT&T Yes RIM BlackBerry<br />
Fuze 19 Nov. 2008 AT&T Yes; phone is no<br />
longer available<br />
from provider<br />
HTC Windows <strong>Mobile</strong> 6.1<br />
Incite 20 Nov. 2008 AT&T Yes LG Windows <strong>Mobile</strong> 6.1<br />
13 T-<strong>Mobile</strong> USA Launches First BlackBerry Flip Phone, Press Release, RIM, Oct. 13, 2008, available at<br />
http://press.rim.com/release.jsp?id=1837). U.S. wireless service providers carrying the Pearl Flip 8220 listed on<br />
RIM’s page for the device at http://na.blackberry.com/eng/devices/blackberrypearl8200.<br />
14<br />
AT&T Introduces Samsung Epix, the First Smartphone with Built-In Optical Mouse, Press Release, AT&T, Oct.<br />
21, 2008, available at http://www.att.com/gen/pressroom?pid=4800&cdvn=news&newsarticleid=26222&mapcode).<br />
Press release indicates U.S. exclusivity through<br />
AT&T.<br />
15<br />
T-<strong>Mobile</strong> Unveils the T-<strong>Mobile</strong> G1 – the First Phone Powered by Android, Press Release, T-<strong>Mobile</strong>, Sep. 23,<br />
2008, available at http://www.tmobile.com/company/PressReleases_Article.aspx?assetName=Prs_Prs_20080923&title=T-<br />
<strong>Mobile</strong>%20Unveils%20the%20T-<strong>Mobile</strong>%20G1%20–<br />
%20the%20First%20Phone%20Powered%20by%20Android). Press release indicates U.S. exclusivity through T-<br />
<strong>Mobile</strong>.<br />
16 Sprint Introduces the Highly Anticipated HTC Touch Pro, Press Release, Sprint Nextel, Oct. 24, 2008, available<br />
at http://newsreleases.sprint.com/phoenix.zhtml?c=127149&p=irolnewsArticle_newsroom&ID=1217060&highlight=touch%20pro).<br />
The HTC Touch Pro is no longer available for<br />
purchase from the providers’ websites.<br />
17 Enticing Entertainment – the Nokia N96, Press Release, Nokia, Nov. 3, 2008, available at<br />
http://www.nokia.com/press/press-releases/showpressrelease?newsid=1265787).<br />
18 AT&T Customers to Enter a ‘Bold’ New <strong>Wireless</strong> World, Press Release, RIM, Oct. 22, 2008, available at<br />
http://press.rim.com/release.jsp?id=1887. Press release indicates U.S. exclusivity through AT&T.<br />
19 HTC FUZE From AT&T Fuses Fun and Function with the One-Touch Power of TouchFLO 3D, Press Release,<br />
AT&T, Nov. 11, 2008, available at http://www.att.com/gen/pressroom?pid=4800&cdvn=news&newsarticleid=26299&mapcode).<br />
The HTC FUZE is no longer available for<br />
purchase through AT&T’s website.<br />
20 AT&T Debuts LG Incite Global 3G Smartphone, Press Release, AT&T, Nov. 18, 2008, available at<br />
http://www.att.com/gen/press-room?pid=4800&cdvn=news&newsarticleid=26322&mapcode). Press release<br />
indicates U.S. exclusivity through AT&T.
Smartphone Date<br />
Launched<br />
BlackBerry<br />
Storm 21<br />
Federal Communications Commission <strong>FCC</strong> 10-81<br />
<strong>Wireless</strong> Service<br />
Provider(s)<br />
Offered<br />
Exclusively at<br />
Launch? 1<br />
227<br />
Handset<br />
Manufacturer<br />
Platform/<br />
Operating System<br />
Nov. 2008 Verizon <strong>Wireless</strong> Yes RIM BlackBerry<br />
Omnia 22 Nov. 2008 Verizon <strong>Wireless</strong> Yes Samsung Windows <strong>Mobile</strong> 6.1<br />
Professional<br />
XPERIA X1 23 Nov. 2008 Unlocked No; phone is no<br />
longer available<br />
through<br />
manufacturer<br />
Sony Ericsson Windows <strong>Mobile</strong> 6.1<br />
N79 24 Dec. 2008 Unlocked No Nokia Symbian OS 9.3, S60<br />
v. 3.2 UI<br />
N85 25 Dec. 2008 Unlocked No Nokia Symbian OS 9.3, S60<br />
rel. 3.2<br />
BlackBerry<br />
Curve 8350i 26<br />
Dec. 2008 Sprint Nextel No RIM BlackBerry<br />
SouthernLINC<br />
E63 27 Jan. 2009 Unlocked No Nokia Symbian OS 9.2, S60<br />
v. 3.1 UI<br />
5800 Xpress<br />
Music 28<br />
Feb. 2009 Unlocked No Nokia Symbian OS 9.4, S60<br />
rel. 5<br />
21 Customers Across the Country Line Up As BlackBerry Storm Blows Into Verizon <strong>Wireless</strong> Communications<br />
Stores, Press Release, Verizon <strong>Wireless</strong>, Nov. 21, 2008, available at http://news.vzw.com/news/2008/11/pr2008-11-<br />
21b.html). Press release indicates U.S. exclusivity through Verizon <strong>Wireless</strong>.<br />
22 Verizon <strong>Wireless</strong> Adds Samsung Omnia To Its Touch Screen Lineup, Press Release, Verizon <strong>Wireless</strong>, Nov. 25,<br />
2008, available at http://news.vzw.com/news/2008/11/pr2008-11-25a.html). U.S. exclusivity through Verizon<br />
<strong>Wireless</strong> indicated by Samsung’s website identifying the Omnia as a Verizon <strong>Wireless</strong> device at<br />
http://www.samsung.com/us/consumer/mobile/mobile-phones/verizon-wireless-phones/SCH-<br />
I910ZKAVZW/index.idx?pagetype=prd_detail.<br />
23 Darren Murph, Sony Ericsson XPERIA X1 makes date with US: Black Friday for $799.99, ENGADGET, Nov. 12,<br />
2008, at http://www.engadget.com/2008/11/12/sony-ericsson-xperia-x1-makes-date-with-us-black-friday-for-79/).<br />
The XPERIA X1 is no longer available for purchase from Sony Ericsson’s website.<br />
24 Give the gift of beauty and entertainment for the holidays – the Nokia N85 and Nokia N79, Press Release, Nokia<br />
Dec. 15, 2008, available at http://www.nokia.com/press/press-releases/showpressrelease?newsid=1277593.<br />
25 Id.<br />
26 Sprint Launches BlackBerry Curve 8350i for Customers Wanting the Most Advanced Push-to-Talk BlackBerry<br />
Smartphone Ever, Press Release, RIM, Dec. 15, 2008, available at http://press.rim.com/release.jsp?id=1931). U.S.<br />
providers carrying the Curve 8350i listed on RIM’s page for the device at<br />
http://na.blackberry.com/eng/devices/blackberrycurve8300.<br />
27 Messaging made simple – the Nokia E63 heads to the United States, Press Release, Nokia, Jan. 7, 2009, available<br />
at http://www.nokia.com/press/press-releases/showpressrelease?newsid=1280903.<br />
28 Nokia 5800 XpressMusic hits shelves in the United States, Press Release, Nokia, Feb. 27, 2009, available at<br />
http://www.nokia.com/press/press-releases/archive/archiveshowpressrelease?newsid=1293991).
Smartphone Date<br />
Launched<br />
BlackBerry<br />
Curve 8900 29<br />
Federal Communications Commission <strong>FCC</strong> 10-81<br />
<strong>Wireless</strong> Service<br />
Provider(s)<br />
Feb. 2009 AT&T<br />
T-<strong>Mobile</strong><br />
Cellular One<br />
(Montana)<br />
Cellular One of<br />
East Texas<br />
Corr<br />
Long Lines<br />
MTPCS/Cellular<br />
One/Chinook<br />
Viaero<br />
West Central<br />
Offered<br />
Exclusively at<br />
Launch? 1<br />
228<br />
Handset<br />
Manufacturer<br />
Platform/<br />
Operating System<br />
No RIM BlackBerry<br />
E75 30 Apr. 2009 Unlocked No Nokia Symbian OS 9.3, S60<br />
rel. 3.2<br />
Propel Pro 31 Apr. 2009 AT&T Yes Samsung Windows <strong>Mobile</strong> 6.1<br />
Nokia E71x 32 May 2009 AT&T Yes Nokia Symbian OS 9.2, S60<br />
rel. 3.1 UI<br />
Jack 33 May 2009 AT&T Yes Samsung Windows <strong>Mobile</strong> 6.1<br />
Pre 34 June 2009 Sprint Nextel<br />
Verizon <strong>Wireless</strong><br />
No Palm Palm OS<br />
iPhone 3G S 35 June 2009 AT&T Yes Apple iPhone OS<br />
29 T-<strong>Mobile</strong> USA to Offer Customers the Thinnest and Lightest Full-QWERTY BlackBerry Smartphone, Press<br />
Release, RIM, Jan. 7, 2009, available at http://press.rim.com/release.jsp?id=1984. U.S. providers carrying the<br />
Curve 8900 listed on RIM’s page for the device at<br />
http://na.blackberry.com/eng/devices/blackberrycurve8900/curve_wheretobuy.jsp.<br />
30 Email the way you want it – Nokia E75 begins shipping, Press Release, Nokia Apr. 6, 2009, available at<br />
http://www.nokia.com/press/press-releases/showpressrelease?newsid=1303620).<br />
31 AT&T Unveils New Integrated Devices for Texting, Email and More, Press Release, AT&T, Mar. 30, 2009,<br />
available at http://www.att.com/gen/press-room?pid=4800&cdvn=news&newsarticleid=26664. U.S. exclusivity<br />
through AT&T indicated by Samsung’s website at http://www.samsung.com/us/consumer/mobile/mobile-phones/att-phones/SGH-I627MAAATT/index.idx?pagetype=prd_detail<br />
(identifying the Propel Pro as an AT&T device).<br />
32 Nokia E71x with AT&T in stores across the U.S. today, Press Release, Nokia, May 4, 2009, available at<br />
http://www.nokia.com/press/press-releases/showpressrelease?newsid=1310666). Exclusivity indicated by AT&T’s<br />
page for the device at http://www.wireless.att.com/businesscenter/NokiaE71x/index.jsp.<br />
33 AT&T Completes Its Full House of Smart Devices with the New Samsung Jack, Press Release, AT&T, May 14,<br />
2009, available at http://www.att.com/gen/press-room?pid=4800&cdvn=news&newsarticleid=26818&mapcode<br />
(indicates exclusivity).<br />
34 Charlie Sorrel, It’s Official: Palm Pre to Launch June 6 th for $300, Gadget Lab Blog, WIRED, May 19, 2009, at<br />
http://www.wired.com/gadgetlab/2009/05/boom-palm-pre-to-launch-june-6th-300.<br />
35 iPhone 3G S Available at AT&T Tomorrow, Press Release, AT&T, June 18, 2009, available at<br />
http://www.att.com/gen/press-room?pid=4800&cdvn=news&newsarticleid=26868&mapcode. U.S. exclusivity with<br />
AT&T of the iPhone 3G S indicated in the fine print/footnote on Apple’s iPhone purchase page at<br />
http://www.apple.com/iphone/buy.
Smartphone Date<br />
Launched<br />
BlackBerry<br />
Pearl Flip<br />
8230 36<br />
Federal Communications Commission <strong>FCC</strong> 10-81<br />
<strong>Wireless</strong> Service<br />
Provider(s)<br />
June 2009 Verizon <strong>Wireless</strong><br />
ACS<br />
Alltel<br />
Appalachian<br />
Bluegrass<br />
Carolina West<br />
Cellcom<br />
Cellular One of<br />
NEPA<br />
Cellular South<br />
Inland<br />
Nex-Tech/United<br />
nTelos<br />
Panhandle/PTCI<br />
US Cellular<br />
Offered<br />
Exclusively at<br />
Launch? 1<br />
229<br />
Handset<br />
Manufacturer<br />
Platform/<br />
Operating System<br />
No RIM BlackBerry<br />
Snap 37 June 2009 Sprint Nextel<br />
US Cellular<br />
No HTC Windows <strong>Mobile</strong> 6.1<br />
Ozone 38 June 2009 Verizon <strong>Wireless</strong> Yes HTC Windows <strong>Mobile</strong> 6.1<br />
N97 39 June 2009 Unlocked No Nokia Symbian OS 9.4, S60<br />
rel. 5<br />
N86 40 July 2009 Unlocked No Nokia Symbian OS 9.3, S60<br />
rel. 3.2<br />
Dash 3G 41 July 2009 T-<strong>Mobile</strong> Yes HTC Windows <strong>Mobile</strong> 6.1<br />
36 Verizon <strong>Wireless</strong> Customers Will Flip For The New 3G-Enabled BlackBerry Pearl Flip Smartphone, Press<br />
Release, RIM, June 4, 2009, available at http://press.rim.com/release.jsp?id=2345. U.S. providers carrying the<br />
Pearl Flip 8230 listed on RIM’s page for the device at http://na.blackberry.com/eng/devices/blackberrypearl8200.<br />
37 Sprint Strengthens Social Network Connections with Customers, Press Release, Sprint Nextel, June 22, 2009,<br />
available at http://newsreleases.sprint.com/phoenix.zhtml?c=127149&p=irolnewsArticle_newsroom&ID=1300933&highlight).<br />
US Cellular subsequently made the HTC Snap available on its<br />
network and for purchase on its website at http://www.uscellular.com/uscellular/cellphones/phoneDetailsPopup.jsp?IDparam=prod680004).<br />
38 HTC Ozone Brings Verizon <strong>Wireless</strong>’ Smartphone Lineup to New Heights, Press Release, Verizon <strong>Wireless</strong> June<br />
25, 2009, available at http://news.vzw.com/news/2009/06/pr2009-06-25.html. Exclusivity indicated by Verizon<br />
<strong>Wireless</strong>’s webpage at<br />
http://www.verizonwireless.com/b2c/store/controller?item=phoneFirst&action=viewPhoneDetail&selectedPhoneId=<br />
4848&cmp=KNC-PaidSearch.<br />
39 Nokia N97 mobile computer to begin selling worldwide in June, Press Release, Nokia, June 2, 2009, available at<br />
http://www.nokia.com/press/press-releases/showpressrelease?newsid=1319081.<br />
40 The ultimate imaging device – the Nokia N86 8MP – coming to the United States, Press Release, Nokia, July 17,<br />
2009, available at http://pressbulletinboard.nokia.com/2009/07/17/the-ultimate-imaging-device-%E2%80%93-thenokia-n86-8mp-%E2%80%93-coming-to-the-united-states/.<br />
41 T-<strong>Mobile</strong> USA To Offer New 3G-Enabled Smartphone, Press Release, T-<strong>Mobile</strong>, June 17, 2009, available at<br />
http://www.t-mobile.com/company/PressReleases_Article.aspx?assetName=Prs_Prs_20090618&title=T-<br />
<strong>Mobile</strong>%20USA%20To%20Offer%20New%203G-Enabled%20Smartphone. T-<strong>Mobile</strong>’s U.S. exclusivity indicated<br />
by name being “T-<strong>Mobile</strong> Dash 3G” and by the Dash 3G being a new generation of the T-<strong>Mobile</strong> Dash, which was<br />
exclusively available through T-<strong>Mobile</strong>. See T-<strong>Mobile</strong> Unveils a New Full-Featured Smartphone, the T-<strong>Mobile</strong><br />
Dash, Press Release, T-<strong>Mobile</strong>, Oct. 11, 2006, available at http://www.tmobile.com/company/PressReleases_Article.aspx?assetName=Prs_Prs_20061011&title=T-<br />
<strong>Mobile</strong>%20Unveils%20a%20New%20Full-Featured%20Smartphone,%20the%20T-<strong>Mobile</strong>%20Dash.
Smartphone Date<br />
Launched<br />
Federal Communications Commission <strong>FCC</strong> 10-81<br />
<strong>Wireless</strong> Service<br />
Provider(s)<br />
Offered<br />
Exclusively at<br />
230<br />
Handset<br />
Manufacturer<br />
Platform/<br />
Operating System<br />
Launch? 1<br />
Surge 42 July 2009 AT&T Yes Nokia Symbian OS, S60 3.2<br />
Edition<br />
myTouch 3G 43 Aug. 2009 T-<strong>Mobile</strong> Yes HTC Google Android<br />
BlackBerry<br />
Curve 8520 44<br />
Aug. 2009 AT&T<br />
No RIM Blackberry<br />
T-<strong>Mobile</strong><br />
Iowa <strong>Wireless</strong><br />
Long Lines<br />
MTPCPS/Cellular<br />
One/Chinook<br />
Touch Pro 2 45 Aug. 2009 T-<strong>Mobile</strong> No HTC Windows <strong>Mobile</strong> 6.1<br />
Sprint Nextel<br />
Verizon <strong>Wireless</strong><br />
US Cellular<br />
Professional<br />
BlackBerry<br />
Tour 46<br />
Aug. 2009 Sprint Nextel No RIM BlackBerry<br />
Verizon <strong>Wireless</strong><br />
ACS<br />
Alltel<br />
Appalachian<br />
Bluegrass<br />
Carolina West<br />
Cellcom<br />
Cellular South<br />
Credo <strong>Mobile</strong><br />
Inland<br />
nTelos<br />
Panhandle/PTCI<br />
Pioneer<br />
US Cellular<br />
42 AT&T and Nokia ride a social wave into summer with Nokia Surge, Press Release, Nokia, July 13, 2009,<br />
available at http://www.nokia.com/press/press-releases/showpressrelease?newsid=1328505. Exclusivity indicated<br />
by AT&T’s page for the device at http://www.wireless.att.com/businesscenter/nokia-surge/index.jsp.<br />
43<br />
T-<strong>Mobile</strong> myTouch 3G Available in Stores Nationwide Beginning Today, Press Release, T-<strong>Mobile</strong>, Aug. 5, 2009,<br />
available at http://www.tmobile.com/company/PressReleases_Article.aspx?assetName=Prs_Prs_20090805&title=T-<br />
<strong>Mobile</strong>%20myTouch%203G%20Available%20in%20Stores%20Nationwide%20Beginning%20Today. Exclusivity<br />
indicated by full name being “T-<strong>Mobile</strong>® myTouch 3G” and HTC’s site referring to it as a T-<strong>Mobile</strong> device at<br />
http://www.htc.com/us/products/t-mobile-mytouch-3g?view=1-2&sort=0.<br />
44 T-<strong>Mobile</strong> USA and RIM Introduce the New BlackBerry Curve 8520, Press Release, RIM, July 27, 2009, available<br />
at http://press.rim.com/release.jsp?id=2437. U.S. providers carrying the Curve 8520 listed on RIM’s webpage at<br />
http://na.blackberry.com/eng/devices/blackberrycurve8500.<br />
45 T-<strong>Mobile</strong> USA Debuts HTC Touch Pro2 in the U.S., Press Release, T-<strong>Mobile</strong>, July 29, 2009, available at<br />
http://www.t-mobile.com/company/PressReleases_Article.aspx?assetName=Prs_Prs_20090729&title=T-<br />
<strong>Mobile</strong>%20USA%20Debuts%20HTC%20Touch%20Pro2%20in%20the%20U.S.). U.S. providers carrying the<br />
Touch Pro2 identified on HTC’s webpage at http://www.htc.com/us/products.<br />
46 RIM Introduces the BlackBerry Tour Smartphone, Press Release, RIM, June 16, 2009, available at<br />
http://press.rim.com/release.jsp?id=2393. U.S. providers carrying the Tour listed on RIM’s page for the device at<br />
http://na.blackberry.com/eng/devices/blackberrytour/tour_wheretobuy.jsp.
Smartphone Date<br />
Launched<br />
Federal Communications Commission <strong>FCC</strong> 10-81<br />
<strong>Wireless</strong> Service<br />
Provider(s)<br />
Offered<br />
Exclusively at<br />
231<br />
Handset<br />
Manufacturer<br />
Platform/<br />
Operating System<br />
Launch? 1<br />
Touch<br />
Diamond 47<br />
Sept. 2008 Sprint Nextel No HTC Windows <strong>Mobile</strong> 6.1<br />
Verizon <strong>Wireless</strong><br />
Professional<br />
Pure 48 Oct. 2009 AT&T Yes HTC Windows <strong>Mobile</strong> 6.5<br />
Imagio 49 Oct. 2009 Verizon <strong>Wireless</strong> Yes HTC Windows <strong>Mobile</strong> 6.5<br />
Hero 50 Oct. 2009 Cellular South<br />
Sprint Nextel<br />
No HTC Google Android<br />
BlackBerry<br />
Storm 2 51<br />
Oct. 2009 Verizon <strong>Wireless</strong> Yes RIM BlackBerry<br />
N97 Mini 52 Oct. 2009 Unlocked No Nokia Symbian OS 9.4, S60<br />
rel. 5<br />
Tilt 2 53 Oct. 2009 AT&T Yes HTC Windows <strong>Mobile</strong> 6.5<br />
Moment 54 Nov. 2009 Sprint Nextel Yes Samsung Google Android<br />
CLIQ 55 Nov. 2009 T-<strong>Mobile</strong> Yes Motorola Google Android<br />
47 Sprint Gives the Gift of Choice with a Diverse Holiday Lineup for Consumers and Businesses Offering the<br />
Benefits of the Now Network - Speed, Ease of Use, Exclusive Content and Worry-Free Pricing, Press Release,<br />
Sprint Nextel, Sep. 10, 2008, available at http://newsreleases.sprint.com/phoenix.zhtml?c=127149&p=irolnewsArticle_newsroom&ID=1195804&highlight=diamond.<br />
Verizon <strong>Wireless</strong> subsequently offered the Touch<br />
Diamond for its network. See HTC Touch Diamond Available On Nation’s Most Reliable <strong>Wireless</strong> Network, Press<br />
Release, Verizon <strong>Wireless</strong>, Apr. 9, 2009, available at http://news.vzw.com/news/2009/04/pr2009-04-09.html.<br />
48 AT&T and HTC Debut HTC Tilt 2 and HTC Pure Windows Phones, Press Release, AT&T, Oct. 5, 2009, available<br />
at http://www.att.com/gen/press-room?pid=4800&cdvn=news&newsarticleid=27204&mapcode. Exclusivity of<br />
Pure indicated by AT&T’s product page for the device at https://www.wireless.att.com/businesscenter/HTC-<br />
PURE/index.jsp.<br />
49 Imagine The Possibilities For Work And Play With The HTC Imagio Exclusively From Verizon <strong>Wireless</strong>, Press<br />
Release, Verizon <strong>Wireless</strong>, Oct. 1, 2009, available at http://news.vzw.com/news/2009/10/pr2009-09-30b.html<br />
(indicates exclusivity).<br />
50 The Innovation and Openness of a True <strong>Mobile</strong> Internet Experience Coming Soon to America’s Most Dependable<br />
3G Network from Sprint on HTC Hero with Google, Press Release, Sprint Nextel, Sep. 3, 2009, available at<br />
http://newsreleases.sprint.com/phoenix.zhtml?c=127149&p=irol-newsArticle_newsroom&ID=1327394&highlight=.<br />
Cellular South subsequently began offering the Hero on its network, as indicated at<br />
https://www.cellularsouth.com/cscommerce/products/phones/product_phone_detail.jsp?navAction=push&navCount<br />
=0&id=prod26560022.<br />
51 A Powerful New Storm Rolls Onto Verizon <strong>Wireless</strong>’ Network on Oct. 28, Press Release, RIM, Oct. 26, 2009,<br />
available at http://press.rim.com/release.jsp?id=2590. U.S. exclusivity of Storm2 indicated on RIM’s page for the<br />
device at http://na.blackberry.com/eng/devices/blackberrystorm/storm_wheretobuy.jsp (Verizon <strong>Wireless</strong> only U.S.<br />
provider listed).<br />
52 Nokia N97 gets even better with a new software update; Nokia N97 mini now available in stores, Press Release,<br />
Nokia, Oct. 28, 2009, available at http://www.nokia.com/press/press-releases/showpressrelease?newsid=1350820.<br />
53 AT&T and HTC Debut HTC Tilt 2 and HTC Pure Windows Phones, Press Release, AT&T Oct. 5, 2009, available<br />
at http://www.att.com/gen/press-room?pid=4800&cdvn=news&newsarticleid=27204&mapcode. Exclusivity of<br />
Tilt2 indicated by AT&T’s product page for the device at https://www.wireless.att.com/businesscenter/HTC-Tilt-<br />
2/index.jsp.<br />
54 Samsung’s First Android-Powered Phone, Samsung Moment with Google, Coming Soon to America’s Most<br />
Dependable 3G Network, Press Release, Sprint Nextel, Oct. 7, 2009, available at<br />
http://newsreleases.sprint.com/phoenix.zhtml?c=127149&p=irol-newsArticle_newsroom&ID=1339737&highlight.<br />
Exclusivity indicated by the Moment’s fact sheet available at http://phx.corporateir.net/External.File?item=UGFyZW50SUQ9MTgwMzZ8Q2hpbGRJRD0tMXxUeXBlPTM=&t=1.
Smartphone Date<br />
Launched<br />
Federal Communications Commission <strong>FCC</strong> 10-81<br />
<strong>Wireless</strong> Service<br />
Provider(s)<br />
Offered<br />
Exclusively at<br />
Launch? 1<br />
232<br />
Handset<br />
Manufacturer<br />
Platform/<br />
Operating System<br />
DROID 56 Nov. 2009 Verizon <strong>Wireless</strong> Yes Motorola Google Android<br />
DROID Eris 57 Nov. 2009 Verizon <strong>Wireless</strong> Yes HTC Google Android<br />
Pixi 58 Nov. 2009 Sprint Nextel Yes Palm Palm OS<br />
E72 59 Nov. 2009 Unlocked No Nokia Symbian OS 9.3, S60<br />
v. 3.2 UI<br />
N900 60 Nov. 2009 Unlocked No Nokia Maemo 5 Linux<br />
Behold II 61 Nov. 2009 T-<strong>Mobile</strong> Yes Samsung Google Android<br />
BlackBerry<br />
Curve 8530 62<br />
Nov. 2009 Sprint Nextel No RIM BlackBerry<br />
Verizon <strong>Wireless</strong><br />
Alltel<br />
US Cellular<br />
BlackBerry<br />
Bold 9700 63<br />
Nov. 2009 AT&T<br />
No RIM Blackberry<br />
T-<strong>Mobile</strong><br />
Ipaq 64 Nov. 2009 AT&T Yes HP Windows <strong>Mobile</strong> 6.5<br />
(Continued from previous page)<br />
55<br />
T-<strong>Mobile</strong> USA Launches Motorola CLIQ with MOTOBLUR In Stores Beginning Today, Press Release, T-<strong>Mobile</strong>,<br />
Nov. 2, 2009, available at http://www.tmobile.com/company/PressReleases_Article.aspx?assetName=Prs_Prs_20091102&title=T-<br />
<strong>Mobile</strong>%20USA%20Launches%20Motorola%20CLIQ%20with%20MOTOBLUR%20In%20Stores%20Beginning<br />
%20Today (indicates exclusivity).<br />
56 Hello Humans: Droid by Motorola Arrives Next Week, Press Release, Verizon <strong>Wireless</strong>, Oct. 28, 2009, available<br />
at http://news.vzw.com/news/2009/10/pr2009-10-27.html (indicates exclusivity).<br />
57 Bring An Android Device Home For The Holidays With DROID ERIS By HTC, Exclusively From Verizon<br />
<strong>Wireless</strong>, Press Release, Verizon <strong>Wireless</strong>, Nov. 5, 2009, available at http://news.vzw.com/news/2009/11/pr2009-<br />
11-05.html (indicates exclusivity).<br />
58 Palm Pixi Available Nov. 15 for Just $99.99 Exclusively from Sprint, Press Release, Sprint Nextel, Oct. 26, 2009,<br />
available at http://newsreleases.sprint.com/phoenix.zhtml?c=127149&p=irolnewsArticle_newsroom&ID=1346184&highlight=pixi<br />
(indicates exclusivity).<br />
59<br />
Nokia E72 in stores now, Press Release, Nokia, Nov. 16, 2009, available at http://www.nokia.com/press/pressreleases/showpressrelease?newsid=1355243.<br />
60 The Nokia N900 is now available to US consumers, Press Release, Nokia, Nov. 18, 2009, available at<br />
http://www.nokia.com/press/press-releases/showpressrelease?newsid=1355897.<br />
61<br />
T-<strong>Mobile</strong> USA Launches the Samsung Behold II on November 18, Press Release, T-<strong>Mobile</strong>, Nov. 13, 2009,<br />
available at http://www.tmobile.com/company/PressReleases_Article.aspx?assetName=Prs_Prs_20091113&title=T-<br />
<strong>Mobile</strong>%20USA%20Launches%20the%20Samsung%20Behold%20II%20on%20November%2018 (indicates<br />
exclusivity).<br />
62 Verizon <strong>Wireless</strong> Introduces the BlackBerry Curve 8530 Smartphone, Press Release, RIM, Nov. 5, 2009,<br />
available at http://press.rim.com/release.jsp?id=2686. U.S. providers carrying the Curve 8530 listed on RIM’s page<br />
at http://na.blackberry.com/eng/devices/blackberrycurve8500.<br />
63 RIM Introduces the New BlackBerry Bold 9700 Smartphone, Press Release, RIM, Oct. 21, 2009, available at<br />
http://press.rim.com/release.jsp?id=2567. U.S. providers carrying the Bold 9700 listed on RIM’s page at<br />
http://na.blackberry.com/eng/devices/blackberrybold9700/bold_wheretobuy.jsp.<br />
64 AT&T and HP Introduce HP Ipaq Glisten, 3G World Phone for <strong>Mobile</strong> Professionals, Press Release, AT&T,<br />
Nov. 24, 2009, available at http://www.att.com/gen/pressroom?pid=4800&cdvn=news&newsarticleid=27587&mapcode.<br />
U.S. exclusivity of the iPaq through AT&T<br />
indicated at http://www.wireless.att.com/businesscenter/hp-ipaq-glisten/index.jsp.
Smartphone Date<br />
Launched<br />
Edition 67<br />
Federal Communications Commission <strong>FCC</strong> 10-81<br />
<strong>Wireless</strong> Service<br />
Provider(s)<br />
Offered<br />
Exclusively at<br />
Launch? 1<br />
233<br />
Handset<br />
Manufacturer<br />
Platform/<br />
Operating System<br />
Omnia 2 65 Dec. 2009 Verizon <strong>Wireless</strong> Yes Samsung Windows <strong>Mobile</strong> 6.5<br />
eXpo 66 Dec. 2009 AT&T Yes LG Google Android<br />
5800<br />
Dec. 2009 Unlocked No Nokia Symbian OS 9.4, S60<br />
Navigation<br />
rel. 5<br />
Nexus One 68 Jan. 2010 T-<strong>Mobile</strong> (locked<br />
or unlocked)<br />
Unlocked (other<br />
GSM providers)<br />
No HTC Google Android<br />
65 Verizon <strong>Wireless</strong> Announces The Availability Of The Samsung Omnia II, Press Release, Verizon <strong>Wireless</strong>, Nov.<br />
23, 2009, available at http://news.vzw.com/news/2009/11/pr2009-11-23a.html. U.S. exclusivity of the Omnia II<br />
through Verizon <strong>Wireless</strong> indicated at http://phones.verizonwireless.com/samsung/omnia2.<br />
66 AT&T and LG <strong>Mobile</strong> Phones Announce the First 1 GHz Smartphone in the United States, the LG Expo, Press<br />
Release, AT&T, Nov. 30, 2009, available at http://www.att.com/gen/pressroom?pid=4800&cdvn=news&newsarticleid=27621&mapcode<br />
(indicates exclusivity).<br />
67 Over the river and through the woods, Nokia knows the way, Press Release, Nokia, Dec. 8, 2009, available at<br />
http://www.nokia.com/press/press-releases/showpressrelease?newsid=1359877.<br />
68 Google Offers New Model for Consumers to Buy a <strong>Mobile</strong> Phone, Press Release, Google, Jan. 5, 2010, available<br />
at http://www.google.com/intl/en/press/pressrel/20100105_phone.html. The device must be purchased through<br />
Google’s webstore at http://www.google.com/phone. It can be purchased either unlocked for use on any GSM<br />
network at a higher cost ($529) or for a significantly reduced amount ($179) if bundled with a two-year T-<strong>Mobile</strong><br />
service contract.
Federal Communications Commission <strong>FCC</strong> 10-81<br />
Table C-6: <strong>Mobile</strong> <strong>Wireless</strong> High-Speed Capable Devices and Subscribers by State<br />
State <strong>Mobile</strong> <strong>Wireless</strong> High-Speed Capable Devices <strong>Mobile</strong> <strong>Wireless</strong> High-Speed Subscribers<br />
Alaska 99,263 43,073<br />
Alabama 970,480 281,221<br />
Arkansas 547,605 178,042<br />
Arizona 1,809,386 522,283<br />
California 12,011,071 3,493,995<br />
Colorado 1,523,199 460,860<br />
Connecticut 1,223,598 337,695<br />
District of Columbia 316,042 180,733<br />
Delaware 311,648 77,462<br />
Florida 4,625,734 1,542,128<br />
Geogria 2,522,273 773,067<br />
Guam * *<br />
Hawaii 421,662 145,919<br />
Iowa 575,653 115,476<br />
Idaho 502,251 133,160<br />
Illinois 3,405,338 1,057,326<br />
Indiana 1,623,844 383,545<br />
Kansas 731,369 207,224<br />
Kentucky 671,274 246,419<br />
Louisiana 1,026,180 395,066<br />
Massachusetts 2,117,106 565,699<br />
Maryland 2,011,551 595,144<br />
Maine 166,934 39,589<br />
Michigan 2,379,563 605,567<br />
Minnesota 1,337,231 357,180<br />
Missouri 1,191,487 364,192<br />
Northern Mariana Islands * *<br />
Mississippi 412,925 142,010<br />
Montana * *<br />
North Carolina 2,433,544 701,010<br />
North Dakota 240,813 40,691<br />
Nebraska 532,865 151,973<br />
New Hampshire 401,763 84,607<br />
New Jersey 3,849,463 903,269<br />
New Mexico 536,659 140,604<br />
Nevada 786,593 256,832<br />
New York 5,864,099 1,708,429<br />
Ohio 3,343,239 816,038<br />
Oklahoma 643,785 239,088<br />
Oregon 1,010,635 267,457<br />
Pennsylvania 3,657,848 871,477<br />
Puerto Rico 383,990 126,088<br />
Rhode Island 295,152 80,601<br />
South Carolina 1,185,162 313,073<br />
South Dakota * *<br />
Tennessee 1,754,405 452,014<br />
234
Federal Communications Commission <strong>FCC</strong> 10-81<br />
State <strong>Mobile</strong> <strong>Wireless</strong> High-Speed Capable Devices <strong>Mobile</strong> <strong>Wireless</strong> High-Speed Subscribers<br />
Texas 6,082,603 2,348,605<br />
Utah 749,847 189,217<br />
Virginia 2,802,441 900,735<br />
Virgin Islands * *<br />
Vermont * *<br />
Washington 2,219,293 681,902<br />
Wisconsin 1,184,522 306,326<br />
West Virginia 258,231 80,118<br />
Wyoming 221,208 42,695<br />
TOTAL 85,765,327 25,117,013<br />
Source: High-Speed Services for Internet Access: Status as of December 31, 2008, Federal Communications<br />
Commission, February 2010 (Table 14: High-Speed Connections by Technology by State as of December 31, 2008);<br />
Form 477 filings with the Commission.<br />
Notes:<br />
* = Data withheld to maintain form confidentiality.<br />
** The reported number of business and residential subscribers whose mobile devices are capable of sending or<br />
receiving data at information transfer rates exceeding 200 kbps in at least one direction.<br />
235
Federal Communications Commission <strong>FCC</strong> 10-81<br />
Table C-7: <strong>Mobile</strong> <strong>Wireless</strong> Resellers and <strong>Mobile</strong> Virtual Network Operators (MVNOs)<br />
Name Number of Subscribers<br />
7-11 Speak Out Not Available<br />
Advanced Communications Technology Not Available<br />
Air Voice <strong>Wireless</strong> AT&T Not Available<br />
AirLink <strong>Mobile</strong> Not Available<br />
Albany Mutual Tel. Association; Not Available<br />
Beaver Creek Cooperative Telephone Company Not Available<br />
Beyond <strong>Mobile</strong> 50,203 total customers as of 12/31/09*<br />
Bratz <strong>Mobile</strong> Not Available<br />
Camellia Communications Not Available<br />
CenCom, Inc. Not Available<br />
Champaign Not Available<br />
Christensen Communications Not Available<br />
Circle K Stores Inc Not Available<br />
Consolidated Communications Network, Inc. More than 20,000*<br />
Consumer Cellular, Inc Not Available<br />
Credo <strong>Mobile</strong>, Inc. Not Available<br />
DFT Local Service Corporation Not Available<br />
eCall Plus Not Available<br />
En-Tel Not Available<br />
Firefly Communications, Inc. Not Available<br />
Garden Valley Telephone Co. Not Available<br />
Germantown Cellular Not Available<br />
Hawaiian Telcom Services Company, Inc. Not Available<br />
Hayneville Telephone Company, Inc. Not Available<br />
Home TeleNetworks Not Available<br />
Hood Canal Not Available<br />
HTC Not Available<br />
IdeaOne Not Available<br />
Jitterbug Not Available<br />
Kennebec Telephone Co. Not Available<br />
KMTelecom; Not Available<br />
Lakedale Telephone Company Not Available<br />
Liberty <strong>Wireless</strong> Not Available<br />
Lightyear Network Solutions, LLC More than 60,000*<br />
Locus Telecommunications More than 300,000<br />
Movida Not Available<br />
Nehalem TeleCommunications, Inc. Not Available<br />
New Ulm Telecom Not Available<br />
One Communications Corp. More than 160,000 businesses*<br />
Otter Tail Telcom Not Available<br />
Page Plus Cellular Not Available<br />
PemTel <strong>Wireless</strong> Not Available<br />
Pend Oreille Telephone Company Not Available<br />
PlatinumTel <strong>Wireless</strong> Not Available<br />
Randolph Telephone Company Not Available<br />
Red River Rural Telephone Association Not Available<br />
Silverado Not Available<br />
Sleepy Eye Telephone Company Not Available<br />
STI <strong>Mobile</strong> Not Available<br />
Total Call <strong>Mobile</strong> Not Available<br />
TouchTone Not Available<br />
236
Federal Communications Commission <strong>FCC</strong> 10-81<br />
Tracfone. 14.4 million as of Dec. 2009<br />
Tuyo <strong>Mobile</strong> Not Available<br />
Venture Communications Coop. Not Available<br />
Virgin <strong>Mobile</strong> USA Not Available<br />
Warwick Not Available<br />
Winn Telephone Company Not Available<br />
Yadkin Valley Telephone Not Available<br />
Zapp Unlimited LLC Not Available<br />
Zone Telecom, Inc. Not Available<br />
* According to company website, the figure appears to be customers for all services, not just wireless subscribers.<br />
237