International Journal of Pharma Research & Review, August 2012; 1 ...
International Journal of Pharma Research & Review, August 2012; 1 ...
International Journal of Pharma Research & Review, August 2012; 1 ...

Create successful ePaper yourself
Turn your PDF publications into a flip-book with our unique Google optimized e-Paper software.
Design-Expert® S<strong>of</strong>tware<br />
Factor Coding: Actual<br />
Q4<br />
Design points above predicted value<br />
Design points below predicted value<br />
X1 = A: Gum concentration<br />
X2 = B: Type <strong>of</strong> diluent<br />
<strong>International</strong> <strong>Journal</strong> <strong>of</strong> <strong>Pharma</strong> <strong>Research</strong> & <strong>Review</strong>, <strong>August</strong> <strong>2012</strong>; 1(4):12-20<br />
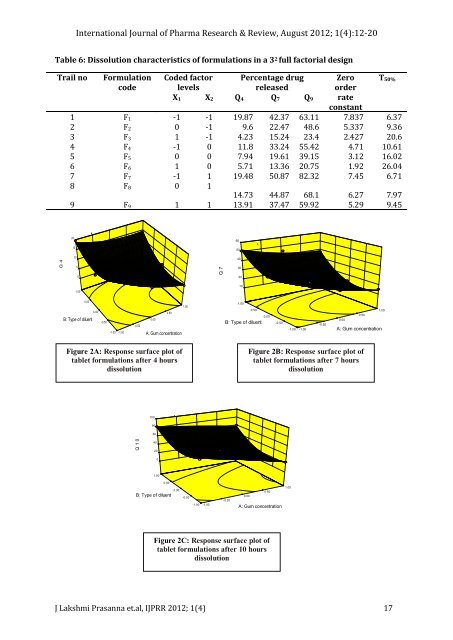
Table 6: Dissolution characteristics <strong>of</strong> formulations in a 3 2 full factorial design<br />
Trail no Formulation<br />
code<br />
Q 4<br />
20<br />
15<br />
10<br />
5<br />
0<br />
1.00<br />
0.50<br />
B: Type <strong>of</strong> diluent<br />
0.00<br />
-0.50<br />
Design-Expert® S<strong>of</strong>tware<br />
Factor Coding: Actual<br />
Q7<br />
Design points above predicted value<br />
Design points below predicted value<br />
X1 = A: Gum concentration<br />
X2 = B: Type <strong>of</strong> diluent<br />
Figure 2A: Response surface plot <strong>of</strong><br />
tablet formulations after 4 hours<br />
dissolution<br />
Design-Expert® S<strong>of</strong>tware<br />
Factor Coding: Actual<br />
Q10<br />
Design points above predicted value<br />
Design points below predicted value<br />
X1 = A: Gum concentration<br />
X2 = B: Type <strong>of</strong> diluent<br />
-1.00 -1.00<br />
Q 1 0<br />
-0.50<br />
0.00<br />
0.50<br />
A: Gum concentration<br />
100<br />
80<br />
60<br />
40<br />
20<br />
1.00<br />
0.50<br />
B: Type <strong>of</strong> diluent<br />
0<br />
Coded factor<br />
levels<br />
0.00<br />
1.00<br />
-0.50<br />
-1.00 -1.00<br />
Q 7<br />
Figure 2B: Response surface plot <strong>of</strong><br />
tablet formulations after 7 hours<br />
dissolution<br />
J Lakshmi Prasanna et.al, IJPRR <strong>2012</strong>; 1(4) 17<br />
60<br />
50<br />
40<br />
30<br />
20<br />
10<br />
1.00<br />
0.50<br />
B: Type <strong>of</strong> diluent<br />
-0.50<br />
0.00<br />
0.00<br />
0.50<br />
-0.50<br />
A: Gum concentration<br />
Figure 2C: Response surface plot <strong>of</strong><br />
tablet formulations after 10 hours<br />
dissolution<br />
Percentage drug<br />
released<br />
X1 X2 Q4 Q7 Q9<br />
1.00<br />
-1.00<br />
-1.00<br />
-0.50<br />
Zero<br />
order<br />
rate<br />
constant<br />
1 F1 -1 -1 19.87 42.37 63.11 7.837 6.37<br />
2 F2 0 -1 9.6 22.47 48.6 5.337 9.36<br />
3 F3 1 -1 4.23 15.24 23.4 2.427 20.6<br />
4 F4 -1 0 11.8 33.24 55.42 4.71 10.61<br />
5 F5 0 0 7.94 19.61 39.15 3.12 16.02<br />
6 F6 1 0 5.71 13.36 20.75 1.92 26.04<br />
7 F7 -1 1 19.48 50.87 82.32 7.45 6.71<br />
8 F8 0 1<br />
14.73 44.87 68.1 6.27 7.97<br />
9 F9 1 1 13.91 37.47 59.92 5.29 9.45<br />
0.00<br />
0.50<br />
1.00<br />
A: Gum concentration<br />
T50%