Analysis of evolutionary co-variation of amino acid positions to ...
Analysis of evolutionary co-variation of amino acid positions to ...
Analysis of evolutionary co-variation of amino acid positions to ...

You also want an ePaper? Increase the reach of your titles
YUMPU automatically turns print PDFs into web optimized ePapers that Google loves.
UPTEC X06 043<br />
Examensarbete 20 p<br />
Ok<strong>to</strong>ber 2006<br />
<strong>Analysis</strong> <strong>of</strong> <strong>evolutionary</strong> <strong>co</strong>-<strong>variation</strong><br />
<strong>of</strong> <strong>amino</strong> <strong>acid</strong> <strong>positions</strong> <strong>to</strong> dis<strong>co</strong>ver<br />
features typical <strong>of</strong> allergens<br />
Jonas Hagberg
Bioinformatics Engineering Program<br />
Uppsala University School <strong>of</strong> Engineering<br />
UPTEC X 06 0043 Date <strong>of</strong> issue 2006-10<br />
Author<br />
Jonas Hagberg<br />
Title (English)<br />
<strong>Analysis</strong> <strong>of</strong> <strong>evolutionary</strong> <strong>co</strong>-<strong>variation</strong> <strong>of</strong> <strong>amino</strong> <strong>acid</strong> <strong>positions</strong> <strong>to</strong><br />
dis<strong>co</strong>ver features typical <strong>of</strong> allergens<br />
Title (Swedish)<br />
Abstract<br />
In this study two protein families, both holding allergens and non-allergens, were investigated<br />
with regard <strong>to</strong> <strong>amino</strong> <strong>acid</strong> sequence features that may be attributed <strong>to</strong> allergenicity. With this<br />
purpose in mind, various <strong>co</strong>mputational biology operations were <strong>co</strong>nducted, e.g. investigation<br />
on pair-wise <strong>co</strong>-<strong>variation</strong> <strong>of</strong> <strong>amino</strong> <strong>acid</strong>s across the sequences. Intriguing patterns <strong>of</strong> <strong>co</strong>varying<br />
pairs in and near known IgE epi<strong>to</strong>pes were seen. The findings show that <strong>evolutionary</strong><br />
<strong>co</strong>-<strong>variation</strong> analysis is a powerful method that can give valuable information on protein<br />
segments <strong>of</strong> potential importance <strong>to</strong> allergenicity.<br />
Keywords<br />
Allergy, Evolutionary <strong>co</strong>-<strong>variation</strong>, ELSC<br />
Supervisors<br />
Ulf Hammerling and Daniel Soeria-Atmadja<br />
Department <strong>of</strong> Toxi<strong>co</strong>logy, National Food Administration<br />
Scientific reviewer<br />
Mats Gustafsson<br />
Department <strong>of</strong> Engineering Sciences, Uppsala University<br />
Project name<br />
Language<br />
ISSN 1401-2138<br />
English<br />
Sponsors<br />
Security<br />
Classification<br />
Supplementary bibliographical information Pages<br />
40<br />
Biology Education Centre Biomedical Center Husargatan 3 Uppsala<br />
Box 592 S-75124 Uppsala Tel +46 (0)18 4710000 Fax +46 (0)18 555217
<strong>Analysis</strong> <strong>of</strong> <strong>evolutionary</strong> <strong>co</strong>-<strong>variation</strong> <strong>of</strong> <strong>amino</strong> <strong>acid</strong><br />
<strong>positions</strong> <strong>to</strong> dis<strong>co</strong>ver features typical <strong>of</strong> allergens<br />
Jonas Hagberg<br />
hagberg.jonas@gmail.<strong>co</strong>m<br />
November 10, 2006<br />
Sammanfattning<br />
Under senare ˚ar har förekomsten av allergier ökat, främst i västvärlden. Detta orsakar<br />
s<strong>to</strong>r belastning p˚a hälsov˚arden. Allergi är relaterat till exponering av en grupp<br />
ämnen, benämda allergener, vilka huvudsakligen utgörs av proteiner. Allergener finns i<br />
vitt spridda ämnen s˚asom livsmedel, pollen, kvalster och pälsdjur.<br />
Syftet med detta projekt är att undersöka tv˚a proteinfamiljer, b˚ada inneh˚allande kända<br />
allergena och icke-allergena proteiner, för att försöka finna allergen-specifika särdrag i<br />
<strong>amino</strong>syrasekvenserna.<br />
Flera bioinformatiska analysme<strong>to</strong>der har använts, s˚asom multipel sekvensanalys, fylogenetisk<br />
analys, och analys av evolutionärt samvarierade parvisa positioner i <strong>amino</strong>syrasekvenserna.<br />
Den sistnämnda me<strong>to</strong>den har möjliggjort p˚avisande av intressanta relationer mellan samvarierade<br />
positioner hos vissa allergena proteinsekvenser och kända omr˚aden där immunoglobulin<br />
E binder. Resultaten visar att analys av evolutionärt samvarierande positioner kan ge<br />
värdefull information, vilken kan vara viktig för först˚aelsen av allergenicitet, hos proteiner.<br />
Examensarbete 20p i Civilingenjörsprogrammet för Bioinformatik<br />
Uppsala universitet Ok<strong>to</strong>ber 2006
CONTENTS 3<br />
Contents<br />
1 Introduction 7<br />
2 Background 7<br />
2.1 Allergy . . . . . . . . . . . . . . . . . . . . . . . . . . . . . . . . . . . . . . 7<br />
2.1.1 What are the mechanisms behind allergy . . . . . . . . . . . . . . . 8<br />
2.2 Genetically Modified Organism - GMO . . . . . . . . . . . . . . . . . . . . 9<br />
2.3 Protein families . . . . . . . . . . . . . . . . . . . . . . . . . . . . . . . . . 9<br />
2.3.1 Tropomyosin . . . . . . . . . . . . . . . . . . . . . . . . . . . . . . 9<br />
2.3.2 Parvalbumin . . . . . . . . . . . . . . . . . . . . . . . . . . . . . . . 11<br />
2.4 Multiple Sequence Alignment - MSA . . . . . . . . . . . . . . . . . . . . . 12<br />
2.5 Phylogenetic tree . . . . . . . . . . . . . . . . . . . . . . . . . . . . . . . . 12<br />
2.6 <strong>Analysis</strong> <strong>of</strong> Evolutionary <strong>co</strong>-<strong>variation</strong> . . . . . . . . . . . . . . . . . . . . . 13<br />
2.6.1 Explicit Likelihood <strong>of</strong> Subset Co-<strong>variation</strong> - ELSC . . . . . . . . . . 14<br />
2.7 WRABL - Groups <strong>of</strong> Amino Acid . . . . . . . . . . . . . . . . . . . . . . . 15<br />
2.8 Protein structure prediction . . . . . . . . . . . . . . . . . . . . . . . . . . 17<br />
3 Aims 17<br />
4 Materials and Methods 18<br />
4.1 Datasets . . . . . . . . . . . . . . . . . . . . . . . . . . . . . . . . . . . . . 18<br />
4.1.1 Tropomyosin . . . . . . . . . . . . . . . . . . . . . . . . . . . . . . 18<br />
4.1.2 Parvalbumin . . . . . . . . . . . . . . . . . . . . . . . . . . . . . . . 18<br />
4.2 Bioinformatic methods . . . . . . . . . . . . . . . . . . . . . . . . . . . . . 19<br />
4.2.1 Kalign . . . . . . . . . . . . . . . . . . . . . . . . . . . . . . . . . . 19<br />
4.2.2 Phylogenies by Maximum Likelihood - Phyml . . . . . . . . . . . . 20<br />
4.3 Creation <strong>of</strong> MSAs and Phylogenetic trees . . . . . . . . . . . . . . . . . . . 20<br />
4.4 Computer aid . . . . . . . . . . . . . . . . . . . . . . . . . . . . . . . . . . 21<br />
4.4.1 Computer Cluster . . . . . . . . . . . . . . . . . . . . . . . . . . . . 21<br />
4.5 Procedures . . . . . . . . . . . . . . . . . . . . . . . . . . . . . . . . . . . . 22<br />
4.5.1 20/80-method . . . . . . . . . . . . . . . . . . . . . . . . . . . . . . 22<br />
4.5.2 ELSC . . . . . . . . . . . . . . . . . . . . . . . . . . . . . . . . . . 22<br />
4.5.3 ELSC - sample-size-test . . . . . . . . . . . . . . . . . . . . . . . . 23<br />
4.5.4 WRABL . . . . . . . . . . . . . . . . . . . . . . . . . . . . . . . . . 23<br />
5 Results 24<br />
5.1 Phylogenetic trees . . . . . . . . . . . . . . . . . . . . . . . . . . . . . . . . 24<br />
5.2 20/80-method . . . . . . . . . . . . . . . . . . . . . . . . . . . . . . . . . . 26<br />
5.3 ELSC . . . . . . . . . . . . . . . . . . . . . . . . . . . . . . . . . . . . . . 26<br />
5.3.1 ELSC - sample-size-test . . . . . . . . . . . . . . . . . . . . . . . . 26<br />
5.3.2 Tropomyosin . . . . . . . . . . . . . . . . . . . . . . . . . . . . . . 27<br />
5.3.3 Parvalbumin . . . . . . . . . . . . . . . . . . . . . . . . . . . . . . . 29<br />
Jonas Hagberg November 10, 2006
CONTENTS 5<br />
5.4 ELSC + WRABL . . . . . . . . . . . . . . . . . . . . . . . . . . . . . . . . 30<br />
5.5 Structure prediction <strong>of</strong> mutant Pen a 1 . . . . . . . . . . . . . . . . . . . . 31<br />
6 Discussion 32<br />
6.1 Robustness <strong>of</strong> ELSC . . . . . . . . . . . . . . . . . . . . . . . . . . . . . . 32<br />
6.2 In sili<strong>co</strong> analysis <strong>of</strong> tropomyosins . . . . . . . . . . . . . . . . . . . . . . . 33<br />
6.2.1 Phylogeny . . . . . . . . . . . . . . . . . . . . . . . . . . . . . . . . 33<br />
6.2.2 ELSC . . . . . . . . . . . . . . . . . . . . . . . . . . . . . . . . . . 33<br />
6.2.3 Structure prediction no good at all . . . . . . . . . . . . . . . . . . 34<br />
6.3 In sili<strong>co</strong> analysis <strong>of</strong> parvalbumins . . . . . . . . . . . . . . . . . . . . . . . 34<br />
6.3.1 Phylogeny . . . . . . . . . . . . . . . . . . . . . . . . . . . . . . . . 34<br />
6.3.2 ELSC . . . . . . . . . . . . . . . . . . . . . . . . . . . . . . . . . . 35<br />
6.4 ELSC + WRABL . . . . . . . . . . . . . . . . . . . . . . . . . . . . . . . . 35<br />
7 Acknowledgments 36<br />
7 References 37<br />
Jonas Hagberg November 10, 2006
1. Introduction 7<br />
1 Introduction<br />
The occurrence <strong>of</strong> allergy increases in the Western society and is a great health-care <strong>co</strong>ncern.<br />
Many environmental fac<strong>to</strong>rs are believed <strong>to</strong> <strong>co</strong>ntribute <strong>to</strong> this increase in the prevalence<br />
<strong>of</strong> allergic diseases, such as urban living, Western life-style, reduced breast-feeding,<br />
allergen exposure, smoking, smaller families, fewer childhood infections and higher hygiene<br />
standards. Allergens are almost exclusively proteins and why they induce allergic responses<br />
is not yet fully unders<strong>to</strong>od, although, much progress has been made in recent years. Unintentional<br />
introduction <strong>of</strong> an allergen in genetically modified organisms (GMO) is a key<br />
aspect <strong>to</strong> <strong>co</strong>nsider in the risk assessment <strong>of</strong> new GMOs. Several bioinformatics methods<br />
that can predict protein allergenicity with reasonable accuracy, using a proteins Amino<br />
Acid (AA)-sequence, have been reported [1, 2, 3]. None <strong>of</strong> them, however, in<strong>co</strong>rporate any<br />
information on protein structure.<br />
In this study two protein families, both holding allergens and non-allergens, were investigated<br />
with regard <strong>to</strong> <strong>amino</strong> <strong>acid</strong> sequence features that may be attributed <strong>to</strong> allergenicity.<br />
With this purpose in mind, various <strong>co</strong>mputational biology operations were <strong>co</strong>nducted,<br />
broadly involving multiple sequence alignment (MSA), phylogenetic analysis and investigating<br />
on pair-wise <strong>co</strong>-<strong>variation</strong> <strong>of</strong> <strong>amino</strong> <strong>acid</strong>s across the sequences. A clear <strong>co</strong>rrelation<br />
in the tropomyosin-family between known IgE epi<strong>to</strong>pes and dis<strong>co</strong>vered position is established.<br />
The findings in this study show that <strong>evolutionary</strong> <strong>co</strong>-<strong>variation</strong> analysis is a powerful<br />
method that can give valuable information on protein segments <strong>of</strong> potential importance <strong>to</strong><br />
allergenicity.<br />
In section 2 <strong>of</strong> this report the allergy <strong>co</strong>ncept is introduced and the risk <strong>of</strong> inadvertently<br />
introducing allergens in GMOs are presented. Moreover, information about protein<br />
families and most <strong>of</strong> the algorithms and bioinformatic methods used in this project are<br />
explained. Section 3 presents the aims <strong>of</strong> the project. In the materials and method part<br />
in section 4 information and creation <strong>of</strong> datasets used in this project are presented and<br />
several procedures and <strong>co</strong>mputer aid used <strong>to</strong> achieve the aims <strong>of</strong> the projects are outlined.<br />
Section 5 presents the results and, finally, the results are discussed in section 6.<br />
2 Background<br />
2.1 Allergy<br />
Allergy is a fairly recently described disease. A hundred years ago the term allergy had<br />
not yet been defined, and typical symp<strong>to</strong>ms <strong>of</strong> allergic disease, such as hay-fever, asthma<br />
and food in<strong>to</strong>lerance, were rarely reported. In 1906 the term allergy was introduced by<br />
Clemens Von Pirquet and during the twentieth century allergy has emerged as a major<br />
global problem and the fraction <strong>of</strong> people affected has lately mounted <strong>to</strong> 20-25% <strong>of</strong> the<br />
population in some industrial nations [4].<br />
Food allergens are mainly found in eight groups: milk, fish, eggs, crustaceans, peanuts,<br />
Jonas Hagberg November 10, 2006
8 2.1 Allergy<br />
soybeans, tree nuts, and wheat. These eight foods are reported <strong>to</strong> <strong>co</strong>ver more than 90 %<br />
<strong>of</strong> all IgE (see section.2.1.1) mediated food allergies [5].<br />
2.1.1 What are the mechanisms behind allergy<br />
Allergy can be defined as an abnormal immunological reaction <strong>to</strong> certain exogenous substances,<br />
typically proteins. A person who is allergic develops symp<strong>to</strong>ms when exposed<br />
<strong>to</strong> such, otherwise harmless, substances called allergens. Allergens can be divided in<strong>to</strong><br />
two groups, major and minor allergens. They are designated major if more than 50%<br />
<strong>of</strong> patients relative <strong>to</strong> the particular source have the <strong>co</strong>rresponding allergen-specific IgEs,<br />
otherwise as minor [6]. IgE molecules re<strong>co</strong>gnize particular areas on the surface <strong>of</strong> proteins,<br />
<strong>co</strong>mmonly named B-cell epi<strong>to</strong>pes [7].<br />
allergen<br />
protein<br />
IgeR<br />
IgE<br />
aggregation<br />
Mast cell / basophil<br />
signals<br />
Nucleus<br />
Cy<strong>to</strong>plasm<br />
Leukotrienes, prostaglandins<br />
synthesized and relesed<br />
Immediate-type<br />
hypersensitivity<br />
reaction<br />
Degranulation:<br />
histamines released<br />
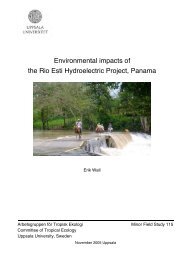
Figure 1: A sensitized mast cell with two IgEs on its surface has bound <strong>to</strong> an allergen protein. The bound<br />
between IgE and allergen is called cross-linking and is a necessity for an allergic response, and triggers<br />
degranulation <strong>of</strong> mast cells which leads <strong>to</strong> the release <strong>of</strong> inflaming media<strong>to</strong>rs such as histamine etc.<br />
Allergic people, who are sensitized <strong>to</strong> allergic proteins, have immunoglobulin E (IgE)<br />
bound <strong>to</strong> mast cells or basophils. When such mast cell-IgE antibody <strong>co</strong>mplexes react<br />
with an allergen the release <strong>of</strong> media<strong>to</strong>rs, such as histamine, leukotrines, prostaglandins,<br />
cy<strong>to</strong>kines and others is triggered (see figure 1 for an schematic view <strong>of</strong> an allergic reaction).<br />
The media<strong>to</strong>rs then induce allergic symp<strong>to</strong>ms in various target organs, typically the skin,<br />
the nose, the eyes, the chest etc. This kind <strong>of</strong> reactions are generally known as a type I<br />
hypersensitivity responses that occur due <strong>to</strong> an inappropriate immunoglobulin E synthesis.<br />
Hypersensitivity reactions can be divided in<strong>to</strong> four types: type I through IV. This study is<br />
focusing on type I hypersensitivity, i.e. the IgE mediated reactions, and how they interact<br />
with protein molecules. They should not be <strong>co</strong>nfused with other sensitivity reactions, such<br />
as lac<strong>to</strong>se or gluten in<strong>to</strong>lerance. The structure <strong>of</strong> a protein is <strong>of</strong> great importance for a<br />
proteins allergenic ability/potency and is an important background <strong>to</strong> the study.<br />
November 10, 2006 Jonas Hagberg
2.2 Genetically Modified Organism - GMO 9<br />
2.2 Genetically Modified Organism - GMO<br />
A genetically modified organism harbours genetic material, which has been altered using<br />
various molecular genetic techniques. An outline <strong>of</strong> these techniques is beyond the s<strong>co</strong>pe<br />
<strong>of</strong> this report, but the methodology can be used <strong>to</strong> introduce highly specific changes <strong>of</strong><br />
the phenotype. This is <strong>co</strong>mmonly achieved by altering expression levels <strong>of</strong> certain proteins<br />
produced by the organism or, more <strong>co</strong>mmonly by introducing entire genes that enable the<br />
production <strong>of</strong> xenogenic proteins. A major <strong>co</strong>ncern <strong>co</strong>nnected with genetically modified<br />
foods, with a particular relevance <strong>to</strong> this study, is the inadvertent introduction <strong>of</strong> novel<br />
allergenic proteins in food crops. This happened in 1996 when a protein from Brazil<br />
nut was transferred in<strong>to</strong> soybean. The xeno-protein (2S albumin) increased the level <strong>of</strong><br />
cysteine and methionine, which occur at relatively low levels in soybean. The modified<br />
crop would thus be a nutritionally improved feed <strong>to</strong> meat-producing lives<strong>to</strong>ck, such as<br />
poultry. As it turned out, however, the 2S albumin is also a major allergen in Brazil nut<br />
and this property was ac<strong>co</strong>rdingly transferred <strong>to</strong> the recipient, i.e. the soybean acquired<br />
Brazilian nut allergenicity. Thus, patients that were allergic <strong>to</strong> Brazil nut, but not soybean,<br />
now had positive reaction upon exposure <strong>to</strong> transgenic soybean using skin prick test and<br />
immunoblotting on subject sera [8]. Based on these findings, further development <strong>of</strong> the<br />
GM soybean was dis<strong>co</strong>ntinued.<br />
The risk <strong>of</strong> unintentional introduction <strong>of</strong> an allergen in genetically modified organisms is<br />
an essential aspect <strong>to</strong> <strong>co</strong>nsider in the risk assessment <strong>of</strong> new GMOs. Several international<br />
regula<strong>to</strong>ry bodies have proposed specific guidelines on procedures for the assessment <strong>of</strong><br />
potential allergenicity <strong>of</strong> GM crops. [9, 10, 11]<br />
2.3 Protein families<br />
In this project two protein families were selected for analysis. Many proteins <strong>of</strong> these<br />
groups have known AA-sequences, and among them there are both defined allergens and<br />
nonallergenes.<br />
As will be explained below, this makes a <strong>evolutionary</strong> <strong>co</strong>-<strong>variation</strong> analysis (sec.2.6.1) <strong>of</strong><br />
the different groups Multiple Sequence Alignments (MSA) (sec.2.4) very well suited.<br />
2.3.1 Tropomyosin<br />
The tropomyosin group <strong>of</strong> proteins was dis<strong>co</strong>vered in 1948 by Bailey [12]. The members <strong>of</strong><br />
this family are closely related and the proteins are present in muscle as well as in certain<br />
non-muscle cells. The <strong>evolutionary</strong> highly <strong>co</strong>nserved tropomyosins bind <strong>to</strong> the sides <strong>of</strong> actin<br />
filaments and, in association with troponin, regulate the interaction <strong>of</strong> the filaments with<br />
myosin in response <strong>to</strong> Ca 2+ [13]. Tropomyosins attain an alpha-helical <strong>co</strong>nfiguration, which<br />
enables a <strong>co</strong>iled-<strong>co</strong>il structure <strong>of</strong> two parallel helices <strong>co</strong>ntaining two sets <strong>of</strong> seven alternating<br />
acting binding sites [14]. The repeat pattern reads a-b-c-d-e-f-g wherein <strong>positions</strong> a and d<br />
are hydrophobic AA. Salt bridges between AA e and g <strong>of</strong> adjacent helices are assumed <strong>to</strong><br />
Jonas Hagberg November 10, 2006
10 2.3 Protein families<br />
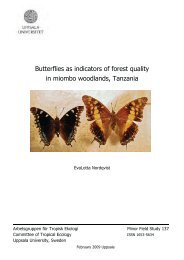
stabilize the <strong>co</strong>iled-<strong>co</strong>il structure [13]. Figure 2 shows how a tropomyosin is arranged as a<br />
head-<strong>to</strong>-tail linked polymer. The head-<strong>to</strong>-tail link is a central assumption in ideas about<br />
the interaction <strong>of</strong> tropomyosin with actin [13], thereby being special, and presumably<br />
particularly important regions <strong>of</strong> the protein.<br />
Figure 2: Head-<strong>to</strong>-tail linked Pig tropomyosin polymers, generated from PDB [15] structure 1C1G [13] via<br />
Pymol [16].<br />
Tropomyosin is a key muscle protein in numerous vertebrate and invertebrate species [17]<br />
and is also present in yeast [18].<br />
One <strong>of</strong> the proteins, the major shrimp allergen Pen a 1 has well characterized IgE epi<strong>to</strong>pes<br />
[19]. Pen a 1 is the only known major allergen identified in shrimp and at least 80% <strong>of</strong><br />
shrimp-allergic subjects react <strong>to</strong> tropomyosin [17]. Vertebrate tropomyosins are <strong>co</strong>nsidered<br />
nonallergenic even though the degree <strong>of</strong> sequence similarity is high among tropomyosins<br />
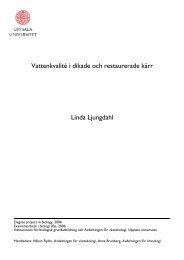
and they are belived <strong>to</strong> shore a <strong>co</strong>mmon function [17]. Invertebrate tropomyosins, on the<br />
other hand, are more likely <strong>to</strong> be allergenic and are important allergens in lobster, crabs,<br />
mollusks, house dust mites, <strong>co</strong>ckroaches etc [17] (see figure 3 for some example species).<br />
The reason for differences in allergenicity between the two subgroups has not yet been<br />
explained.<br />
No defined crystal 3D structure <strong>of</strong> allergen tropomyosin is available in the Protein Data<br />
Bank (PDB) [15], but several non-allergen tropomyosin structures occur in this reposi<strong>to</strong>ry.<br />
(a) Lepisma saccharina (b) Metapenaeus ensis (c) Charybdis feriatus<br />
Figure 3: Three species that have allergenic tropomyosin. Pictures from [20].<br />
November 10, 2006 Jonas Hagberg
2.3 Protein families 11<br />
2.3.2 Parvalbumin<br />
Parvalbumin, the major fish allergen, is a Ca 2+ binding protein and is expressed at high<br />
levels in white muscle tissue <strong>of</strong> lower vertebrates, less abundantly in skeletal muscles <strong>of</strong><br />
higher vertebrates as well as in a variety <strong>of</strong> non-muscle tissues, including testis, endocrine<br />
glands, skin and certain neurons [21]. There are two phylogenetic distinct lineages: the<br />
alpha-group, with less <strong>acid</strong>ic parvalbumins and the beta-group holding more <strong>acid</strong>ic parvalbumins.<br />
The allergenic parvalbumin from Cod belongs <strong>to</strong> the beta-lineage. Most muscles<br />
<strong>co</strong>ntains parvalbumin <strong>of</strong> either alpha or beta origin [22, 23]. Allergen parvalbumins can<br />
belong <strong>to</strong> either lineage.<br />
Parvalbumins have only been re<strong>co</strong>gnized as allergen in fish and frog, despite the similar<br />
features <strong>of</strong> parvalbumin from other species [21]. Parvalbumin from fish is a major allergen;<br />
actually more than 90% <strong>of</strong> all fish-allergic patients react <strong>to</strong> this antigen. Allergen<br />
parvalbumin from fish is a very stable protein: Drastical changes <strong>of</strong> pH, temperature or<br />
exposure <strong>to</strong> dissociating agents do not significantly change its allergenicity [24].<br />
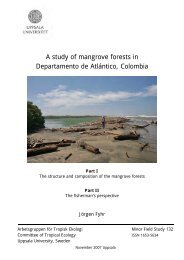
Figure 4: Carp parvalbumin generated from PDB-structure 4CPV [25] via PyMOL [16].<br />
Parvalbumin is characterized by helix-loop-helix (HLH) binding motifs (two helices pack<br />
<strong>to</strong>gether at an angle <strong>of</strong> ∼ 90 degrees, separated by a loop region where calcium binds) [23].<br />
A single allergenic parvalbumin the Allergen Cyp C 1 from the <strong>co</strong>mmon fish Carp, is<br />
structurally determined and occur in the PDB.<br />
Studies have demonstrated dramatic <strong>co</strong>nformational changes, not only in the Ca 2+ -<br />
binding region, but also in distant parts <strong>of</strong> the structure upon Ca 2+ binding [26]. With<br />
this feature in mind, it is not surprising that the capacity <strong>of</strong> IgE <strong>to</strong> bind parvalbumin<br />
is substantially reduced after Ca 2+ depletion. Presumably, IgE bind <strong>to</strong> parvalbumin directly<br />
on the Ca 2+ -binding sites or <strong>to</strong> an epi<strong>to</strong>pe located at a region that is affected by<br />
<strong>co</strong>nformational changes, induced by Ca 2+ . Three epi<strong>to</strong>pe regions have been identified on<br />
Jonas Hagberg November 10, 2006
12 2.4 Multiple Sequence Alignment - MSA<br />
parvalbumin, one <strong>of</strong> the epi<strong>to</strong>pes being part <strong>of</strong> the Ca 2+ binding domain [21].<br />
2.4 Multiple Sequence Alignment - MSA<br />
Sequence alignment is a way <strong>of</strong> arranging biomolecular sequences such as DNA, RNA,<br />
or AA-sequences, typically <strong>to</strong> identify regions <strong>of</strong> similarity that may be a <strong>co</strong>nsequence<br />
<strong>of</strong> functional, structural, or <strong>evolutionary</strong> relationships between the sequences. Aligned<br />
sequences <strong>of</strong> nucleotides or <strong>amino</strong> <strong>acid</strong> residues are regularly represented as rows within<br />
a matrix. Gaps are inserted between the residues so that those with identical or similar<br />
characters are aligned in successive <strong>co</strong>lumns. The most widely used strategy <strong>to</strong> create an<br />
MSA is the progressive-alignment approach:<br />
1. Calculated pairwise distances between the sequences<br />
2. Constructed a guide tree from the distances<br />
3. Gradually build up the alignment, following the order in the tree<br />
Figure 5: MSA <strong>of</strong> 20 starting AA <strong>of</strong> 2 allergen, which have Al first in there name, and 2 non-allergen<br />
parvalbumin sequences.<br />
If two sequences in an alignment share a <strong>co</strong>mmon ances<strong>to</strong>r, mismatches can be interpreted<br />
as point mutations, whereas gaps stem from indels (i.e. insertion or deletion<br />
mutations) introduced in one or both lineages in the time since they diverged from one<br />
another. In AA-sequence alignment, the degree <strong>of</strong> similarity between <strong>amino</strong> <strong>acid</strong>s occupying<br />
a particular position in the sequence can be interpreted as a rough measure <strong>of</strong> the<br />
degree <strong>of</strong> <strong>co</strong>nservation in a particular region or sequence motif among lineages. A MSA<br />
can reveal structures that are homologous i.e. characteristics shared by related species due<br />
<strong>to</strong> a <strong>co</strong>mmon ances<strong>to</strong>r.<br />
Alignment <strong>of</strong> multiple sequences is a fundamental step in the analysis <strong>of</strong> biological data.<br />
A MSA can reveal subtle similarities among large groups <strong>of</strong> proteins information that later<br />
can be used in several different ways.<br />
2.5 Phylogenetic tree<br />
Phylogeny is the evolution <strong>of</strong> species or higher taxonomic grouping <strong>of</strong> organisms, i.e. the<br />
his<strong>to</strong>ry <strong>of</strong> organismal lineages as they change through time. Thus, a phylogenetic tree<br />
shows <strong>evolutionary</strong> relationship amongst various species. Each node with descendants<br />
indicates the most <strong>co</strong>mmon ances<strong>to</strong>r <strong>of</strong> the descendants, and the branch lengths usually<br />
November 10, 2006 Jonas Hagberg
2.6 <strong>Analysis</strong> <strong>of</strong> Evolutionary <strong>co</strong>-<strong>variation</strong> 13<br />
<strong>co</strong>rresponds <strong>to</strong> the number <strong>of</strong> changes that have occurred in that branch. There are many<br />
ways <strong>to</strong> represent such trees, e.g. a cladogram that displays the <strong>evolutionary</strong> propinquity<br />
<strong>of</strong> the displayed organisms, a phylogram that takes branch length in<strong>to</strong> ac<strong>co</strong>unt, and radial<br />
that draws the tree as an unrooted tree radiating from a central point. An example tree is<br />
shown in figure 6.<br />
Al_PRVB2 _SALSA<br />
Al_PRVB_SCOJP<br />
ONCO HUMAN<br />
ONCO CAVPO<br />
Figure 6: A rectangular cladogram plot <strong>of</strong> a simple tree created by Phyml <strong>of</strong> the 4 sequences from fig.5.<br />
2.6 <strong>Analysis</strong> <strong>of</strong> Evolutionary <strong>co</strong>-<strong>variation</strong><br />
MSA <strong>of</strong> protein families can give a wealth <strong>of</strong> information, e.g. <strong>co</strong>nservation and <strong>co</strong>rrelation<br />
(Coupling) <strong>of</strong> AA-position. AA-sequence <strong>co</strong>nservation is related <strong>to</strong> the direct <strong>evolutionary</strong><br />
pressure <strong>to</strong> retain physi<strong>co</strong>-chemical characteristics <strong>of</strong> key <strong>positions</strong> in order <strong>to</strong> maintain<br />
a given function. In MSA sequence <strong>co</strong>nservation is seen as the appearance <strong>of</strong> either the<br />
same or a functionally (roughly) equivalent AA in a particular position (<strong>co</strong>lumn). AAsequence<br />
<strong>co</strong>rrelation is attributed <strong>to</strong> the typically small sequence adjustments needed <strong>to</strong><br />
maintain protein stability against <strong>co</strong>nstant mutational drift. Correlation or <strong>co</strong>upling refers<br />
<strong>to</strong> <strong>co</strong>ncerted changes <strong>of</strong> different <strong>positions</strong> in MSAs (<strong>co</strong>-<strong>variation</strong>).<br />
In recent years, several reports describe that <strong>co</strong>rrelated mutations can provide information<br />
on protein structure information [27, 28, 29, 30]. A fundamental assumption behind<br />
<strong>co</strong>rrelated mutations or <strong>co</strong>uplings is that if two <strong>co</strong>lumns in an MSA show high degree <strong>of</strong><br />
<strong>co</strong>rrelation, the <strong>co</strong>rresponding <strong>positions</strong> in that protein should be linked either energetically,<br />
functionally or by being physically close in some important <strong>co</strong>nformation <strong>of</strong> the<br />
protein [27]. A main incentive for this study was <strong>to</strong> elucidate whether <strong>co</strong>rrelated pairs can<br />
give information about the proteins that are important for allergenicity, or that the pairs<br />
are directly linked <strong>to</strong> allergenicity.<br />
Jonas Hagberg November 10, 2006
14 2.6 <strong>Analysis</strong> <strong>of</strong> Evolutionary <strong>co</strong>-<strong>variation</strong><br />
2.6.1 Explicit Likelihood <strong>of</strong> Subset Co-<strong>variation</strong> - ELSC<br />
Explicit likelihood <strong>of</strong> subset <strong>co</strong>-<strong>variation</strong> (ELSC), developed by Dekker et al. is an perturbationbased<br />
method for quantifying <strong>evolutionary</strong> <strong>co</strong>-<strong>variation</strong> (<strong>co</strong>rrelation) [27]. The perturbation<br />
method works by choosing subsets <strong>of</strong> sequences in an MSA, followed by <strong>co</strong>mparing<br />
the AA <strong>of</strong> the subset with the AA <strong>of</strong> the full alignment. ELSC is, ac<strong>co</strong>rding <strong>to</strong> the authors,<br />
a refinement <strong>of</strong> another perturbation-based method called SCA (Statistical <strong>co</strong>upling<br />
analysis), reported by Lockless et al. [31]. ELSC allows for a more straightforward statistical<br />
interpretation <strong>of</strong> the resulting s<strong>co</strong>re values. In this study, ELSC has been extensively<br />
employed.<br />
Ac<strong>co</strong>rding <strong>to</strong> the authors ELSC seeks a s<strong>co</strong>re for a pair <strong>of</strong> <strong>co</strong>lumns in an MSA (i and j).<br />
• A subset <strong>of</strong> the MSA is chosen where the subset is holding the n<strong>to</strong>tal 1 sequences that<br />
have the AA that is <strong>co</strong>nserved (most frequent) in pos i (interpreted from authors<br />
Java-<strong>co</strong>de).<br />
• The effects <strong>of</strong> the subset is then examined on each other position j.<br />
• The observed AA <strong>co</strong>mposition <strong>of</strong> the subset at pos j is calculated.<br />
• Then, given the AA <strong>co</strong>mposition at pos j in the full MSA, ELSC checks how many<br />
possible subsets <strong>of</strong> size n<strong>to</strong>tal that would occur at pos j, exactly the observed <strong>co</strong>m-<br />
position <strong>of</strong> nala,j alanines, nasn,j asparagines and all other AAs. The number <strong>of</strong> such<br />
subsets is given exactly by Ω <br />
j<br />
Ω <br />
j<br />
=<br />
:<br />
� Nala,j<br />
nala,j<br />
�<br />
·<br />
� Nasn,j<br />
nasn,j<br />
�<br />
· · · = �<br />
r<br />
� Nr,j<br />
Nr,j is the number <strong>of</strong> AA <strong>of</strong> type r at pos j in the full MSA and nr,j is the <strong>co</strong>rresponding<br />
number for the subset. The <strong>co</strong>mbina<strong>to</strong>rial fac<strong>to</strong>r is given by eq.2<br />
� Nr,j<br />
nr,j<br />
�<br />
=<br />
Nr,j!<br />
nr,j!(Nr,j − nr,j)!<br />
and is the number <strong>of</strong> ways <strong>to</strong> choose the exact number <strong>of</strong> sequences <strong>co</strong>ntaining AA<br />
<strong>of</strong> type r in the subset (nr,j) from the <strong>to</strong>tal number in the full MSA (Nr,j) Because<br />
every <strong>co</strong>mbina<strong>to</strong>rial fac<strong>to</strong>r in eq.1 is independent <strong>of</strong> each-other, the <strong>to</strong>tal number <strong>of</strong><br />
possible subsets is simply given by the products <strong>of</strong> the fac<strong>to</strong>rs.<br />
• Ω <br />
j<br />
is divided by the <strong>to</strong>tal number <strong>of</strong> possible subsets <strong>of</strong> size n<strong>to</strong>tal, which gives the<br />
exact probability that a random selection <strong>of</strong> a subset <strong>of</strong> size n<strong>to</strong>tal from the MSA will<br />
1 This is the notation used by the original authors where capital N describe properties <strong>of</strong> the full MSA<br />
and small n for subset<br />
November 10, 2006 Jonas Hagberg<br />
nr,j<br />
�<br />
(1)<br />
(2)
2.7 WRABL - Groups <strong>of</strong> Amino Acid 15<br />
give the observed AA-<strong>co</strong>mposition at pos j in the subset. The probability is given<br />
by L <br />
j :<br />
L <br />
j<br />
=<br />
�Nr,j r nr,j<br />
�N<strong>to</strong>tal �<br />
n<strong>to</strong>tal<br />
�<br />
� (3)<br />
• ELSC calculates a normalized statistic that gives the probability <strong>of</strong> drawing the<br />
observed <strong>co</strong>mposition at random, relative <strong>to</strong> the probability <strong>of</strong> drawing the most<br />
likely <strong>co</strong>mposition. This is needed because MSAs and subsets will differ in size and<br />
<strong>co</strong>mbina<strong>to</strong>rial <strong>co</strong>mplexity. The normalization needs an ideally representative subset<br />
denoted mr,j created from a set <strong>of</strong> integers where mr,j ≈ ( Nr,j<br />
N<strong>to</strong>tal ) ·n<strong>to</strong>tal. The author’s<br />
implementation is by calculating the decimal value <strong>of</strong> mr,j and then rounding that<br />
<strong>to</strong> integer value with the <strong>co</strong>nstraint that �<br />
r mr,j = �<br />
r nr,j so the subset is equal in<br />
size.<br />
• The probability <strong>of</strong> drawing the subset mr,j from MSA at random is given by L <br />
j,max :<br />
� � � Nr,j<br />
L <br />
j,max =<br />
• The normalization is calculated by L<br />
j<br />
L <br />
j,max<br />
Λ <br />
j<br />
≡ L j<br />
L <br />
j,max<br />
• The authors then takes − ln Λ <br />
j<br />
= �<br />
r<br />
r mr,j<br />
�N<strong>to</strong>tal n<strong>to</strong>tal<br />
� (4)<br />
and the authors denote it Λ <br />
j<br />
� Nr,j<br />
nr,j<br />
�Nr,j mr,j<br />
�<br />
� = ELSC(i, j) (5)<br />
just <strong>to</strong> be able <strong>to</strong> <strong>co</strong>mpare their ELSC s<strong>co</strong>re with<br />
the old SCA s<strong>co</strong>re. An overview <strong>of</strong> ELSC applied on a simple alignment can bee seen<br />
in Table 1.<br />
ELSC discards gaps when <strong>co</strong>unting sequences in the MSA. In ELSC there is a <strong>co</strong>nstrained<br />
relationship between i and j that it’s always true that j > i and <strong>co</strong>-<strong>variation</strong> is only<br />
calculated for that pair. In other words for <strong>co</strong>lumns 1 and 10 in a MSA ELSC only use<br />
the most <strong>co</strong>nserved residue in <strong>co</strong>lumn 1 <strong>to</strong> form the subset and report the s<strong>co</strong>re for the<br />
pair (1, 10) but not for the pair (10, 1). The JavaELSC implementation, provided by the<br />
authors, was used in this study.<br />
2.7 WRABL - Groups <strong>of</strong> Amino Acid<br />
Amino <strong>acid</strong>s can be categorized ac<strong>co</strong>rding <strong>to</strong> features <strong>of</strong> importance <strong>to</strong> protein function<br />
and/or <strong>to</strong> evolutionarily relatedness. James O. Wrabl et al. has described a way <strong>of</strong> grouping<br />
AA types using variance maximization <strong>of</strong> the weighted residue frequencies in <strong>co</strong>lumns taken<br />
from a large alignment database [32]. In that work a range <strong>of</strong> such clusters was presented<br />
Jonas Hagberg November 10, 2006<br />
:
16 2.7 WRABL - Groups <strong>of</strong> Amino Acid<br />
AMF CW<br />
ANGGW<br />
AQCAW<br />
AGVQW<br />
CGALW<br />
CTAMM<br />
CTAYM<br />
DTAMK<br />
DTAMK<br />
DTAL K<br />
↑ ↑ ↑ ↑ ↑<br />
i 1 2 3 4<br />
= j<br />
(a)<br />
MSA<br />
r N n m<br />
“ ” “ ”<br />
N N<br />
n m<br />
A 0 0 0 1 2<br />
C 0 0 0 1 1<br />
D 0 0 0 1 1<br />
E 0 0 0 1 1<br />
F 0 0 0 1 1<br />
G 0 0 0 1 1<br />
H 0 0 0 1 1<br />
I 0 0 0 1 1<br />
K 3 0 1 1 3<br />
L 0 0 0 1 1<br />
M 2 0 1 1 2<br />
N 0 0 0 1 1<br />
P 0 0 0 1 1<br />
Q 0 0 0 1 1<br />
R 0 0 0 1 1<br />
S 0 0 0 1 1<br />
T 0 0 0 1 1<br />
V 0 0 0 1 1<br />
W 5 4 2 5 10<br />
Y 0<br />
N<strong>to</strong>tal 0<br />
n<strong>to</strong>tal 0 1<br />
Q<br />
= 5<br />
1<br />
Q<br />
= 60<br />
= 10 = 4<br />
(b) ELSC details when j = 4<br />
0<br />
B<br />
BQ<br />
− ln B<br />
@<br />
“ ”<br />
N<br />
n<br />
“ ”<br />
N<br />
m<br />
1<br />
C = 2.4849<br />
A<br />
(c) Result for j = 4<br />
Table 1: Overview <strong>of</strong> ELSC applied on a simple alignment. Consider the two <strong>co</strong>lumns i and j = 4, ELSC<br />
first choose a subset in <strong>co</strong>lumn i from in this case a hypothetical MSA fig.1(a) the subset is holding the<br />
4 <strong>co</strong>nserved Alanine (A) above the double horizontal line at <strong>co</strong>lumn i. Next the degree <strong>of</strong> bias in the<br />
distributions <strong>of</strong> AA in <strong>co</strong>lumn j is quantified in this subset. If substitutions at position i and j occur<br />
independently through the sequences sampled by the MSA, the distribution <strong>of</strong> AAs at position j in the<br />
subset should be similar <strong>to</strong> the distribution position j in the full MSA. If the two <strong>positions</strong> <strong>co</strong>-vary, the<br />
AAs at position j in the subset may be biased by the chosen subset in <strong>co</strong>lumn i. 1(b) Detailed ELSC<br />
calculations <strong>of</strong> the given subset for <strong>co</strong>lumn j = 4. Where r is the 20 different AA possible. N denotes<br />
number <strong>of</strong> AA <strong>of</strong> type r in the full MSA. Moreover n denotes the same but for the subset MSA. m is the<br />
<strong>co</strong>unt <strong>of</strong> AA <strong>of</strong> type r in the idealized MSA, created by calculating mr ≈ ( Nr<br />
N<strong>to</strong>tal )·n<strong>to</strong>tal. The <strong>co</strong>mbina<strong>to</strong>rial<br />
term � � N<br />
X is calculated as stated in equation2. 1(c) The resulting ELSC s<strong>co</strong>re for pair (i, j = 4), calculated<br />
by the − ln <strong>of</strong> equation 5.<br />
and the one <strong>co</strong>mposed <strong>of</strong> 8 functional groups was identified as optimal. Hence, this sort<br />
<strong>of</strong> <strong>amino</strong> <strong>acid</strong> aggregation was selected <strong>to</strong> the study outlined in this work. The resulting<br />
8 optimal groups <strong>co</strong>rrespond fairly well <strong>to</strong> AA physical properties. In this study the<br />
aggregation <strong>of</strong> the 20 letter AA alphabet <strong>to</strong> only 8 letters is denoted WRABL after the<br />
first author. The translation is as follows (Letters within parenthesis represent AA in their<br />
original form):<br />
Aromatic W = (WFY)<br />
Aliphatic M = (MLIV)<br />
“Small” A = (ATS)<br />
Polar/<strong>acid</strong>ic N = (NDE)<br />
Polar/basic H = (HQRK)<br />
3 unique groups (C), (G), (P)<br />
November 10, 2006 Jonas Hagberg
2.8 Protein structure prediction 17<br />
2.8 Protein structure prediction<br />
Protein structure prediction involves <strong>co</strong>mputational techniques aiming at deriving 3D structures<br />
<strong>of</strong> proteins from their AA-sequences. 3D-protein structures can provide valuable information<br />
on protein function. In an allergenicity <strong>co</strong>ntext knowledge on protein structure<br />
is important when <strong>co</strong>nsidering if and where immunoglobulin E molecules are binding <strong>to</strong><br />
proteins. The amount <strong>of</strong> experimentally verified structures available is, however limited<br />
because it is hard and very time-<strong>co</strong>nsuming <strong>to</strong> derive new structures by X-ray crystallography<br />
or nuclear magnetic resonance spectros<strong>co</strong>py. This is where structure prediction<br />
<strong>co</strong>mes in. Structure prediction in sili<strong>co</strong> is fast and relatively inexpensive and can give good<br />
results in some cases.<br />
Structure prediction can be divided in<strong>to</strong> three areas: ab initio prediction, fold re<strong>co</strong>gnition,<br />
and homology modeling. Ab initio or de novo protein prediction methods are based<br />
on the laws <strong>of</strong> physics and chemistry <strong>to</strong> predict the structure <strong>of</strong> a protein, rather than<br />
using other proteins as templates. Fold re<strong>co</strong>gnition attempt <strong>to</strong> detect similarities between<br />
protein 3D structure that doesn’t have any significant sequence similarity, i.e attempts<br />
<strong>to</strong> find folds that are <strong>co</strong>mpatible with a target sequence and predict how well a fold will<br />
fit. Homology modeling can, at the current stage <strong>of</strong> development, give the most accurate<br />
models and uses a single template from PDB that has a high level <strong>of</strong> sequence similarity<br />
<strong>to</strong> the target [33].<br />
In this project SWISS-MODEL [34] by SIB 2 being <strong>of</strong> the homology modeling type, is<br />
used <strong>to</strong> predict structures <strong>of</strong> proteins with known AA-sequences. SWISS-MODEL is a<br />
freely available web-server application that can predict structures from templates. Results<br />
are sent as a PDB-file <strong>to</strong> a given e-mail address. The global SWISS-MODEL steps are:<br />
1. Search for suitable templates in a 3D database<br />
2. Check sequence identity with target<br />
3. Generate models<br />
4. Minimize energy<br />
To verify outputs from the SWISS-MODEL, the 3D-JIGSAW [35] being another homology<br />
prediction web-<strong>to</strong>ol was used. The modeling steps are similar <strong>to</strong> those <strong>of</strong> SWISS-MODEL.<br />
3 Aims<br />
The over-all aim <strong>of</strong> this degree study is <strong>to</strong> apply bioinformatics methods <strong>to</strong> identify and<br />
evaluate features that may separate allergen proteins from non-allergen proteins, belonging<br />
<strong>to</strong> the same family. To ac<strong>co</strong>mplish this, <strong>evolutionary</strong> <strong>co</strong>-<strong>variation</strong>/<strong>co</strong>upling analysis<br />
was applied <strong>to</strong> both allergens and non-allergens <strong>of</strong> two distinct families, tropomyosin and<br />
parvalbumin. Activities in this study were aimed at:<br />
2 Swiss Institute <strong>of</strong> Bioinformatics, http://www.isb-sib.ch<br />
Jonas Hagberg November 10, 2006
18 4. Materials and Methods<br />
• Dis<strong>co</strong>vering possible differences in <strong>co</strong>-<strong>variation</strong> patterns between allergens and nonallergens.<br />
This is performed by applying the algorithm Explicit Likelihood <strong>of</strong> Subset<br />
Co-<strong>variation</strong> (ELSC see sec.2.6.1) <strong>to</strong> tropomyosins and parvalbumins.<br />
• Testing the robustness <strong>of</strong> the ELSC algorithm regarding the number <strong>of</strong> sequences<br />
used in the analyse. This is performed by ELSC-sample-size-test, as described in<br />
section 4.5.3.<br />
• To examine whether grouping <strong>of</strong> <strong>amino</strong> <strong>acid</strong>s can reveal <strong>co</strong>-<strong>variation</strong> in <strong>positions</strong><br />
across functional AA groups, which in turn may point out key <strong>positions</strong> as regards<br />
function/structure.<br />
• Examining whether <strong>co</strong>-<strong>variation</strong> analysis may be used <strong>to</strong> retrieve information about<br />
allergens, such as identifying epi<strong>to</strong>pes or other motifs important for allergenicity.<br />
This is carried out by <strong>co</strong>mparing best resulting ELSC pairs from allergens with<br />
known epi<strong>to</strong>pes.<br />
• Examining if a homology structure prediction can be applied <strong>to</strong> detect allergen specific<br />
structure difference.<br />
4 Materials and Methods<br />
4.1 Datasets<br />
A variety <strong>of</strong> allergy-dedicated databases, each holding a subset <strong>of</strong> AA-sequences, were<br />
<strong>co</strong>nsulted <strong>to</strong> create sets <strong>of</strong> both allergen and non-allergen sequences. Apart from the inhouse<br />
database <strong>of</strong> the National Food Administration [2], the following reposi<strong>to</strong>ries were<br />
mined: Allergome [20], SDAP [36], UniProt [37] Excerpts from the various datasets were<br />
<strong>co</strong>mplied in<strong>to</strong> text files and formatted ac<strong>co</strong>rding <strong>to</strong> the standard FASTA format [38]. For<br />
clarity, allergen sequences are tagged with “Al ” upstream <strong>of</strong> the actual name.<br />
4.1.1 Tropomyosin<br />
One <strong>of</strong> the <strong>co</strong>mposite tropomyosin data-sets, created for this project, <strong>co</strong>ntains 106 presumed<br />
non-allergens and 23 allergen tropomyosins. This family was <strong>co</strong>nsidered as particularly<br />
appropriate for this study because both allergen and non-allergen tropomyosin<br />
AA-sequence are known and the protein family displays high sequence <strong>co</strong>nservation. Allergen<br />
proteins are showed in table 2.<br />
4.1.2 Parvalbumin<br />
The parvalbumin data-set used in this study holds 16 non-allergens (all being mammalian<br />
parvalbumins mined from UniProt) and 13 allergen sequences, as listed in table 3. This is<br />
November 10, 2006 Jonas Hagberg
4.2 Bioinformatic methods 19<br />
UniProt-Entry Protein information<br />
TPM4 DROME Is<strong>of</strong>orms 33/34 (Tropomyosin II) -Drosophila melanogaster (Fruit fly)<br />
TPM2 DROME (Tropomyosin I) - Drosophila melanogaster (Fruit fly)<br />
Q2WBI0 9ACAR Dermanyssus gallinae (Chicken mite)<br />
TPM CHAFE Allergen Cha f 1 (Fragment) - Charybdis feriatus (Crab) see fig 3(c)<br />
TPM1 DROME Is<strong>of</strong>orms 9A/A/B (Tropomyosin II) (Cy<strong>to</strong>skeletal tropomyosin) - Drosophila melanogaster<br />
Q3Y8M6 9EUCA Pen a 1 allergen - Farfantepenaeus aztecus (brown shrimp).<br />
TPM ANISI (Allergen Ani s 3) - Anisakis simplex (Herring worm).<br />
TPM PERAM (Major allergen Per a 7) - Periplaneta americana (American <strong>co</strong>ckroach).<br />
TPM BLAGE Blattella germanica (German <strong>co</strong>ckroach).<br />
TPM LEPDS (Allergen Lep d 10) - Lepidoglyphus destruc<strong>to</strong>r (Fodder mite).<br />
TPM HALDV Haliotis diversi<strong>co</strong>lor (Abalone).<br />
TPM PERVI Perna viridis (Tropical green mussel).<br />
TPM MIMNO Mimachlamys nobilis (Noble scallop) (Chlamys nobilis).<br />
Q95WY0 CRAGI (Fragment) - Crassostrea gigas (Pacific oyster).<br />
TPM PERFU Periplaneta fuliginosa (Smokybrown <strong>co</strong>ckroach) (Dusky-brown <strong>co</strong>ckroach).<br />
TPM LEPSA Lepisma saccharina (Silverfish) see fig 3(a).<br />
TPM METEN (Allergen Met e 1) (Met e I) - (Greasyback shrimp) (Sand shrimp) see fig 3(b).<br />
TPM HELAS (Allergen Hel as 1) - Helix aspersa (Brown garden snail).<br />
TPM CHIKI (Allergen Chi k 10) - Chironomus kiiensis (Midge).<br />
TPM PANST (Allergen Pan s 1) (Pan s I) - Panulirus stimpsoni (Spiny lobster).<br />
TPM HOMAM (Allergen Hom a 1) - Homarus americanus (American lobster).<br />
TPM DERPT (Allergen Der p 10) - Derma<strong>to</strong>phagoides pteronyssinus (House-dust mite).<br />
TPM TURCO (Major allergen Tur c 1) (Fragments) - Turbo <strong>co</strong>rnutus (Horned turban) (Battilus <strong>co</strong>rnutus).<br />
Table 2: Allergens in the tropomyosin protein family.<br />
a <strong>co</strong>nsiderably smaller data-set, relative <strong>to</strong> that <strong>of</strong> tropomyosins (29 sequences versus 129),<br />
but with a higher ratio between allergens and non-allergens. Moreover, allergens and nonallergens<br />
are not bifurcated in<strong>to</strong> phylogenetically distinct categories like the tropomyosins<br />
<strong>of</strong> which all known allergens stem from invertebrate organisms. This makes parvalbumins<br />
a better candidate set <strong>to</strong> spot differences between the sequences which are attributed <strong>to</strong><br />
allergenicity without relation <strong>to</strong> phylogeny.<br />
UniProt-Entry Protein information<br />
PRVB THECH beta (Allergen The c 1) - Theragra chal<strong>co</strong>gramma (Alaska pollock).<br />
Q90YK8 THECH Theragra chal<strong>co</strong>gramma (Alaska pollock).<br />
PRVA RANES alpha - Rana esculenta (Edible frog).<br />
Q8JIU1 RANES beta protein - Rana esculenta (Edible frog).<br />
Q8UUS3 CYPCA, Q8UUS2 CYPCA beta Cyprinus carpio (Common carp).<br />
PRVB GADCA beta (Allergen Gad c 1) (Allergen M) - Gadus callarias (Baltic <strong>co</strong>d).<br />
90YL0 GADMO beta - Gadus morhua (Atlantic <strong>co</strong>d).<br />
4.2 Bioinformatic methods<br />
4.2.1 Kalign<br />
Table 3: Allergens in the parvalbumin protein family.<br />
In this study a rather new MSA methods was used. The Kalign algorithm is accurate<br />
and fast and is based on a strategy similar <strong>to</strong> that <strong>of</strong> the standard progressive method for<br />
Jonas Hagberg November 10, 2006
20 4.3 Creation <strong>of</strong> MSAs and Phylogenetic trees<br />
sequence alignment [39]. Kalign enhance this method by taking advantage <strong>of</strong> an approximate<br />
string-matching algorithm, that allows string matching with mismatch for distance<br />
calculation and by in<strong>co</strong>rporating local matches in<strong>to</strong> the otherwise global alignment. This<br />
renders Kalign estimates <strong>of</strong> distance more accurate and with a throughput not inferior<br />
<strong>to</strong> other leading methods, such as ClustalW [40], Muscle [41] or T-C<strong>of</strong>fe [42]. Kalign is<br />
as accurate as the best among other methods on small alignments, but significantly more<br />
accurate when aligning large and distantly related sets <strong>of</strong> sequences [39].<br />
4.2.2 Phylogenies by Maximum Likelihood - Phyml<br />
Phyml is a fast and accurate maximum likelihood algorithm <strong>to</strong> estimate phylogenies. The<br />
<strong>co</strong>re is a simple hill-climbing algorithm that adjusts tree <strong>to</strong>pology and branch lengths<br />
simultaneously [43]. Phyml starts by creating an <strong>evolutionary</strong> distance matrix from the<br />
sequences, by a fast distance-based method. An initial tree is built from this matrix, using<br />
the BIONJ [44] algorithm. The Phyml algorithm then modifies, at each iteration, this<br />
tree <strong>to</strong> improve the probability <strong>of</strong> observing the sequences available under an underlying<br />
statistical model that depends on the tree structure (tree parameters). Phyml search for the<br />
most likely tree (thus maximum likelihood). Phyml reaches optimum after a few iterations<br />
due <strong>to</strong> the simultaneously approach. It is a freely available program that was used in this<br />
study <strong>to</strong> create phylogenies <strong>of</strong> the protein families <strong>to</strong> visualize and detect relationships<br />
between the protein sequences.<br />
4.3 Creation <strong>of</strong> MSAs and Phylogenetic trees<br />
Kalign was used <strong>to</strong> align all the dataset FASTA files. Regularly the default parameters <strong>of</strong><br />
6.0 for gap open penalty and 0.9 on gap extension penalty was used. Other settings are<br />
clearly stated. Manual inspection <strong>of</strong> the <strong>co</strong>mputed MSA was performed <strong>to</strong> identify whether<br />
improvements <strong>co</strong>uld readily be made prior <strong>to</strong> further processing. Mostly Kalignvu [45] was<br />
used; it is a web <strong>to</strong>ol for visualizing and running Kalign on given MSAs. The aligned<br />
datasets were then loaded in<strong>to</strong> Matlab for further analyze and testing.<br />
Phyml was performed on the kaligned subsets; the following parameter settings was used:<br />
• Model <strong>of</strong> <strong>amino</strong> <strong>acid</strong>s substitution : DCMut [46]<br />
• Initial tree : [BIONJ] [44]<br />
• Discrete gamma model : Yes<br />
-Number <strong>of</strong> categories : 4<br />
-Estimate Gamma shape parameter : YES (2.011 for parvalbumin and 1.003 for<br />
tropomyosin)<br />
• Estimate proportion <strong>of</strong> invariant: YES (0.121 for parvalbumin and 0.000 for tropomyosin)<br />
November 10, 2006 Jonas Hagberg
4.4 Computer aid 21<br />
4.4 Computer aid<br />
Most <strong>of</strong> the analyzes and algorithm development was performed in the MATLAB [47]<br />
programming environment. Several special scripts were, however, created in Perl and<br />
Bash. Most <strong>co</strong>mputer calculations where performed on one PC (AMD64 dual <strong>co</strong>re 2010<br />
MHz with 2GB RAM) with Gen<strong>to</strong>o Linux X86 64 with kernel 2.6.16-gen<strong>to</strong>o-r9 [48].<br />
4.4.1 Computer Cluster<br />
Due <strong>to</strong> demanding <strong>co</strong>mputations required for 3D-structures and 3D-structure <strong>co</strong>mparison<br />
and other heavy <strong>co</strong>mputations <strong>co</strong>nceivable within the project, the intention was originally<br />
<strong>to</strong> <strong>co</strong>nstruct a <strong>co</strong>mputer cluster. Several different cluster s<strong>of</strong>twares where <strong>co</strong>nsidered and<br />
two <strong>of</strong> them, both being <strong>of</strong> the load-balancing kind, were tested. They are designated<br />
OpenSSI [49] and openMosix [50]. The National Food Administration provided 5 AMD64<br />
dual-<strong>co</strong>re <strong>co</strong>mputers equipped with latest hardware features, that later were found <strong>to</strong> be<br />
both a benefit and a disadvantage.<br />
Firstly, an OpenSSI environment was implemented on a single <strong>co</strong>mputer. OpenSSI is<br />
a a kernel extension <strong>to</strong> Fedora Core 3, Debian Sarge or Red Hat 9 (three different Linux<br />
distributions). Debian was chosen because <strong>of</strong> the similarity <strong>to</strong> Gen<strong>to</strong>o Linux [48] a preferred<br />
distribution because <strong>of</strong> its unique adaptability. OpenSSI is, at the time <strong>of</strong> this work,<br />
only stable with a 2.4 kernel, which caused the main problem. The new hardware, such<br />
as SATA-II hard-disc-drives and <strong>co</strong>ntroller, are not well supported in the old 2.4 kernel.<br />
Despite the hardware/s<strong>of</strong>tware <strong>co</strong>mpatibility problems a base system with the OpenSSI<br />
kernel extension was installed. Work with graphics needs an X-windows system, and the<br />
installation <strong>of</strong> X-windows didn’t, however, work with the OpenSSI/Debian <strong>co</strong>mbination.<br />
A Gen<strong>to</strong>o Linux base system was then chosen as cluster base system <strong>to</strong> extend its kernel<br />
with openMosix, which is a Linux kernel extension for single-system image clustering.<br />
The kernel extension can turn a network <strong>of</strong> ordinary <strong>co</strong>mputers in<strong>to</strong> a super<strong>co</strong>mputer.<br />
openMosix is balancing the workload even on the different nodes in the cluster and <strong>co</strong>ntinuously<br />
attempts <strong>to</strong> optimize the allocation <strong>of</strong> resources. The main advantage <strong>of</strong> this<br />
type <strong>of</strong> cluster is that there is no need <strong>to</strong> program an application <strong>to</strong> run on openMosix,<br />
in <strong>co</strong>ntrast <strong>to</strong> a cluster that needs programs that are implemented in a parallel fashion <strong>to</strong><br />
use the power <strong>of</strong> the cluster. Because <strong>of</strong> the process migration openMosix is also appropriate<br />
if the required <strong>co</strong>mputations are based on many different processes rather than one<br />
time <strong>co</strong>nsuming algorithm. The cluster behaves much like a symmetric Multi-Processor<br />
which is a multiprocessor <strong>co</strong>mputer architecture where two or more identical processors<br />
are <strong>co</strong>nnected <strong>to</strong> a single shared main memory. The problems that aroused with Gen<strong>to</strong>o<br />
Linux and openMosix kernel were <strong>of</strong> the same kind as those <strong>of</strong> OppenSSi and Debian i.e.<br />
openMosix was just stable with kernel 2.4. A workaround was created, which enable installation<br />
<strong>of</strong> a fully functional X-windows system with the only drawback that full support<br />
for the graphics-card wasn’t possible. Several tests were performed on the cluster, such<br />
as existing stress-test and some newly self made tests. The openMosix cluster was clearly<br />
operational but unfortunately somewhat unstable and several unpredictable crashes oc-<br />
Jonas Hagberg November 10, 2006
22 4.5 Procedures<br />
curred. Moreover the slow behavior <strong>of</strong> the graphics drivers wasn’t satisfac<strong>to</strong>ry. Another<br />
main drawback is that none <strong>of</strong> the tested clustering s<strong>of</strong>twares supports 64-bits processors.<br />
Because <strong>of</strong> the instability and the poor graphics performance, the Cluster installation was<br />
rejected. A plain Gen<strong>to</strong>o AMD64 version with the latest kernel was subsequently installed<br />
on all five <strong>co</strong>mputers.<br />
The processor power <strong>of</strong> all <strong>co</strong>mputers was subsequently made <strong>co</strong>nveniently available by<br />
installation <strong>of</strong> the distcc [12] was installed. Distcc helps <strong>to</strong> <strong>co</strong>mpile new s<strong>of</strong>tware for the<br />
<strong>co</strong>mputers by dividing the <strong>co</strong>de <strong>to</strong> the different nodes. Ac<strong>co</strong>rdingly programs were run on<br />
different nodes manually.<br />
4.5 Procedures<br />
4.5.1 20/80-method<br />
One method that was evaluated at the outset <strong>of</strong> the study is denoted 20/80. 20/80 is<br />
pinpointing the <strong>co</strong>lumns in the MSA that have a degree <strong>of</strong> <strong>co</strong>nservation over 20% and<br />
below 80%. The lower limit was set <strong>to</strong> ignore <strong>co</strong>lumns devoid <strong>of</strong> <strong>co</strong>nservation, whereas<br />
the upper limit was set <strong>to</strong> avoid perfect <strong>co</strong>nservation. Columns with great <strong>co</strong>nservation<br />
are important <strong>to</strong> structure and may serve the purpose <strong>of</strong> separation <strong>of</strong> allergens from nonallergens.<br />
The MSA was divided in <strong>to</strong> two sets; one <strong>co</strong>ntaining allergens and the other<br />
non-allergens. The subsets will, however, still have the same alignment, in that way no<br />
change in “<strong>co</strong>ordinates” are made and the <strong>co</strong>lumns can easily be <strong>co</strong>mpared between the<br />
sets. The main idea with 20/80 is <strong>to</strong> separate the sets based on values in the different<br />
20/80-<strong>co</strong>lumns, and if the sets have the same <strong>co</strong>lumns, the saved <strong>co</strong>nserved AA can be<br />
<strong>co</strong>mpared, and if the <strong>co</strong>nserved AA differs between the sets we have still a way <strong>to</strong> separate<br />
allergens from non-allergens.<br />
A simple Matlab script was created that <strong>co</strong>uld load a MSA and then pin-point the 20/80<strong>co</strong>lumns<br />
in the two subsets separately and eventually <strong>co</strong>mpute the number <strong>of</strong> <strong>co</strong>lumns that<br />
where unique for the separate set and how many they share.<br />
The 20/80-method can be regarded as a simple preface <strong>to</strong> ELSC, but without the <strong>co</strong><strong>variation</strong><br />
analysis because that every 20/80 <strong>co</strong>lumn exists in on or more ELSC(i, j). Since<br />
ELSC was dis<strong>co</strong>vered and fully in<strong>co</strong>rporated results obtained with the 20/80-method were<br />
not further analyzed.<br />
4.5.2 ELSC<br />
Several Matlab scripts were created <strong>to</strong> load and run the java implementation <strong>of</strong> ELSC<br />
within Matlab. Some Perl-scripts were also produced <strong>to</strong> help seamless integration <strong>of</strong><br />
javaELSC in Matlab. The script mostly used <strong>to</strong> examine ELSC-s<strong>co</strong>res on different MSAs<br />
includes the following steps:<br />
1. Load Kalign-created MSA file in FASTA-format<br />
2. Run Perl-script <strong>to</strong> format MSA-file for javaELSC and <strong>to</strong> create allergen and non-allergen subset.<br />
November 10, 2006 Jonas Hagberg
4.5 Procedures 23<br />
3. Run Perl-script <strong>to</strong> delete sequence name and import subset MSAs <strong>to</strong> Matlab matrix.<br />
4. Save the <strong>co</strong>lumns in MSA that have a <strong>co</strong>nservation ratio above 90%.<br />
5. Run javaELSC on the two subsets. And import the outputted s<strong>co</strong>re matrix.<br />
6. Plot the 20 ELSC(i, j) (ELSC-pairs) with highest s<strong>co</strong>re.<br />
7. Plot the ELSC(i, j) that have a s<strong>co</strong>re that are within a given percent <strong>of</strong> the max ELSC-s<strong>co</strong>re <strong>of</strong> that subset.<br />
(20% mostly used)<br />
The aforementioned procedure were performed on both tropomyosin and parvalbumin<br />
datasets.<br />
4.5.3 ELSC - sample-size-test<br />
Due <strong>to</strong> <strong>co</strong>nsiderable fewer allergens in the tropomyosin dataset, relative <strong>to</strong> non-allergens,<br />
a test <strong>to</strong> examine sensitivity <strong>of</strong> ELSC <strong>to</strong> the number <strong>of</strong> sequences was performed. Several<br />
subset MSAs were created from the original non-allergen MSA, <strong>co</strong>ntaining 23 sequences<br />
(the same numbers as the numbers <strong>of</strong> allergens in the original MSA).<br />
Hypothesis: If ELSC is not sensitive <strong>to</strong> the number <strong>of</strong> sequences, ELSC-pairs with the<br />
highest s<strong>co</strong>res are the same across subset-MSAs. To test the hypotheses the following<br />
algorithm was created:<br />
1. random generate a ELSC-INPUT-file with 23 unique non-allergen sequences.<br />
2. run javaELSC with random INPUT-file.<br />
3. import ELSC-OUTPUT <strong>to</strong> Matlab<br />
4. save ELSC-s<strong>co</strong>re-matrix<br />
5. do step 1-4 50 times<br />
6. calculate statistics based on all ELSC s<strong>co</strong>re-matrices<br />
A help script was created <strong>to</strong> calculate the statistics on ELSC-s<strong>co</strong>re matrices. Every<br />
ELSC run generates an ELSC-s<strong>co</strong>re matrix with pairs i and j and their <strong>co</strong>rresponding<br />
s<strong>co</strong>res. All unique pairs obtained are firstly summarized, and thereafter the mean s<strong>co</strong>re<br />
value over all ELSC-runs and the number <strong>of</strong> times each pair is present in all performed<br />
ELSC runs, is calculated. These statistics were later used <strong>to</strong> visualize the test result (see<br />
fig.9).<br />
4.5.4 WRABL<br />
As outlined in the Background section 2.7 (WRABL - Groups <strong>of</strong> Amino Acid), AAs can<br />
be grouped in<strong>to</strong> eight functional categories [32]. A simple Perl-script was created <strong>to</strong> aid<br />
the ELSC analysis on WRABL-translated MSAs. The procedure was executed as follows:<br />
1. Translate a MSA with a Perl-script from AAs in<strong>to</strong> WRABL groups<br />
2. Run javaELSC on the translated MSA<br />
3. Import ELSC-s<strong>co</strong>re matrix <strong>to</strong> Matlab for the same analysis as mentioned in section 4.5.2<br />
Jonas Hagberg November 10, 2006
24 5. Results<br />
5 Results<br />
5.1 Phylogenetic trees<br />
Figure 7 shows a circular phylogenetic tree <strong>of</strong> parvalbumins. One <strong>of</strong> the two major branches<br />
holds most <strong>of</strong> the allergens, whereas a minor fraction (two proteins) appears on a relatively<br />
distant location that derives from the se<strong>co</strong>nd major branch. The two separated allergens<br />
are branched <strong>to</strong>gether in between several non-allergen sequences. The small cluster represents<br />
allergen parvalbumins that belong <strong>to</strong> the α-lineage, whereas the large cluster holds<br />
all sequences that are either designated β or without specific lineage designation. This<br />
indicates that all non-designated sequences may belong <strong>to</strong> the β-linage.<br />
To summarize, no clear phylogenetic clustering between allergens and non-allergens can<br />
be spotted, but the allergens appear in two distinct clusters.<br />
Al_Q90YL0<br />
Al P02618<br />
Al_Q8UUS2<br />
Al _P02622<br />
Al_Q8UUS3<br />
Al _Q90YK9<br />
Al_P59747<br />
Al_Q90YK7<br />
PRVA HUMAN<br />
PARVALBUMINS<br />
PRVA CAVPO<br />
Al_P02627<br />
ONCO MOUSE<br />
ONCO RAT<br />
ONCO CAVPO<br />
ONCO HUMAN<br />
Al_Q8JIU2<br />
PRVA RAT<br />
PRVA GERSP<br />
Al_Q91483<br />
Q80WI0 9MU<br />
Al_Q90YK8<br />
Al_Q91482<br />
PRVA MOUSE<br />
Al_Q8JIU|<br />
Q9N195 BOV<br />
PRVA RABIT<br />
PRVA MACFU<br />
Q545M7 MOU<br />
PRVA FELCA<br />
Figure 7: Circular phylogenetic tree <strong>of</strong> Parvalbumin with real branch lengths, created by Phyml. The gray<br />
shading indicates allergens, occurring in two separate groups.<br />
Figure 8 shows a circular phylogenetic tree <strong>of</strong> the tropomyosin dataset. Since some<br />
distances between sequences are quite extended, several shorter branches be<strong>co</strong>me <strong>co</strong>mpact<br />
November 10, 2006 Jonas Hagberg
5.1 Phylogenetic trees 25<br />
Q9YH29 XEN<br />
Q15657 HUM<br />
Q9DFQ5 GIL<br />
Q923Z2 RAT<br />
Q805D0 FUG<br />
Q63583 RAT<br />
Q564G1 MOU<br />
Q8BP43 MOU<br />
TPM1 MOUSE<br />
TPM1 HUMAN<br />
Q6DV89 HUM<br />
TPM1 PIG<br />
Q5KR49 BOV<br />
TPM1 RAT<br />
Q9YH30 XEN<br />
Q91XN6 RAT<br />
Q6DV90 HUM<br />
Q8BSH3 MOU<br />
Q90236 AMB<br />
TPM1 CHICK<br />
Q4F8P0 HYL<br />
TPM1 XENLA<br />
TPM1 RANTE<br />
Q90WH7 9CH<br />
Q76CT4 THU<br />
TPM1 LIZAU<br />
Q8JIM7 FUG<br />
Q91472 SAL<br />
Q8AV86 THE<br />
Q8JIM8 FUG<br />
TPM1 BRARE<br />
Q805<br />
C5<br />
FUG<br />
A<br />
R<br />
B<br />
6<br />
J<br />
3<br />
U<br />
5<br />
Q<br />
Q914<br />
89<br />
SAL<br />
Q91726 XEN<br />
Q8QGC3 AMB<br />
Q4F8N9 HYL<br />
Q805C7 FUG<br />
TROPOMY ROP OPOMY OP OPO OP OPPOMY<br />
PO OMY OM MYO MY MYYOS<br />
YO<br />
Q805C9 Q805C9 Q805C9 FUG FUG FUG<br />
Q803M1 Q803M Q8 BRA<br />
Q3TJ53 Q3TJ53 Q3TJ53 MOU MOU<br />
Q58E70 Q58E70 Q58E70 MOU MOU<br />
Q63610 Q63610 Q63610 RAT RAT<br />
Q5VU61 Q5VU61 61 HUM HUM HUM<br />
Q805D1 Q805D1 D1 FUG<br />
FUG<br />
P79309 P79309 P79309 PIG PIG PIG IG<br />
TPM4 TPM4 TPM4 RAT RAT RAT<br />
TPM4 TPM4 TPM4 MOUSE MOUSE MOUSE<br />
Q07413 HUM<br />
P97726 P97726 P97726 9MU 9MU 9<br />
Q63599 Q63599 Q63599 RAT RAT<br />
Q8NI98 Q8NI98 Q8NI98 HUM HUM<br />
Q6QA25 Q6QA25 Q6QA25 PIG PIG PIG<br />
Q5VU59 Q5VU59 Q5VU59 HUM HUM HU<br />
Q5VU66 Q5VU66 Q5VU66 HUM HUM HUM<br />
Q5U0D9 Q5U0D9 HUM HUM<br />
Q6AZ25 RAT<br />
TPM4 TPM4 HORSE HORSE<br />
TPM4 M4 HUMAN<br />
MAN<br />
Q90349 0349 349 COT COT COT OT<br />
Q805C2 FUG<br />
Q91866 XEN<br />
Q9PST6 XEN<br />
Q91864 XEN<br />
Q91865 91865 XEN XEN<br />
Q805C4 Q805C4 FUG FUG<br />
Q5VU72 Q5VU72 HUM HUM<br />
Q63601 Q63601 RAT RAT<br />
QQ<br />
Q5VU58 Q5VU58 HUM HUM<br />
QQ<br />
66<br />
333<br />
66000 600<br />
000<br />
RR<br />
AA<br />
TT<br />
OO<br />
UUU<br />
33<br />
MM<br />
88C<br />
CC<br />
77<br />
CC<br />
Q91XN7 Q91 Q9 RAT<br />
Q7Z6L8 HUM<br />
Q64I71 Q64I71 Q64I71 MEL MEL MEL<br />
Q91005 CHI<br />
Q90348 COT<br />
Q6QJD1 Q6QJD1 JD1 XE XEN XEN<br />
Q6QJD0 Q6QJD0 XEN X<br />
O88440 O88440 RAT<br />
Q805C3 FUG<br />
Q9TRA2 PIG<br />
Q5VU70 Q5VU70 Q5VU70 HUM H<br />
TPM3 TPM3 TPM MOUSE M<br />
Q6P5R0 Q6P5 HUM<br />
O62731 CAN<br />
Q6LDX7 HUM<br />
Q91490 Q91490 91490 SAL SAL SAL<br />
Q805C6 Q805C6 6 FUG FUG FUG<br />
Q6P0W3 Q6P0W3 BRA BRA RA<br />
Q5VU63 Q5VU63 HUM HUM<br />
Q66LG2 FUN<br />
Q4F8N6 HYL<br />
Al_P49455<br />
Al_P06754<br />
Q8K0Z5 Q8K0Z5 K0Z5 MO MOU MOU<br />
Q6NYQ0 BRA<br />
Al_O96764<br />
Al_Q9UB83<br />
Q805C8 FUG<br />
Q6IQD7 BRA<br />
TPM2 TPM2 PM2 HUMA HUMAN HUMAN<br />
Q9D1R6 Q9D1R6 9D1R6 MOU MOU MOU<br />
TPM2 TPM2 MOUSE MOUSE MOUSE<br />
TPM2 TPM2 CHICK CHICK<br />
Al_Q8T6L5<br />
Al_Q9NG56<br />
Q60527 60527 MES MES<br />
Q95JE9 Q95JE9 RA RAB RA<br />
Q53FM4 Q53FM4 Q53FM4 HUM HUM H<br />
Q5TCU4 Q5TCU4 Q5TCU4 HUM HUM HUM<br />
Q5TCU3 Q5TCU3 HUM HUM UM<br />
Q5TCU8 Q5TCU8 HUM HUM HUM<br />
Al_O61379<br />
Al_P09491<br />
Al_Q25456<br />
Al_Q8T380<br />
Al_Q3Y8M6<br />
Al_Q9N2R3<br />
Al_O44119<br />
Al_O18416<br />
Al_Q9NFZ4<br />
Al_Q9NAS5<br />
Al_Q95WY0<br />
Al_Q9GZ71<br />
Al_Q2WBI0<br />
Al_Q9GZ70<br />
Al_Q9GZ69<br />
Al_Q7M3Y8<br />
Al_O97192<br />
Figure 8: Circular phylogenetic tree <strong>of</strong> Tropomyosin with real branch lengths, created by Phyml. The gray<br />
shading indicates allergens.<br />
Jonas Hagberg November 10, 2006
26 5.2 20/80-method<br />
and the nodes thereby difficult <strong>to</strong> spot. All tropomyosins allergens are located on a separate<br />
branch, with an appreciable extension from other tropomyosins. Although allergens are on<br />
a single branch the phylogenetic distance between them is relatively wide.<br />
5.2 20/80-method<br />
Both protein families where tested; below is a raw dump from Matlab:<br />
Tropomyosin<br />
For file /home/jonas/MatlabWork/Alignments/Tropomyosins_New_add_PenA1+.out<br />
The following units have been calculated:<br />
The MSA is holding a <strong>to</strong>tal <strong>of</strong> 129 sequences with a aligned length <strong>of</strong> 684<br />
23 <strong>of</strong> them are Allergen and 106 is Non Allergen<br />
126 Conserved 20/80-<strong>co</strong>lumns in Allergen and 139 in Non-Allergen-set<br />
Equal sites : 77<br />
Unique Conserved <strong>co</strong>lumns in Allergen subset : 49<br />
Unique Conserved <strong>co</strong>lumns in NON Allergen subset : 62<br />
Equal Conserved <strong>co</strong>lumns with equal <strong>co</strong>nserved AminoAcid : 23<br />
Equal Conserved <strong>co</strong>lumns with Non-equal <strong>co</strong>nserved AminoAcid : 54<br />
Total different Columns : 165<br />
****************************************************************<br />
Parvalbumin<br />
For file /home/jonas/matlabWork/Alignments/Parvalbumins.out<br />
The following units have been calculated:<br />
The MSA is holding a <strong>to</strong>tal <strong>of</strong> 29 sequences with a aligned length <strong>of</strong> 114<br />
13 <strong>of</strong> them are Allergen and 16 is Non Allergen<br />
58 Conserved sites in Allergen and 62 sites in Non-Allergen-set<br />
Equal sites : 43<br />
Unique Conserved <strong>co</strong>lumns in Allergen subset : 15<br />
Unique Conserved <strong>co</strong>lumns in NON Allergen subset : 19<br />
Equal Conserved <strong>co</strong>lumns with equal <strong>co</strong>nserved AminoAcid : 10<br />
Equal Conserved <strong>co</strong>lumns with Non-equal <strong>co</strong>nserved AminoAcid : 33<br />
Total different Columns : 67<br />
These screen dumps illustrate how the different data-sets are organized. Since it turned<br />
out that all obtained 20/80-<strong>co</strong>lumns did also appear among the best-ranked <strong>co</strong>rrelated<br />
pairs (<strong>co</strong>lumn i and j) , as calculated by ELSC, focus was moved <strong>to</strong> the latter algorithm.<br />
5.3 ELSC<br />
A variety <strong>of</strong> graphical representations were made <strong>to</strong> promote visualization and analysis <strong>of</strong><br />
ELSC(i, j) (ELSC pairs) and the <strong>co</strong>rresponding s<strong>co</strong>res. A particularly suitable plot-type<br />
for this purpose is the one showing ELSC(i, j) as points in two dimensions. High s<strong>co</strong>res<br />
reflects strong <strong>co</strong>rrelation and pairs with high s<strong>co</strong>res are likely <strong>to</strong> actually reveal information<br />
on pertinent structure or function. To avoid blurred images many pairs <strong>of</strong> presumed low<br />
relevance were excluded from ac<strong>co</strong>rdingly created plots. Hence, in the majority <strong>of</strong> the plots<br />
only pairs with a s<strong>co</strong>re within 20% <strong>of</strong> the max s<strong>co</strong>re are shown.<br />
5.3.1 ELSC - sample-size-test<br />
ELSC -sample-size-tests were performed on the non-allergen tropomyosin subset. Results<br />
were visualized as a <strong>co</strong>n<strong>to</strong>ur plot. A <strong>co</strong>n<strong>to</strong>ur displays isolines <strong>of</strong> a matrix (X,Y,Z) where Z<br />
November 10, 2006 Jonas Hagberg
5.3 ELSC 27<br />
Pos in MSA<br />
100<br />
90<br />
80<br />
70<br />
60<br />
50<br />
40<br />
30<br />
20<br />
ELSC − Number test Tropomyosin Nonallergen<br />
50 runs <strong>of</strong> 23 randomly selected seqs among 106 non−alls<br />
Whole Non−allergen Subset ELSC−pairs (20% <strong>of</strong> max s<strong>co</strong>re)<br />
10 20 30<br />
Pos in MSA<br />
40 50 60<br />
Figure 9: Part <strong>of</strong> a Matlab <strong>co</strong>n<strong>to</strong>ur plot <strong>of</strong> ELSC-sample-size-test performed on the non-allergen<br />
tropomyosin dataset <strong>to</strong> study the stability against <strong>variation</strong> in the number <strong>of</strong> samples.<br />
is interpreted as heights with respect <strong>to</strong> the x −y plane. Fig.9 shows a typical <strong>co</strong>n<strong>to</strong>ur and<br />
a “ring”- plot <strong>of</strong> non-allergen tropomyosins. In Fig.9, X, Y-axis <strong>co</strong>rrespond <strong>to</strong> indicated<br />
<strong>positions</strong> in the MSA. ELSC pairs (i, j) that have a s<strong>co</strong>re value within 20% <strong>of</strong> the max<br />
ELSC s<strong>co</strong>re <strong>of</strong> that subset, are indicated as red circles. The height Z <strong>of</strong> every point i, j<br />
in the <strong>co</strong>n<strong>to</strong>ur <strong>co</strong>rresponds <strong>to</strong> the statistics <strong>of</strong> the ELSC-sample-size-test, the height is the<br />
number <strong>of</strong> times that pair (i, j) have an ELSC value that are within 20% <strong>of</strong> the max ELSC<br />
s<strong>co</strong>re <strong>of</strong> all 50 ELSC runs.<br />
Figure 9 clearly shows that even if only a few <strong>of</strong> the sequences are chosen, the pairs (i, j)<br />
with highest s<strong>co</strong>res <strong>co</strong>rrespond <strong>to</strong> the whole subset. The <strong>co</strong>n<strong>to</strong>urs are clearly aggregating<br />
around the red-circles, suggesting that any subset <strong>of</strong> sequences would give an output that<br />
essentially <strong>co</strong>ncurs with the entire set.<br />
5.3.2 Tropomyosin<br />
Figure 10 shows the result <strong>of</strong> two representative ELSC runs, where a pair (i, j) from the<br />
allergen subset having ELSC-s<strong>co</strong>re within 20% <strong>of</strong> the maximum ELSC-s<strong>co</strong>re is indicated<br />
Jonas Hagberg November 10, 2006<br />
50<br />
45<br />
40<br />
35<br />
30<br />
25<br />
20<br />
15<br />
10<br />
5
28 5.3 ELSC<br />
Pos in MSA<br />
350<br />
300<br />
250<br />
200<br />
150<br />
100<br />
50<br />
Tropomyosin ELSC−pairs + >90%<strong>co</strong>nserved<br />
>90% Conserved <strong>co</strong>lumns<br />
Non Allergen<br />
Allergen<br />
0<br />
0 50 100 150 Pos in MSA 200 250 300 350<br />
Figure 10: An i, j-plot <strong>of</strong> ELSC pairs from the two tropomyosin subset, plus a subplot that shows the<br />
<strong>co</strong>lumns that have a <strong>co</strong>nservation larger than 90%, Columns are indecated as blue X for the allergen subset<br />
and Red circles for the non-allergen subset. Clearly the allergen subset is more <strong>co</strong>nserved.<br />
as a blue X. Analogously, a red ring (O) indicates such a pair but for the non-allergen<br />
subset. Clearly there is a difference between the distributions <strong>of</strong> the two subsets <strong>of</strong> strong<br />
ELSC-pairs. Notably, those <strong>of</strong> non-allergens appear as two big clusters in the <strong>amino</strong>and<br />
carboxy-termini <strong>of</strong> the proteins, whereas the allergen <strong>co</strong>unterparts are fewer and scattered.<br />
ELSC-pair clusters <strong>of</strong> non-allergens suggest that the head and tail areas <strong>of</strong> the<br />
<strong>co</strong>ild-<strong>co</strong>il tropomyosin are functionally important. There are, however, barely any allergen<br />
ELSC-pairs in the head-tail areas. Allergen tropomyosins show, though, high degree<br />
<strong>of</strong> <strong>co</strong>nservation in the carboxy terminus region. This pattern extends more than halfway<br />
across the protein.<br />
With the aid <strong>of</strong> an experimental scanning approach, including IgE binding/peptide <strong>co</strong>mpetition<br />
assay, Reese et al. has identified several epi<strong>to</strong>pes <strong>of</strong> an allergen 3 tropomyosin [17].<br />
To examine whether the distribution <strong>of</strong> ELSC pairs in any way <strong>co</strong>incides with that <strong>of</strong><br />
epi<strong>to</strong>pes, the latter were translated <strong>to</strong> MSA-space, and plotted as ribbons in Figure 11.<br />
3 Pen a 1<br />
November 10, 2006 Jonas Hagberg
5.3 ELSC 29<br />
Pos in MSA<br />
350<br />
300<br />
250<br />
200<br />
150<br />
100<br />
50<br />
Tropomyosin + Epi<strong>to</strong>pes<br />
Epi<strong>to</strong>pe1<br />
Epi<strong>to</strong>pe2<br />
Epi<strong>to</strong>pe3<br />
Epi<strong>to</strong>pe4<br />
Epi<strong>to</strong>pe5<br />
Epi<strong>to</strong>pe6<br />
Non−allergen<br />
Allergen<br />
0<br />
0 50 100 150 200 250 300 350<br />
Pos in MSA<br />
Figure 11: Epi<strong>to</strong>pe-ribbon plot <strong>of</strong> tropomyosin.<br />
Each epi<strong>to</strong>pe has a given extension in the AA-sequence and the <strong>co</strong>rresponding ribbon-area<br />
in the plot visualize pairs that have any <strong>co</strong>lumn i or j within that area <strong>of</strong> the protein.<br />
Ac<strong>co</strong>rdingly if any pair <strong>of</strong> AA-<strong>positions</strong> (O or X) lies within a ribbon, either one or both<br />
<strong>positions</strong> is in the epi<strong>to</strong>pe area. Ac<strong>co</strong>rding <strong>to</strong> Figure.11 the allergen ELSC-pairs seem <strong>to</strong><br />
occur well outside the epi<strong>to</strong>pe representations, but some <strong>co</strong>upled pairs appear within and<br />
proximal <strong>to</strong> the ribbons. The most interesting areas are those, wherein two ribbons are<br />
overlaid, since a pair positioned within a ribbon-overlay indicates that it <strong>co</strong>rresponds <strong>to</strong><br />
<strong>co</strong>rrelated <strong>positions</strong> in two separate epi<strong>to</strong>pes. Such a match is not found in Figure.11,<br />
but many allergen pairs are located near several such ribbon-overlays. This pattern is<br />
especially prominent around the area shared by epi<strong>to</strong>pes 5 and 6.<br />
5.3.3 Parvalbumin<br />
Figure 12 shows the distribution <strong>of</strong> ELSC-pairs in an epi<strong>to</strong>pe-ribbon plot <strong>of</strong> the parvalbumin<br />
family. No distinct groups <strong>of</strong> <strong>co</strong>upled pairs can be spotted and, additionally, it is hard<br />
Jonas Hagberg November 10, 2006
30 5.4 ELSC + WRABL<br />
Pos in MSA<br />
120<br />
100<br />
80<br />
60<br />
40<br />
20<br />
Parvalbumin ELSC<br />
>90% Conserved<br />
Epi<strong>to</strong>pe1<br />
Epi<strong>to</strong>pe2<br />
Epi<strong>to</strong>pe3<br />
Epi<strong>to</strong>pe4<br />
Calcium−binding motif1<br />
Calcium−binding motif2<br />
Non−allergen<br />
Allergen<br />
0<br />
0 10 20 30 40 50<br />
Pos in MSA<br />
60 70 80 90 100<br />
Figure 12: A i, j-plot <strong>of</strong> ELSC pairs from the two parvalbumin subsets, with Epi<strong>to</strong>pe-Ribbon and one<br />
Ca 2+ -binding motif as a ribbon and the other as a bold line.<br />
<strong>to</strong> see any clear separation between the two datasets. The allergen subset has low ELSCs<strong>co</strong>re<br />
values. In order <strong>to</strong> enhance detection <strong>of</strong> allergen pairs, 22% <strong>of</strong> max-s<strong>co</strong>re was set as<br />
boundary <strong>to</strong> the allergen subset. The two subsets have two pairs with a perfect match.<br />
Apart from the allergen epi<strong>to</strong>pes the two Ca 2+ -binding-motifs are also shown as ribbons<br />
(Fig. 12). No clear <strong>co</strong>-occurrence between epi<strong>to</strong>pe ribbons and allergen ELSC-pairs is<br />
seen. A rather clear overlap between nonallergen ELSC pairs and the Ca 2+ -binding motifs<br />
is, however, evident in the plot.<br />
5.4 ELSC + WRABL<br />
The WRABL-translation procedure was <strong>co</strong>nducted on both <strong>of</strong> the major protein datasets<br />
used in this study. ELSC results <strong>of</strong> the tropomyosins MSA based on standard AA representation,<br />
as well as that <strong>of</strong> WRABL-en<strong>co</strong>ded AA are shown in Figure 13. The plot, being<br />
<strong>of</strong> the same type as shown earlier, depicts WRABL-ELSC pairs plotted in green <strong>co</strong>lor.<br />
Among the <strong>to</strong>p 100 non-allergen ELSC(i, j)-pairs based on regular AA representation and<br />
November 10, 2006 Jonas Hagberg
5.5 Structure prediction <strong>of</strong> mutant Pen a 1 31<br />
the <strong>to</strong>p 100 ELSC(i, j)-pairs using the WRABL translation, 35 pairs overlapped. Analogously,<br />
in the allergen set, the number <strong>of</strong> overlapping best pairs were 15. Thus, among<br />
the 100 highest ELSC s<strong>co</strong>res from analysis <strong>of</strong> both standard AA MSA and that based on<br />
WRABL translation the ratio <strong>of</strong> overlap was 35% and 15 % for non-allergens and allergens,<br />
respectively. The <strong>co</strong>rresponding results for parvalbumin dataset are similar, (data<br />
not shown).<br />
Pos in MSA<br />
350<br />
300<br />
250<br />
200<br />
150<br />
100<br />
50<br />
Tropomyosin AA−WRABL 100 best ELSC−pairs<br />
WRABL non−allergen<br />
WRABL allergen<br />
Non−allergen<br />
Allergen<br />
0<br />
0 50 100 150 200 250 300 350<br />
Pos in MSA<br />
Figure 13: Ordinary ELSC and WRABL translation, 100 best s<strong>co</strong>red ELSC-pairs.<br />
5.5 Structure prediction <strong>of</strong> mutant Pen a 1<br />
Gerald Reese et.al. has in a study created a mutant variant <strong>of</strong> the major shrimp allergen<br />
Pen a 1 whose allergic potency thereby was reduced by 90-98% [19]. Based on this<br />
and other tropomyosin sequence data, a goal in this study was <strong>to</strong> make two structure<br />
predictions, one <strong>of</strong> the original Pen a 1 and one <strong>of</strong> the mutated variant and then <strong>co</strong>mpare the<br />
two structures <strong>to</strong> see if any obvious differences would be revealed. SWISS-MODEL was able<br />
<strong>to</strong> predict a single stranded alpha-helix structure from the sequences, but the underlying<br />
template was the same for the two sequences. No significant structural differences in the<br />
two models are apparent. The 3D-JIGSAW predictions for the same sequences was almost<br />
identical <strong>to</strong> those <strong>of</strong> SWISS-MODEL and revealed only positional discrepancy where the<br />
mutation was applied, i.e. the exact location <strong>of</strong> AA dissimilarity.<br />
Jonas Hagberg November 10, 2006
32 6. Discussion<br />
Figure 14: Pymol superimposed render <strong>of</strong> SWISS-MODEL prediction <strong>of</strong> Pen a 1 (RED) and Mutant VR9-1<br />
(GREEN), The <strong>co</strong>lor Magenta indicates mutated position in the VR9-1 structure and the blue is the same<br />
position for Pen a 1.<br />
6 Discussion<br />
6.1 Robustness <strong>of</strong> ELSC<br />
The ELSC-sample-size-test clearly prove that ELSC still give reliable pairs even if only 23<br />
sequences <strong>of</strong> the non-allergen tropomyosin dataset were used. This moreover indicates that<br />
the allergen subset holds enough data for a reliable ELSC analysis. Ac<strong>co</strong>rding <strong>to</strong> a personal<br />
<strong>co</strong>mmunication with Anthony Fodor, a major developer <strong>of</strong> the ELSC-algorithm, ELSC can<br />
provide good results with as few as 15-20 sequences. On the other hand, several hundred<br />
sequences may give spurious outputs. The out<strong>co</strong>me is dependent on the phylogenetic<br />
relationship <strong>of</strong> sequences selected <strong>to</strong> the analysis. A dataset holding hundreds <strong>of</strong> sequences,<br />
that share high sequence similarity, is not as good as tens <strong>of</strong> sequences that <strong>co</strong>ver a wide<br />
phylogenetic space. Although Fodor hasn’t looked at the relationship between large number<br />
<strong>of</strong> sequences and performance <strong>of</strong> ELSC extensively, he has not yet seen any clear-cut<br />
<strong>co</strong>rrelation. The possibility that diversity is more important than size <strong>of</strong> the dataset advises<br />
the user <strong>to</strong> remove almost identical sequences from the alignment. This gives further<br />
strength <strong>to</strong> the ELSC approach with regards <strong>to</strong> the allergen subset, while it holds more<br />
sequences than the minimal number suggested by Fodor and since the phylogenetic analysis<br />
<strong>co</strong>nducted on the tropomyosin dataset shows a wide span in the allergen branch. Also the<br />
non-allergen set, en<strong>co</strong>mpassing 106 sequences, has a relatively wide phylogenetic span.<br />
In <strong>co</strong>mpliance with the above guidance, clustering <strong>of</strong> tropomyosins sequences with 90%<br />
identity was performed, in addition <strong>to</strong> analyses based on the entire sets <strong>of</strong> AA sequences.<br />
In <strong>to</strong>tal, 49 clusters were created and all sequences, except for the representative sequence<br />
<strong>of</strong> each cluster, were deleted. <strong>Analysis</strong> by ELSC was <strong>co</strong>nducted as described above. This<br />
November 10, 2006 Jonas Hagberg
6.2 In sili<strong>co</strong> analysis <strong>of</strong> tropomyosins 33<br />
operation didn’t appreciably change the identification <strong>of</strong> <strong>co</strong>-varying pairs, but the ELSC<br />
s<strong>co</strong>res were more evenly distributed in the allergen subset, and more pairs appeard whitin<br />
the 20% max-s<strong>co</strong>re border. Many sequences were deleted from the non-allergen dataset due<br />
<strong>to</strong> many clusters in that set. Still, the pairs were generally positioned on the same spots.<br />
The <strong>co</strong>nlusion is that filtering by percentage identity seems <strong>to</strong> be a good idea. Additional<br />
testing is, however, needed <strong>to</strong> draw firm <strong>co</strong>nclusions.<br />
ELSC can be very helpful <strong>to</strong> give <strong>positions</strong> that perhaps are important for allergenicity<br />
<strong>to</strong> test experimentally by site mutagenesis, <strong>to</strong> see if allergenicity is altered in one protein<br />
after a change in a AA in one or two position given by ELSC.<br />
6.2 In sili<strong>co</strong> analysis <strong>of</strong> tropomyosins<br />
6.2.1 Phylogeny<br />
As seen in figure 8 the tropomyosin dataset spans a wide phylogenetic space. Even though<br />
all allergens branch them self <strong>to</strong>gether under one node there is still quite an <strong>evolutionary</strong><br />
distance between them. This suggests that ELSC should give <strong>positions</strong> that actually are<br />
relevant.<br />
6.2.2 ELSC<br />
As evident from figure 10 the allergen ELSC-pairs appear at a greater distance from the<br />
diagonal <strong>of</strong> the plot. Intuitively, <strong>co</strong>-<strong>variation</strong> involving proximal <strong>amino</strong> <strong>acid</strong>s seems more<br />
likely than remote <strong>co</strong>unterparts <strong>to</strong> signify a <strong>co</strong>nformational <strong>co</strong>nnection, but folded proteins<br />
can bring <strong>to</strong>gether regions that are far apart in a linear <strong>amino</strong> <strong>acid</strong> sequence representation.<br />
Tropomyosins, though, <strong>co</strong>nsistently attain a rod like shape, which would rather favor a<br />
preference for proximal <strong>amino</strong> <strong>acid</strong>s as regards functional relevance. Nonetheless, these<br />
proteins are inter-twined α-helix dimers that may <strong>co</strong>nfer special requirements on the overall<br />
dimer <strong>co</strong>nfiguration, leading <strong>to</strong> possible dependencies also over <strong>co</strong>nsiderable distances.<br />
This suggests that, on the assumption that <strong>co</strong>-varying AA-<strong>positions</strong> in tropomyosins<br />
are functionally important, the <strong>co</strong>nnection between the allergen <strong>co</strong>lumns (i, j) indicate a<br />
different functional association, relative <strong>to</strong> that <strong>of</strong> non-allergens, whose <strong>co</strong>rrelation pattern<br />
mostly involves physically close <strong>positions</strong>. There are, however, also several <strong>co</strong>-varying<br />
<strong>positions</strong> among allergens on or close <strong>to</strong> the diagonal in the plot, where the i and j in a<br />
pair are close <strong>to</strong> each other. It is also important <strong>to</strong> keep in mind that the allergen subset<br />
is much smaller than that <strong>of</strong> non-allergens, which influences on the ELSC s<strong>co</strong>res. The max<br />
s<strong>co</strong>re <strong>of</strong> the allergen subset is roughly 22% <strong>of</strong> that <strong>of</strong> the nonallergen subset ( 12.7949).<br />
The<br />
58.5115<br />
two clusters <strong>of</strong> pairs with high ELSC-s<strong>co</strong>res, present in the head-tail areas <strong>of</strong> the protein,<br />
justifies the assumption that these segments are important, presumably <strong>to</strong> the interaction<br />
with actin. This pattern was, however, not seen among allergen tropomyosins. This finding<br />
may appear unexpected, but the allergen subset is very <strong>co</strong>nserved (>90%) in these regions,<br />
particularty in the carboxy terminus, and highly <strong>co</strong>nserved <strong>co</strong>lumns give low ELSC-s<strong>co</strong>res.<br />
Jonas Hagberg November 10, 2006
34 6.3 In sili<strong>co</strong> analysis <strong>of</strong> parvalbumins<br />
Hence the lack <strong>of</strong> allergen pairs in those areas should be seen in the <strong>co</strong>ntent <strong>of</strong> <strong>co</strong>nserved<br />
AA <strong>positions</strong> in the same regions.<br />
In figure 11 ribbon segments indicate experimentally verified IgE epi<strong>to</strong>pes in allergen<br />
tropomyosins. This is <strong>to</strong> depict whether ELSC-pairs (Circles or X-marks) fall outside or<br />
within such stretches. The ELSC pairs that are located near ribbons may tentatively indicate<br />
that sites just outside some <strong>of</strong> the epi<strong>to</strong>pes are important for the maintenance <strong>of</strong><br />
structural integrity <strong>of</strong> those immunoglobulin E-binding sites, or segments otherwise related<br />
<strong>to</strong> allergenicity. It is important <strong>to</strong> realize that epi<strong>to</strong>pe data are derived from one allergen<br />
only, but the ELSC pairs are <strong>co</strong>nstructed from all the entire set <strong>of</strong> 23 allergens. Ac<strong>co</strong>rdingly,<br />
some discrepancies between the distribution <strong>of</strong> epi<strong>to</strong>pes may occur across allergen<br />
tropomyosins. Nevertheless, extensive IgE cross-reactivity suggests modest differences in<br />
this respect. The spotted ELSC-pair locations in the vicinity <strong>of</strong> certain epi<strong>to</strong>pes pairs suggest<br />
that changes <strong>of</strong> <strong>co</strong>-varying AA pairs in such regions may <strong>co</strong>nfer drastic modification <strong>of</strong><br />
epi<strong>to</strong>pe structure. Consequently, this may enable <strong>co</strong>nstruction <strong>of</strong> hypoallergenic variants<br />
through subtle and well targeted <strong>amino</strong> <strong>acid</strong> replacements.<br />
The analysis <strong>of</strong> <strong>co</strong>-varying AA <strong>positions</strong>, in <strong>co</strong>njunction with tropomyosin epi<strong>to</strong>pe data,<br />
for a single protein only, support the <strong>co</strong>njecture that ELSC pairs can show allergen important<br />
sites.<br />
An appreciably larger number <strong>of</strong> AA-sequence-characterized allergen tropomyosins is<br />
likely <strong>to</strong> improve the ELSC analysis and give more strength <strong>to</strong> potentially important sites.<br />
Conversely, more data about the proteins, such as epi<strong>to</strong>pe etc. <strong>co</strong>uld help support the<br />
utility <strong>of</strong> ELSC.<br />
6.2.3 Structure prediction no good at all<br />
As learnt from this study, The homology prediction <strong>of</strong> tropomyosin variants, as ac<strong>co</strong>mplished<br />
by SWISS-MODEL and 3D-JIGSAW and based on defined structural templates,<br />
is simply insufficient <strong>to</strong> disclose small differences in the tertiary structure. The few AA<br />
changes between the original Pen A1 and the mutated <strong>co</strong>unterpart give the same template<br />
in two prediction runs, each based on a distinct algorithm. Moreover, there are a limited<br />
number <strong>of</strong> templates in PDB <strong>to</strong> chose from. Furthermore, the predicted structures<br />
<strong>co</strong>nsist <strong>of</strong> only one tropomyosin α-helix hence the important <strong>co</strong>iled-<strong>co</strong>il structure does<br />
not appear in the predictions. If also allergen tropomyosin was available as an experimentally<br />
defined structure subtle structural differences between allergen and non-allergen<br />
tropomyosins would be available <strong>to</strong> analysis, including in sili<strong>co</strong> homology modeling.<br />
6.3 In sili<strong>co</strong> analysis <strong>of</strong> parvalbumins<br />
6.3.1 Phylogeny<br />
As seen in figure 7 the parvalbumin dataset spans over a relatively wide <strong>evolutionary</strong><br />
distance, although most <strong>of</strong> the allergens cluster on one branch <strong>of</strong> the tree. This includes<br />
November 10, 2006 Jonas Hagberg
6.4 ELSC + WRABL 35<br />
both mammalian and fish sequences, which is <strong>to</strong> be <strong>co</strong>nsidered as good for ELSC studies.<br />
The allergen subset is also quite diverse. Notably two separate sequences appears <strong>to</strong> bee<br />
more related <strong>to</strong> several non-allergen sequences.<br />
6.3.2 ELSC<br />
The parvalbumin data set, used in this study is much smaller than that <strong>of</strong> tropomyosins.<br />
In <strong>to</strong>tal the reposi<strong>to</strong>ry en<strong>co</strong>mpassed 29 parvalbumins. As mentioned earlier, Fodor states<br />
that at least 15-20 sequences are needed <strong>to</strong> produce reliable ELSC results provided that a<br />
wide phylogenetic relationship is <strong>co</strong>vered. The allergen subset did unfortunately not fulfill<br />
this requirement. Still, some accumulation <strong>of</strong> <strong>co</strong>-varying <strong>positions</strong> occurred in and on the<br />
border <strong>of</strong> one <strong>of</strong> the Ca 2+ -binding regions that overlap the segment <strong>of</strong> epi<strong>to</strong>pe 4. This<br />
pattern was, however, seen in non-allergen parvalbumins only. The accumulation <strong>of</strong> nonallergen<br />
pairs in the epi<strong>to</strong>pe 4 segment is probably due <strong>to</strong> <strong>to</strong> the overlapping Ca 2+ -binding<br />
region. A larger dataset, especially on allergen parvalbumins, may reveal insight in the<br />
significance <strong>of</strong> the possible importance <strong>of</strong> the vaguely identified regions.<br />
6.4 ELSC + WRABL<br />
There are several other ways <strong>to</strong> group AAs, but the WRABL approach was chosen because<br />
it is founded on a meticulous analysis and is one among the newest methods available for<br />
this purpose.<br />
A major rationale for using WRABL aggregation was <strong>to</strong> investigate whether any <strong>of</strong><br />
the <strong>co</strong>rrelating AA-ELSC(i, j)-pairs, showing a mutation from one functional group <strong>to</strong><br />
another (in a WRABL <strong>co</strong>ntex) in the first position i that is ac<strong>co</strong>mpanied by a change<br />
<strong>of</strong> functional group <strong>of</strong> the <strong>amino</strong> <strong>acid</strong> in position j. A mutation leading <strong>to</strong> a change <strong>of</strong><br />
functional group <strong>of</strong> that position should be less <strong>co</strong>mmon than those occurring within such a<br />
group. An ELSC(i, j)-pair yielding high s<strong>co</strong>res in ELSC procedures, using both the regular<br />
AA-MSA as well as after WRABL-translation, <strong>co</strong>uld indicate a particular functional or<br />
structural importance <strong>of</strong> such a pair. The results showing the ratio <strong>of</strong> overlapping ELSC<br />
pairs indicate that the non-allergen set has more sites that includes cross-over mutations<br />
between functional groups than the allergen data-set. A possible explanation for this<br />
observation is that the smaller allergen dataset is more <strong>co</strong>nserved and all sequences being<br />
<strong>of</strong> the invertebrate kind, and less diverse than the vertebrate non-allergen data-set.<br />
A browse through several individual ELSC(i, j)-pairs, identified one that drew special<br />
attention: The allergen ELSC(229, 238)-pair appears in both WRABL- and regular AA-<br />
ELSC runs. In both <strong>positions</strong> (i = 229 and j = 238) a change from one functional<br />
group <strong>to</strong> another had occurred in 6 sequences, excerpt from MSA are shown in Table 4.<br />
An inspection <strong>of</strong> the circular phylogenetic tree <strong>of</strong> tropomyosin (figure 8) the 6 sequences<br />
belongs <strong>to</strong> the lower right group/branch <strong>of</strong> the allergens (the group that have the allergen<br />
seq Al Q95WY0). Hence, increased frequency <strong>of</strong> cross-over mutations and thereby also<br />
overlapping ELSC(i, j)-pairs is seen in a set <strong>of</strong> related sequences <strong>of</strong> diverse phylogenetic<br />
Jonas Hagberg November 10, 2006
36 7. Acknowledgments<br />
relationship. The example allergen ELSC(229, 238)-pair, also strengthen the idea that<br />
Al O18416 A D L E R A E E R A<br />
Al O44119 A D L E R A E E R A<br />
Al O61379 A D L E R A E E R A<br />
Al O96764 A D L E R A E E R A<br />
Al Q25456 A D L E R A E E R A<br />
Al Q8T6L5 A D L E R A E E R A<br />
Al Q7M3Y8 V D L E R A E A R L<br />
Al O97192 V D L E R A E A R L<br />
Al Q95WY0 V D L E R A E A R L<br />
Al Q9GZ69 V D L E R A E T R L<br />
Al Q9GZ70 V D L E R A E A R L<br />
Al Q9GZ71 V D L E R A E A R L<br />
Position 229 238<br />
Table 4: Excerpt from tropomyosin MSA, showing AA at position i = 229 <strong>to</strong> j = 238. Color indicates<br />
functional groups where Green is the “small” group and the Aquamarine indicates the Aliphatic (The gray<br />
shading is intermediate AAs). In the full MSA the major AA on position 229 and 238 is the Alanine (A)<br />
this indicates that a change from A <strong>to</strong> V or L has occurred. The 6 sequences holding the Aquamarine<br />
Aliphatic mutations is the ones that are branched <strong>to</strong>gether in the phylogenetic tree.<br />
overlapping ELSC(i, j)-pair <strong>co</strong>uld pin-point <strong>positions</strong> <strong>of</strong> special functional importance.<br />
The appearance <strong>of</strong> the 6 sequences on a <strong>co</strong>mmon major branch indicates that the changes<br />
in AA position 229 and 238 roughly <strong>co</strong>incided in (the evolution) time and, thus, causally<br />
linked events. Thus, on this provision, the <strong>positions</strong> are <strong>of</strong> such importance for the function<br />
<strong>of</strong> the protein that a mutation at pos i = 229 will induce a mutation at pos j = 238, or<br />
vice versa.<br />
The <strong>co</strong>nfiguration <strong>of</strong> the tropomyosin protein en<strong>co</strong>mpassing two parallel helices in a<br />
<strong>co</strong>iled-<strong>co</strong>il structure makes it difficult <strong>to</strong> intuitively identify <strong>co</strong>rrelations <strong>of</strong> great importance<br />
<strong>to</strong> protein function. Is the ELSC(i, j)-pair an intra helix <strong>co</strong>rrelation or a a helix-helix<br />
<strong>co</strong>rrelation? Pairs that have i and j very close <strong>to</strong> each other may indicate <strong>co</strong>rrelations that<br />
are important <strong>to</strong> the <strong>co</strong>il-<strong>co</strong>iled structure. Due <strong>to</strong> the parallel helix <strong>co</strong>nformation those<br />
pairs are also close between the helices.<br />
ELSC runs with both regular AAs and WRABL <strong>co</strong>uld give deepened insight in <strong>positions</strong><br />
<strong>of</strong> particular relevance <strong>to</strong> protein structure. Identification <strong>of</strong> such <strong>positions</strong> <strong>co</strong>uld further<br />
improve <strong>co</strong>nstruction <strong>of</strong> hypoallergenic variants.<br />
7 Acknowledgments<br />
I would like <strong>to</strong> thank my supervisor Daniel Soeria-Atmadja and Ulf Hammerling for great<br />
support and all the different inputs on this project, and my scientific reviewer Mats<br />
November 10, 2006 Jonas Hagberg
7 REFERENCES 37<br />
Gustafsson at the Department <strong>of</strong> Engineering Sciences, Uppsala University. My opponents<br />
Jonathan Alvarsson and Christan Rutemark for reading and helping me improve<br />
this report. Anthony Fodor for being so helpful and when given me fast E-mail replays.<br />
Thank you National Food Administration for free C<strong>of</strong>fee and fruit and friendly <strong>co</strong>lleagues!<br />
Moreover I thank HKF for putting up with me this stressful months “sempre fistel”! Finally<br />
my wonderful Marie for supporting me with lunch boxes and for bringing me home<br />
<strong>to</strong> bed at late nights!<br />
7 References<br />
[1] S. Saha and G. P. Raghava. Algpred: prediction <strong>of</strong> allergenic proteins and mapping<br />
<strong>of</strong> ige epi<strong>to</strong>pes. Nucleic Acids Res, 34(Web Server issue), 2006.<br />
[2] D. Soeria-Atmadja, T. Lundell, M. G. Gustafsson, and U. Hammerling. Computational<br />
detection <strong>of</strong> allergenic proteins attains a new level <strong>of</strong> accuracy with in sili<strong>co</strong><br />
variable-length peptide extraction and machine learning. Nucleic Acids Res,<br />
34(13):3779–3793, 2006.<br />
[3] R. C. Aalberse and B. M. Stadler. In sili<strong>co</strong> predictability <strong>of</strong> allergenicity: from <strong>amino</strong><br />
<strong>acid</strong> sequence via 3-d structure <strong>to</strong> allergenicity. Mol Nutr Food Res, 50(7):625–627,<br />
2006.<br />
[4] M. Jackson. Allergy: the making <strong>of</strong> a modern plague. Clinical & Experimental Allergy,<br />
31(11):1665–1671, 2001.<br />
[5] S. L. Hefle, J. A. Nordlee, and S. L. Taylor. Allergenic foods. Crit Rev Food Sci Nutr,<br />
36 Suppl, 1996.<br />
[6] T. P. King, D. H<strong>of</strong>fman, H. Lowenstein, D. G. Marsh, T. A. Platts-Mills, and<br />
W. Thomas. Allergen nomenclature. who/iuis allergen nomenclature sub<strong>co</strong>mmittee.<br />
Int Arch Allergy Immunol, 105(3):224–233, 1994.<br />
[7] A. Schlessinger, Y. Ofran, G. Yachdav, and B. Rost. Epi<strong>to</strong>me: database <strong>of</strong> structureinferred<br />
antigenic epi<strong>to</strong>pes. Nucleic Acids Res, 34(Database issue), 2006.<br />
[8] J. A. Nordlee, S. L. Taylor, J. A. Townsend, L. A. Thomas, and R. K. Bush. Identification<br />
<strong>of</strong> a brazil-nut allergen in transgenic soybeans. N Engl J Med, 334(11):688–692,<br />
1996.<br />
[9] FAO/WHO. Evaluation <strong>of</strong> allergenicity <strong>of</strong> genetically modified foods. Technical report,<br />
Joint FAO/WHO Expert Consultation on Allergenicity <strong>of</strong> Foods Derived from<br />
Biotechnology, 2001.<br />
Jonas Hagberg November 10, 2006
38 7 REFERENCES<br />
[10] Codex Alimentarius. Codex alimentarius <strong>co</strong>mmission. report <strong>of</strong> the fourth session <strong>of</strong><br />
the <strong>co</strong>dex ad hoc intergovernmental task force on foods derived from biotechnology<br />
(alinorm 03/34a). Technical report, Codex Alimentarius Commission, 2003.<br />
[11] EFSA. Guidance document <strong>of</strong> the scientific panel on genetically modified organisms<br />
for the risk assessment <strong>of</strong> genetically modified plants and derived food and feed. The<br />
EFSA Journal, 99:1–94, 2004.<br />
[12] K. Bailey. Tropomyosin: a new asymmetric protein <strong>co</strong>mponent <strong>of</strong> the muscle fibril.<br />
Biochemical J, 43:271–287, 1948.<br />
[13] F. G. Whitby and G. N. Phillips. Crystal structure <strong>of</strong> tropomyosin at 7 angstroms<br />
resolution. Proteins, 38(1):49–59, 2000.<br />
[14] Wg Lewis and Lb Smillie. The <strong>amino</strong> <strong>acid</strong> sequence <strong>of</strong> rabbit cardiac tropomyosin. J.<br />
Biol. Chem., 255(14):6854–6859, 1980.<br />
[15] RCSB PDB Research Collabora<strong>to</strong>ry for Structural Bioinformatics The Protein<br />
Data Bank. http://www.pdb.org/, 3 August 2006.<br />
[16] W.L. DeLano. The pymol molecular graphics system, http://www.pymol.org, 27 August<br />
2006.<br />
[17] R. Ayuso, S. B. Lehrer, and G. Reese. Identification <strong>of</strong> <strong>co</strong>ntinuous, allergenic regions<br />
<strong>of</strong> the major shrimp allergen pen a 1 (tropomyosin). Int Arch Allergy Immunol,<br />
127(1):27–37, 2002.<br />
[18] B. M. Wolska and D. M. Wieczorek. The role <strong>of</strong> tropomyosin in the regulation <strong>of</strong><br />
myocardial <strong>co</strong>ntraction and relaxation. Pflugers Arch, 446(1):1–8, 2003.<br />
[19] Gerald Reese, Julia Viebranz, Susan M. Leong-Kee, Matthew Plante, Iris Lauer, Stefanie<br />
Randow, Mar S. Moncin, Rosalia Ayuso, Samuel B. Lehrer, and Stefan Vieths.<br />
Reduced allergenic potency <strong>of</strong> vr9-1, a mutant <strong>of</strong> the major shrimp allergen pen a 1<br />
(tropomyosin). J Immunol, 175(12):8354–8364, 2005.<br />
[20] Allergome database. http://www.allergome.org, 12 July 2006.<br />
[21] Eva Untersmayr, Krisztina Szalai, Angelika B. Riemer, Wolfgang Hemmer, Ines Swoboda,<br />
Brigitte Hantusch, Isabella Scholl, Susanne Spitzauer, Ot<strong>to</strong> Scheiner, and Reinhart<br />
Jarisch. Mimo<strong>to</strong>pes identify <strong>co</strong>nformational epi<strong>to</strong>pes on parvalbumin, the major<br />
fish allergen. Molecular Immunology, 43(9):1454–1461, 2006.<br />
[22] C. D. Lindstrm, T. van D, I. Hordvik, C. Endresen, and S. Elsayed. Cloning <strong>of</strong> two<br />
distinct cdnas en<strong>co</strong>ding parvalbumin, the major allergen <strong>of</strong> atlantic salmon (salmo<br />
salar). Scand J Immunol, 44(4):335–344, 1996.<br />
November 10, 2006 Jonas Hagberg
7 REFERENCES 39<br />
[23] S. Elsayed and H. Bennich. The primary structure <strong>of</strong> allergen m from <strong>co</strong>d. Scand J<br />
Immunol, 4(2):203–208, 1975.<br />
[24] C. Hilger, F. Grigioni, L. Thill, L. Mertens, and F. Hentges. Severe ige-mediated<br />
anaphylaxis following <strong>co</strong>nsumption <strong>of</strong> fried frog legs: definition <strong>of</strong> alpha-parvalbumin<br />
as the allergen in cause. Allergy, 57(11):1053–1058, 2002.<br />
[25] V. D. Kumar, L. Lee, and B. F. Edwards. Refined crystal structure <strong>of</strong> calcium-liganded<br />
carp parvalbumin 4.25 at 1.5-a resolution. Biochemistry, 29(6):1404–1412, 1990.<br />
[26] Agnes Bugajska-Schretter, Lena Elfman, Thomas Fuchs, Sonja Kapiotis, Helmut<br />
Rumpold, Rudolf Valenta, and Susanne Spitzauer. Parvalbumin, a cross-reactive fish<br />
allergen, <strong>co</strong>ntains ige-binding epi<strong>to</strong>pes sensitive <strong>to</strong> periodate treatment and ca2+ depletion.<br />
Journal <strong>of</strong> Allergy and Clinical Immunology, 101(1):67–74, 1998.<br />
[27] J. P. Dekker, A. Fodor, R. W. Aldrich, and G. Yellen. A perturbation-based method for<br />
calculating explicit likelihood <strong>of</strong> <strong>evolutionary</strong> <strong>co</strong>-variance in multiple sequence alignments.<br />
Bioinformatics, 20(10):1565–1572, 2004.<br />
[28] E. Neher. How frequent are <strong>co</strong>rrelated changes in families <strong>of</strong> protein sequences? Proc<br />
Natl Acad Sci U S A, 91(1):98–102, 1994.<br />
[29] Werner Terhalle and Andreas Dress. Positional dependence, cliques, and predictive<br />
motifs in the bhlh protein domain. Journal <strong>of</strong> Molecular Evolution, 48(5):501–516,<br />
1999.<br />
[30] S. M. Larson, A. A. Di Nardo, and A. R. Davidson. <strong>Analysis</strong> <strong>of</strong> <strong>co</strong><strong>variation</strong> in an sh3<br />
domain sequence alignment: applications in tertiary <strong>co</strong>ntact prediction and the design<br />
<strong>of</strong> <strong>co</strong>mpensating hydrophobic <strong>co</strong>re substitutions. J Mol Biol, 303(3):433–446, 2000.<br />
[31] Steve W. Lockless and Rama Ranganathan. Evolutionarily <strong>co</strong>nserved pathways <strong>of</strong><br />
energetic <strong>co</strong>nnectivity in protein families. Science, 286(5438):295–299, 1999.<br />
[32] James O. Wrabl and Nick V. Grishin. Grouping <strong>of</strong> <strong>amino</strong> <strong>acid</strong> types and extraction <strong>of</strong><br />
<strong>amino</strong> <strong>acid</strong> properties from multiple sequence alignments using variance maximization.<br />
Proteins: Structure, Function, and Bioinformatics, 61(3):523–534, 2005.<br />
[33] D. Petrey and B. Honig. Protein structure prediction: inroads <strong>to</strong> biology. Mol Cell,<br />
20(6):811–819, 2005.<br />
[34] SWISS-MODEL. http://swissmodel.expasy.org, 27 August 2006.<br />
[35] P. A. Bates, L. A. Kelley, R. M. MacCallum, and M. J. Sternberg. Enhancement <strong>of</strong><br />
protein modeling by human intervention in applying the au<strong>to</strong>matic programs 3d-jigsaw<br />
and 3d-pssm. Proteins, Suppl 5:39–46, 2001.<br />
Jonas Hagberg November 10, 2006
40 7 REFERENCES<br />
[36] Structural Database <strong>of</strong> Allergenic Proteins SDAP.<br />
http://fermi.utmb.edu/sdap/index.html, 10 July 2006.<br />
[37] C. H. Wu, R. Apweiler, A. Bairoch, D. A. Natale, W. C. Barker, B. Boeckmann,<br />
S. Ferro, E. Gasteiger, H. Huang, R. Lopez, M. Magrane, M. J. Martin, R. Mazumder,<br />
C. O’Donovan, N. Redaschi, and B. Suzek. The universal protein resource (uniprot):<br />
an expanding universe <strong>of</strong> protein information. Nucleic Acids Res, 34(Database issue),<br />
2006.<br />
[38] FASTA format description. http://www.ncbi.nlm.nih.gov/blast/fasta.shtml, 12 August<br />
2006.<br />
[39] T. Lassmann and E. L. Sonnhammer. Kalign–an accurate and fast multiple sequence<br />
alignment algorithm. BMC Bioinformatics, 6, 2005.<br />
[40] J. D. Thompson, D. G. Higgins, and T. J. Gibson. Clustal w: improving the sensitivity<br />
<strong>of</strong> progressive multiple sequence alignment through sequence weighting, <strong>positions</strong>pecific<br />
gap penalties and weight matrix choice. Nucleic Acids Res, 22(22):4673–4680,<br />
1994.<br />
[41] R. C. Edgar. Muscle: multiple sequence alignment with high accuracy and high<br />
throughput. Nucleic Acids Res, 32(5):1792–1797, 2004.<br />
[42] C. Notredame, D. G. Higgins, and J. Heringa. T-c<strong>of</strong>fee: A novel method for fast and<br />
accurate multiple sequence alignment. J Mol Biol, 302(1):205–217, 2000.<br />
[43] S. Guindon and O. Gascuel. A simple, fast, and accurate algorithm <strong>to</strong> estimate large<br />
phylogenies by maximum likelihood. Syst Biol, 52(5):696–704, 2003.<br />
[44] O. Gascuel. Bionj: an improved version <strong>of</strong> the nj algorithm based on a simple model<br />
<strong>of</strong> sequence data. Mol Biol Evol, 14(7):685–695, 1997.<br />
[45] T. Lassmann and E. L. Sonnhammer. Kalign, kalignvu and mumsa: web servers for<br />
multiple sequence alignment. Nucleic Acids Res, 34(Web Server issue), 2006.<br />
[46] Carolin Kosiol and Nick Goldman. Different Versions <strong>of</strong> the Dayh<strong>of</strong>f Rate Matrix.<br />
Mol Biol Evol, 22(2):193–199, 2005.<br />
[47] MATLAB The MathWorks. http://www.mathworks.<strong>co</strong>m/, 20 August 2006.<br />
[48] Gen<strong>to</strong>o Linux. on world wide web http://www.gen<strong>to</strong>o.org, 5 August 2006.<br />
[49] OpenSSI (Single System Image) Clusters for Linux. http://openssi.org/, 27 August<br />
2006.<br />
[50] The openMosix Project. http://openmosix.sourceforge.net/, 27 June 2006.<br />
November 10, 2006 Jonas Hagberg