SRI in Orissa - Cornell International Institute for Food, Agriculture ...
SRI in Orissa - Cornell International Institute for Food, Agriculture ...
SRI in Orissa - Cornell International Institute for Food, Agriculture ...

You also want an ePaper? Increase the reach of your titles
YUMPU automatically turns print PDFs into web optimized ePapers that Google loves.
<strong>in</strong> rest of India needs several learn<strong>in</strong>g alliances if it wants<br />
to live up to the ris<strong>in</strong>g expectations from farmers across the<br />
state and country. In this we draw upon <strong>SRI</strong> experiences<br />
both <strong>in</strong> India and the rest of the world. We argue that <strong>SRI</strong><br />
as an <strong>in</strong>novation that is complex and constantly evolv<strong>in</strong>g<br />
and dynamic needs a different k<strong>in</strong>d of system architecture.<br />
One that can not only keep pace with the evolv<strong>in</strong>g nature<br />
of knowledge – technical and <strong>in</strong>stitutional, but also one<br />
that can enable the faster generation and dissem<strong>in</strong>ation of<br />
new knowledge, or <strong>in</strong>novation <strong>in</strong> short. For this to happen<br />
learn<strong>in</strong>g alliances that build trust and synergise <strong>in</strong><strong>for</strong>mation<br />
flow across diverse actors are necessary.<br />
Rice <strong>in</strong> <strong>Orissa</strong><br />
<strong>Orissa</strong> state is a part of the South Eastern Indian subcont<strong>in</strong>ent,<br />
spread<strong>in</strong>g through a geographical area of 155,707 sq. km. It<br />
extends from 17.5 N to 22.8 N <strong>in</strong> latitude and 81.2 E to 87.6<br />
E <strong>in</strong> longitude. The state has a cultivated area (net area sown<br />
and current fallow) of 6.4m ha of a total geographical area<br />
of 15.5m ha out of which 2.9m ha are high land, 1.9m ha<br />
medium land and 1.6m ha low lands. The gross cropped area<br />
is 8.4m ha. Rice is the most important food crop <strong>in</strong> <strong>Orissa</strong><br />
grown throughout the state cover<strong>in</strong>g over 53 % of the gross<br />
cropped area, often as a s<strong>in</strong>gle crop though with tremendous<br />
diversity of rice varieties. The Jeypore tract of Koraput district<br />
<strong>in</strong> <strong>Orissa</strong> is recognised as one of the secondary centres of<br />
orig<strong>in</strong> of cultivated rice <strong>in</strong> the world. The lat<strong>in</strong> name of rice<br />
Oryza Sativa is believed to derive its orig<strong>in</strong> from <strong>Orissa</strong> or<br />
Odra Desha that means the land of cultivators.<br />
The cropp<strong>in</strong>g <strong>in</strong>tensity is quite low <strong>in</strong> comparison to other<br />
states of India and most parts of the state do not have<br />
a second crop. The climatic conditions and landhold<strong>in</strong>g<br />
pattern (predom<strong>in</strong>antly small holder) has meant that<br />
farm<strong>in</strong>g is largely subsistence and ra<strong>in</strong>fed with low use of<br />
<strong>in</strong>puts. Despite several <strong>in</strong>terventions <strong>in</strong> the past to improve<br />
productivity, there seems to be a mismatch between<br />
technological ef<strong>for</strong>ts and farmers’ practices result<strong>in</strong>g <strong>in</strong><br />
large yield gaps and stagnant and even decl<strong>in</strong><strong>in</strong>g agricultural<br />
productivity. 4<br />
Details of the production patterns of rice <strong>in</strong> the state<br />
have been analysed <strong>in</strong> the follow<strong>in</strong>g chapters (see Tables<br />
2.1 and 2.2, Figure 3.1 on rice productivity <strong>in</strong> comparison<br />
with Indian average). In this chapter we present some<br />
<strong>in</strong><strong>for</strong>mation on the vagaries of rice production across the<br />
2<br />
Towards a Learn<strong>in</strong>g Alliance: <strong>SRI</strong> <strong>in</strong> <strong>Orissa</strong><br />
thirty districts of <strong>Orissa</strong>. Rice is grown <strong>in</strong> all the districts<br />
of the state with vary<strong>in</strong>g <strong>in</strong>tensity depend<strong>in</strong>g on the<br />
topography. The percentage of rice as total cropped area<br />
is higher <strong>in</strong> the coastal pla<strong>in</strong> areas such as Puri, Bhadrak,<br />
Kendrapara and Balasore where the percentage is over 90%<br />
whilst <strong>for</strong> districts such as Koraput, Gajapati and Rayagada<br />
these figures are under 40% (refer to Appendix 1.1).<br />
Apart from the low level of yields <strong>in</strong> the state overall and<br />
across districts, there is a lot of fluctuation from year to<br />
year. The variation <strong>in</strong> productivity across time is <strong>in</strong>dicated<br />
<strong>in</strong> Appendix 1.2 <strong>for</strong> a five year time period (1999-2000<br />
to 2003-04) and <strong>in</strong>dicates that all districts are affected<br />
by seasonality and have wide fluctuations <strong>in</strong> productivity.<br />
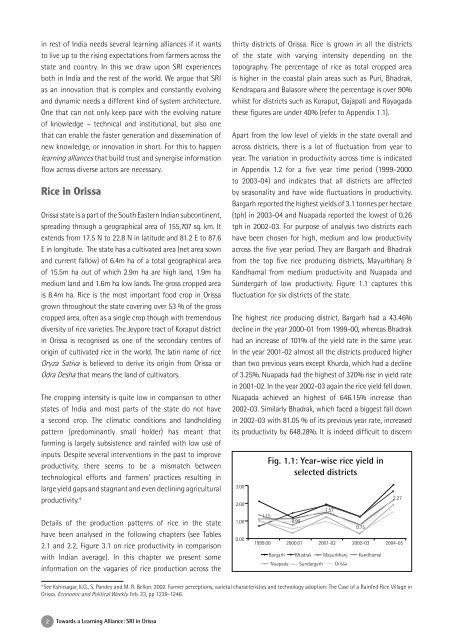
Bargarh reported the highest yields of 3.1 tonnes per hectare<br />
(tph) <strong>in</strong> 2003-04 and Nuapada reported the lowest of 0.26<br />
tph <strong>in</strong> 2002-03. For purpose of analysis two districts each<br />
have been chosen <strong>for</strong> high, medium and low productivity<br />
across the five year period. They are Bargarh and Bhadrak<br />
from the top five rice produc<strong>in</strong>g districts, Mayurbhanj &<br />
Kandhamal from medium productivity and Nuapada and<br />
Sundergarh of low productivity. Figure 1.1 captures this<br />
fluctuation <strong>for</strong> six districts of the state.<br />
The highest rice produc<strong>in</strong>g district, Bargarh had a 43.46%<br />
decl<strong>in</strong>e <strong>in</strong> the year 2000-01 from 1999-00, whereas Bhadrak<br />
had an <strong>in</strong>crease of 101% of the yield rate <strong>in</strong> the same year.<br />
In the year 2001-02 almost all the districts produced higher<br />
than two previous years except Khurda, which had a decl<strong>in</strong>e<br />
of 3.25%. Nuapada had the highest of 320% rise <strong>in</strong> yield rate<br />
<strong>in</strong> 2001-02. In the year 2002-03 aga<strong>in</strong> the rice yield fell down.<br />
Nuapada achieved an highest of 646.15% <strong>in</strong>crease than<br />
2002-03. Similarly Bhadrak, which faced a biggest fall down<br />
<strong>in</strong> 2002-03 with 81.05 % of its previous year rate, <strong>in</strong>creased<br />
its productivity by 648.28%. It is <strong>in</strong>deed difficult to discern<br />
4 See Kshirsagar, K.G., S. Pandey and M. R. Bellon. 2002. Farmer perceptions, varietal characteristics and technology adoption: The Case of a Ra<strong>in</strong>fed Rice Village <strong>in</strong><br />
<strong>Orissa</strong>. Economic and Political Weekly. Feb. 23, pp 1239-1246.<br />
3.00<br />
2.00<br />
1.00<br />
0.00<br />
1.15<br />
Fig. 1.1: Year-wise rice yield <strong>in</strong><br />
selected districts<br />
0.99<br />
1.57<br />
0.75<br />
1999.00 2000.01 2001-02 2002-03 2004-05<br />
Bargarh Bhadrak Mayurbhanj Kandhamal<br />
Nuapada Sundargarh <strong>Orissa</strong><br />
2.27