A gap or a chasm? - National Police Library Online Catalogue
A gap or a chasm? - National Police Library Online Catalogue
A gap or a chasm? - National Police Library Online Catalogue

You also want an ePaper? Increase the reach of your titles
YUMPU automatically turns print PDFs into web optimized ePapers that Google loves.
A <strong>gap</strong> <strong>or</strong> a <strong>chasm</strong>? Attrition in rep<strong>or</strong>ted rape cases<br />
26<br />
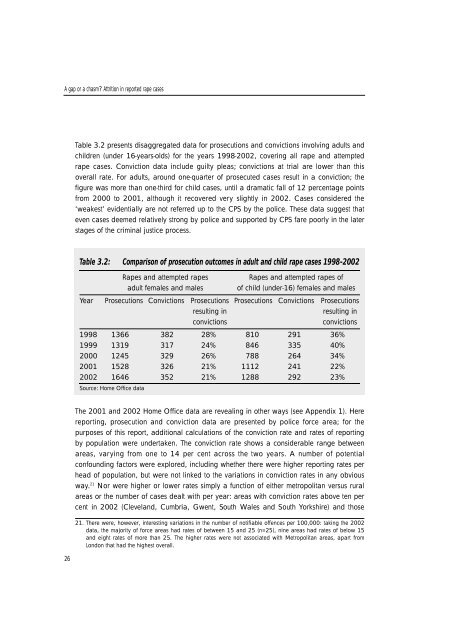
Table 3.2 presents disaggregated data f<strong>or</strong> prosecutions and convictions involving adults and<br />
children (under 16-years-olds) f<strong>or</strong> the years 1998-2002, covering all rape and attempted<br />
rape cases. Conviction data include guilty pleas; convictions at trial are lower than this<br />
overall rate. F<strong>or</strong> adults, around one-quarter of prosecuted cases result in a conviction; the<br />
figure was m<strong>or</strong>e than one-third f<strong>or</strong> child cases, until a dramatic fall of 12 percentage points<br />
f rom 2000 to 2001, although it re c o v e red very slightly in 2002. Cases considered the<br />
‘weakest’ evidentially are not referred up to the CPS by the police. These data suggest that<br />
even cases deemed relatively strong by police and supp<strong>or</strong>ted by CPS fare po<strong>or</strong>ly in the later<br />
stages of the criminal justice process.<br />
Table 3.2: Comparison of prosecution outcomes in adult and child rape cases 1998-2002<br />
Rapes and attempted rapes Rapes and attempted rapes of<br />
adult females and males of child (under-16) females and males<br />
Year Prosecutions Convictions Prosecutions Prosecutions Convictions Prosecutions<br />
resulting in resulting in<br />
convictions convictions<br />
1998 1366 382 28% 810 291 36%<br />
1999 1319 317 24% 846 335 40%<br />
2000 1245 329 26% 788 264 34%<br />
2001 1528 326 21% 1112 241 22%<br />
2002 1646 352 21% 1288 292 23%<br />
Source: Home Office data<br />
The 2001 and 2002 Home Office data are revealing in other ways (see Appendix 1). Here<br />
re p o rting, prosecution and conviction data are presented by police f<strong>or</strong>ce area; f<strong>or</strong> the<br />
purposes of this rep<strong>or</strong>t, additional calculations of the conviction rate and rates of rep<strong>or</strong>ting<br />
by population were undertaken. The conviction rate shows a considerable range between<br />
a reas, varying from one to 14 per cent across the two years. A number of potential<br />
confounding fact<strong>or</strong>s were expl<strong>or</strong>ed, including whether there were higher rep<strong>or</strong>ting rates per<br />
head of population, but were not linked to the variations in conviction rates in any obvious<br />
way. 21 N<strong>or</strong> were higher <strong>or</strong> lower rates simply a function of either metropolitan versus rural<br />
areas <strong>or</strong> the number of cases dealt with per year: areas with conviction rates above ten per<br />
cent in 2002 (Cleveland, Cumbria, Gwent, South Wales and South Yo r k s h i re) and those<br />
21. There were, however, interesting variations in the number of notifiable offences per 100,000: taking the 2002<br />
data, the maj<strong>or</strong>ity of f<strong>or</strong>ce areas had rates of between 15 and 25 (n=25), nine areas had rates of below 15<br />
and eight rates of m<strong>or</strong>e than 25. The higher rates were not associated with Metropolitan areas, apart fro m<br />
London that had the highest overall.