initial coverages - PSI Group ASA
initial coverages - PSI Group ASA
initial coverages - PSI Group ASA

Create successful ePaper yourself
Turn your PDF publications into a flip-book with our unique Google optimized e-Paper software.
!<br />
!<br />
!<br />
!<br />
Initiating'coverage'<br />
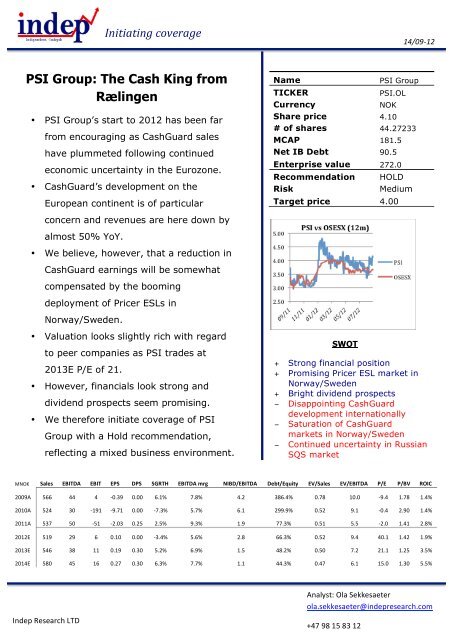
<strong>PSI</strong> <strong>Group</strong>: The Cash King from<br />
Rælingen<br />
• <strong>PSI</strong> <strong>Group</strong>’s start to 2012 has been far<br />
from encouraging as CashGuard sales<br />
have plummeted following continued<br />
economic uncertainty in the Eurozone.<br />
• CashGuard’s development on the<br />
European continent is of particular<br />
concern and revenues are here down by<br />
almost 50% YoY.<br />
• We believe, however, that a reduction in<br />
CashGuard earnings will be somewhat<br />
compensated by the booming<br />
deployment of Pricer ESLs in<br />
Norway/Sweden.<br />
• Valuation looks slightly rich with regard<br />
to peer companies as <strong>PSI</strong> trades at<br />
2013E P/E of 21.<br />
• However, financials look strong and<br />
dividend prospects seem promising.<br />
• We therefore initiate coverage of <strong>PSI</strong><br />
<strong>Group</strong> with a Hold recommendation,<br />
reflecting a mixed business environment.<br />
Q3/11 earnings Q3/10 Q2/11 Q2/11!<br />
SWOT<br />
!<br />
14/09'12!<br />
+ Strong financial position<br />
+ Promising Pricer ESL market in<br />
Norway/Sweden<br />
+ Bright dividend prospects<br />
− Disappointing CashGuard<br />
development internationally<br />
− Saturation of CashGuard<br />
markets in Norway/Sweden<br />
− Continued uncertainty in Russian<br />
SQS market<br />
!<br />
MNOK! Sales& EBITDA& EBIT& EPS& DPS& SGRTH& EBITDA&mrg& NIBD/EBITDA& Debt/Equity& EV/Sales& EV/EBITDA& P/E& P/BV& ROIC&<br />
2009A! 566! 44! 4! -0.39! 0.00! 6.1%! 7.8%! 4.2! 386.4%! 0.78! 10.0! -9.4! 1.78! 1.4%!<br />
2010A! 524! 30! -191! -9.71! 0.00! -7.3%! 5.7%! 6.1! 299.9%! 0.52! 9.1! -0.4! 2.90! 1.4%!<br />
2011A! 537! 50! -51! -2.03! 0.25! 2.5%! 9.3%! 1.9! 77.3%! 0.51! 5.5! -2.0! 1.41! 2.8%!<br />
2012E! 519! 29! 6! 0.10! 0.00! -3.4%! 5.6%! 2.8! 66.3%! 0.52! 9.4! 40.1! 1.42! 1.9%!<br />
2013E! 546! 38! 11! 0.19! 0.30! 5.2%! 6.9%! 1.5! 48.2%! 0.50! 7.2! 21.1! 1.25! 3.5%!<br />
2014E! 580! 45! 16! 0.27! 0.30! 6.3%! 7.7%! 1.1! 44.3%! 0.47! 6.1! 15.0! 1.30! 5.5%!<br />
Indep!Research!LTD!<br />
Name <strong>PSI</strong> <strong>Group</strong><br />
TICKER <strong>PSI</strong>.OL<br />
Currency NOK<br />
Share price 4.10<br />
# of shares 44.27233<br />
MCAP 181.5<br />
Net IB Debt 90.5<br />
Enterprise value 272.0<br />
Recommendation HOLD<br />
Risk Medium<br />
Target price 4.00<br />
Analyst:!Ola!Sekkesaeter!<br />
ola.sekkesaeter@indepresearch.com!<br />
+47!98!15!83!12!<br />
!
!<br />
Indep!Research!LTD!<br />
TABLE OF CONTENTS<br />
!<br />
Initiating!coverage:!<strong>PSI</strong>!<strong>Group</strong>!<br />
COMPANY&PROFILE&.......................................................................................................&3!<br />
MARKET&OVERVIEW&......................................................................................................&4!<br />
Retail'Solutions'.........................................................................................................................................................'4'<br />
''''Groundbreaking!order''..........................................................................................................................................'5!<br />
Cash'Management'Retail'........................................................................................................................................'6!<br />
The!Competitive!Landscape!..................................................................................................................................................!9!<br />
Recent!order!activity!.............................................................................................................................................................!12!<br />
Cash'Management'CIT/ATM'..............................................................................................................................'14!<br />
Case!study:!The!Russian!saga!of!differing!cultures!&!customs!...........................................................................!16!<br />
Recent'M&A'activity'..............................................................................................................................................'19!<br />
ESTIMATES&..................................................................................................................&20!<br />
VALUATION&.................................................................................................................&28!<br />
Investment'Conclusion'........................................................................................................................................'30'<br />
!<br />
APPENDIX&…………………………………………………………………………………………………………………&31&<br />
2!
!<br />
Indep!Research!LTD!<br />
<strong>PSI</strong> GROUP:<br />
!<br />
Initiating!coverage:!<strong>PSI</strong>!<strong>Group</strong>!<br />
THE CASH KING FROM RÆLINGEN<br />
COMPANY&PROFILE&<br />
The short story…<br />
<strong>PSI</strong> <strong>Group</strong>, a Rælingen-based company, is a leading manufacturer and<br />
distributor of cash handling solutions to the retail- and Security Transport<br />
(Cash in Transit) industry. Comprising the three business segments: Retail<br />
Solutions (<strong>PSI</strong>), Cash Management Retail (CashGuard) and Cash Management<br />
CIT/ATM (SQS), <strong>PSI</strong> <strong>Group</strong> offer integrated end-to-end solutions ensuring an<br />
efficient and safe operating environment wherever cash moves.<br />
!<br />
Figure 1.0: !<br />
Segment! What!they!do!<br />
Retail& Distributor!of!various!technological!solutions!such!as!CashGuard,!barcode!scanners!and!electronic!<br />
Solutions&<br />
Cash&<br />
shelf!labels!(ESL)!to!the!retail!segment!of!Norway!and!Sweden!<br />
Management& Comprises!the!production!and!sale!of!CashGuard,!a!POS/checkout!cash!handling!system!which!<br />
Retail&<br />
Cash&<br />
Management&<br />
increases!POS!efficiency!as!well!as!minimizes!the!risk!of!robbery!and!pilfering!<br />
CIT/ATM& Delivers!cash!protection!solutions!for!security!transports!and!ATMs!<br />
Source: <strong>PSI</strong> <strong>Group</strong>!<br />
SIGNIFICANT!EVENTS&<br />
2002….!Three-way!merger!between!i<strong>Group</strong>!<strong>ASA</strong>,!Cappit!<strong>ASA</strong>!and!Pinnås!Systems!International!AS!forming!<br />
today’s!<strong>PSI</strong>!<strong>Group</strong><br />
2003….!<strong>PSI</strong>!<strong>Group</strong>!secure!milestone!CashGuard!agreement!with!Norwegian!retail!group,!Norgesgruppen!<br />
2004….!<strong>PSI</strong>!<strong>Group</strong>!acquires!Swedish!retail!distributor,!Antonsen!Gruppen!AB!<br />
2006….&(1)!Divestment!of!handheld!PDA!business!Captura!<strong>ASA</strong>!<br />
&<br />
2006….&(2)!Distribution!operation!Symtech!sold!to!Ingram!Micro!<br />
2008….!<strong>PSI</strong>!<strong>Group</strong>!is!merged!with!CashGuard!AB!<br />
2010….!First!Russian!SQS!orders!are!received!following!extensive!customer!evaluation!<br />
2011….!Successful!completion!of!equity!issue!with!net!proceeds!of!62.6!mnok!<br />
3!
A potential<br />
game<br />
changer for<br />
slow-growing<br />
Norway/<br />
Sweden<br />
!<br />
Indep!Research!LTD!<br />
MARKET&OVERVIEW&<br />
&<br />
Retail Solutions<br />
!<br />
Initiating!coverage:!<strong>PSI</strong>!<strong>Group</strong>!<br />
Retail Solutions’ growth going forward will<br />
mostly be derived from its distribution<br />
agreement of the Electronic Shelf Label<br />
(ESL) producer, Pricer. Pricer has already<br />
installed over 80 million ESL units across<br />
the world with some 200 retail chains,<br />
and we believe the success could be<br />
replicated across the Norway/Sweden<br />
regions too. Our belief is strengthened by<br />
the recent groundbreaking order <strong>PSI</strong><br />
<strong>Group</strong> secured in May 2012 with a leading<br />
Nordic retailer.<br />
!<br />
Groundbreaking order<br />
We believe this retail group to be Nordic giant Rema 1000, which is a particularly<br />
significant player in Norway with its 497 grocery stores. Following this order, the<br />
whole of Rema 100 Norway will have Pricer’s ESLs installed in their stores. The<br />
order value was given to be over 100 mnok (116 msek), which would translate into<br />
0.18 msek worth of Pricer installations per store. <strong>PSI</strong> <strong>Group</strong> typically accumulates 20-<br />
40% of order values as distributor fees, and for this order we estimate it came to<br />
approximately 22%.<br />
Prior to the ESL order, Pricer installations numbered no more than roughly 120 stores<br />
in Norway and Sweden. The adoption of this ESL system as a mandatory concept<br />
requirement for all Rema 1000 Norway stores is therefore undoubtedly positive.<br />
We predict that this order may mark the eventual breakthrough for Pricer’s ESLs in<br />
both Norway and Sweden as other Nordic retail groups realize the great potential for<br />
significant cost savings.<br />
COOP Nordic is such a retail group, and one we believe could become the next<br />
‘mover’ within the ESL space. Having signed a framework agreement with <strong>PSI</strong> <strong>Group</strong><br />
in January 2011, Pricer ESLs have already undergone pilot installations in both<br />
Norwegian- and Swedish COOP stores. Typically pilot installations conclude after 1-2<br />
years with the customer deciding whether to deploy the system or not. It is therefore<br />
possible that something will happen in this space in a not too distant future. With over<br />
1700 stores, 955 of which are in Norway, COOP Nordic would undoubtedly<br />
contribute in making ESLs a more common sight in Norwegian- and Swedish grocery<br />
stores.<br />
We see large-scale installations within the COOP group’s Norwegian grocery retail<br />
chains as the most probable scenario. Full penetration rates across the 816 most<br />
fitting (realistic) stores would involve the installation of more than 3.7 million ESL<br />
4!<br />
Figure 1.1:<br />
Source: <strong>PSI</strong> <strong>Group</strong>!<br />
!
!<br />
Indep!Research!LTD!<br />
!<br />
Initiating!coverage:!<strong>PSI</strong>!<strong>Group</strong>!<br />
units and order values could exceed 250 mSEK. <strong>PSI</strong> <strong>Group</strong> as a distributor would<br />
probably garner 60msek of these.<br />
#!of!<br />
products! Store!size! Turnover/store!<br />
!! #!of!stores! Retail!class!<br />
Super!<br />
on!offer! (square!m)! (mnok)!<br />
COOP!Extra! 43! Discount! 5500!<br />
3500-<br />
1000-2800! 83!<br />
COOP!Prix! 293! Discount! 3900!<br />
2200-<br />
450-1100! 13-96!!<br />
COOP!Marked! 336! Local!<br />
6000! 200-1000! 4-45!!<br />
COOP!Mega! 116! Supermarket! 7200! 800-2000! 45-350!!<br />
COOP!OBS!!Hypermarked! 28! Hypermarket! 30000! 4900! 170-760!!<br />
TOTAL& 816!<br />
Estimated&total&ESL&need&& 3.68m&units& ! ! ! !<br />
Source: COOP Norge, Indep Research estimates!<br />
! ! ! !<br />
Pricer ESLs<br />
are already<br />
well<br />
established<br />
in Europe, so<br />
why not<br />
Norway &<br />
Sweden too?<br />
Figure 1.2: COOP Market Picture for ESL in Norway (excluding prior pilot installations)<br />
As for the Norwegian- and Swedish grocery retail markets isolated it is clear<br />
that there is massive market potential for Pricer ESLs. With penetration rates<br />
significantly higher in high profile global grocery retailers such as Carrefour<br />
we see no reason why this cost efficiency system cannot be replicated in<br />
Norway and Sweden- with <strong>PSI</strong> <strong>Group</strong> as an important partner.<br />
Figure 1.3: General ESL Market Picture (before full scale Rema 1000 Norway roll-out)<br />
Installed!<br />
base!!<br />
(#!stores)!<br />
Potential!<br />
Market!<br />
Market!<br />
Penetration! Retail!class! Country!<br />
! Casino! 400! 549! 72.9%! Hyper-&!supermarkets! France!<br />
Carrefour! 266! 1401! 19.0%! Hypermarkets! France!<br />
Metro! 60! 700! 8.6%! Cash&Carry! Germany!<br />
Soriana! 250! 800! 31.3%! Hyper-&!supermarkets! Mexico!<br />
Norway& 70! 3975! 1.8%!<br />
Sweden& 50! 3500! 1.4%!<br />
Source: Pricer, Indep Research estimates!<br />
Even after full-scale installations of Pricer ESLs across Rema 100 stores,<br />
market penetration in Norway will still remain below 15 % within the grocery<br />
sector.<br />
Going forward we therefore expect a wave of new Norwegian/Swedish<br />
retailers deciding to follow the example of the larger multi-national European<br />
retailers.<br />
5!<br />
! !<br />
! !
2012E:<br />
Pricer, 20%<br />
CashGuard,<br />
17%<br />
Digi scales,<br />
10%<br />
Repant/<br />
Vensafe, 5%<br />
!<br />
Indep!Research!LTD!<br />
!<br />
Initiating!coverage:!<strong>PSI</strong>!<strong>Group</strong>!<br />
As such we expect Pricer’s ESL to surpass CashGuard in Retail Solutions’<br />
revenue split. Historically, Cashguard have accounted for the majority of all<br />
revenues from capital goods. For 2012, we believe Pricer and CashGuard may<br />
well swap places. Furthermore, segments- Service/Support as well as<br />
Consumables normally represent around 25% each of total Retail Solutions<br />
revenues.<br />
The swap in revenue splits does not only stem from increasing Pricer<br />
installations- it is also a factor of declining sales of CashGuard systems in<br />
Norway and Sweden in recent years. This comes as penetration rates are<br />
increasing and markets thereby further saturating (explained further in Cash<br />
Management Retail-section).<br />
Figure 1.4:<br />
Source: <strong>PSI</strong> <strong>Group</strong>, Indep Research estimates<br />
Cash Management Retail<br />
Going forward, international markets will be<br />
of utmost interest to Cash Management<br />
Retail, as CashGuard’s penetration rates in<br />
Norway/Sweden have peaked. We expect<br />
CashGuard revenues to decline in line with<br />
the saturated, yet lucrative grocery markets<br />
of Sweden and Norway on a forward basis.<br />
In 2008 closed cash handling penetration<br />
rates in the grocery trade were considered to<br />
be 15 % and 12.5% for Norway and Sweden<br />
respectively.<br />
6!<br />
Figure 1.5:<br />
Source: <strong>PSI</strong> <strong>Group</strong><br />
!
CashGuard<br />
growth in<br />
Norway/<br />
Sweden<br />
seems<br />
unlikely<br />
!<br />
Indep!Research!LTD!<br />
!<br />
Initiating!coverage:!<strong>PSI</strong>!<strong>Group</strong>!<br />
According to our estimates, this has now increased to around 77% and 62%<br />
respectively- 4 years later. Most of the large Norwegian/Swedish grocery<br />
retail chains have some compliance with closed cash handling systems and<br />
the descending market trends in Norway and Sweden are also exemplified by<br />
the saturating levels of cash circulation- especially in Sweden.<br />
Figure 1.6:<br />
Source: Riksbanken<br />
Figure 1.8: International market for closed cash handling systems within grocery retail (as of August 2012)<br />
!! NORWAY! SWEDEN! DENMARK!<br />
INTERNATIONAL!!<br />
(Scandies!+!Euro-market)!<br />
CashGuard! 7475! 9276! 100! 19390!<br />
Safepay! 1500! 1500! 1500! 6500!<br />
iCash/CINEO! 50! 50! 0! 4000!<br />
AxlonRS! 0! 50! 0! 50!<br />
CashComplete!! 100! 0! 0! 200!<br />
CashInfinity! 0! 0! 0! 600!<br />
Total& 9125! 10876! 1600! 30740!<br />
Pot.!Market! 11925! 17500! 15000! 1289425!<br />
Penetration.& 76.5%! 62.1%! 10.7%! 2.4%!<br />
CashGuard!<br />
Penetration! 62.7%! 53.0%! 0.7%! 1.5%!<br />
Source: <strong>PSI</strong> <strong>Group</strong>, Gunnebo, Wincor Nixdorf, Indep Research estimates!<br />
Important to note is that our market research is subjected to grocery retail<br />
checkout points only. Europe’s 11 largest countries boost a total of 4.4million<br />
retail checkout points, of which around 1.28 million we estimate to be grocery<br />
retail checkout points. Our assumptions come as closed cash handling<br />
systems have yet to gain a serious foothold with non-food retailers.<br />
7!<br />
Figure 1.7:<br />
Source: Norges Bank!
International<br />
CashGuard<br />
growth also<br />
looks<br />
challenging<br />
amid the<br />
current<br />
Eurozone<br />
crisis<br />
!<br />
Indep!Research!LTD!<br />
!<br />
Initiating!coverage:!<strong>PSI</strong>!<strong>Group</strong>!<br />
<strong>PSI</strong> <strong>Group</strong> should be praised for their patient gradual build-up of a sound,<br />
international partner network.<br />
However, with the Eurozone crisis still looming large it will be difficult for <strong>PSI</strong><br />
<strong>Group</strong> to compensate for its declining CG revenues in Norway/Sweden with<br />
new customer wins on the European continent- as its stated market objective<br />
outlines.<br />
Par example Spain represents a country of great opportunity for CashGuard<br />
with high cash usage levels in the grocery trade. Several hundred CG pilot<br />
installations have gone down in Spain over recent years but these efforts will<br />
remain futile as long as the country struggles with its soaring debts and<br />
government deficits. Thus retail investments will remain low.<br />
This is also evidenced by the recent collapse in international exports of<br />
CashGuard in 1H-2012, and we predict no sudden upswing for some time.<br />
However, by 2014 we predict international revenues to exceed those of<br />
Norway /Sweden.<br />
Figure 1.9:<br />
Source: <strong>PSI</strong> <strong>Group</strong>, Indep Research estimates<br />
However looking isolated at cash usage levels, the Eurozone looks an<br />
opportunistic market as these have developed fairly strongly, and paints a<br />
picture far distant from the supposed cash ‘collapse’ dubbed by some industry<br />
observers. Since 2005, cash circulation has risen by over 57%.<br />
8!
!<br />
Indep!Research!LTD!<br />
Figure 2.0:<br />
Source: ECB<br />
!<br />
Initiating!coverage:!<strong>PSI</strong>!<strong>Group</strong>!<br />
As emphasised from the penetration tables, CashGuard is the undisputed<br />
world provider of closed cash handling systems. Ever since its first large-scale<br />
installations with Posten Norge in Norway in 2000, CashGuard has been a<br />
market leader and today boosts an installed base of over 19000 systems<br />
across the globe. The CashGuard system comes with a RRP (Recommended<br />
Retail Price) of around 10 000 Euro per unit.<br />
However, CashGuard is far from the only provider of closed cash handling<br />
systems and competition in this niche area is becoming fiercer than ever<br />
before.<br />
The Competitive Landscape<br />
Axlon:<br />
Axlon is the absolute minnow in this segment with only one product on offer, the<br />
Axlon RS (Recycling System). In 2012 the company realigned its business model and<br />
now also takes care of the concrete cash collection process for their customers- in<br />
addition to the provision of its closed cash handling system. Today we estimate an<br />
installed base of around 50 systems- all in Sweden. Since its first R&D activity began<br />
in 2002, more than 230 msek have been recognized in the development of the Axlon<br />
RS module, albeit the company is yet to achieve profitable results.<br />
Notable customers: Filmkjedan, Esplanaden, VI Hornstull (Sweden)<br />
Figure 2.1: Axlon Financials<br />
MSEK! 2008A! 2009A! 2010A! 2011A!<br />
Revenue& 0.6! 1.8! 2! 0.6!<br />
Operating&<br />
profit& -7.8! -20.8! -10.9! -8.5!<br />
margin! NEG! NEG! NEG! NEG!!<br />
Source: Axlon<br />
9!<br />
!
SafePay have<br />
gained on<br />
CashGuard in<br />
recent years<br />
after a dismal<br />
start<br />
!<br />
Indep!Research!LTD!<br />
!<br />
Initiating!coverage:!<strong>PSI</strong>!<strong>Group</strong>!<br />
GLORY LTD:<br />
Glory LTD is one of the true global giants in the field of cash management. However,<br />
the Japanese company derive most of their cash management revenues from the<br />
financial-, transportation and amusement park sector. Its presence in the retail sector<br />
was only felt in in 1996 when it launched its first cash recycler for cashiers.<br />
Today, Glory is highly active in the closed cash handling sector through the recent<br />
launch of the new system, CashInfinity. Per now, there are 300 closed cash handling<br />
systems installed in France across 150-200 bakeries, and for the whole of Europe we<br />
estimate a total of 600 installations. RRP for one fully integrated CashInfinity system<br />
is typically somewhere around 25K Euro.<br />
The key figures from the company’s “Overseas” segment comprise the sale of various<br />
cash handling products to all non-Japanese customers. The European retail sector<br />
typically represents around 10% of sales. It is also noteworthy that Glory’s<br />
management expects the “Overseas” segment to increase sales by 13.3% for FY2012<br />
YoY- making it the most growth-specced segment across the group’s four cash<br />
handling segments.<br />
Notable customers: N/A<br />
Figure 2.2: Glory Overseas Segment Financials<br />
billions!YEN! 2008A! 2009A! 2010A! 2011A!<br />
Revenue& 32784.0! 28712.0! 28753.0! 35306.0!<br />
Operating&<br />
profit& N/A! 1299.0! 1349.0! 1837.0!<br />
margin! N/A! 4.5%! 4.7%! 5.2%!<br />
Source: Glory<br />
SafePay:<br />
Safepay is the closed cash handling system developed by Swedish security company,<br />
Gunnebo. Safepay was formed in 2002 in a bid to compete with the then-only<br />
significant player, CashGuard. Initially the system went through several child hiccups,<br />
and was in 2009 a forbidden purchasing item for many Norwegian store managers.<br />
High service/repair costs have consequently lead to accumulated losses of 100msek<br />
since 2002. However, today these complications seem far gone, with Safepay being<br />
the most internationally established player. According to management, Safepay’s<br />
current losses owe only to expensive repair agreements for the old, unsuccessful<br />
Safepay product suite. Today’s Safepay system is usually priced at a 10% premium to<br />
CashGuard systems, ergo a RRP of around 11 000 Euro. Through its international<br />
sister-subsidiaries of Gunnebo, Safepay have struck many exciting customer<br />
agreements in Western Europe. One such example is the 2011 framework agreement<br />
to supply Italian DIY chain, Leroy Merlin, with over 500 Safepay systems by 2013. In<br />
March 2012 Safepay featured in Gunnebo’s 5-point strategic future agenda and as<br />
such forms an integral part of the future growth strategy for the whole of Gunnebo.<br />
This comes despite Safepay only representing 3.5% of Gunnebo’s total FY 2011<br />
revenues. As the marketing and development costs will come down somewhat in the<br />
next years Gunnebo expects Safepay to reach break-even in 2013, and profitability in<br />
10!
!<br />
Indep!Research!LTD!<br />
!<br />
Initiating!coverage:!<strong>PSI</strong>!<strong>Group</strong>!<br />
2014.<br />
Notable customers: COOP (Denmark), La Poste (France), Leroy Merlin (Italy)<br />
Figure 2.3: Safepay Financials<br />
MSEK! 2008A! 2009A! 2010A! 2011A!<br />
Revenue& N/A! N/A! 160.0! 180.0!<br />
Operating&<br />
profit& N/A! N/A! -39.0! -36.0!<br />
margin! N/A! N/A! NEG! NEG!<br />
Source: Gunnebo<br />
Scan Coin:<br />
Have been in the cash management business since 1966- albeit closed cash handling<br />
is something of a new market area with its CashComplete model, which was officially<br />
started in 2008. Like Glory, Scan Coin derives most of its cash management revenues<br />
from the financial sector, which also explains Scan Coin’s wide product offering in the<br />
back office cash management area. Drawing on a large international partner network,<br />
Scan Coin has secured many interesting closed cash handling orders. In November<br />
2011 it signed an agreement with international German hypermarket chain, Kaufland,<br />
to provide the cash management solutions as part of Kaufland’s expansion program.<br />
The agreement calls for all new-built stores across Europe over the next years to be<br />
outfitted with various cash management systems by Scan Coin- most likely the<br />
CashComplete module. It is also the intention that existing stores will be retrofitted<br />
with similar solutions at some point in the future. Per 2009 around 100 systems had<br />
been installed in France, Norway and Germany. Today we estimate a total of 100<br />
systems in Norway alone (Rema 1000), and around 200 in non-Scandinavian<br />
markets. As with Glory, Scan Coin’s product suite is of a premium kind and hence its<br />
CashComplete module has a RRP of around 110 kSEK.<br />
Notable customers: Rema 100 (Norway), Edeka, Kaufland (Germany)<br />
Figure 2.4: SCAN COIN Financials<br />
MSEK! 2008A! 2009A! 2010A! 2011A!<br />
Revenue& N/A! 750.0! 727.0! 850.0!<br />
Operating&<br />
profit& N/A! N/A! N/A! N/A!<br />
margin! N/A! N/A! N/A! N/A!<br />
Source: Indep Research estimates<br />
Wincor Nixdorf:<br />
Along with Glory LTD an undisputable global cash management heavyweight.<br />
Similarly to Glory too, Germany-based Wincor Nixdorf relies more on the financial<br />
sector than the retail sector- in 2011 34% of total revenues were derived from the<br />
retail sector. For the whole group, Europe accounts for 75% of total revenues. Its<br />
current product line for the closed cash handling sector comprises coin/note recycler<br />
11!
!<br />
Indep!Research!LTD!<br />
!<br />
Initiating!coverage:!<strong>PSI</strong>!<strong>Group</strong>!<br />
systems iCash and CINEO. The sale of these systems makes up a relatively small<br />
proportion of the Retail-segment’s sales as other payment terminal systems such as<br />
self-checkout-, pay tower- and all-in-one touch kiosk solutions are more significant.<br />
The company offers high quality products but at high premium: one complete iCash<br />
module is marketed at around 15k euro per system. One retail order for Wincor<br />
Nixdorf typically involves a wide range of all these solutions and is therefore a more<br />
‘payment’-hedged provider of retail solutions as opposed to its ‘cash-hedged’<br />
Scandinavian competitors. However, as Wincor Nixdorf’s retail segment is so largely<br />
directed towards POS technology it still paints a useful picture of the closed cash<br />
handling industry. Today we estimate an installed base of around 4000 systems.<br />
Notable customers: Shell (Germany), COOP (Switzerland), 7-Eleven (Sweden)<br />
Figure 2.5: Wincor Nixdorf Retail Segment Financials<br />
millions!<br />
EURO! 2008A! 2009A! 2010A! 2011A!<br />
Revenue&<br />
Operating&<br />
772.0! 718.0! 742.0! 801.0!<br />
profit& 44.0! 34.0! 36.0! 42.0!<br />
margin! 5.7%! 4.7%! 4.9%! 5.2%!<br />
Source: Indep Research estimates<br />
Recent order activity<br />
These competitors will do their utmost to dilute CashGuard’s strong market<br />
position, and recent events suggest that they already have taken many<br />
important steps in doing so;<br />
EXAMPLE 1: Apoteket<br />
WHEN: October 2011<br />
WHAT: Gunnebo announced that formerly CashGuard-loyal pharmacy chain,<br />
Apoteket, had selected SafePay as the supplier of closed cash handling systems.<br />
Installations would see 14 pharmacy stores throughout of Sweden be equipped with<br />
two SafePay units each, including a coin and a currency unit as well as the emptying<br />
device SCL.<br />
ORDER VALUE: We estimate the potential order value of the SafePay-agreement<br />
only to be around 2.2 msek, and as such represents nothing spectacular from a<br />
financial perspective.<br />
WHY THE CONCERN: This undoubtedly came as a blow to CashGuard having<br />
undertaken pilot installations with Apoteket back in 2001, and currenctly boosting an<br />
installed base of over 50 systems.<br />
However, it appears that Apoteket have yet to decide on its main systems provider as<br />
they still have around 270 fully-owned pharmacy stores that have no closed cash<br />
handling systems installed.<br />
12!
A significant<br />
blow to<br />
CashGuard<br />
but the<br />
preferred<br />
systems<br />
provider<br />
remains<br />
unknown<br />
!<br />
Indep!Research!LTD!<br />
!<br />
Initiating!coverage:!<strong>PSI</strong>!<strong>Group</strong>!<br />
EXAMPLE 2: IKEA<br />
WHEN: January 2012<br />
WHAT: Wincor Nixdorf’s new CINEO product suite was selected as IKEA’s primary<br />
provider of automated cash management to stores across several European countries.<br />
The contract award came following a successful pilot period of two years in which the<br />
CINEO solution had been installed in more than 40 stores across 10 countries.<br />
However, the order was for back-office cash management, which involves solutions<br />
that automatically verify cash at the end of a shift period. Cash is stored in auditproof<br />
cassettes, which are then ready to be transported away by CIT (cash-intransit)-operators.<br />
ORDER VALUE: With 300 European IKEA stores seemingly in the focal point of this<br />
order, we estimate the full potential contract value to surpass 15 million euros making<br />
it one of the most valuable retail orders of a cash handling system in history.<br />
WHY THE CONCERN: <strong>PSI</strong> <strong>Group</strong> did undertake around 40 pilot installations in IKEA<br />
France in 2008 but these efforts now look fruitless.<br />
Even though the front office cash management systems are still undergoing a pilot<br />
phase with IKEA and no final decision has yet been made, we find it highly unlikely<br />
that anyone but Wincor Nixdorf’s CINEO/iCash systems will be selected for this order<br />
type due to simplified system integration.<br />
Ergo Wincor Nixdorf’s comprehensive products offering has ostensibly given them a<br />
significant edge in discussions with large European retailers.<br />
EXAMPLE 3: Axfood<br />
WHEN: June 2012<br />
WHAT: Swedish grocery retail group, Axfood, signed a framework agreement with<br />
fellow Swedish company Gunnebo for its closed cash handling system, SafePay.<br />
However this is not a conclusive agreement for Safepay as it only comprises an <strong>initial</strong><br />
order of 100 systems over 3 years, and most of Axfood’s grocery chains- Willys,<br />
Willys Hemma, Hemkop and PrisXtra- will be able to cancel their participation as<br />
semi-owned retailers.<br />
ORDER VALUE: We estimate this framework agreement’s order value of up to<br />
8MSEK.<br />
WHY THE CONCERN: <strong>PSI</strong> <strong>Group</strong>’s CashGuard has remained a well-established<br />
systems supplier since 2005 and reportedly has an installed base of several hundred<br />
systems with Axfood’s grocery chains. However, Axfood will not abandon its<br />
longstanding customer relationship with <strong>PSI</strong> <strong>Group</strong>, and will deploy both cash<br />
handling systems parallel with each other going forward.<br />
Nonetheless, it is slightly worrying that Axfood- Sweden’s second largest grocery<br />
group with 1057 wholly-and partially owned stores, decide to go with another system<br />
following over 7 years of prior customer experience with CashGuard. Reportedly, the<br />
reasons why they did so are twofold.<br />
I. Safepay’s system has better catered- and prepared for the 2015 introduction<br />
of the new Swedish 200kr-note as well as 2016’s 2kr-coin. These new system<br />
requirements have now been addressed by <strong>PSI</strong> <strong>Group</strong>, and should not pose<br />
significant challenges in the future.<br />
13!
!<br />
Indep!Research!LTD!<br />
!<br />
Initiating!coverage:!<strong>PSI</strong>!<strong>Group</strong>!<br />
II. According to Axfood, Safepay’s cash handling system is more closed and<br />
integrated than CashGuard. This supposedly reduces the security risk as store<br />
personnel and security guards to a lesser extent need to take care of the<br />
actual cash transportation from the store to CIT transports.<br />
Cash Management CIT/ATM<br />
SQS’s potential market is global but today<br />
largely comprises certain areas of Europe.<br />
Regulated/mature CIT markets typically form<br />
the backbone of SQS’ core revenue streams<br />
such as Sweden, Belgium and France in<br />
which ‘intelligent’ security solutions are<br />
made obligatory by government legislation.<br />
Unregulated/immature markets such as<br />
Source: <strong>PSI</strong> <strong>Group</strong><br />
Russia and Australia also represent<br />
promising market opportunities in which<br />
armored security vehicles substitute for the ‘intelligent’ security solutions used<br />
in regulated markets. The reasons why a country’s CIT industry stays<br />
unregulated/immature are threefold.<br />
I. The Central Bank has to accept that notes with dye on can be destructed<br />
and replaced for a small charge.<br />
II. Insurance companies have to accept the technology in order to insure<br />
the bank notes under CIT and in the ATM. For example, SQS’ dye is<br />
certified in Sweden, France, Belgium and Germany.<br />
III. Some countries’ banknotes are of such quality that explosive dye will not<br />
make any visible impact on them. This could simply be down to poor<br />
quality, or the banknotes may contain polymer, which is more dyeresistant.<br />
In 2009, SQS management estimated the total market for ATM-and CIT<br />
products to be worth between 850- 1500 msek. Albeit CIT attacks are<br />
clearly plummeting there are two points one should bear in mind:<br />
I. If the UK is excluded from the calculations, there has been a 7%<br />
increase YoY in 2011 on the number of CIT attacks.<br />
14!<br />
Figure 2.6:
Regulated<br />
markets will<br />
continue to<br />
demand<br />
advanced<br />
security<br />
products<br />
Deliveries<br />
take place in<br />
Q4-2012, and<br />
expected<br />
gross margin<br />
is up to 80%<br />
!<br />
Indep!Research!LTD!<br />
!<br />
Initiating!coverage:!<strong>PSI</strong>!<strong>Group</strong>!<br />
II. Even though attacks dropped 7% from 2000-2011, there has been a<br />
46% increase in the total value amount lost during the same period.<br />
Figure 2.7: (Russia not included)!<br />
Source: ESTA!<br />
Looking across Europe, it is mostly the regulated markets that struggle with<br />
the majority of CIT attacks.<br />
A country such as the UK have historically suffered greatly from numerous<br />
CIT attacks every year, and in 2009 it accounted for over 75% of total<br />
European CIT attacks.<br />
The widespread opportunities present in the regulated market are also<br />
exemplified by a recent customer acquisition in Sweden.<br />
In August 2012, SQS entered into an agreement with, Bankomat AB,<br />
regarding ATM cassette services and related logistics for Bankomat’s ATMs in<br />
Sweden. Bankomat AB handles the operation and management of all ATMs<br />
owned by Sweden’s five largest banks: Danske Bank, Nordea, SEB, Swedbank<br />
and Handelsbanken. The agreement extends over 5 years with a value of<br />
around 17 msek per yearand an option for 2 further years.<br />
Figure 2.9: Regulated Market for CIT products<br />
Country!<br />
#!of!CIT!<br />
companies!<br />
#!of!<br />
personnel!<br />
15!<br />
#!of!CIT!<br />
vehicles!<br />
Market!<br />
Potential!<br />
(MSEK)!<br />
Belgium& 2! 1300! 280! 9.8!<br />
Denmark& N/A! N/A! N/A! N/A!<br />
France& 12! 10000! 1500! 52.5!<br />
Germany& 56! 11000! 2500! 87.5!<br />
Italy& 160! 6800! 1450! 50.8!<br />
Luxembourg& 2! 210! 40! 1.4!<br />
Netherlands& 3! 2000! 400! 14.0!<br />
Norway& 2! 800! 250! 8.8!<br />
Sweden& 3! 1500! 400! 14.0!<br />
UK& 14! 11665! 3129! 109.5!<br />
Source: ! ESTA, Indep ! Research estimates !<br />
!<br />
Figure 2.8 (Russia not included)!<br />
Source: ESTA<br />
TOTAL:& 248.2&MSEK&<br />
!
!<br />
Indep!Research!LTD!<br />
!<br />
Initiating!coverage:!<strong>PSI</strong>!<strong>Group</strong>!<br />
Case study: The Russian saga of differing cultures & customs<br />
Russia represents one of the more exciting markets within the<br />
unregulated/immature market sphere. SQS have been present in this market<br />
since June 2010 but a definite breakthrough has been hampered by a wide<br />
range of challenges.<br />
<strong>PSI</strong> <strong>Group</strong>’s epic Russian saga is a tale of many events, which can be<br />
summarized as below;<br />
June 2010<br />
<strong>PSI</strong> <strong>Group</strong> receives an <strong>initial</strong> order of 100 units of its Q-case 400 for distribution to<br />
the Russian National Bank, Sberbank.<br />
The total order calls for 420 units to eventually be delivered.<br />
July 2010<br />
<strong>PSI</strong> <strong>Group</strong> indicates experience of contractual dispute with its Russian distributor<br />
partner regarding the Sberbank-order.<br />
October 2010<br />
“Contractual challenges” still a significant issue and as a result no deliveries have<br />
been made at this point- contrary to the original agreement.<br />
December 2010<br />
100 units of the Q-case 400 are shipped out to Sberbank (out of the 420 ordered in<br />
June). <strong>PSI</strong> <strong>Group</strong> receives a prepayment from the distributor.<br />
A further 580 units of the security case are also ordered with expected delivery<br />
sometime during 2011- pending the approval of the first shipment by Sberbank.<br />
<strong>PSI</strong> <strong>Group</strong> voice their frustration with their Russian partner- particularly Russian<br />
customs and price negotiations.<br />
February 2011 (1)<br />
The Russian distribution partner still remains a significant problem area for Cash<br />
Management CIT/ATM. A total of 106 SQS cases were delivered to Sberbank in the<br />
4th quarter. The segment posts a writedown of goodwill of 186.1 mnok.<br />
February 2011 (2)<br />
<strong>PSI</strong> <strong>Group</strong> divests its Cash Management CIT/ATM (SQS) segment to its Russian<br />
distribution partner, OOO CKC, based on an EV of SEK 190 million. The closing of the<br />
transaction is expected take place in the beginning of March 2011.<br />
March 2011<br />
The closing of the SQS-transaction delays and the completion is now expected to take<br />
place during April 2011.<br />
April 2011<br />
The buyer, OOO CKC, have not met its payment obligations and requests additional<br />
time. <strong>PSI</strong> <strong>Group</strong> engages financial consultants to look at the economics of a private<br />
placement in the event that the buyer fails to carry out the payment.<br />
June 2011<br />
The SQS transaction is still delaying and the company makes the decision to conduct<br />
a private placement regardless of whether the transaction is finalized or not.<br />
August 2011<br />
The SQS transaction with its Russian partner, OOO CKC, is officially cancelled and <strong>PSI</strong><br />
16!
All these<br />
traits make<br />
for an ideal<br />
SQS market<br />
!<br />
Indep!Research!LTD!<br />
!<br />
Initiating!coverage:!<strong>PSI</strong>!<strong>Group</strong>!<br />
<strong>Group</strong> conducts its private placement in September 2011.<br />
May 2012<br />
Deliveries of security cases to Russian customer, Sberbank, are restarted. An order of<br />
700 cases expected to be produced and paid for on delivery in the 2 nd quarter.<br />
July 2012<br />
Deliveries to Russia continue but the market is yet typified by “considerable<br />
uncertainty”.<br />
Then, given all this uncertainty, why not just abandon the whole<br />
Russian market at once, and focus resources elsewhere?<br />
Because the Russian market is a one with promise;<br />
1) HIGH CASH USAGE: According to Russian finance minister Anton<br />
Siluanov, the share of cash stands at 25% of total money supply, which<br />
is 2x that of European countries and 1.5x that of other developing<br />
nations.<br />
2) ATTRACTIVE CUSTOMER: Sberbank is Russia’s largest bank and<br />
accounts for over 50% of all Russian retail deposits. Upon signing the<br />
<strong>initial</strong> agreement in June 2010, Sberbank expressed its goal of having<br />
all their 4600 CIT vehicles in compliance with the SQS technology by<br />
2014. Thus, Sberbank alone could easily be worth up to 138 msek as a<br />
customer to SQS (based on 30ksek per case), and would act as a great<br />
reference customer to other international players.<br />
3) WIDESPREAD USE OF YESTERDAY’S SOLUTIONS: Russia has a<br />
strong history of using heavily armored CIT vehicles with cash bags<br />
(only some of which have alarm mechanisms) instead of the more<br />
European and modern ‘soft cars’-concept with secure protection cases.<br />
These primitive cash bags cost between 5$-145$ apiece and pose no<br />
challenge to seasoned burglars and thieves.<br />
Russia’s heightened focus on CIT security does not come unfounded. Over the<br />
last 2 years alone, close to 14 Musd has been lost in many vicious armed<br />
robberies of CIT transports, ATMs and banks.<br />
17!
!<br />
Indep!Research!LTD!<br />
Figure 3.0: Financial Sector robberies, Russia<br />
!<br />
Initiating!coverage:!<strong>PSI</strong>!<strong>Group</strong>!<br />
Date! City! Assault!Victim! MISC! Casualties!<br />
Worth!of!<br />
cash!stolen!<br />
(K!USD)!<br />
Jan]08& Blagoveshchensk! JSC!Bank!of!Asia!Pacific! Bank!robbery! None! 943!<br />
Feb]08& Sterlitamak! N/A! Bank!robbery! None! 122!<br />
Mar]08& Dzerzhinsk! Sberbank! Bank!robbery! None! 531.8!<br />
Jun]08& St.!Petersburg! EEFC! Bank!robbery! None! 200!<br />
Apr]09& Chenlyabinskov! Chelindbank! Bank!robbery! None! 20.3!<br />
Jun]09& Perm! Sberbank! CIT!robbery! None! 7700!<br />
Jul]09& Nekrasovskoe! Sberbank! Bank!robbery! None! 15.4!<br />
Sep]09& Khimki! Office!Savings!Bank! Bank!robbery! None! 1.8!<br />
Dec]09& Nazran! Esid!Bank! CIT!robbery! 1!wounded! 1200!<br />
Jun]10& Moscow! Altayenergobanka! Bank!robbery! None! 185!<br />
Jun]10& Moscow! Rosbank! CIT!robbery! 3!dead! 4000!<br />
Jul]10& Moscow! Citibank! Bank!robbery! None! 83!<br />
Sep]10& Smolensk! Svyaz-Bank! Bank!robbery! None! 90!<br />
Oct]10& Soviet!Balashika! Sberbank! Bank!robbery! None! 154!<br />
Oct]10& Zamshina! Petrovsky! Bank!robbery! None! 16!<br />
Feb]11& Vladikavkaz! Bank!of!Moscow! Bank!robbery! None! 6160!<br />
May]11& Moscow! N/A! Bank!theft! None! 400!<br />
May]11& Perm! Sberbank! ATM!robbery! None! 154!<br />
Jun]11& St-Petersburg! N/A! Bank!robbery! None! 40!<br />
Sep]11& Moscow! N/A! ATM!robbery! None! 21.6!<br />
Oct]11& Elektrostal! N/A! Bank!theft! None! 771!<br />
Oct]11& Moscow! Sberbank! ATM!robbery!<br />
Bank!<br />
1!Several!injured! 3.1!<br />
Oct]11& Kabardino-Balkaria! Opening!Bank!<br />
Robbery! 2!severely!injured! 118!<br />
Dec]11& Moscow! N/A! Bank!theft! None! 679!<br />
Feb]12& Thule! N/A! Bank!theft!<br />
Bank!<br />
None! 61.7!<br />
Feb]12& St-Petersburg! Bank!Commercial!East! Robbery!<br />
Currency!<br />
None! 98.7!<br />
Feb]12& Rostov! N/A!<br />
Exchange! None! 92.5!<br />
Mar]12& Moscow! Sberbank! Bank!robbery! None! 586!<br />
May]12& Perm! N/A! ATM!robbery! None!<br />
!<br />
185.6!<br />
Total&lost:& 24.6&MUSD&<br />
! ! ! !<br />
Source: RIA Novosti, Indep Research estimates<br />
Furthermore, it is with great encouragement we note that cash usage in<br />
Russia is far from declining. Cash is still the preferred payment medium in<br />
Russia and such is also evidenced by the increasing no. of ATM’s in Russia-<br />
which have risen close to 19% year-on-year. Russia now boasts a total of<br />
over 60 000 ATMs.<br />
18!
The cash<br />
handling<br />
industry has<br />
become<br />
highly<br />
dynamic<br />
!<br />
Indep!Research!LTD!<br />
Recent M&A activity<br />
!<br />
Figure 3.1:<br />
Source: RIA Novosti<br />
Initiating!coverage:!<strong>PSI</strong>!<strong>Group</strong>!<br />
EXAMPLE 1:<br />
WHEN: Oct. 2010<br />
WHAT: Significant cash handling player, Scan Coin, was approached by Swedish buyout<br />
firm, Segulah IV, who acquired a 70% majority stake in the company.<br />
VALUE: Details of the transaction have remained undisclosed and relevant data have<br />
been near impossible to obtain. However, using a P/S multiple of 1.5, we estimate a<br />
purchasing price of around 760 msek, which would value the whole firm at around 1.1<br />
billion SEK.<br />
RESULT: Following Segulah’s investment in the company, Scan Coin’s capex<br />
spending has increased substantially in the form of extensive M&A activity. A common<br />
factor for all the acquired companies is their shared status as longstanding partners<br />
with Scan Coin in their respective geographic markets. As well-established distributors<br />
and suppliers within cash handling for the bank- and retail sectors all around Europe,<br />
Scan Coin has now become more geographically diversified. Since its first acquisition<br />
some 16 months ago we believe Scan Coin have reached acquired revenues of more<br />
than 130 msek: roughly 15% of its FY2010 revenue base.<br />
Figure 3.2: Scan Coin’s M&A Activity<br />
Annual!<br />
When! Target!<br />
revenues! What! Where!<br />
May-12! SoftOne! 5!msek! Software:!Hardware!integrator! Switzerland!<br />
Jan-12! Laurel!NGZ!SAS! 33.8!msek! Hardware:!Note!handling!<br />
Distributor:!Cash!handling!<br />
France!<br />
Jan-12! Money!Park!SARL! 8.5!msek! equipment! France!<br />
Sep-11! Sotremo! >60!msek! Distributor!Coin/note!handling!<br />
Distributor:!Coin/banknote!<br />
Switzerland!<br />
Apr-11! Sophus!Clausen!<br />
&<br />
4!msek! solutions!! Norway!<br />
Total&acquired&revenues&&&&&&111.3&MSEK&<br />
!<br />
%&of&FY2010&revenues& 15.3%&<br />
! !<br />
!<br />
! !<br />
Source: Scan Coin, Indep Research estimates<br />
19!
!<br />
Indep!Research!LTD!<br />
!<br />
Initiating!coverage:!<strong>PSI</strong>!<strong>Group</strong>!<br />
EXAMPLE 2:<br />
WHEN: December 2011<br />
WHAT: Cash handling giant, Loomis, purchased Spanish CIT company, Efectivox.<br />
Efectivox boasts an employee base of 500, 70 CIT vehicles and 11 branches. In 2010<br />
the company posted negative results on revenues of MSEK 130. However, for 2013,<br />
Loomis expects the company to have positive contribution on the group’s earnings<br />
through synergies.<br />
VALUE: The purchase price was appx 160 MSEK. Such levels yield a EV/Sales of<br />
1.23x. Loomis and its acquired companies offer interesting comparisons with <strong>PSI</strong><br />
<strong>Group</strong>’s Cash Management CIT/ATM (SQS).<br />
EXAMPLE 3:<br />
WHEN: February 2012<br />
WHAT: Japanese cash handling giant, Glory LTD,<br />
acquired UK based Talaris Topco LTD. Talaris is one of<br />
the world’s leading manufacturers of cash handling<br />
machines to banking, retail and gaming industries.<br />
With such machines as teller cash recyclers, desktop<br />
counters and ATMs on offer, Talaris draws on over<br />
1900 employees in 22 countries around the world.<br />
VALUE: Talaris was purchased for a cash<br />
consideration of 650 mGBP.<br />
The acquisition involved interesting pricing multiples-<br />
many of which largely outperform those of <strong>PSI</strong> <strong>Group</strong>.<br />
ESTIMATES&<br />
!<br />
Retail Solutions:<br />
Retail Solutions is by many accounts the safe haven within the <strong>PSI</strong> <strong>Group</strong> as it<br />
usually performs well, even during downturns. With high market exposure to<br />
the stable, yet mature markets of Norway and Sweden, Retail Solutions, is<br />
also the one segment with least growth prospects. It has widely been<br />
projected a significant revenue decline for this segment following high<br />
penetration rates for CashGuard.<br />
However, albeit the sale of CashGuard systems to these segments has<br />
reached its maturity stage, Retail Solutions will still gain from the powerful<br />
installed base in the form of Service/Support revenues.<br />
20!<br />
Figure 3.3: Details of Talaris-acquisition<br />
mGBP! 2010A! 2011A!<br />
Revenue! 305.6! 321.5!<br />
EBITDA! 63.7! 68.1!<br />
EBIT! 38.4! 37.5!<br />
EV/S! 2.1! 2.0&<br />
EV/EBITDA! 10.2! 9.5&<br />
EV/EBIT! 16.9! 17.3&<br />
Source: Glory LTD
!<br />
Indep!Research!LTD!<br />
!<br />
Figure 3.4:<br />
Revenue'(MNOK)'<br />
400!<br />
300!<br />
200!<br />
100!<br />
0!<br />
Initiating!coverage:!<strong>PSI</strong>!<strong>Group</strong>!<br />
Retail'Solutions:'Revenue'split'<br />
Source: <strong>PSI</strong> <strong>Group</strong>, Indep Research estimates<br />
Further to this, we see many opportunities developing for Retail Solutions with<br />
its Pricer ESLs. We foresee that the escalated deployment of Pricer ESL in<br />
Norway and Sweden should compensate for the expected decline of<br />
CashGuard deliveries.<br />
Thus we deem it probable that Retail Solutions will grow its revenue base with<br />
a CAGR of 0.6%, whereas EBITDA margins will remain in the lower range<br />
around 7%.<br />
Figure 3.5: Retail Solutions- Earnings<br />
MNOK! 2009A! 2010A! 2011A! 2012E! 2013E! 2014E!<br />
Revenue! 393.8! 406.4! 412.6! 405.4! 413.5! 420.9!<br />
EBITDA! 14.9! 38.7! 36.9! 29.8! 31.0! 30.7!<br />
margin! 3.8%! 9.5%! 8.9%! 7.4%! 7.5%! 7.3%!<br />
Source: <strong>PSI</strong> <strong>Group</strong>, Indep Research estimates<br />
Cash Management Retail:<br />
Cash Management Retail is expected to have a disastrous year of 2012<br />
following maturity of Norwegian- and Swedish markets as well as worsening<br />
economic conditions across the Eurozone. For the 1 st Half 2012, Cash<br />
Management Retail has posted revenues of 40.9 mnok vis-à-vis 77.6 mnok 1 st<br />
Half 2011. That speaks volumes of a deteriorating market climate.<br />
We see no operational turning point arising in some time, and thus expect<br />
revenue CAGR to be -3.9% over the next 3 years.<br />
Year 2011 was a brilliant year for Cash Management Retail and we do not see<br />
the segment reaching those highs for some years. Margins will be under<br />
pressure in 2012 and following increased internationalization we expect these<br />
to remain under pressure from 2013 and onwards.<br />
21!<br />
NEW!SALES!<br />
SERVICE/REPAIRS!
Cash<br />
Management<br />
CIT/ATM will<br />
drive most of<br />
<strong>PSI</strong> <strong>Group</strong> ’s<br />
growth going<br />
forward<br />
!<br />
Indep!Research!LTD!<br />
!<br />
Initiating!coverage:!<strong>PSI</strong>!<strong>Group</strong>!<br />
Thus we anticipate a significant decline in the number of delivered CashGuard<br />
systems to the market. 1 st Half 2012 is down by 456 systems YoY: 377<br />
systems short in Norway/Sweden, and 79 short in the international market.<br />
That does not bode well, and our forward estimates are logically influenced by<br />
this. However, we do see international sales developing nicely and this should<br />
keep total systems deliveries stable and flat.<br />
Figure 3.6: Cash Management Retail- Earnings<br />
MNOK! 2009A! 2010A! 2011A! 2012E! 2013E! 2014E!<br />
Revenue! 107.4! 124.5! 131.1! 89.5! 97.6! 108.3!<br />
EBITDA! 7.6! 13.6! 21! 5.5! 9.6! 11.0!<br />
margin! 7.1%! 10.9%! 16.0%! 6.2%! 9.8%! 10.2%!<br />
Source: <strong>PSI</strong> <strong>Group</strong>, Indep Research estimates<br />
Figure 3.7: No. of delivered CashGuard systems<br />
#!delivered!systems! 2009A! 2010A! 2011A! 2012E! 2013E! 2014E!<br />
Norway!&!Sweden! 1560! 1466! 1278! 899! 765! 602!<br />
Other! 188! 557! 688! 453! 640! 832!<br />
TOTAL& 1748& 2023& 1966& 1352& 1404& 1435&<br />
Source: <strong>PSI</strong> <strong>Group</strong>, Indep Research estimates<br />
Cash Management CIT/ATM<br />
Cash Management CIT is the best-performing segment of <strong>PSI</strong> <strong>Group</strong> thus far<br />
in 2012. As opposed to the other two segments, CM CIT/ATM has performed<br />
in line with 1 st Half 2011. We expect FY2012 revenue to come in 12.4% higher<br />
YoY with margins remaining similar to previous years. However, these should<br />
also pick up amid increased market activity from 2013 and onwards.<br />
On the back of the recent 17MSEK-a year agreement with Bankomat AB, we<br />
forecast 15.9% revenue CAGR through 2014. In the event that Russian<br />
deliveries escalate we would obviously adhere to revise our estimates further<br />
upwards. We also downplay the risk of running losses due to stable market<br />
conditions as well as a cost cutting program initiated in 2011.<br />
22!
We see<br />
potential for<br />
<strong>PSI</strong> <strong>Group</strong><br />
becoming a<br />
stable<br />
generator of<br />
dividends<br />
!<br />
Indep!Research!LTD!<br />
Figure 3.8: Cash Management CIT/ATM- Earnings<br />
!<br />
Initiating!coverage:!<strong>PSI</strong>!<strong>Group</strong>!<br />
MNOK! 2009A! 2010A! 2011A! 2012E! 2013E! 2014E!<br />
Revenue! 173.7! 86.3! 90.3! 101.5! 112.6! 130.7!<br />
EBITDA! 28.7! -11.9! 2.4! 2.8! 7.1! 13.2!<br />
margin! 16.5%! NEG! 2.7%! 2.7%! 6.3%! 10.1%!<br />
Source: <strong>PSI</strong> <strong>Group</strong>, Indep Research estimates<br />
Dividend<br />
<strong>PSI</strong> <strong>Group</strong> shall pay out an extraordinary dividend of 0.25 NOK per share in<br />
2012 for the financial year of 2011. The group experienced strong operational<br />
cash flow as well as securing extra capital through its equity issue in 2011.<br />
The company’s board of directors have stated that they wish to “continue to<br />
pay dividends in the coming years” too.<br />
However, for 2012 we believe the situation is different. 2 nd Half 2012 free<br />
cash flow amounted to 8mnok compared to 10.8mnok for 2011. In addition<br />
the group has its dividend payment of 11.1mnok scheduled for Q3 2012. We<br />
take a cautious dividend stance and feel it would be too risky to pay dividends<br />
also in 2013. However, from 2014 and onwards we believe the company<br />
should return to its dividend policy on the back of strong 2013 cash flows. We<br />
estimate a FY2013 DPS of 0.3 NOK, which is 20% above the FY2011 dividend.<br />
Figure 3.9:<br />
Source: <strong>PSI</strong> <strong>Group</strong>, Indep Research estimates<br />
Source: Indep Research estimates!<br />
!<br />
23!<br />
!
The<br />
drastically<br />
improved<br />
financials act<br />
as an<br />
important<br />
safety buffer<br />
!<br />
Indep!Research!LTD!<br />
!<br />
Initiating!coverage:!<strong>PSI</strong>!<strong>Group</strong>!<br />
Capital Structure<br />
We believe the 2011 equity issue will be instrumental in driving <strong>PSI</strong> <strong>Group</strong>’s<br />
growth in the future. Conducted in Q3-2011 the rights issue was highly<br />
successful in bringing in required capital for <strong>PSI</strong> <strong>Group</strong>. With over 62.6 mnok<br />
in increased capital the company got the funding it sought and dearly needed.<br />
<strong>PSI</strong> <strong>Group</strong> had been in breach with its main bank’s loan covenants for some<br />
time- and with a failed Cash Management CIT/ATM transaction- a share issue<br />
was the only way out. The net proceeds went towards reducing interestbearing<br />
debts by 56.5 mnok. The company has also heavily depreciated its<br />
goodwill posts stemming from the CashGuard acquisition in 2008.<br />
Today <strong>PSI</strong> <strong>Group</strong> generally generates strong and stable cash flows and, as a<br />
result, <strong>PSI</strong> <strong>Group</strong>’s financial structure is now considerably stronger than<br />
before.<br />
Figure 4.0:<br />
7!<br />
6!<br />
5!<br />
4!<br />
3!<br />
2!<br />
1!<br />
0!<br />
Financial'structure''<br />
Source: <strong>PSI</strong> <strong>Group</strong>, Indep Research estimates<br />
Figure 4.1:<br />
MNOK'<br />
350!<br />
300!<br />
250!<br />
200!<br />
150!<br />
100!<br />
50!<br />
0!<br />
176!<br />
450%!<br />
400%!<br />
350%!<br />
300%!<br />
250%!<br />
200%!<br />
150%!<br />
100%!<br />
50%!<br />
0%!<br />
Improved'Kinancial'position'<br />
133! 81!<br />
24!<br />
94!<br />
Q2!2011! Q2!2012!<br />
Source: <strong>PSI</strong> <strong>Group</strong>, Indep Research estimates<br />
NIBD/EBITDA!<br />
(LHS)!<br />
Covenant!(LHS)!<br />
Debt/Equity!<br />
(RHS)!<br />
InterestZbearing!<br />
debt!<br />
Goodwill!<br />
Cash!
P&L<br />
!<br />
Indep!Research!LTD!<br />
!<br />
Initiating!coverage:!<strong>PSI</strong>!<strong>Group</strong>!<br />
MNOK! 2009A! 2010A! 2011A! 2012E! 2013E! 2014E!<br />
Sales& 565.6& 524.3& 537.2& 518.9& 545.9& 580.2&<br />
COGS! -240.9! -217.8! -239.4! -233.0! -241.3! -254.7!<br />
Gross!Profit! 324.7! 306.5! 297.8! 285.9! 304.6! 325.5!<br />
SG&A! 280.4! -276.5! -247.9! -257.1! -267.0! -280.7!<br />
EBITDA& 44.3& 30.0& 49.9& 28.8& 37.6& 44.8&<br />
Depreciation&Amortisation! 40.2! -27.0! -42.6! -22.6! -26.2! -28.4!<br />
Goodwill!impairment! 0.0! -194.4! -58.6! 0.0! 0.0! 0.0!<br />
EBIT& 4.0& ]191.5& ]51.3& 6.3& 11.4& 16.3&<br />
Net!financial!items! -12.7! -11.8! -6.1! -0.5! 0.6! 0.5!<br />
Pretax&Profit& ]8.7& ]203.3& ]57.4& 5.7& 12.0& 16.8&<br />
Tax!(28%)! 0.1! -1.8! 0.1! -1.2! -3.4! -4.7!<br />
Reported&after&tax&profit& ]8.6& ]205.1& ]57.3& 4.5& 8.6& 12.1&<br />
Extraord.!items! 0.0! 0.0! 0.0! 0.0! 0.0! 0.0!<br />
Net&Income& ]8.6& ]205.1& ]57.3& 4.5& 8.6& 12.1&<br />
EPS& ]0.42& ]9.71& ]2.03& 0.10& 0.19& 0.27&<br />
Balance Sheet<br />
MNOK! 2009A! 2010A! 2011A! 2012E! 2013E! 2014E!<br />
Goodwill! 313.1! 140.8! 82.0! 81.0! 81.0! 81.0!<br />
Intangible!assets! 180.7! 186.0! 156.3! 139.7! 127.1! 115.7!<br />
Tangible!assets! 47.8! 44.4! 40.5! 37.7! 35.1! 32.6!<br />
Non-current!financial!<br />
assets! 0.0! 0.0! 0.0! 0.0! 0.0! 0.0!<br />
Account!receivables! 90.3! 84.3! 81.5! 84.3! 86.9! 89.1!<br />
Inventory! 75.1! 71.8! 66.3! 69.9! 72.4! 73.9!<br />
Other!current!assets! 16.2! 16.0! 13.4! 12.7! 12.1! 11.5!<br />
Cash!and!cash!<br />
equivalents! 9.7! 5.1! 4.2! 3.9! 13.1! 11.8!<br />
Total&assets& 733.0& 548.3& 444.3& 429.1& 427.5& 415.6&<br />
Equity! 364.1! 203.3! 210.4! 208.5! 226.3! 220.4!<br />
Minorities! 0.0! 0.0! 0.0! 0.0! 0.0! 0.0!<br />
Interest&bearing&debt& 197.3& 187.4& 99.2& 84.6& 70.1& 61.7&<br />
Accounts!payable! 51.1! 53.3! 38.7! 51.9! 54.6! 63.8!<br />
Pension!provisions! 0.0! 0.0! 0.0! 0.0! 0.0! 0.0!<br />
Other!liabilities! 120.5! 104.3! 96.0! 84.1! 76.5! 69.7!<br />
Total&equity&and&<br />
liabilities& 733.0& 548.3& 444.3& 429.1& 427.5& 415.6&<br />
Net!interest!bearing!<br />
debt! 187.6! 182.3! 95.0! 80.7! 57.0! 49.9!<br />
25!
Cash flow Statement<br />
!<br />
Indep!Research!LTD!<br />
!<br />
!<br />
!<br />
Initiating!coverage:!<strong>PSI</strong>!<strong>Group</strong>!<br />
MNOK! 2009A! 2010A! 2011A! 2012E! 2013E! 2014E!<br />
EBT! -8.7! -198.7! -51.4! 5.7! 12.0! 16.8!<br />
Other!income!! -1.8! -2.0! -2.0! -3.2! -2.2! -1.8!<br />
Depreciation&!amortisation! 40.3! 221.0! 95.2! 22.6! 26.2! 28.4!<br />
Net!financial!items! 7.7! 1.1! 6.7! 5.8! 0.6! 0.5!<br />
Paid!taxes! -0.4! 1.0! 2.1! -3.6! -3.4! -4.7!<br />
Changes!in!working!capital! 5.7! 3.6! -14.9! -6.8! 2.4! -5.5!<br />
Cash&flow&from&operations& 42.7! 26.1! 35.7! 37.1! 35.6! 33.8!<br />
!!<br />
CAPEX!<br />
Proceeds!from!other!<br />
!<br />
-20.8!<br />
!<br />
-12.1!<br />
!<br />
-2.4!<br />
!<br />
-8.8!<br />
!<br />
-12.0!<br />
!<br />
-13.3!<br />
investments! 3.2! 12.3! 9.2! 2.6! 0.0! 0.0!<br />
Cash&flow&from&investments& -17.5! 0.2! 6.8! -6.2! -12.0! -13.3!<br />
&&<br />
FREE&CASH&FLOW&<br />
!<br />
25.2!<br />
!<br />
26.3!<br />
!<br />
42.5!<br />
!<br />
30.9!<br />
!<br />
23.6!<br />
!<br />
20.5!<br />
!!<br />
Changes!in!interest!bearing! ! ! ! ! ! !<br />
debt! -34.8! -31.4! -105.6! -18.1! -14.5! -8.4!<br />
Issue/repurchase!of!shares! 0.0! 0.0! 62.3! -1.5! 0.0! 0.0!<br />
Paid!dividends! 0.0! 0.0! 0.0! -11.1! 0.0! -13.3!<br />
Other!non-cash!adjustments! 0.0! 0.0! 0.0! 0.0! 0.0! 0.0!<br />
Cash&flow&from&financing& -34.8! -31.4! -43.3! -30.7! -14.5! -21.7!<br />
!!<br />
Net&cash&flow&<br />
!<br />
-9.6!<br />
!<br />
-5.1!<br />
!<br />
-0.8!<br />
!<br />
0.2!<br />
!<br />
9.1!<br />
!<br />
-1.2!<br />
!!<br />
Net!IB!Debt!<br />
!<br />
187.6!<br />
!<br />
182.3!<br />
!<br />
95.0!<br />
!<br />
80.7!<br />
!<br />
57.0!<br />
!<br />
49.9!<br />
26!
!<br />
Segment Reporting<br />
!<br />
CASHGUARD&INSTALLATIONS&(#)&<br />
Indep!Research!LTD!<br />
&<br />
&<br />
&<br />
!<br />
!<br />
!<br />
!<br />
!<br />
!<br />
!<br />
Initiating!coverage:!<strong>PSI</strong>!<strong>Group</strong>!<br />
2009A! 2010A! 2011A! 2012E! 2013E! 2014E!<br />
Norway!&!Sweden! ! 1560! ! 1466! ! 1278! ! 899! ! 765! ! 602!<br />
Other! 188! 557! 688! 453! 640! 832!<br />
TOTAL! 1748! 2023! 1966! 1352! 1404! 1435!<br />
RETAIL&SOLUTIONS&(MNOK)& !! !! !! !! !! !!<br />
Revenue! 393.8! 406.4! 412.6! 405.4! 413.5! 420.9!<br />
EBITDA! 14.9! 38.7! 36.9! 29.8! 31.0! 30.7!<br />
margin! 3.8%! 9.5%! 8.9%! 7.4%! 7.5%! 7.3%!<br />
CASH&MANAGEMENT&RETAIL&(MNOK)& !! !! !! !! !! !!<br />
Revenue! 107.4! 124.5! 131.1! 89.5! 97.6! 108.3!<br />
EBITDA! 7.6! 13.6! 21! 5.5! 9.6! 11.0!<br />
margin! 7.1%! 10.9%! 16.0%! 6.2%! 9.8%! 10.2%!<br />
CASH&MANAGEMENT&CIT/ATM&<br />
(MNOK)& !! !! !! !! !! !!<br />
Revenue! 173.7! 86.3! 90.3! 103.5! 119.1! 140.5!<br />
EBITDA! 28.7! -11.9! 2.4! 2.9! 7.5! 14.2!<br />
margin! 16.5%! -13.8%! 2.7%! 2.8%! 6.3%! 10.1%!<br />
ELIMINATIONS&(MNOK)& !! !! !! !! !! !!<br />
Revenue!El.! -111.1! -100.4! -103! -80.0! -84.3! -89.6!<br />
EBITDA!El.! 2.5! 1! 0.2! 0.0! 0.4! 0.4!<br />
27!
!<br />
Indep!Research!LTD!<br />
VALUATION&<br />
DCF Valuation<br />
!<br />
!<br />
Initiating!coverage:!<strong>PSI</strong>!<strong>Group</strong>!<br />
Base&case& 2012- 2017- Terminal!<br />
scenario&<br />
2016E! 2026E! Value! Scenario!Assessment!<br />
Revenue!growth!is!largely!driven!from!international!customer!wins!<br />
Revenue!CAGR! 3.2%! 3.0%! 611! for!CashGuard!and!SQS.!Norway/Sweden!revenues!decline!overall.!!!!<br />
!<br />
Margins!become!somewhat!subdued!following!changed!customer!<br />
exposure!from!high-yield!Norway/Sweden!to!international!markets.!<br />
EBITDA!<br />
However,!increased!service-!and!Pricer!ESL!revenues!for!<br />
margins! 7.8%! 9.0%!<br />
Norway/Sweden!compensate!somewhat.!!<br />
Capital!<br />
!<br />
Turnover!(x)! 1.86! 1.98!<br />
! !<br />
ROIC! 6.0%! 7.3%!<br />
!<br />
! !<br />
Best&case& 2012- 2017- Terminal!<br />
scenario& 2016E! 2026E! Value! Scenario!Assessment!!<br />
Norway/Sweden!gives!off!a!renewed!boost!to!CashGuard,!whilst!Pricer!<br />
installations!are!thriving.!CashGuard!is!also!becoming!well-established!with!<br />
Revenue!CAGR! 3.8%! 3.5%! 744.5! international!grocery!retailers.!!<br />
!<br />
Large!scale!CashGuard!installations!secure!greater!margins,!as!does!SQS!<br />
EBITDA!margins! 8.4%! 10.0%!<br />
which!has!established!itself!in!new!unregulated!markets!such!as!Russia.!!!<br />
Capital!<br />
!<br />
Turnover!(x)! 1.87! 1.98!<br />
ROIC! 7.0%! 9.0%! ! !<br />
!<br />
! !<br />
Worst&case& 2012- 2017- Terminal!<br />
scenario& 2016E! 2026E! Value! Scenario!Assessment!!<br />
International!CashGuard!demand!takes!a!hit!parallel!to!declining!revenues!in!<br />
Revenue!CAGR! 1.9%! 2.5%! 466.3! Norway/Sweden.!SQS!market!conditions!also!remain!tough!with!low!volumes.!!!!<br />
!<br />
Margins!remain!under!pressure!as!the!international!economic!climate!<br />
worsens.!Domestic-!as!well!as!International!retail-!and!CIT!companies!reduce!<br />
EBITDA!margins! 6.3%! 8.0%!<br />
their!expenditure.!!!!!<br />
Capital!Turnover!<br />
!<br />
(x)! 1.83! 1.98!<br />
ROIC! 2.9%! 4.7%! ! !<br />
! !<br />
28!
Current<br />
valuation<br />
multiples in<br />
the lower end<br />
historically<br />
!<br />
Indep!Research!LTD!<br />
Historical Valuation<br />
!<br />
7!<br />
6!<br />
5!<br />
4!<br />
3!<br />
2!<br />
1!<br />
0!<br />
140!<br />
120!<br />
100!<br />
80!<br />
60!<br />
40!<br />
20!<br />
0!<br />
Initiating!coverage:!<strong>PSI</strong>!<strong>Group</strong>!<br />
Perpetuity&growth&&<br />
! ! ! 1.5%! 2.0%! ! 2.5%& 3.0%! ! 3.5%!<br />
! ! 7.4%! 6.10! 6.64! 7.28! 8.08! 9.08!<br />
!<br />
8.4%! 4.64! 4.98! 5.37! 5.85! 6.41!<br />
! WACC&& 9.4%& 3.60! 3.83! 4.09& 4.39! 4.17!<br />
!<br />
!<br />
Scenario! Fair!value! Probability!<br />
Base!Case! 4.09! 70%!<br />
Worst!Case! 2.55! 10%!<br />
Best!Case! 5.11! 20%!<br />
Weighted&Fair&Value&&&&&&&<br />
(per&share)& 4.14&<br />
!<br />
10.4%! 2.85! 3.00! 3.18! 3.38! 3.60!<br />
11.4%! 2.28! 2.39! 2.51! 2.65! 2.80!<br />
Source: <strong>PSI</strong> <strong>Group</strong>, Indep Research estimates<br />
29!<br />
EV/S!<br />
NIBD/EBITDA!<br />
P/BV!<br />
Debt/Equity!<br />
P/E!<br />
EV/EBITDA!<br />
WACC!calculation! !!<br />
Cost!of!Equity! 12.7%!<br />
Cost!of!Debt! 3.3%!<br />
Debt!ratio! 35.2%!<br />
WACC& 9.4%!<br />
EV/EBIT!adj!<br />
DCF!additions! MNOK!<br />
NPV!of!deferred!tax!asset! 13!<br />
Net!IB!Debt! 90!
!<br />
Indep!Research!LTD!<br />
!<br />
Relative Valuation<br />
Investment Conclusion<br />
NOK'per'share'<br />
HOLD.<br />
6!<br />
5!<br />
4!<br />
3!<br />
2!<br />
1!<br />
0!<br />
Initiating!coverage:!<strong>PSI</strong>!<strong>Group</strong>!<br />
Company!<br />
RS&and&CM&<br />
!! P/E! !! !! EV/SALES! !! EV/EBITDA! !! EV/EBIT! P/BV!<br />
MCAP!<br />
(mEURO)!<br />
Retail& 2011A& 2012E& 2013E& 2011A& 2012E& 2013E& 2011A& 2012E& 2013E& 2011A& 2012E& 2013E& 2012E& 14/09-12!<br />
Glory!! 17.9! 14.3! 12.6! 0.40! 0.79! 0.71! 3.9! 6.3! 5.3! 6.0! 8.5! 7.8! 0.7! 1198!<br />
Gunnebo! 9.5! 11.1! 8.6! 0.54! 0.50! 0.46! 6.9! 6.8! 5.4! 8.7! 9.0! 6.7! 1.2! 252!<br />
NCR!Corp.! 73.3! 14.9! 11.7! 0.80! 0.77! 0.70! 7.4! 6.5! 5.7! 10.0! 9.7! 7.9! 3.1! 2966!<br />
Pricer! 8.9! 15.7! 13.3! 2.09! 1.96! 1.74! 13.5! 13.4! 11.0! 16.7! 13.6! 11.3! 1.7! 155!<br />
Wincor!Nixdorf! 10.4! 16.8! 12.9! 0.56! 0.56! 0.54! 5.8! 7.7! 6.5! 8.1! 12.2! 9.7! 2.7! 887!<br />
Sector!Median! 10.0! 15.0! 12.8! 0.55! 0.68! 0.62! 6.4! 7.3! 5.9! 8.4! 10.6! 8.8! 1.5! !!<br />
!!<br />
!!<br />
!!<br />
!!<br />
!!<br />
CM&CIT/ATM&<br />
! !<br />
!!<br />
! !<br />
!!<br />
! !<br />
!!<br />
! !<br />
!!<br />
! !<br />
Brinks! 15.6!<br />
!<br />
12.0! 11.0!<br />
!<br />
0.36!<br />
!<br />
0.45! 0.32!<br />
!<br />
4.0!<br />
!<br />
3.6! 3.2!<br />
!<br />
7.5!<br />
!<br />
6.0! 5.2!<br />
!<br />
2.1!<br />
!<br />
881!<br />
Loomis! 12.8! 10.5! 9.7! 0.80! 0.74! 0.70! 5.6! 4.9! 4.5! 9.6! 8.8! 7.8! 1.7! 737!<br />
Sector!Median! 14.2! 11.2! 10.3! 0.58! 0.59! 0.51! 4.8! 4.3! 3.8! 8.6! 7.4! 6.5! 1.9! !!<br />
!!<br />
!!<br />
!!<br />
!!<br />
!!<br />
Combined! ! !<br />
! !<br />
! !<br />
! !<br />
! !<br />
Median! 11.6! 13.1! 11.8! 0.5! 0.7! 0.6! 5.7! 6.5! 5.3! 8.4! 8.9! 7.8! 1.7! !!<br />
!!<br />
!!<br />
!!<br />
!!<br />
!!<br />
<strong>PSI</strong>!<strong>Group</strong>!<br />
!<br />
NEG!<br />
!<br />
40.0! 21.1!<br />
!<br />
0.51!<br />
!<br />
0.51! 0.44!<br />
!<br />
5.5!<br />
!<br />
9.1! 6.4!<br />
!<br />
NEG!<br />
!<br />
41.9! 21.0!<br />
!<br />
0.9!<br />
!<br />
24!<br />
Most<br />
earnings<br />
multiples are<br />
particularly<br />
high,<br />
whereas<br />
equity looks<br />
undervalued<br />
Valuation as<br />
a whole gives<br />
a mixed<br />
picture of<br />
<strong>PSI</strong> <strong>Group</strong><br />
30!
!<br />
Indep!Research!LTD!<br />
Appendix<br />
The long story…<br />
!<br />
Initiating!coverage:!<strong>PSI</strong>!<strong>Group</strong>!<br />
<strong>PSI</strong> <strong>Group</strong> originally came to be known as Pinnås Systems International (<strong>PSI</strong>)<br />
as it essentially only consisted of today’s business segment, Retail Solutions,<br />
marketing and distributing various products and services to the retail<br />
industry. Today’s company is therefore the result of considerable past M&A<br />
activity within the Norwegian and Swedish retail focused business segments.<br />
Retail Solutions<br />
Retail Solutions supply a wide range of technology solutions to the retail<br />
sector in Sweden and Norway. As opposed to <strong>PSI</strong> <strong>Group</strong>’s other two business<br />
units, Retail Solutions is the only pure-play distributor of products to the<br />
grocery retail industry. CashGuard, scales, packaging machines, electronic<br />
shelf labels (ESL) and reverse vending machines (Repant) represent the core<br />
of the most sold products in this ‘distributor’ business unit.<br />
CASHGUARD<br />
This comprises the distribution of <strong>PSI</strong> <strong>Group</strong>’s own product, CashGuard, to Norwegian<br />
and Swedish markets and therefore also includes all service/support orders. (see<br />
more thorough description under Cash Management Retail section)<br />
SCALES AND PACKAGING MACHINES<br />
The leading supplier in Norway/Sweden for this sub-segment, RS markets the Digi<br />
scales offering everything from control scales to price calculating scales, as well as its<br />
automated packaging machines. All of Teraoka’s Digi scales and packaging machines<br />
offer all the traits needed to comprehensively meet requirements to weighing,<br />
packaging, tracking and labeling in a fresh produce department as well as in the<br />
fruits/vegetables department.<br />
ELECTRONIC SHELF LABELS<br />
<strong>PSI</strong> <strong>Group</strong> offers a broad range of Pricer’s electronic shelf label<br />
systems. With easy integration to back office systems through<br />
Pricer’s File Interface, Pricer’s ESLs vastly enhance grocery<br />
stores’ efficiency. With such solutions installed retail chains can<br />
now easily adjust pricing information, improve inventory as well<br />
as mitigate the risk of incorrect pricing.<br />
31!<br />
Figure 4.2:<br />
Continuum electronic<br />
labels<br />
Source: Pricer
!<br />
Indep!Research!LTD!<br />
!<br />
Initiating!coverage:!<strong>PSI</strong>!<strong>Group</strong>!<br />
REVERSE VENDING MACHINES<br />
Retail Solutions is the exclusive distributor of bottle deposit<br />
solutions from Repant to Sweden. Previously, RS was the prime<br />
distributor also to Norway but this was discontinued in 2011.<br />
DISPENSER MACHINES<br />
These dispensers are distributed on behalf of Norwegian company,<br />
Vensafe, and are directed towards automated sales solutions for<br />
FMCG items (Fast Moving Consumer Goods). Such dispenser<br />
machines help provide efficient store operations as well as the<br />
reduction of theft.<br />
CONSUMABLES<br />
Consumables is mostly related to self-adhesive labeling for various types of<br />
weighing/packaging equipment as well as for major production facilities in the food<br />
industry. Other consumables include CashGuard cleaning kits, cartridges for label<br />
printers and paper rolls for receipt printers.<br />
SERVICE/SUPPORT REVENUES<br />
All of Retail Solutions’ sales and distributions of products come with complete afterservice<br />
and maintenance which often includes the regular supply of consumables such<br />
as adhesive labels, toners, ink cartridges, receipt rolls, packaging film and Thermal<br />
Transfer Ribbons (TTR). However, the vast majority of RS’s service/maintenance<br />
revenues are derived from its Norwegian/Swedish installed base of CashGuard. These<br />
service agreements run for a period of 5 years, and in addition to regular<br />
maintenance, may involve necessary one-off installments such as phasing out of<br />
certain currency coins/notes. As an example, recent political legislation in Norway<br />
prompted the discontinuation of the 50-øring coin in May 2012.<br />
32!<br />
Figure 4.3:<br />
Repant Cosmos 4<br />
Fraktioner<br />
Source: <strong>PSI</strong> Antonson<br />
Figure 4.4:<br />
Vensafe Zervio<br />
Master<br />
Source: Vensafe!
!<br />
Indep!Research!LTD!<br />
Cash Management Retail<br />
!<br />
Initiating!coverage:!<strong>PSI</strong>!<strong>Group</strong>!<br />
This segment comprises the development, production and sale of all<br />
CashGuard systems. It also draws on all the CashGuard service/support<br />
incomes except those stemming from the Sweden/Norway markets- which<br />
belong to Retail Solutions.<br />
Cashguard is a closed cash handling system which is integrated with the store’s POSsystem<br />
and existing checkout counters. The transaction process is simple. First, sales<br />
is registered in the cash register and the consumer simultaneously inserts coins.<br />
Then, the cashier feeds in the notes received from the consumer-which are counted<br />
immediately- and the consumer automatically receives the correct change. Finally,<br />
collectors/CIT staff provide the efficient emptying of note recyclers as well as the safe<br />
transferring of excess notes to the store’s back office or to a cash centre. All these<br />
steps are facilitated by the well-renowned Cashguard system, which boosts an<br />
extensive list of functions;<br />
Cashguard Premium- the supreme Cashguard module with ergonomic design, high<br />
coin and currency capacity, flexible modular structure with multiple options and<br />
support function for currencies; SEK, NOK, DKK, ZAR, GBP, KWD and EUR.<br />
CashGuard Blue- the Cashguard module with a heightened<br />
level of security focus. Generally speaking, this module has<br />
increased focus on eliminating the threat of store robberies<br />
as it comes with an advanced dyeing protection rendering<br />
the “stolen” cash obsolete in the event of robbery. Thus it<br />
enables cash managers to store more cash in the cash<br />
registers over night without additional transfers. Particularly<br />
popular with postal offices and bank offices and is only<br />
offered in Norway/Sweden.<br />
Cashguard Note Collectors- are simply note collectors for<br />
safe removal of excess notes from CashGuard systems.<br />
Various collectors with capacity of up to 2000 notes are<br />
available with comprehensive dyeing technology protection,<br />
some of which also boost electronic shield protection.<br />
Coin Recycler- a coin machine with automatic feeding and<br />
high-standard secure coin authentication settings. Invalid<br />
coins are therefore swiftly rejected, and one can insert up to<br />
50 coins simultaneously into the machine.<br />
CashBack- this CashGuard function enables consumers to withdraw cash directly at<br />
checkouts. The withdrawal of cash is registered as a normal debit-card purchase for<br />
the consumer, whereas the store receives the equivalent sum of money on its<br />
account. Essentially, the checkout now functions like an ATM.<br />
33!<br />
Figure 4.5: CashGuard Blue<br />
Source: CashGuard Ireland!<br />
Figure 4.6: Note collector B3<br />
Source: CashGuard !
!<br />
Indep!Research!LTD!<br />
Cash Management CIT/ATM<br />
!<br />
Initiating!coverage:!<strong>PSI</strong>!<strong>Group</strong>!<br />
This segment comprises the development, production and sale of the SQS<br />
product line-which is ‘intelligent’ security solutions. Such solutions are simply<br />
the modern, next-generation alternative to the prehistoric armored transport<br />
of valuables. SQS encompasses a wide variety of advanced cash protection<br />
solutions for all security transport and ATMs, making both international banks<br />
and CIT (Cash-in-Transit) companies important customers. Generally<br />
speaking, SQS’s solutions revolve around the sale of its CIT security cases as<br />
well as its ATM cassettes but its product line is still more than just that<br />
(examples);<br />
Q-Ink<br />
This is SQS’s own developed and patented dye, which by many accounts forms the<br />
basis of all SQS products. The dye’s function is simple: destroy the banknotes making<br />
them worthless in the hands of the ‘unlawful’. This dye patent is recognized all across<br />
Europe and has already been certified in Sweden, France, Belgium and Germany.<br />
However, different countries use different materials in the production of their<br />
currencies and some banknotes contain amounts of polymer which is more inkresistant.<br />
The division has therefore experimented with other alternatives to ink<br />
destruction to mitigate this.<br />
Q-Case and Q-Collector<br />
These products are designed to facilitate the transportation of<br />
banknotes from one location to another, without the use of<br />
weapons- better known as the Softcar® concept. Thus by<br />
transporting banknotes in different, customized formats, such as<br />
piles of tied banknotes or plastic banknote bags (Q-collector), the<br />
cash is safely inserted into the security case (Q-case).<br />
The Q-case comes with two different functions; one for transporting<br />
banknotes, and one for transporting ATM cassettes.<br />
Softcar® (intelligent vehicle rack solutions)<br />
This is a solution developed for security transports allowing the CIT company to<br />
evolve from armoured vehicles to Softcars (unarmoured vehicles) without<br />
compromising the security of the banknotes. The racks are transferable, have low<br />
weight and to a large extent represent the modernity and promise of SQS and its<br />
Softcar® product line in the CIT sector going forward.<br />
34!<br />
Figure 4.7: Q-case<br />
Source: <strong>PSI</strong> <strong>Group</strong>!
!<br />
Indep!Research!LTD!<br />
Senior Management<br />
!<br />
Initiating!coverage:!<strong>PSI</strong>!<strong>Group</strong>!<br />
Jørgen Waaler<br />
CEO<br />
Mr. Waaler has been CEO of <strong>PSI</strong> <strong>Group</strong> since 2006 and prior to that he was <strong>PSI</strong><br />
<strong>Group</strong>’s vice CEO for four years. Mr. Waaler has gained a deep and broad<br />
understanding in the technology, market conditions and the commercial opportunities<br />
after almost ten years in the <strong>Group</strong>’s top management. He has studied economics and<br />
has an MBA from University of Wyoming from 1983. Waaler has worked within IT his<br />
whole carrier, first as finance consultant, consultant manager and IT manager in<br />
Fabritus AS, than later as CEO in Norsk Computer Industri AS, sales manager in<br />
Norsk Data AS, managing director in European Trading Corporation AS and CEO in<br />
i<strong>Group</strong> <strong>ASA</strong>, before he came to <strong>PSI</strong> <strong>Group</strong> in 2002.<br />
Anders Nilsen<br />
CFO<br />
Mr. Nilsen holds a Master of Arts in Management with Senior Honurs from the<br />
University of St. Andrews, and a degree in IT from NITH. He has previous experience<br />
as Finance Manager in Konica Minolta Business Solutions Norway AS, and Financial<br />
Controller at UPC/Get and Helly Hansen. Nilsen started in <strong>PSI</strong> 10 April 2007.<br />
Per Haagensen<br />
CEO, Retail Solutions<br />
Mr. Haagensen manages the division Retail Solutions, the <strong>Group</strong>’s biggest business<br />
areas measured in revenue.<br />
Mr. Haagensen, who took office in 2010, has an MBA from BI – Norwegian School of<br />
Management. Before joining <strong>PSI</strong> <strong>Group</strong> he was Managing Director in Tomra AS for 12<br />
years, resulting in leading insight and knowledge of technology solutions for the Retail<br />
segment.<br />
Sven Calissendorff<br />
COO Retail Solutions<br />
Mr. Calissendorff has managed <strong>PSI</strong> Antonson since 2009 after first been marketing<br />
manager since 2004. He has been a sales manager with Berendsen and Ilford Photo.<br />
Mr. Calissendorrf holds a DIHM Diploma in marketing from IHM Business School.<br />
Roine Gabrielsson<br />
CEO, Cash Management Retail<br />
Mr. Gabrielsson has managed Cash Management Retail since May 2012.<br />
Having worked more than 14 years in the IT software business he has broad<br />
experience and knowledge of international sales management, partner channel<br />
management and strategic marketing. His previous positions include Vice President<br />
Sales & Marketing with Nordic Edge, Vice President Global Sales with Projectplace<br />
International, CEO with Synergica and Business Unit Manager with TJ <strong>Group</strong>. Mr.<br />
Gabrielsson has an MBA from Henley Business School, U.K<br />
Erik Svedmark<br />
CEO, Cash Management CIT/ATM<br />
Mr. Svedmark has managed Cash Management CIT/ATM since 2008. Mr. Svedmark is<br />
graduate civil engineer from Linköpings University with significant postgraduate<br />
studies. He has been a researcher at the Swedish Defence Reaserch Establishment<br />
(FOA), research engineer and team leader at Bofors Aerotronics AB related to the<br />
fighter plane JAS 39 as well as working in Telia.<br />
35!
!<br />
Indep!Research!LTD!<br />
Top 25 Shareholders<br />
(as of 31. August 2012)<br />
!<br />
Initiating!coverage:!<strong>PSI</strong>!<strong>Group</strong>!<br />
!! Name! #!of!shares,!m! %!ownership!<br />
1! Erik!Pinnås! 4.93! 11.1%!<br />
2! Glaamene!Industrier! 4.18! 9.4%!<br />
3! Skagen!Vekst!og!Skagen!vekst!III! 4.00! 9.0%!<br />
4! Strømstangen! 3.93! 8.9%!<br />
5! Barclays!Capital!Sec! 2.00! 4.5%!<br />
6! SEB! 1.87! 4.2%!<br />
7! Avanza!Bank! 1.68! 3.8%!<br />
8! Nordnet!Bank! 1.58! 3.6%!<br />
9! Georg!Zetterberg! 1.49! 3.4%!<br />
10! Dyvi!Capital! 1.18! 2.7%!<br />
11! Waaler,!Jørgen! 0.91! 2.1%!<br />
12! Gresslien,!Odd!Roar! 0.84! 1.9%!<br />
13! Delta!Invest! 0.78! 1.8%!<br />
14! Swedbank! 0.69! 1.6%!<br />
15! V.!Eiendom! 0.69! 1.6%!<br />
16! <strong>PSI</strong>!<strong>Group</strong>! 0.67! 1.5%!<br />
17! Ring,!Jan! 0.62! 1.4%!<br />
18! Nordea!Securities! 0.45! 1.0%!<br />
19! Jacobsen,!Svein! 0.45! 1.0%!<br />
20! Isaksen,!Nils-Olav! 0.35! 0.8%!<br />
21! Nistad!Gruppen! 0.34! 0.8%!<br />
22! SHB!Stockholm!Clients!Account! 0.33! 0.7%!<br />
23! Frankmo,!Åge! 0.31! 0.7%!<br />
24! Fana!Elektrikeren! 0.25! 0.6%!<br />
25! MP!Pensjon!! 0.24! 0.5%!<br />
!! TOTAL& 34.77& 78.3%!<br />
Key upcoming investor dates<br />
PRIMARY<br />
26. October 2012: 0815 CET+1. 3 rd Quarter 2012 Release<br />
SECONDARY<br />
12. November 2012; Wincor Nixdorf Preliminary figures for FY 2011/2012<br />
20.September 2012; Gunnebo Capital Markets Day<br />
25. October 2012: Gunnebo 3 rd Quarter 2012 Release<br />
29. October 2012: Pricer 3 rd Quarter 2012 Release<br />
36!
!<br />
Indep!Research!LTD!<br />
!<br />
Initiating!coverage:!<strong>PSI</strong>!<strong>Group</strong>!<br />
ABOUT INDEP RESEARCH<br />
Indep!Research!LTD!is!an!independent,!in-depth!provider!of!equity!research!to!both!institutional-!<br />
and!private!investors.!Our!company!analysis!incorporates!all!the!essential!information!investors!<br />
require!in!order!to!make!informed!investment!decisions.!Based!upon!a!strong!emphasis!on!<br />
market!research!with!quantitive!scrutiny,!Indep!Research!offers!an!extensive!and!alternative!<br />
investment!approach.!!<br />
Indep Research: Independent. In-depth.<br />
Our research framework<br />
Indep Research’s equity research is conducted in a manner such that it comes with three different<br />
recommendations. These are: “Buy”, “Hold” and “Sell”.<br />
Buy: The analyst expects the share to outperform its relevant benchmark index (OSEBX, OSESX<br />
etc and its peer group.<br />
Sell: The analyst expects the share to underperform its relevant benchmark index- and peer group.<br />
Hold: The analyst sees no compelling investment rationale for a Buy- nor a Sell recommendation.<br />
The Seven INDEP multiples<br />
P/E<br />
Market Value per share/ Annual earnings per share (EPS)<br />
P/BV<br />
Market value per share/ equity value per share<br />
EV/S<br />
Company market value + Net Interest bearing debt (NIBD)/ Annual sales<br />
EV/EBITDA<br />
Enterprise Value/Earnings before Interest Taxes Depreciation Amortisation<br />
NIBD/EBITDA<br />
Net Interest bearing debt/Earnings Before Interest Taxes Depreciation Amortisation<br />
Debt/Equity<br />
Interest bearing debt/goodwill-adjusted equity<br />
ROIC<br />
NOPLAT (Net Operating Profit Less Adjusted Taxes) / Invested Capital (Intangible assets + Net Working Capital)<br />
37!
!<br />
Indep!Research!LTD!<br />
Disclaimer<br />
!<br />
Initiating!coverage:!<strong>PSI</strong>!<strong>Group</strong>!<br />
The particulars contained herein were obtained from sources which we believe to be<br />
reliable but are not guaranteed by us and may be incomplete. The particulars are not a<br />
complete analysis of every material fact respecting any company, industry, or security.<br />
The opinions expressed are based upon our analysis and interpretation of these particulars<br />
and are not to be construed as a solicitation or offer to buy or sell the securities mentioned<br />
herein. The opinions expressed here therefore reflect the judgment of the research<br />
analyst(s) at this date and are subject to change.<br />
Indep Research LTD makes no guarantee, representation or warranty as to the accuracy or<br />
completeness of the particulars.<br />
No part of the research analyst's compensation was, is, or will be, directly or indirectly,<br />
related to the specific recommendations or views expressed by the research analyst(s) in<br />
this equity research report.<br />
The analyst does not own any shares directly or indirectly (or any derivative thereof) of<br />
the company that is subject to this research report. The analyst or member of the analyst’s<br />
household does not serve as officer, director or advisory board member of the company<br />
that is subject to this research report.<br />
These materials may not be reproduced, distributed or published by any recipient for any<br />
purpose. Please cite source when quoting.<br />
38!