- Page 4:
Airport Engineering
- Page 10:
This book is printed on acid-free p
- Page 14:
vi Contents 4 Airport System Planni
- Page 18:
viii Contents 10.13 Expandability,
- Page 22:
x Contents 17.6 Biodiversity and Na
- Page 26:
xii Preface Acknowledgments the bas
- Page 32:
1 The Structure and Organization of
- Page 36:
Table 1.1 Annexes to the ICAO Conve
- Page 40:
1.4 U.S. Governmental Organizations
- Page 44:
1.6 Patterns of Airport Ownership 7
- Page 48:
1.7 Revenues and Expenditures at U.
- Page 52:
1.8 Sources of Capital Financing fo
- Page 56:
Table 1.4 U.S. Airport Annual Avera
- Page 60:
Local Government Taxes State Financ
- Page 64:
1.9 Federal Financing 17 More chang
- Page 68:
1.10 The U.S. National Plan of Inte
- Page 72:
2 2.1 INTRODUCTION Forecasting Air
- Page 76:
2.1 Introduction 23 principal diffe
- Page 80:
2.2 Components of Air Transport Dem
- Page 84:
Survey of Expectation 2.3 Conventio
- Page 88:
2.3 Conventional Airport Forecast M
- Page 92:
Linear trend Exponential trend Para
- Page 96:
2.4 Integrated Demand Forecast Fram
- Page 100:
Data required for this system inclu
- Page 104:
2.4 Integrated Demand Forecast Fram
- Page 108:
Enplanements (millions) 1,000 100 1
- Page 112:
2.4 Integrated Demand Forecast Fram
- Page 116:
2.5 MULTIAIRPORT REGION FORECAST FR
- Page 120:
2.5 Multiairport Region Forecast Fr
- Page 124:
2.5 Multiairport Region Forecast Fr
- Page 128:
2.5 Multiairport Region Forecast Fr
- Page 132:
2.5 Multiairport Region Forecast Fr
- Page 136:
2.5 Multiairport Region Forecast Fr
- Page 140:
2.5 Multiairport Region Forecast Fr
- Page 144:
2.5 Multiairport Region Forecast Fr
- Page 148:
2.5 Multiairport Region Forecast Fr
- Page 152:
where Tij = travel by air passenger
- Page 156:
2.8 Generation-Distribution Models
- Page 160:
Multimodal Models 2.8 Generation-Di
- Page 164:
2.9 Air Freight Demand Forecasts 67
- Page 168:
where AP = aircraft price index P =
- Page 172:
where p(a) = exp[δRR (a)] exp[δR
- Page 176:
References 73 34. De Neufville, R.,
- Page 180:
14,000 4000 B777-300 Piston Turbopr
- Page 184:
where 3.2 The Influence of Aircraft
- Page 188:
400 400 A380 350 Envelope of produc
- Page 192:
Requirements of Current Aircraft Ty
- Page 196:
Table 3.1b Aircraft Characteristics
- Page 200:
Table 3.1c Characteristics of Selec
- Page 204:
FAR takeoff runway length (1000 m)
- Page 208:
3.2 The Influence of Aircraft Desig
- Page 212:
3.2 The Influence of Aircraft Desig
- Page 216:
3.2 The Influence of Aircraft Desig
- Page 220:
3.3 Other Airport Layout Factors 95
- Page 224:
3.4 Factors Affecting Airport Capac
- Page 228:
3.5 Noise 99 Failure in this regard
- Page 232:
3.6 Future Trends in Aircraft Desig
- Page 236:
3.6 Future Trends in Aircraft Desig
- Page 240:
4 Airport System Planning The airpo
- Page 244:
4.3 Planning Airport Systems under
- Page 248:
4.3 Planning Airport Systems under
- Page 252:
4.4 Effect of Airline Hubs and Dere
- Page 256:
Figure 4.1 Major U.S. airline hubs
- Page 260:
4.5 Air Transport Planning in the U
- Page 264:
4.5 Air Transport Planning in the U
- Page 268:
383 Primary 4.5 Air Transport Plann
- Page 272:
SEA SFO Hawaii Inset HNL LAX SAN LA
- Page 276:
ORS Alaska MCE MWH WS PDT 4.5 Air T
- Page 280:
Reconstruction 19% Security 2% Safe
- Page 284:
4.5 Air Transport Planning in the U
- Page 288:
4.6 AIRPORT SYSTEM PLANNING IN EURO
- Page 292:
4.7 Airport System Plan Analysis 13
- Page 296:
4.7 Airport System Plan Analysis 13
- Page 300:
Area issues Metro/regional plans Sy
- Page 304:
4.7 Airport System Plan Analysis 13
- Page 308:
4.7 Airport System Plan Analysis 13
- Page 312:
Table 4.3 Reference Airports for Ca
- Page 316:
4.7 Airport System Plan Analysis 14
- Page 320:
4.8 Data Structure for Airport Syst
- Page 324:
Demand Characteristics • Origin d
- Page 328:
References 149 6. National Plan of
- Page 332:
5.2 HIERARCHY OF PLANNING (1) 5.3 E
- Page 336:
5.3 Elements of Airport Master Plan
- Page 340:
Demand-Capacity Analysis 5.3 Elemen
- Page 344:
5.3 Elements of Airport Master Plan
- Page 348:
Table 5.1 Outline of ICAO Master Pl
- Page 352:
Part I: Preplanning & preparation P
- Page 356:
5.6 Data Requirements for Master Pl
- Page 360:
5.6 Data Requirements for Master Pl
- Page 364:
5.7 STRUCTURE OF MASTER PLAN REPORT
- Page 368:
5.7 Structure of Master Plan Report
- Page 372:
KUCHING 39 16 15 13 12 39 40 14 31
- Page 376:
(a) 5.7 Structure of Master Plan Re
- Page 380:
(c) Figure 5.5(c) Dallas Fort Worth
- Page 384:
5.8 Airport Site Selection 177 airp
- Page 388:
6 CNS/ATM The communication, naviga
- Page 392:
Technology Background 6.1 Evolution
- Page 396:
6.2 U.S. NATIONAL AIRSPACE SYSTEM (
- Page 400:
NAS Structure 6.2 U.S. National Air
- Page 404:
6.2 U.S. National Airspace System (
- Page 408:
6.2 U.S. National Airspace System (
- Page 412:
6.2 U.S. National Airspace System (
- Page 416:
6.3 CNS/ATM OF THE NAS Radio-Based
- Page 420:
6.3 CNS/ATM of the NAS 195 commonly
- Page 424:
6.3 CNS/ATM of the NAS 197 with a c
- Page 428:
6.3 CNS/ATM of the NAS 199 Air Traf
- Page 432:
6.3 CNS/ATM of the NAS 201 Airport
- Page 436:
6.3 CNS/ATM of the NAS 203 Air Rout
- Page 440:
6.3 CNS/ATM of the NAS 205 blocks o
- Page 444:
6.3 CNS/ATM of the NAS 207 The evol
- Page 448:
6.3 CNS/ATM of the NAS 209 PBN offe
- Page 452:
The specific requirements of an RNP
- Page 456:
6.3 CNS/ATM of the NAS 213 • WAAS
- Page 460:
6.3 CNS/ATM of the NAS 215 Figure 6
- Page 464:
6.3 CNS/ATM of the NAS 217 Figure 6
- Page 468:
6.3 CNS/ATM of the NAS 219 ALSF-II
- Page 472:
6.3 CNS/ATM of the NAS 221 indicati
- Page 476:
6.3 CNS/ATM of the NAS 223 Figure 6
- Page 480:
Figure 6.18 (continued) 225
- Page 484:
HGR: hangar area ILS: ILS critical
- Page 488:
STOP 6.3 CNS/ATM of the NAS 229 STO
- Page 492:
• Positioning, navigation, and ti
- Page 496:
References 233 21. Local Area Augme
- Page 500:
7.2 Capacity, Level of Service, and
- Page 504:
7.3 Airside Capacity 237 increase i
- Page 508:
Arrivals/15 min 2 4 φ(C d ) Freque
- Page 512:
subject to where: 7.4 Factors Affec
- Page 516:
7.4 Factors Affecting Airside Capac
- Page 520:
7.5 Determination of Runway Capacit
- Page 524:
Cumulative arrivals Arrival rate 7.
- Page 528:
7.5 Determination of Runway Capacit
- Page 532:
For vi = 135, vj = 100, we have m(v
- Page 536: 7.5 Determination of Runway Capacit
- Page 540: Touch & go factor T Hourly capacity
- Page 544: 7.6 Annual Service Volume 257 5. De
- Page 548: Table 7.3 Capacity and Annual Servi
- Page 552: Arrival delay index 60% arrivals 50
- Page 556: Annual Aircraft Delay 7.8 Calculati
- Page 560: 7.10 Gate Capacity 265 The maximum
- Page 564: 7.11 Assessing System Capacity-Dela
- Page 568: Passengers per inhabitant 2.00 1.50
- Page 572: 7.11 Assessing System Capacity-Dela
- Page 576: 7.12 Airport Landside Capacity 273
- Page 580: IATA LOS Framework 7.12 Airport Lan
- Page 584: 7.12 Airport Landside Capacity 277
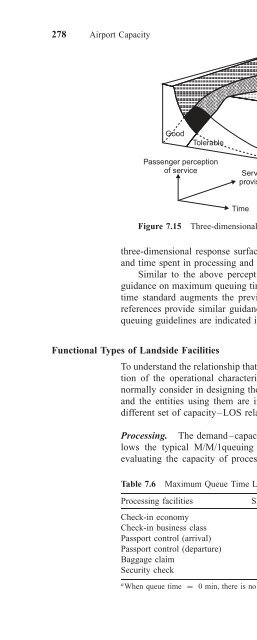
- Page 590: 280 Airport Capacity Cumulative num
- Page 594: 282 Airport Capacity provide accura
- Page 598: 284 Airport Capacity passport contr
- Page 602: 286 Airport Capacity Table 7.12 Dem
- Page 606: 288 Airport Capacity The IATA recom
- Page 610: 290 Airport Capacity • Long-term
- Page 614: 292 Airport Capacity Table 7.16 Fac
- Page 618: 294 Airport Capacity REFERENCES 1.
- Page 622: 296 Airport Capacity 40. Ashford, N
- Page 626: 298 Airside Configuration and Geome
- Page 630: 300 Airside Configuration and Geome
- Page 634: 302 Airside Configuration and Geome
- Page 638:
304 Airside Configuration and Geome
- Page 642:
306 Airside Configuration and Geome
- Page 646:
308 Airside Configuration and Geome
- Page 650:
310 Airside Configuration and Geome
- Page 654:
312 Airside Configuration and Geome
- Page 658:
314 Table 8.7 Approach Runways: Dim
- Page 662:
316 Airside Configuration and Geome
- Page 666:
318 Airside Configuration and Geome
- Page 670:
320 Airside Configuration and Geome
- Page 674:
322 Airside Configuration and Geome
- Page 678:
324 Airside Configuration and Geome
- Page 682:
326 Airside Configuration and Geome
- Page 686:
328 Airside Configuration and Geome
- Page 690:
330 Airside Configuration and Geome
- Page 694:
332 Airside Configuration and Geome
- Page 698:
334 Airside Configuration and Geome
- Page 702:
336 Airside Configuration and Geome
- Page 706:
338 Airside Configuration and Geome
- Page 710:
340 Airside Configuration and Geome
- Page 714:
342 Airside Configuration and Geome
- Page 718:
344 Airside Configuration and Geome
- Page 722:
346 Airside Configuration and Geome
- Page 726:
348 Airside Configuration and Geome
- Page 730:
350 Airside Configuration and Geome
- Page 734:
352 Safeguarding the Airport Nature
- Page 738:
354 Safeguarding the Airport Frangi
- Page 742:
356 Safeguarding the Airport Nation
- Page 746:
358 Safeguarding the Airport Severi
- Page 750:
360 Safeguarding the Airport and wh
- Page 754:
362 Safeguarding the Airport associ
- Page 758:
364 Safeguarding the Airport 3. Str
- Page 762:
366 Safeguarding the Airport Commun
- Page 766:
368 Safeguarding the Airport (ASIA)
- Page 770:
370 Safeguarding the Airport In add
- Page 774:
372 Safeguarding the Airport • De
- Page 778:
374 Safeguarding the Airport • Ad
- Page 782:
376 Safeguarding the Airport the ai
- Page 786:
378 Safeguarding the Airport • Id
- Page 790:
380 Safeguarding the Airport OCS RO
- Page 794:
382 Safeguarding the Airport Climb
- Page 798:
384 Safeguarding the Airport INITIA
- Page 802:
386 TERPS Obstacle Clearance Surfac
- Page 806:
388 Safeguarding the Airport A typi
- Page 810:
390 Safeguarding the Airport effect
- Page 814:
392 Safeguarding the Airport Furthe
- Page 818:
394 Safeguarding the Airport Figure
- Page 822:
396 Safeguarding the Airport Figure
- Page 826:
398 Safeguarding the Airport • By
- Page 830:
400 Safeguarding the Airport relies
- Page 834:
402 Safeguarding the Airport Techni
- Page 838:
404 Safeguarding the Airport •
- Page 842:
406 Safeguarding the Airport The ne
- Page 846:
408 Safeguarding the Airport LIDAR
- Page 850:
410 Safeguarding the Airport longit
- Page 854:
412 Safeguarding the Airport spacin
- Page 858:
10 Passenger Terminal 10.1 FUNCTION
- Page 862:
416 Passenger Terminal Holding Area
- Page 866:
418 Passenger Terminal S Domestic d
- Page 870:
420 Passenger Terminal search, visi
- Page 874:
422 Passenger Terminal Terminal bui
- Page 878:
424 Passenger Terminal Unit Termina
- Page 882:
426 Passenger Terminal 10.8 PASSENG
- Page 886:
428 Passenger Terminal Design of an
- Page 890:
430 Passenger Terminal Identificati
- Page 894:
432 Passenger Terminal arrivals or
- Page 898:
434 Passenger Terminal length of ch
- Page 902:
436 Passenger Terminal Passenger Ho
- Page 906:
438 Passenger Terminal Other Models
- Page 910:
440 Passenger Terminal Table 10.3 S
- Page 914:
442 Sorting Area Screening Area A C
- Page 918:
444 Passenger Terminal carousel and
- Page 922:
446 Figure 10.16 Example of an expa
- Page 926:
448 183 m 600'-0" 274-308 m 900'-10
- Page 930:
450 Passenger Terminal Figure 10.18
- Page 934:
452 Passenger Terminal where m = to
- Page 938:
454 Passenger Terminal 130.09 m 1.
- Page 942:
456 Passenger Terminal Grounding Fa
- Page 946:
458 Air Cargo Facilities RT K s (Bi
- Page 950:
460 Air Cargo Facilities terminal,
- Page 954:
462 Air Cargo Facilities necessary
- Page 958:
464 Air Cargo Facilities Figure 11.
- Page 962:
466 Air Cargo Facilities Airbus 300
- Page 966:
468 Air Cargo Facilities IATA Conta
- Page 970:
470 Air Cargo Facilities Table 11.1
- Page 974:
472 Air Cargo Facilities Figure 11.
- Page 978:
474 Air Cargo Facilities 7. Other a
- Page 982:
476 Air Cargo Facilities D. Facilit
- Page 986:
478 Air Cargo Facilities 40 m Facil
- Page 990:
480 Air Cargo Facilities • Inboun
- Page 994:
482
- Page 998:
484 Air Cargo Facilities EXPORT WAR
- Page 1002:
486 Air Cargo Facilities processed
- Page 1006:
488 Air Cargo Facilities 6 Large 4
- Page 1010:
490 Airport Drainage and Pavement D
- Page 1014:
492 Airport Drainage and Pavement D
- Page 1018:
494 9 9 8 8 10 year 7 7 5 year 6 6
- Page 1022:
496 Airport Drainage and Pavement D
- Page 1026:
498 Airport Drainage and Pavement D
- Page 1030:
500 Airport Drainage and Pavement D
- Page 1034:
502 Airport Drainage and Pavement D
- Page 1038:
504 Airport Drainage and Pavement D
- Page 1042:
506 Airport Drainage and Pavement D
- Page 1046:
508 Airport Drainage and Pavement D
- Page 1050:
510 Airport Drainage and Pavement D
- Page 1054:
512 Airport Drainage and Pavement D
- Page 1058:
514 Table 12.4 (Continued) Subgrade
- Page 1062:
516 Airport Drainage and Pavement D
- Page 1066:
518 Airport Drainage and Pavement D
- Page 1070:
520 Airport Drainage and Pavement D
- Page 1074:
522 Airport Drainage and Pavement D
- Page 1078:
524 Airport Drainage and Pavement D
- Page 1082:
526 Airport Drainage and Pavement D
- Page 1086:
528 Airport Drainage and Pavement D
- Page 1090:
530 Airport Drainage and Pavement D
- Page 1094:
532 Airport Drainage and Pavement D
- Page 1098:
534 Airport Drainage and Pavement D
- Page 1102:
536 Airport Drainage and Pavement D
- Page 1106:
538 Airport Drainage and Pavement D
- Page 1110:
540 Airport Drainage and Pavement D
- Page 1114:
542 Airport Drainage and Pavement D
- Page 1118:
544 Airport Access Figure 13.1 Comp
- Page 1122:
546 Figure 13.2 Access system.
- Page 1126:
548 Airport Access services, visito
- Page 1130:
550 Airport Access Urban Bus access
- Page 1134:
552 Airport Access area. Because th
- Page 1138:
554 Airport Access In the 1990s, a
- Page 1142:
556 Airport Access VTOL Links Marke
- Page 1146:
558 Airport Access X2 = percentage
- Page 1150:
560 Airport Access Public auto park
- Page 1154:
562 Airport Access A pricing struct
- Page 1158:
564 Airport Access Single-Curb Mode
- Page 1162:
566 Airport Access (d) (e) Figure 1
- Page 1166:
568 Airport Access land use so clos
- Page 1170:
570 Airport Access facilities. Simi
- Page 1174:
572 Airport Access 3. Leigh, F., M.
- Page 1178:
574 Heliports, STOLports, and Verti
- Page 1182:
576 Heliports, STOLports, and Verti
- Page 1186:
578 Heliports, STOLports, and Verti
- Page 1190:
580 Heliports, STOLports, and Verti
- Page 1194:
582 Heliports, STOLports, and Verti
- Page 1198:
584 Heliports, STOLports, and Verti
- Page 1202:
586 Heliports, STOLports, and Verti
- Page 1206:
588 Heliports, STOLports, and Verti
- Page 1210:
590 Heliports, STOLports, and Verti
- Page 1214:
592 Heliports, STOLports, and Verti
- Page 1218:
594 Heliports, STOLports, and Verti
- Page 1222:
596 Heliports, STOLports, and Verti
- Page 1226:
598 Heliports, STOLports, and Verti
- Page 1230:
600 Heliports, STOLports, and Verti
- Page 1234:
15 15.1 INTRODUCTION 602 Airport Mo
- Page 1238:
604 Airport Modeling and Simulation
- Page 1242:
606 Airport Modeling and Simulation
- Page 1246:
608 Airport Modeling and Simulation
- Page 1250:
610 Airport Modeling and Simulation
- Page 1254:
612 Airport Modeling and Simulation
- Page 1258:
614 Airport Modeling and Simulation
- Page 1262:
616 Airport Modeling and Simulation
- Page 1266:
618 Airport Modeling and Simulation
- Page 1270:
620 Airport Modeling and Simulation
- Page 1274:
622 Airport Modeling and Simulation
- Page 1278:
624 Airport Modeling and Simulation
- Page 1282:
626 Airport Modeling and Simulation
- Page 1286:
628 Airport Modeling and Simulation
- Page 1290:
630 Airport Modeling and Simulation
- Page 1294:
632 Airport Modeling and Simulation
- Page 1298:
634 Airport Modeling and Simulation
- Page 1302:
636 Airport Modeling and Simulation
- Page 1306:
638 Airport Modeling and Simulation
- Page 1310:
640 Airport Modeling and Simulation
- Page 1314:
642 Airport Modeling and Simulation
- Page 1318:
644 Airport Modeling and Simulation
- Page 1322:
646 Airport Modeling and Simulation
- Page 1326:
648 Airport Modeling and Simulation
- Page 1330:
650 Airport Modeling and Simulation
- Page 1334:
652 Airport Modeling and Simulation
- Page 1338:
654 Airport Modeling and Simulation
- Page 1342:
656 Airport Modeling and Simulation
- Page 1346:
658 Airport Modeling and Simulation
- Page 1350:
660 Airport City 16.2 GLOBAL CITY h
- Page 1354:
662 Airport City Chicago Toronto Me
- Page 1358:
664 Airport City Another objective
- Page 1362:
666 Airport City Another feature in
- Page 1366:
668 OUTSIDE FENCE Broader Aerotropo
- Page 1370:
670 Airport City residential develo
- Page 1374:
672 Airport City business community
- Page 1378:
674 Airport City Schiphol 2005 Schi
- Page 1382:
676 Airport City • Airport Plaza.
- Page 1386:
678 Airport City Figure 16.10 Schip
- Page 1390:
680 Airport City might be more dire
- Page 1394:
682 Airport City (a) (b) Figure 16.
- Page 1398:
684 Airport City North Side Station
- Page 1402:
686 Airport City Figure 16.18 Plan
- Page 1406:
688 Airport City One only needs to
- Page 1410:
690 Airport City airport support co
- Page 1414:
692 Airport City (c) Ocean Landmark
- Page 1418:
694 Airport City xxxx Flower Centre
- Page 1422:
696 Airport City Figure 16.29 Ultim
- Page 1426:
698 Airport City Figure 16.32 DWC L
- Page 1430:
700 Airport City Figure 16.35 DWC g
- Page 1434:
702 Airport City • Ensure commitm
- Page 1438:
17 17.1 INTRODUCTION 704 Environmen
- Page 1442:
706 Environmental Impacts of Airpor
- Page 1446:
708 Environmental Impacts of Airpor
- Page 1450:
710 Environmental Impacts of Airpor
- Page 1454:
712 Environmental Impacts of Airpor
- Page 1458:
714 Environmental Impacts of Airpor
- Page 1462:
716 Environmental Impacts of Airpor
- Page 1466:
718 Environmental Impacts of Airpor
- Page 1470:
720 Environmental Impacts of Airpor
- Page 1474:
722 Environmental Impacts of Airpor
- Page 1478:
724 Environmental Impacts of Airpor
- Page 1482:
726 Environmental Impacts of Airpor
- Page 1486:
728 Environmental Impacts of Airpor
- Page 1490:
730 Environmental Impacts of Airpor
- Page 1494:
732 Environmental Impacts of Airpor
- Page 1498:
734 Environmental Impacts of Airpor
- Page 1502:
736 Environmental Impacts of Airpor
- Page 1506:
738 Environmental Impacts of Airpor
- Page 1510:
740 Index Air freight demand (conti
- Page 1514:
742 Index Annual service volume (AS
- Page 1518:
744 Index Environmental review, pro
- Page 1522:
746 Index Global city characteristi
- Page 1526:
748 Index McKinley Conway concepts,
- Page 1530:
750 Index Piper, Hans, 451 Planning
- Page 1534:
752 Index Takeoff and landing area