Statements of Activities Years ended September 30, <strong>1998</strong> and 1997 18 <strong>1998</strong> 1997 Temporarily Permanently Temporarily Permanently Unrestricted restricted restricted Total Unrestricted restricted restricted Total Revenue, gains and other support: Contributions and private grants $ 1,001,106 2,158,496 25,000 3,184,602 821,513 2,091,306 – 2,912,819 Government grants and contracts 442,165 201,666 – 643,831 246,381 121,394 – 367,775 Special events revenue $ 1,371,594 732,605 Less cost of direct benefit to donors (418,150) (292,766) Net revenues from special events 953,444 – – 953,444 439,839 – – 439,839 Net appreciation on investments and funds held by trustees 97,026 (173,020) 218,242 142,248 285,440 156,919 1,335,955 1,778,314 Investment income 161,044 372,616 – 533,660 179,551 305,034 – 484,585 Program-related revenue 497,191 3,750 – 500,941 429,224 4,720 – 433,944 Miscellaneous 40,617 7,879 – 48,496 47,258 5,660 – 52,918 Net assets released from restrictions (note 10) 2,505,557 (2,505,557) – – (2,538,702) -2,538,702 – – Revenue, gains and other support, including net revenues from special events 5,698,150 65,830 243,242 6,007,222 4,987,908 146,331 1,335,955 6,470,194 Expenses: Program services (note 2): Affiliates services/growth 1,861,050 – – 1,861,050 1,509,921 – – 1,509,921 Program, research and training 1,831,958 – – 1,831,958 1,717,312 – – 1,717,312 Communications and advocacy 526,757 – – 526,757 491,391 – – 491,391 Total program services 4,219,765 – – 4,219,765 3,718,624 – – 3,718,624 Supporting services: Management and general 912,316 – – 912,316 665,936 – – 665,936 Fund-raising 816,998 – – 816,998 601,195 – – 601,195 Total supporting services 1,729,314 – – 1,729,314 1,267,131 – – 1,267,131 Total expenses 5,949,079 – – 5,949,079 4,985,755 – – 4,985,755 <strong>Inc</strong>rease (decrease) in net assets (250,929) 65,830 243,242 58,143 2,153 146,331 1,335,955 1,484,439 Net assets at beginning of year 878,986 2,715,534 10,400,930 13,995,450 876,833 2,569,203 9,064,975 12,511,011 Net assets at end of year $ 628,057 2,781,364 10,644,172 14,053,593 878,986 2,715,534 10,400,930 13,995,450 See accompanying notes to financial statements. In our opinion, the financial statements referred to above present fairly, in all material respects, the financial position of <strong>Girls</strong> <strong>Inc</strong>orporated as of September 30, <strong>1998</strong> and 1997, and the changes in its net assets and its cash flows for the years then ended in conformity with generally accepted accounting principles. evidence supporting the amounts and disclosures in the financial statements. An audit also includes assessing the accounting principles used and significant estimates made by management, as well as evaluating the overall financial statement presentation. We believe that our audits provide a reasonable basis for our opinion. responsibility is to express an opinion on these financial statements based on our audits. December 4, <strong>1998</strong> We conducted our audits in accordance with generally accepted auditing standards. Those standards require that we plan and perform the audit to obtain reasonable assurance about whether the financial statements are free of material misstatement. An audit includes examining, on a test basis, The Board of Directors <strong>Girls</strong> <strong>Inc</strong>orporated: We have audited the accompanying balance sheets of <strong>Girls</strong> <strong>Inc</strong>orporated as of September 30, <strong>1998</strong> and 1997, and the related statements of activities and cash flows for the years then ended. These financial statements are the responsibility of the management of <strong>Girls</strong> <strong>Inc</strong>orporated. Our
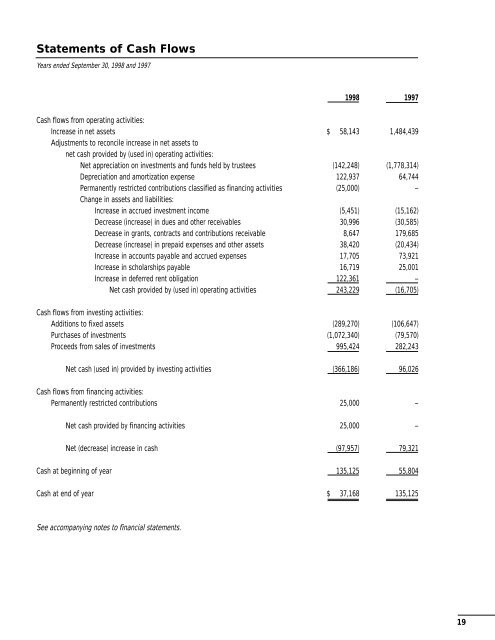
Statements of Cash Flows Years ended September 30, <strong>1998</strong> and 1997 <strong>1998</strong> 1997 Cash flows from operating activities: <strong>Inc</strong>rease in net assets $ 58,143 1,484,439 Adjustments to reconcile increase in net assets to net cash provided by (used in) operating activities: Net appreciation on investments and funds held by trustees (142,248) (1,778,314) Depreciation and amortization expense 122,937 64,744 Permanently restricted contributions classified as financing activities (25,000) – Change in assets and liabilities: <strong>Inc</strong>rease in accrued investment income (5,451) (15,162) Decrease (increase) in dues and other receivables 30,996 (30,585) Decrease in grants, contracts and contributions receivable 8,647 179,685 Decrease (increase) in prepaid expenses and other assets 38,420 (20,434) <strong>Inc</strong>rease in accounts payable and accrued expenses 17,705 73,921 <strong>Inc</strong>rease in scholarships payable 16,719 25,001 <strong>Inc</strong>rease in deferred rent obligation 122,361 – Net cash provided by (used in) operating activities 243,229 (16,705) Cash flows from investing activities: Additions to fixed assets (289,270) (106,647) Purchases of investments (1,072,340) (79,570) Proceeds from sales of investments 995,424 282,243 Net cash (used in) provided by investing activities (366,186) 96,026 Cash flows from financing activities: Permanently restricted contributions 25,000 – Net cash provided by financing activities 25,000 – Net (decrease) increase in cash (97,957) 79,321 Cash at beginning of year 135,125 55,804 Cash at end of year $ 37,168 135,125 See accompanying notes to financial statements. 19