You also want an ePaper? Increase the reach of your titles
YUMPU automatically turns print PDFs into web optimized ePapers that Google loves.
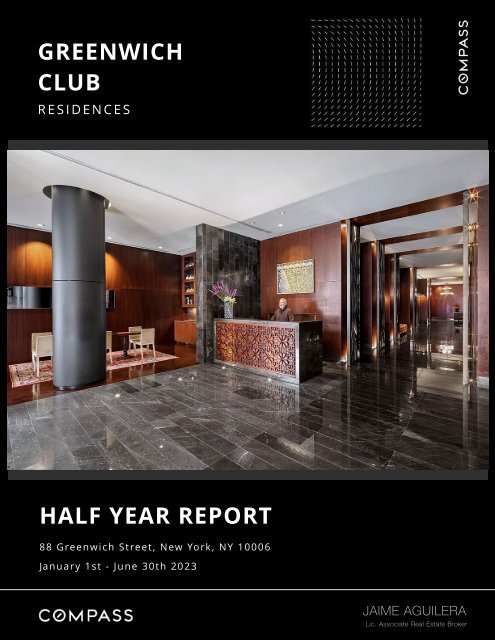
GREENWICH<br />
CLUB<br />
RESIDENCES<br />
HALF YEAR REPORT<br />
<strong>88</strong> <strong>Greenwich</strong> <strong>St</strong>reet, New York, NY 10006<br />
January 1st - June 30th 2023<br />
JAIME AGUILERA<br />
Lic. Associate Real Estate Broker
<strong>88</strong> <strong>Greenwich</strong> <strong>St</strong>reet - Sales Market Analysis <br />
Sales Activity: January 1 - June 30, 2023.<br />
Size<br />
Average Sales <br />
Price<br />
Sold Units<br />
(YTD)<br />
Avg. Price per SF<br />
% Change (YTD)<br />
Average Days <br />
on Market<br />
<strong>St</strong>udio $577,500 2 2.06% 124<br />
1 Bedroom $869,167 6 11.32% 126<br />
2 Bedroom $1,630,000 1 no data 51<br />
Total $<strong>88</strong>8,<strong>88</strong>8 9 0.17% 116<br />
Market Overview:<br />
From January 1st to June 30th, 2023, property sales at <strong>88</strong> <strong>Greenwich</strong> <strong>St</strong> witnessed<br />
significant shifts compared to the same period in 2022, with an overall impact on key<br />
market indicators:<br />
• Sales Price: The average sales price increased in 2023, reaching $<strong>88</strong>8,<strong>88</strong>8, marking a<br />
growth of 11.91% from 2022's average of $794,350.<br />
• Days on Market: The average days on the market increased to 116 in 2023, an 11.54%<br />
rise compared to the previous year's average of 104 days.<br />
• Units Sold: The number of units sold declined to 9 during the first half of 2023, a 55%<br />
reduction from the 20 units sold in the same period in 2022.<br />
• Sales Volume: The total sales volume in the first half of 2023 was $7,999,999, a<br />
substantial decrease of 49.66% from 2022's total sales volume of $15,<strong>88</strong>7,000.<br />
• Price per Square Foot: The average price per square foot experienced a minimal<br />
increase of 0.17%, resulting in an average of $1,175 in 2023.<br />
Breaking down the sales by unit type, we can observe the following trends:<br />
• <strong>St</strong>udio Apartments: Two studio units sold at an average price of $577,500. The<br />
average price per square foot dropped by 2.06% compared to the previous year.
<strong>88</strong> <strong>Greenwich</strong> <strong>St</strong>reet - Sales Market Analysis <br />
• 1 Bedroom Units: The market for 1-bedroom units showed a slowdown, with six units<br />
sold at an average price of $869,167. This denotes a decline of 11.32% in the average<br />
price per square foot from the previous year. These units remained on the market for an<br />
average of 126 days.<br />
• 2 Bedroom Units: The first semester of 2023 saw a single 2-bedroom unit sold for<br />
$1,630,000. No comparative data is available from the previous year for this category.<br />
The unit was sold after being listed for 51 days.<br />
• Summary: The first half of 2023 brought mixed trends for the sales market at <strong>88</strong><br />
<strong>Greenwich</strong> <strong>St</strong>. A decrease in the number of units sold and total sales volume was<br />
recorded, even as the average sales price showed an uptick. The lengthier average<br />
days on market suggests slower market activity. Trends per unit type were varied, with<br />
studio and 1-bedroom units seeing a decrease in average price per square foot,<br />
indicative of market adjustments in response to higher interest rates and shifting buyer<br />
preferences.<br />
Recent Sales:<br />
Apartment Size Sold Price $/PSF DOM Date Sold<br />
2704 1 Bedroom $999,999 $1,317 195 6/22/2023<br />
1809 2 Bedroom $1,630,000 $1,436 51 5/25/2023<br />
1903 1 Bedroom $810,000 $1,126 328 5/19/2023<br />
2006 1 Bedroom $810,000 $1,096 118 4/28/2023<br />
910 <strong>St</strong>udio $560,000 $1,057 66 4/12/2023<br />
917 1 Bedroom $970,000 $1,098 15 3/19/2023<br />
1405 <strong>St</strong>udio $595,000 $1,031 182 2/21/2023<br />
916 1 Bedroom $875,000 $1,180 42 2/10/2023<br />
616 1 Bedroom $750,000 $1,233 45 1/20/2023
<strong>88</strong> <strong>Greenwich</strong> <strong>St</strong>reet - Rental Market Analysis <br />
Rental Activity: January 1 - June 30, 2023.<br />
Size<br />
Average Asking<br />
Rent<br />
Leased<br />
Units<br />
Avg. Asking Rent %<br />
Change<br />
Average<br />
Days <br />
on Market<br />
<strong>St</strong>udio $3,209 14 4.24% 26<br />
1 Bedroom $4,394 10 6.95% 29<br />
2 Bedroom $4,600 1 no data 14<br />
Total $3,738 25 7.51% 27<br />
Rental Market Overview:<br />
Between January 1st and June 30th, 2023, the rental market at <strong>Greenwich</strong> Club<br />
Residences experienced considerable changes compared to the same period in 2022,<br />
as noted in multiple key market indicators:<br />
• Average Rent: The average rental price saw a notable rise, achieving $3,738 in 2023.<br />
This represents a 7.51% increase from 2022's average of $3,477.<br />
• Days on Market: The average duration of properties on the market also increased,<br />
going up to 27 days. This is an 80% rise from the average of 15 days observed in the<br />
previous year.<br />
• Rental Price per Square Foot: The average price per square foot showed a modest<br />
increase, reaching $70 PSF in 2023, compared to the previous year's average of $69<br />
PSF.<br />
Here's a detailed breakdown of the performance of each unit type:<br />
• <strong>St</strong>udio Apartments: 14 studio units were leased at an average price of $3,209, marking<br />
a 4.24% decrease in the average asking rent from the previous year.<br />
• 1 Bedroom Units: 1-bedroom units displayed an upswing, with 10 units rented at an<br />
average price of $4,394. This represents a 6.95% increase in the average asking rent<br />
from the previous year. These units stayed on the market for an average of 29 days.
<strong>88</strong> <strong>Greenwich</strong> <strong>St</strong>reet - Rental Market Analysis <br />
• 2 Bedroom Units: The first half of 2023 saw a single 2-bedroom unit leased for $4,600.<br />
No comparable data is available from the previous year for this category. The unit was<br />
rented after being on the market for 14 days.<br />
• Summary: In the first half of 2023, the rental market at <strong>88</strong> <strong>Greenwich</strong> <strong>St</strong> indicated<br />
increased activity, marked by a rise in both the average rent and price per square foot.<br />
However, properties also stayed on the market for longer. The mixed trends across unit<br />
types—falling asking rent for studio apartments and increasing asking rent for 1-<br />
bedroom units—indicate nuanced shifts in tenant demand, potentially influenced by<br />
changes in demographic and economic factors. The data suggests a dynamic market<br />
responding to a diverse set of tenant needs and expectations.<br />
Recent Rentals:<br />
Apartment<br />
Size<br />
Last Asking<br />
Price<br />
DOM<br />
Leased Date<br />
1409 1 Bedroom $3,600 6 6/25/2023<br />
2004 1 Bedroom $4,495 29 6/1/2023<br />
603 <strong>St</strong>udio $3,400 36 5/31/2023<br />
1706 1 Bedroom $4,500 52 5/26/2023<br />
629 <strong>St</strong>udio $3,400 13 5/23/2023<br />
907 1 Bedroom $4,500 62 5/20/2023<br />
2304 2 Bedroom $4,600 14 5/18/2023<br />
320 <strong>St</strong>udio $2,750 - 5/18/2023<br />
1613 <strong>St</strong>udio $3,600 19 5/9/2023<br />
1908 1 Bedroom $3,695 10 5/2/2023<br />
926 <strong>St</strong>udio $3,200 6 5/2/2023<br />
1804 1 Bedroom $4,850 7 4/29/2023
Financial District - <strong>Half</strong> <strong>Year</strong> Sales <strong>Report</strong><br />
Condominium Market Analysis<br />
Market Metrics First <strong>Half</strong> 2023 First <strong>Half</strong> 2022 % Change<br />
Number of Sales 218 297 26.6%<br />
Average Sales Price<br />
Average Discount<br />
Average Price per SF<br />
Average SF<br />
Average Days on Market<br />
$1,441,959 $1,903,518 24.25%<br />
8% 6% 33.33%<br />
$1,427 $1,479 3.51%<br />
1,013 1,193 15.08%<br />
98 196 50%<br />
Market Overview:<br />
The Financial District's condominium market saw significant shifts during the first<br />
semester of 2023 compared to the same period in 2022. Several market metrics,<br />
including the number of sales, average sales price, and average price per square foot,<br />
displayed downward movement. Meanwhile, the average discount saw a notable<br />
increase. The average square footage of units sold also experienced a downturn.<br />
• Number of Sales: The number of sales decreased notably in the first semester of 2023.<br />
A total of 218 units were sold, showing a 26.6% drop compared to the first semester of<br />
2022, which witnessed 297 units sold.<br />
• Average Sales Price and Price per SF: The average sales price also demonstrated a<br />
downturn, falling 24.25% from the first semester of 2022 ($1,903,518) to the first<br />
semester of 2023 ($1,441,959). Correspondingly, the average price per square foot<br />
declined by 3.51% to $1,427 during this period.<br />
• Average Discount: Interestingly, amidst these downward trends, the average discount<br />
on condos increased. There was an uptick of 33.33% in the average discount, moving<br />
from 6% in the first semester of 2022 to 8% in the first semester of 2023. This rise may<br />
reflect an attempt to spur sales in a slower market.
Financial District - <strong>Half</strong> <strong>Year</strong> Sales <strong>Report</strong><br />
Condominium Market Analysis<br />
• Average Square Footage: Concurrently, the average square footage of condos sold<br />
also experienced a decline of 15.08%. This went from 1,193 SF in the first semester of<br />
2022 to 1,013 SF in the first semester of 2023, possibly indicating a preference for<br />
smaller units and tighter supply of larger units. <br />
• Average Days on Market: In a positive trend, condos spent significantly less time on<br />
the market. The average days on the market reduced by a remarkable 50%, falling<br />
from 196 days in the first semester of 2022 to 98 days in the first semester of 2023.<br />
• Summary: The Financial District's condo market showed mixed signals during the first<br />
semester of 2023. While falling prices and reduced sales hint at a softer market, the<br />
substantial decrease in the average days on the market coupled with an increased<br />
average discount might suggest an increase in buyer activity, potentially setting the<br />
stage for a more dynamic second half of the year. However, the real estate market is<br />
often influenced by many variables, so it's essential to observe the market trends<br />
carefully over the coming months.
Residence 916 | 1 BR | 1 BA | 656 SF | $875,000 | SOLD<br />
Residence 616 | 1 BR | 1 BA | 608 SF | $750,000 | SOLD
Residence 307 | 1 BR | 1 BA | 732 SF | $3,650 | RENTED<br />
Residence 503 | <strong>St</strong>udio | 1 BA | 625 SF | $3,400 | RENTED
Residence 1706 | 1 BR | 1 BA | 714 SF | $4,500 | RENTED<br />
Residence 725 | 1 BR | 1 BA | 845 SF | $4,200 | RENTED
Residence 1310 | <strong>St</strong>udio | 1 BA | 511 SF | $3,195 | RENTED<br />
Residence 420 | <strong>St</strong>udio | 1 BA | 508 SF | $2,9<strong>88</strong> | RENTED
Jaime Aguilera<br />
Lic. Associate Real Estate Broker<br />
212 470 8774<br />
110 Fifth Avenue<br />
New York, NY 10003


