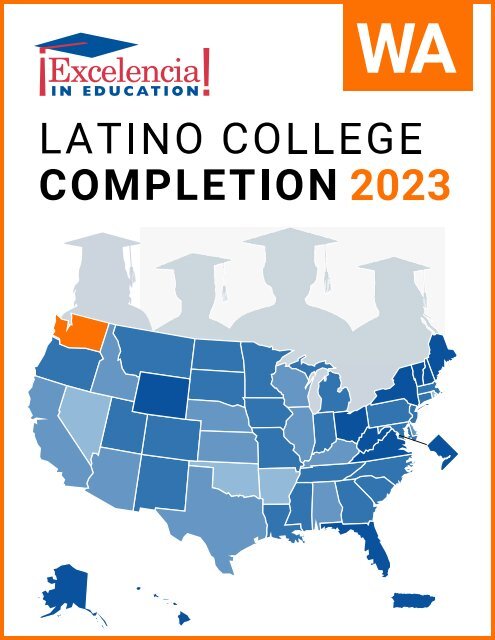
Latino College Completion 2023: Washington

Create successful ePaper yourself
Turn your PDF publications into a flip-book with our unique Google optimized e-Paper software.
WA
LATINO COLLEGE COMPLETION:<br />
WASHINGTON – <strong>2023</strong><br />
For the U.S. to regain the top ranking in the world for college degree<br />
attainment, <strong>Latino</strong>s will need to earn 6.2 million degrees by 2030. 1<br />
FAST FACTS<br />
STATE RANKING:<br />
<strong>Washington</strong> had the 13th largest<br />
<strong>Latino</strong> population in the U.S.<br />
K-12 POPULATION:<br />
In <strong>Washington</strong>, 22% of the K-12<br />
population was <strong>Latino</strong>. 2<br />
POPULATION:<br />
In <strong>Washington</strong>, 14% of the<br />
population was <strong>Latino</strong>. 2<br />
MEDIAN AGE:<br />
The median age<br />
of Hispanics in<br />
<strong>Washington</strong> was<br />
26, compared<br />
to 43 for White<br />
non-Hispanics. 2<br />
26<br />
Hispanics<br />
43<br />
White<br />
non-Hispanics<br />
ENROLLMENT:<br />
In <strong>Washington</strong>, 18% of Hispanics<br />
(ages 18 to 34) were enrolled in higher<br />
education, compared to 18% of<br />
White non-Hispanics. 2<br />
DEGREE ATTAINMENT:<br />
In <strong>Washington</strong>, 28% of Hispanic<br />
adults (25 and older) had earned an<br />
associate degree or higher, compared to<br />
51% of White non-Hispanic adults. 2<br />
Hispanic Adults = 2.8 of 10<br />
To reach the degree attainment goal by 2030, the U.S. can: close<br />
the degree completion gap by accelerating <strong>Latino</strong> completion while<br />
increasing for all students and scale up programs and initiatives that<br />
work for <strong>Latino</strong>, and all, students. The following demographics,<br />
institutional data, and practices inform <strong>Latino</strong> degree attainment.<br />
ENROLLING: Top 5 Institutions (Hispanic Undergraduates) in <strong>Washington</strong>, 2021-22<br />
Institution<br />
Sector<br />
Grand<br />
Total<br />
Hispanic<br />
Total<br />
5 Eastern <strong>Washington</strong> University Public, 4-year 2,191 334 15%<br />
NOTE: We use the terms <strong>Latino</strong> and Hispanic interchangeably in this factsheet.<br />
Source: Excelencia in Education analysis using U.S. Department of Education, National Center for<br />
Education Statistics (NCES), Integrated Postsecondary Education Data System (IPEDS), 2021 Fall<br />
Enrollment, Graduation Rates Survey and Institutional Characteristics Survey.<br />
%<br />
Hispanic<br />
1 <strong>Washington</strong> State University Public, 4-year 23,966 3,843 16%<br />
2 University of <strong>Washington</strong>-Seattle Campus Public, 4-year 31,367 2,949 9%<br />
3 Columbia Basin <strong>College</strong> Public, 4-year 5,301 2,403 45%<br />
4 Central <strong>Washington</strong> University Public, 4-year 9,508 1,752 18%<br />
5 Yakima Valley <strong>College</strong> Public, 4-year 2,761 1,588 58%<br />
ASSOCIATE DEGREES: Top 5 Institutions Awarding to Hispanics in <strong>Washington</strong>, 2020-21<br />
Institution<br />
Sector<br />
Grand<br />
Total<br />
Hispanic<br />
Total<br />
%<br />
Hispanic<br />
1 Columbia Basin <strong>College</strong> Public, 4-year 1,364 587 43%<br />
2 Yakima Valley <strong>College</strong> Public, 4-year 783 435 56%<br />
3 Pierce <strong>College</strong> District Public, 4-year 1,576 240 15%<br />
4 Wenatchee Valley <strong>College</strong> Public, 4-year 643 236 37%<br />
5 Bellevue <strong>College</strong> Public, 4-year 2,211 214 10%<br />
BACHELOR DEGREES: Top 5 Institutions Awarding to Hispanics in <strong>Washington</strong>, 2020-21<br />
Institution<br />
Sector<br />
Grand<br />
Total<br />
Hispanic<br />
Total<br />
%<br />
Hispanic<br />
1 <strong>Washington</strong> State University Public, 4-year 6,157 924 15%<br />
2 University of <strong>Washington</strong>-Seattle Campus Public, 4-year 8,100 685 8%<br />
3 Central <strong>Washington</strong> University Public, 4-year 2,756 456 17%<br />
4 Western <strong>Washington</strong> University Public, 4-year 3,427 350 10%<br />
White Adults = 5.1 of 10<br />
1 Projections to 2030: Excelencia in Education. (2020). Ensuring America’s Future: Benchmarking <strong>Latino</strong><br />
<strong>College</strong> <strong>Completion</strong> to 2030. Excelencia in Education. <strong>Washington</strong>, D.C.<br />
2 U.S. Census Bureau, 2021 American Community Survey 1-Year Estimates
<strong>Washington</strong> Gap in Degree <strong>Completion</strong><br />
Closing the degree completion gap can be tracked<br />
by the 4 measures shown below. Alone, none<br />
of these measures capture the entire “story” of<br />
degree completion. However, in combination,<br />
they provide a useful picture of the gap in degree<br />
attainment between Hispanic and White non-<br />
Hispanic cohorts in a single year.<br />
Graduation Rate — Total percentage of students<br />
who graduated within 150% of normal time for<br />
first-time, full-time freshmen. This incorporates<br />
students that graduated in 3 years at two-year<br />
institutions, or in 6 years at four-year institutions.<br />
Transferred to Another Institution —<br />
Percentage of students that transferred to another<br />
institution and did not complete a degree.<br />
Still Enrolled — Percentage of students that are<br />
still enrolled at the point of 150% normal time to<br />
completion.<br />
No Longer Enrolled — Percentage of students<br />
that are no longer enrolled at the point of 150%<br />
normal time to completion.<br />
At two-year institutions, Hispanics’<br />
graduation rate was 1%-point<br />
higher than that of their White<br />
non-Hispanic peers in <strong>Washington</strong>.<br />
TWO-YEAR INSTITUTIONS<br />
DEGREE OUTCOMES<br />
At four-year institutions, Hispanics’<br />
graduation rate was 12%-points<br />
lower than that of their White<br />
non-Hispanic peers in <strong>Washington</strong>.<br />
31%<br />
30%<br />
32%<br />
41%<br />
■ No Longer Enrolled<br />
6% 3%<br />
5%<br />
■ Still Enrolled<br />
7%<br />
9%<br />
6% 5%<br />
+1%<br />
■ Transferred to<br />
6%<br />
-12%<br />
Another Institution<br />
55%<br />
WHITE<br />
56%<br />
HISPANIC<br />
■ Graduation Rate<br />
*Percentages may not add up to 100% due to rounding.<br />
FOUR-YEAR INSTITUTIONS<br />
60%<br />
WHITE<br />
48%<br />
HISPANIC<br />
NOTE: Outcomes shown are for students at two-year institutions who started in Fall 2018, and<br />
for students at four-year institutions who started in Fall 2015.<br />
Source: Excelencia in Education analysis using the U.S. Department of Education, National<br />
Center for Education Statistics (NCES), Integrated Postsecondary Education Data System, 2021<br />
Graduation Rates Survey and the Institutional Characteristics Survey.<br />
Examples of What Works for <strong>Latino</strong> Students<br />
There are institutions showing success in enrolling, retaining, and graduating <strong>Latino</strong> students. The following are examples of<br />
programs across the country with evidence of effectiveness in serving <strong>Latino</strong> students nominated for Examples of Excelencia.<br />
<strong>Washington</strong> State University’s <strong>College</strong> Assistance Migrant Program<br />
(CAMP)’s mission is to improve the lives of migrant or seasonal<br />
farmworkers (MSFW) and their families through higher education<br />
attainment. CAMP’s claim is that qualified and motivated MSFW<br />
students, who participate in WSU CAMP and actively seek opportunities<br />
to engage with the university community will successfully complete<br />
their freshman year (24 credits) and be retained as they continue to<br />
their sophomore year. Additionally, students receive non-monetary<br />
support from CAMP staff during the entirety of their academic careers<br />
to reach the ultimate goal of graduation. In 2006, Latinx undergraduate<br />
enrollment at WSU was at about 1000 of 19,000 students - about 5%<br />
of the student body. This low number of Latinx students prompted the<br />
university to strategically provide programming which targeted Latinx<br />
student success. CAMP was part of this strategy. CAMP is housed<br />
within Student Affairs with the intent to easily connect students to<br />
other service departments. WSU CAMP has evolved to include priority<br />
registration for classes, personalized academic coaching, a Spanish<br />
language parent-centric orientation, collaboration with other institutions,<br />
departments, and constituents for a regional leadership conference,<br />
a weekend personal development retreat, the inclusion of a career<br />
development course, and increased financial assistance ($1000 stipend).<br />
Students participating in CAMP are more likely to graduate compared<br />
to the control group, Latinx students not participating in CAMP, and<br />
the general student population at WSU. WSU CAMP has averaged<br />
90% first-year completion of 24 credits, and 98% retention Fall-to-Fall<br />
for freshmen completing 24 credits over the past ten (10) years. This<br />
performance is significant compared to WSU’s general New Freshmen<br />
Full-Time Student Fall-to-Fall retention rate of 79%, and all other Fallto-Fall<br />
full-time, minority, low income, and first-generation students of<br />
75%. The WSU CAMP Graduation Rate for 4 - 6 years is 13% higher<br />
than the general WSU population, 16% higher than the control group<br />
made up of migrant or seasonal farm working qualified students, and<br />
19% higher than the general Latinx student population.<br />
For more information on institutional programs improving <strong>Latino</strong> student success in higher education, access Excelencia in<br />
Education’s Growing What Works database at http://www.edexcelencia.org/growing-what-works<br />
ENSURING AMERICA’S FUTURE BY INCREASING LATINO COLLEGE COMPLETION • WWW.EDEXCELENCIA.ORG