Latino College Completion 2023: Pennsylvania

You also want an ePaper? Increase the reach of your titles
YUMPU automatically turns print PDFs into web optimized ePapers that Google loves.
PA
LATINO COLLEGE COMPLETION:<br />
PENNSYLVANIA – <strong>2023</strong><br />
For the U.S. to regain the top ranking in the world for college degree<br />
attainment, <strong>Latino</strong>s will need to earn 6.2 million degrees by 2030. 1<br />
FAST FACTS<br />
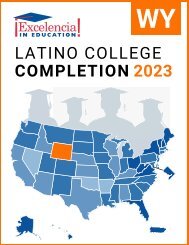
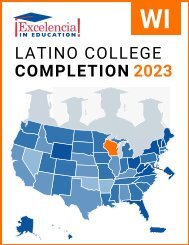
STATE RANKING:<br />
<strong>Pennsylvania</strong> had the 10th largest<br />
<strong>Latino</strong> population in the U.S.<br />
K-12 POPULATION:<br />
In <strong>Pennsylvania</strong>, 13% of the K-12<br />
population was <strong>Latino</strong>. 2<br />
POPULATION:<br />
In <strong>Pennsylvania</strong>, 8% of the<br />
population was <strong>Latino</strong>. 2<br />
MEDIAN AGE:<br />
The median age<br />
of Hispanics in<br />
<strong>Pennsylvania</strong> was<br />
28, compared<br />
to 45 for White<br />
non-Hispanics. 2<br />
28<br />
Hispanics<br />
45<br />
White<br />
non-Hispanics<br />
ENROLLMENT:<br />
In <strong>Pennsylvania</strong>, 18% of Hispanics<br />
(ages 18 to 34) were enrolled in higher<br />
education, compared to 23% of<br />
White non-Hispanics. 2<br />
DEGREE ATTAINMENT:<br />
In <strong>Pennsylvania</strong>, 28% of Hispanic<br />
adults (25 and older) had earned an<br />
associate degree or higher, compared to<br />
45% of White non-Hispanic adults. 2<br />
Hispanic Adults = 2.8 of 10<br />
To reach the degree attainment goal by 2030, the U.S. can: close<br />
the degree completion gap by accelerating <strong>Latino</strong> completion while<br />
increasing for all students and scale up programs and initiatives that<br />
work for <strong>Latino</strong>, and all, students. The following demographics,<br />
institutional data, and practices inform <strong>Latino</strong> degree attainment.<br />
ENROLLING: Top 5 Institutions (Hispanic Undergraduates) in <strong>Pennsylvania</strong>, 2021-22<br />
Institution<br />
Sector<br />
Grand<br />
Total<br />
NOTE: We use the terms <strong>Latino</strong> and Hispanic interchangeably in this factsheet.<br />
Hispanic<br />
Total<br />
Source: Excelencia in Education analysis using U.S. Department of Education, National Center for<br />
Education Statistics (NCES), Integrated Postsecondary Education Data System (IPEDS), 2021 Fall<br />
Enrollment, Graduation Rates Survey and Institutional Characteristics Survey.<br />
%<br />
Hispanic<br />
1 The <strong>Pennsylvania</strong> State University Public, 4-year 72,229 6,184 9%<br />
2 Temple University Public, 4-year 25,596 2,205 9%<br />
3 Community <strong>College</strong> of Philadelphia Public, 2-year 10,881 1,826 17%<br />
Northampton County Area Community<br />
4 <strong>College</strong><br />
Public, 2-year 7,173 1,825 25%<br />
5 Harrisburg Area Community <strong>College</strong> Public, 2-year 11,295 1,550 14%<br />
ASSOCIATE DEGREES: Top 5 Institutions Awarding to Hispanics in <strong>Pennsylvania</strong>, 2020-21<br />
Institution<br />
Sector<br />
Grand<br />
Total<br />
Hispanic<br />
Total<br />
%<br />
Hispanic<br />
Northampton County Area Community<br />
1 <strong>College</strong><br />
Public, 2-year 1,159 229 20%<br />
2 Community <strong>College</strong> of Philadelphia Public, 2-year 1,657 223 13%<br />
3 Lehigh Carbon Community <strong>College</strong> Public, 2-year 834 173 21%<br />
4 Harrisburg Area Community <strong>College</strong> Public, 2-year 1,876 169 9%<br />
5 Reading Area Community <strong>College</strong> Public, 2-year 433 144 33%<br />
BACHELOR DEGREES: Top 5 Institutions Awarding to Hispanics in <strong>Pennsylvania</strong>, 2020-21<br />
Institution<br />
Sector<br />
Grand Hispanic %<br />
Total Total Hispanic<br />
1 The <strong>Pennsylvania</strong> State University Public, 4-year 15,903 1,142 7%<br />
2 Temple University Public, 4-year 6,572 484 7%<br />
Private not-forprofit,<br />
4-year<br />
3 University of <strong>Pennsylvania</strong><br />
2,636 289 11%<br />
Private not-forprofit,<br />
4-year<br />
4 Drexel University<br />
3,150 216 7%<br />
University of Pittsburgh-Pittsburgh<br />
5 Campus<br />
Public, 4-year 4,652 188 4%<br />
White Adults = 4.5 of 10<br />
1 Projections to 2030: Excelencia in Education. (2020). Ensuring America’s Future: Benchmarking <strong>Latino</strong><br />
<strong>College</strong> <strong>Completion</strong> to 2030. Excelencia in Education. Washington, D.C.<br />
2 U.S. Census Bureau, 2021 American Community Survey 1-Year Estimates
<strong>Pennsylvania</strong> Gap in Degree <strong>Completion</strong><br />
Closing the degree completion gap can be tracked<br />
by the 4 measures shown below. Alone, none<br />
of these measures capture the entire “story” of<br />
degree completion. However, in combination,<br />
they provide a useful picture of the gap in degree<br />
attainment between Hispanic and White non-<br />
Hispanic cohorts in a single year.<br />
Graduation Rate — Total percentage of students<br />
who graduated within 150% of normal time for<br />
first-time, full-time freshmen. This incorporates<br />
students that graduated in 3 years at two-year<br />
institutions, or in 6 years at four-year institutions.<br />
Transferred to Another Institution —<br />
Percentage of students that transferred to another<br />
institution and did not complete a degree.<br />
Still Enrolled — Percentage of students that are<br />
still enrolled at the point of 150% normal time to<br />
completion.<br />
No Longer Enrolled — Percentage of students<br />
that are no longer enrolled at the point of 150%<br />
normal time to completion.<br />
At two-year institutions, Hispanics’<br />
graduation rate was 12%-points<br />
lower than that of their White<br />
non-Hispanic peers in <strong>Pennsylvania</strong>.<br />
TWO-YEAR INSTITUTIONS<br />
37%<br />
9%<br />
14%<br />
40%<br />
WHITE<br />
-12%<br />
51%<br />
12%<br />
10%<br />
28%<br />
HISPANIC<br />
DEGREE OUTCOMES<br />
■ No Longer Enrolled<br />
■ Still Enrolled<br />
■ Transferred to<br />
Another Institution<br />
■ Graduation Rate<br />
*Percentages may not add up to 100% due to rounding.<br />
At four-year institutions, Hispanics’<br />
graduation rate was 9%-points<br />
lower than that of their White<br />
non-Hispanic peers in <strong>Pennsylvania</strong>.<br />
FOUR-YEAR INSTITUTIONS<br />
1%<br />
14%<br />
13%<br />
72%<br />
WHITE<br />
1%<br />
-9%<br />
21%<br />
15%<br />
63%<br />
HISPANIC<br />
NOTE: Outcomes shown are for students at two-year institutions who started in Fall 2018, and<br />
for students at four-year institutions who started in Fall 2015.<br />
Source: Excelencia in Education analysis using the U.S. Department of Education, National<br />
Center for Education Statistics (NCES), Integrated Postsecondary Education Data System, 2021<br />
Graduation Rates Survey and the Institutional Characteristics Survey.<br />
Examples of What Works for <strong>Latino</strong> Students<br />
There are institutions showing success in enrolling, retaining, and graduating <strong>Latino</strong> students. The following are examples of<br />
programs across the country with evidence of effectiveness in serving <strong>Latino</strong> students nominated for Examples of Excelencia.<br />
Reading Area Community <strong>College</strong>’s English for Academic Purposes<br />
(EAP) Program offers credit courses in reading, writing, listening, and<br />
speaking for bilingual Spanish/English and non-native English speakers<br />
pursuing a college credential. The EAP program was redesigned in 2012<br />
to reduce credits and accelerate students through the ESL sequence<br />
to increase enrollment and enrollee success rates and repurpose<br />
the ESL lab. Since 2012, the EAP program has evolved to consist of<br />
a standardized curriculum for each course, offer paid professional<br />
development to faculty and staff, and enhance accessibility and<br />
resources to the Multilingual Learning Center. Through intentionally<br />
structured curricula, engagement in relevant and contextualized<br />
activities, and leverage of students’ use of their native languages to aid<br />
English acquisition, their program develops non-native English speakers’<br />
proficiency in academic English to become college-ready.<br />
In Fall 2017, 59% of new <strong>Latino</strong> students enrolled became college-ready<br />
in reading and writing within one year, compared to 39% in Fall 2012.<br />
From 2015-2017, an average of 31% of <strong>Latino</strong>s completed their firstyear<br />
composition courses one year after their ESL enrollment, a 16%<br />
increase from 2012-2014.<br />
For more information on institutional programs improving <strong>Latino</strong> student success in higher education, access Excelencia in<br />
Education’s Growing What Works database at http://www.edexcelencia.org/growing-what-works<br />
ENSURING AMERICA’S FUTURE BY INCREASING LATINO COLLEGE COMPLETION • WWW.EDEXCELENCIA.ORG