Latino College Completion 2023: Vermont

Create successful ePaper yourself
Turn your PDF publications into a flip-book with our unique Google optimized e-Paper software.
VT
LATINO COLLEGE COMPLETION:<br />
VERMONT – <strong>2023</strong><br />
For the U.S. to regain the top ranking in the world for college degree<br />
attainment, <strong>Latino</strong>s will need to earn 6.2 million degrees by 2030. 1<br />
FAST FACTS<br />
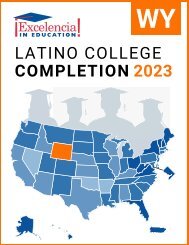
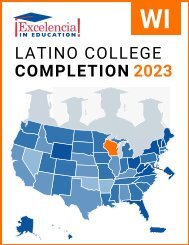
STATE RANKING:<br />
<strong>Vermont</strong> had the 50th largest<br />
<strong>Latino</strong> population in the U.S.<br />
K-12 POPULATION:<br />
In <strong>Vermont</strong>, 2% of the K-12<br />
population was <strong>Latino</strong>. 2<br />
POPULATION:<br />
In <strong>Vermont</strong>, 2% of the population<br />
was <strong>Latino</strong>. 2<br />
MEDIAN AGE:<br />
The median age<br />
of Hispanics in<br />
<strong>Vermont</strong> was 35,<br />
compared to 44<br />
for White non-<br />
Hispanics. 2<br />
35<br />
Hispanics<br />
44<br />
White<br />
non-Hispanics<br />
ENROLLMENT:<br />
In <strong>Vermont</strong>, 42% of Hispanics<br />
(ages 18 to 34) were enrolled in higher<br />
education, compared to 29% of<br />
White non-Hispanics. 2<br />
DEGREE ATTAINMENT:<br />
In <strong>Vermont</strong>, 67% of Hispanic<br />
adults (25 and older) had earned an<br />
associate degree or higher, compared to<br />
52% of White non-Hispanic adults. 2<br />
Hispanic Adults = 6.7 of 10<br />
To reach the degree attainment goal by 2030, the U.S. can: close<br />
the degree completion gap by accelerating <strong>Latino</strong> completion while<br />
increasing for all students and scale up programs and initiatives that<br />
work for <strong>Latino</strong>, and all, students. The following demographics,<br />
institutional data, and practices inform <strong>Latino</strong> degree attainment.<br />
ENROLLING: Top 5 Institutions (Hispanic Undergraduates) in <strong>Vermont</strong>, 2021-22<br />
Institution<br />
Sector<br />
Grand Hispanic %<br />
Total Total Hispanic<br />
1 University of <strong>Vermont</strong> Public, 4-year 11,081 504 5%<br />
Private not-forprofit,<br />
4-year<br />
2 Middlebury <strong>College</strong><br />
2,837 299 11%<br />
Private not-forprofit,<br />
4-year<br />
3 Norwich University<br />
2,924 296 10%<br />
Private not-forprofit,<br />
4-year<br />
4 Champlain <strong>College</strong><br />
3,170 262 8%<br />
5 Community <strong>College</strong> of <strong>Vermont</strong> Public, 2-year 3,754 133 4%<br />
ASSOCIATE DEGREES: Top 5 Institutions Awarding to Hispanics in <strong>Vermont</strong>, 2020-21<br />
Institution<br />
Sector<br />
Grand Hispanic %<br />
Total Total Hispanic<br />
1 Community <strong>College</strong> of <strong>Vermont</strong> Public, 2-year 416 12 3%<br />
Private not-forprofit,<br />
4-year<br />
2 Landmark <strong>College</strong><br />
55 4 7%<br />
3 Northern <strong>Vermont</strong> University Public, 4-year 41 3 7%<br />
4 <strong>Vermont</strong> Technical <strong>College</strong> Public, 4-year 278 3 1%<br />
Private not-forprofit,<br />
4-year<br />
5 Champlain <strong>College</strong><br />
53 2 4%<br />
BACHELOR DEGREES: Top 5 Institutions Awarding to Hispanics in <strong>Vermont</strong>, 2020-21<br />
Institution<br />
Sector<br />
Grand Hispanic %<br />
Total Total Hispanic<br />
1 University of <strong>Vermont</strong> Public, 4-year 2,632 109 4%<br />
Private not-forprofit,<br />
4-year<br />
2 Middlebury <strong>College</strong><br />
605 64 11%<br />
Private not-forprofit,<br />
4-year<br />
3 Champlain <strong>College</strong><br />
762 61 8%<br />
Private not-forprofit,<br />
4-year<br />
4 Norwich University<br />
738 56 8%<br />
Private not-forprofit,<br />
4-year<br />
5 Saint Michael's <strong>College</strong><br />
321 22 7%<br />
NOTE: We use the terms <strong>Latino</strong> and Hispanic interchangeably in this factsheet.<br />
Source: Excelencia in Education analysis using U.S. Department of Education, National Center for<br />
Education Statistics (NCES), Integrated Postsecondary Education Data System (IPEDS), 2021 Fall<br />
Enrollment, Graduation Rates Survey and Institutional Characteristics Survey.<br />
White Adults = 5.2 of 10<br />
1 Projections to 2030: Excelencia in Education. (2020). Ensuring America’s Future: Benchmarking <strong>Latino</strong><br />
<strong>College</strong> <strong>Completion</strong> to 2030. Excelencia in Education. Washington, D.C.<br />
2 U.S. Census Bureau, 2021 American Community Survey 1-Year Estimates
<strong>Vermont</strong> Gap in Degree <strong>Completion</strong><br />
Closing the degree completion gap can be tracked<br />
by the 4 measures shown below. Alone, none<br />
of these measures capture the entire “story” of<br />
degree completion. However, in combination,<br />
they provide a useful picture of the gap in degree<br />
attainment between Hispanic and White non-<br />
Hispanic cohorts in a single year.<br />
Graduation Rate — Total percentage of students<br />
who graduated within 150% of normal time for<br />
first-time, full-time freshmen. This incorporates<br />
students that graduated in 3 years at two-year<br />
institutions, or in 6 years at four-year institutions.<br />
Transferred to Another Institution —<br />
Percentage of students that transferred to another<br />
institution and did not complete a degree.<br />
Still Enrolled — Percentage of students that are<br />
still enrolled at the point of 150% normal time to<br />
completion.<br />
No Longer Enrolled — Percentage of students<br />
that are no longer enrolled at the point of 150%<br />
normal time to completion.<br />
At two-year institutions, Hispanics’<br />
graduation rate was 26%-points<br />
lower than that of their White<br />
non-Hispanic peers in <strong>Vermont</strong>.<br />
TWO-YEAR INSTITUTIONS<br />
40%<br />
7%<br />
26%<br />
26%<br />
WHITE<br />
-26%<br />
50%<br />
50%<br />
HISPANIC<br />
DEGREE OUTCOMES<br />
■ No Longer Enrolled<br />
■ Still Enrolled<br />
■ Transferred to<br />
Another Institution<br />
■ Graduation Rate<br />
*Percentages may not add up to 100% due to rounding.<br />
At four-year institutions, Hispanics’<br />
graduation rate was 2%-points<br />
lower than that of their White<br />
non-Hispanic peers in <strong>Vermont</strong>.<br />
FOUR-YEAR INSTITUTIONS<br />
1%<br />
21%<br />
WHITE<br />
-2%<br />
25%<br />
71% 69%<br />
HISPANIC<br />
NOTE: Outcomes shown are for students at two-year institutions who started in Fall 2018, and<br />
for students at four-year institutions who started in Fall 2015.<br />
Source: Excelencia in Education analysis using the U.S. Department of Education, National<br />
Center for Education Statistics (NCES), Integrated Postsecondary Education Data System, 2021<br />
Graduation Rates Survey and the Institutional Characteristics Survey.<br />
8%<br />
1%<br />
5%<br />
Examples of What Works for <strong>Latino</strong> Students<br />
There are institutions showing success in enrolling, retaining, and graduating <strong>Latino</strong> students. The following are examples of<br />
programs across the country with evidence of effectiveness in serving <strong>Latino</strong> students nominated for Examples of Excelencia.<br />
The Percy Ellis Sutton Search for Education, Elevation, and<br />
Knowledge (SEEK) Program at Lehman <strong>College</strong> is an educational<br />
opportunity program of the City University of New York. The SEEK<br />
program targets students who have demonstrated motivation and<br />
potential for college success but do not meet traditional admissions<br />
requirements and need academic and financial assistance to succeed<br />
in college. Beyond providing a means for these students to enter a<br />
CUNY senior college, a prospect not otherwise available to students<br />
with their academic and economic profiles, SEEK delivers an array<br />
of essential support services to help them complete in a competitive<br />
educational environment. Services include counseling, advisement,<br />
supplemental instruction, and tutoring focused on student persistence/<br />
retention, academic performance, and graduation and fostering the noncognitive<br />
skills and attributes needed for college and career success.<br />
The overall mission of SEEK is to provide access to higher education to<br />
historically underserved students to increase their level of education,<br />
social capital, and workforce preparedness. SEEK fulfills its mission by<br />
providing a range of specialized support and enrichment programs and<br />
activities dedicated to encouraging SEEK student learning, performance,<br />
persistence, and graduation. SEEK at Lehman <strong>College</strong> aims to contribute<br />
to closing the New York equity gap in college completion rates by<br />
increasing its retention and graduation rates and ensuring that students<br />
make timely progress toward degree completion. Over the last eight<br />
years, the SEEK Program at Lehman <strong>College</strong> has implemented several<br />
strategies that they believe have contributed to improved outcomes in<br />
retention, performance, graduation, and other areas.<br />
The SEEK program supports about 855 full-time undergraduates and enrolls<br />
225 freshmen each year; 73% are <strong>Latino</strong>. There was a 21% increase in the<br />
first-year retention rate of <strong>Latino</strong> students from 2007 to 2012, from 67% to<br />
88% and a 29% increase in second-year retention rates of <strong>Latino</strong>s over the<br />
same period. The average cumulative GPA for 2007 entering cohort was<br />
2.46, and the average cumulative GPA for the 2013 cohort was 2.97. SEEK’s<br />
six-year graduation rate for <strong>Latino</strong>s increased from 29% (cohort 2007) to<br />
43% (cohort 2008). One program component, Reaching into the Science<br />
Experience (RISE) initiative, targeted students interested in STEM and health<br />
careers by providing them with science-focused supplemental academic<br />
support services, including year-round science preparation workshops.<br />
For more information on institutional programs improving <strong>Latino</strong> student success in higher education, access Excelencia in<br />
Education’s Growing What Works database at http://www.edexcelencia.org/growing-what-works<br />
ENSURING AMERICA’S FUTURE BY INCREASING LATINO COLLEGE COMPLETION • WWW.EDEXCELENCIA.ORG