
Create successful ePaper yourself
Turn your PDF publications into a flip-book with our unique Google optimized e-Paper software.
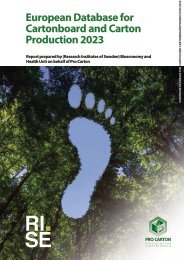
<strong>The</strong> <strong>Carbon</strong> <strong>Footprint</strong> <strong>of</strong><br />
<strong>Carton</strong> <strong>Packaging</strong> <strong>2023</strong><br />
<strong>Carbon</strong> footprint statement prepared by RISE<br />
(Research Institutes <strong>of</strong> Sweden) Bioeconomy and Health Unit<br />
on behalf <strong>of</strong> Pro <strong>Carton</strong><br />
THE CARBON FOOTPRINT OF CARTON PACKAGING . <strong>2023</strong><br />
RI<br />
SE
RI<br />
SE<br />
<strong>Carbon</strong> footprint statement prepared by RISE<br />
(Research Institutes <strong>of</strong> Sweden) Bioeconomy and<br />
Health Unit on behalf <strong>of</strong> Pro <strong>Carton</strong><br />
THE CARBON FOOTPRINT OF CARTON PACKAGING . <strong>2023</strong><br />
Contents<br />
02 Foreword<br />
04 <strong>Carbon</strong> footprint summary<br />
08 Supporting information<br />
12 Assurance statement
RI<br />
SE<br />
Foreword<br />
Pro <strong>Carton</strong>, the European Association <strong>of</strong> <strong>Carton</strong>board and <strong>Carton</strong> Manufacturers is pleased to<br />
present the carbon footprint for carton packaging. <strong>The</strong> carbon footprint has been calculated using<br />
latest methodologies and data. <strong>The</strong> method applied is in accordance with the frameworks set<br />
out in CEPI’s “Framework for <strong>Carbon</strong> <strong>Footprint</strong>s for Paper and Board Products, April 2017” and the<br />
subsequent CITPA “Guidelines for calculating carbon footprints for paper-based packaging, March<br />
2018”. As recommended by these documents, the total carbon footprint value calculated covers<br />
the cradle-to-grave carbon impact <strong>of</strong> carton packaging, taking account <strong>of</strong> fossil and biogenic<br />
greenhouse gas (GHG) emissions and removals and emissions from direct land use change (dLUC).<br />
<strong>Carbon</strong> contained within the product when it is first placed on the market is also quantified.<br />
<strong>The</strong> carbon footprint statement was compiled and written by RISE (Research Institutes <strong>of</strong> Sweden)<br />
and the raw data and calculations were verified by ifeu (Institut für Energie- und Umweltforschung)<br />
based in Heidelberg, Germany.<br />
Cradle-to-grave carbon footprint <strong>of</strong> cartons, kgCO2e per tonne <strong>of</strong> cartons<br />
2021<br />
Fossil GHG<br />
emissions<br />
Biogenic GHG<br />
emissions<br />
GHG<br />
removals<br />
March <strong>2023</strong><br />
Direct<br />
land-use<br />
Total<br />
852kgCO 2 e 1,014kgCO 2 e -1,626kgCO 2 e 9kgCO 2 e 249kgCO 2 e<br />
It is encouraging to note that the analysis shows that the cradle-to-grave fossil GHG emissions<br />
for cartons was reduced by 17% in 2021 compared to the last calculation covering the calendar<br />
year 2018 (2021: 852kgCO 2 e versus 2018: 1,025kgCO 2 e). If the total carbon footprint is considered,<br />
including fossil GHG emissions, biogenic GHG emissions, GHG removals and direct land-use, then<br />
the reduction is increased to 24% (2021: 249kgCO 2 e versus 2018: 326kgCO 2 e).<br />
<strong>The</strong> analysis <strong>of</strong> the 2021 footprint is more complete than in previous iterations <strong>of</strong> the analysis, with<br />
additional inputs included in the modelling <strong>of</strong> the cartonboard production (in particular, inclusion<br />
<strong>of</strong> the impact <strong>of</strong> binders) and in the modelling <strong>of</strong> the carton conversion process (in particular,<br />
inclusion <strong>of</strong> the impact <strong>of</strong> adhesives for lamination, inclusion <strong>of</strong> the impact <strong>of</strong> varnish, and inclusion<br />
<strong>of</strong> the impact <strong>of</strong> gravure printing ink). Together, these additional items account for nearly 12% <strong>of</strong><br />
the fossil GHG emissions.<br />
A detailed analysis <strong>of</strong> the carbon footprint reveals that:<br />
• <strong>The</strong> fossil GHG emissions across the entire life cycle are 852kgCO 2 e per tonne <strong>of</strong> cartons<br />
o <strong>The</strong> unit processes that together constitute the production <strong>of</strong> cartonboard accounts for 86% <strong>of</strong> the<br />
total fossil GHG footprint. Of these unit processes, the most important contributing item is<br />
emissions arising from the combustion <strong>of</strong> fossil fuels at the pulp and paper mills. Also important<br />
are emissions arising from purchased grid electricity at the mills, emissions arising from the<br />
production <strong>of</strong> non-fibre inputs at the mills (process chemicals and functional additives), emissions<br />
associated with the production <strong>of</strong> purchased fuels and emissions associated with production <strong>of</strong><br />
purchased pulp. Emissions associated with the transport <strong>of</strong> raw materials (wood, paper for recycling,<br />
and non-fibre inputs) to the mill also contribute.<br />
o <strong>The</strong> unit process which together constitute the converting <strong>of</strong> cartonboard into cartons account for<br />
18% <strong>of</strong> the total fossil GHG footprint. Of these unit processes, the most important contributing item<br />
is the emissions associated with the production <strong>of</strong> purchased electricity consumed at the<br />
converting process. Emissions associated with the production <strong>of</strong> other constituents <strong>of</strong> the cartons<br />
(inks, varnish, glues, etc) are also important, along with emissions arising from fuels consumed<br />
onsite for the print drying process and for space heating.<br />
o Emissions associated with the delivery <strong>of</strong> cartonboard from the mill to the converter account for 5%<br />
<strong>of</strong> the total fossil GHG footprint.<br />
o Due to the credit received for avoided emissions arising from the energy recovery process, there is a<br />
net credit for the end-<strong>of</strong>-life processes (accounting for -9% <strong>of</strong> the total fossil GHG footprint).<br />
• <strong>The</strong> biogenic emissions across the life cycle are 1,014kgCO 2 e per tonne <strong>of</strong> cartons<br />
o Biogenic emissions arising from the combustion <strong>of</strong> bi<strong>of</strong>uels at the pulp and paper mills account for<br />
the majority <strong>of</strong> the biogenic emissions (79%). This is predominantly from the combustion <strong>of</strong> internally<br />
generated bi<strong>of</strong>uels such as black liquor, plus some small emissions from purchased bi<strong>of</strong>uels.<br />
o Emissions from end-<strong>of</strong>-life processes account for just 18% <strong>of</strong> the Biogenic emissions. However, it<br />
should be remembered that carton packaging achieves a high recycling rate. No end-<strong>of</strong> life<br />
emissions occur within the boundaries <strong>of</strong> the analysis for the proportion <strong>of</strong> cartons that<br />
are recycled (although emissions will occur in the life cycles <strong>of</strong> subsequent products that are<br />
manufactured from the recovered fibres – the implications <strong>of</strong> this are investigated in the<br />
uncertainty analysis).<br />
• <strong>The</strong> emissions due to land-use (dLUC) are just 9kgCO 2 e per tonne <strong>of</strong> cartons<br />
o <strong>The</strong> dLUC emissions mostly arise from the production <strong>of</strong> non-fibre inputs rather than inputs <strong>of</strong><br />
fibres from the forest, reflecting the fact that the fibres used in cartonboard production are sourced<br />
from sustainably managed forests. Forests in Europe are growing, deforestation (and emissions <strong>of</strong><br />
greenhouse gases associated with deforestation) is not an issue that is relevant to the carton supply<br />
chain in Europe, as more trees are planted than harvested through sustainable forest management.<br />
o <strong>The</strong> dLUC emissions in the life cycle for cartons are primarily associated with the production <strong>of</strong> inks<br />
used in the converting process, as the extraction <strong>of</strong> specific minerals required for e.g. ink formulations<br />
may lead to localised land-use changes that result in a net release <strong>of</strong> emissions to the environment.<br />
• <strong>The</strong> GHG removals across the life cycle are -1,626kgCO 2 e per tonne <strong>of</strong> cartons<br />
o 96% <strong>of</strong> these removals relate to the CO 2 flows from the atmosphere into the forests during the<br />
growth phase <strong>of</strong> the wood that provides fibres and internal bioenergy at the pulp and paper mills.<br />
o <strong>The</strong> remaining removals relate to CO 2 flows from the atmosphere into biomass used for purchased<br />
bi<strong>of</strong>uels and/or non-fibre natural and renewable raw materials (e.g. starches).<br />
• <strong>The</strong>se emissions and removals can be summed to give us a total GHG footprint across the<br />
entire life cycle <strong>of</strong> 249kgCO 2 e per tonne <strong>of</strong> cartons.<br />
• In addition, the carbon content <strong>of</strong> the product when first placed on the market is 1,609kgCO 2 e per<br />
tonne <strong>of</strong> cartons. In line with the CITPA methodology, this value is provided as additional<br />
information only, and should not be subtracted from the total carbon footprint.<br />
<strong>The</strong> improvements in fossil GHG emissions <strong>of</strong> 17% compared to the 2018 figures are<br />
significant. <strong>The</strong> main drivers for these reductions have been improved resource efficiency during<br />
the converting process and investments in energy efficiency and renewable energy sources at<br />
the cartonboard mills and converting operations. Further investments in resource and energy<br />
efficiency and renewable energy sources should see continued reductions in the coming years.<br />
Horst Bittermann<br />
Director General<br />
Winfried Muehling<br />
Director Marketing & Communications<br />
2 3
RI<br />
SE<br />
<strong>Carbon</strong> footprint summary<br />
Studied product name and description: this carbon footprint statement relates to average<br />
European cartons (cut, creased and printed), produced from average European cartonboard.<br />
An average mix <strong>of</strong> recycled (white lined chip (WLC)) and virgin (folding box board (FBB)) and solid<br />
bleached board/solid unbleached board (SBB/SUB)).<br />
Unit <strong>of</strong> analysis and reference flow: 1 tonne <strong>of</strong> converted cartons<br />
Type <strong>of</strong> inventory: “Cradle-to-grave”<br />
Information gathered from: 1st January 2021 to: 31st December 2021<br />
Date <strong>of</strong> issue: February <strong>2023</strong><br />
GHG’s included in the inventory: carbon dioxide (CO 2 ), methane (CH 4 ), nitrous oxide (N 2 O), sulfur<br />
hexafluoride (SF 6 ), perfluorocarbons (PFCs), and hydr<strong>of</strong>luorocarbons (HFCs) are all accounted for,<br />
expressed in CO 2 equivalents (CO 2 e).<br />
Approach: <strong>The</strong> methodology applied is based on the sector specific guidance prepared by CITPA<br />
(the International Confederation <strong>of</strong> Paper and Board Convertors in Europe): “Guidelines for calculating<br />
<strong>Carbon</strong> footprints for paper-based packaging 2022”, which are in turn based on CEPI’s “Framework for<br />
<strong>Carbon</strong> <strong>Footprint</strong>s for Paper and Board Products, April 2017”. In 2022, the CEPI and CITPA frameworks were<br />
subject to an independent peer review by ifeu – Institute for Energy and Environmental Research<br />
Heidelberg GmbH, Heidelberg, Germany. This review found the methods to be compatible with the<br />
requirements <strong>of</strong> the “Product Life Cycle Accounting and Reporting Standard” <strong>of</strong> the Greenhouse Gas<br />
Protocol by the World Resources Institute (WRI) (known as the “Product Standard”).<br />
Inventory version: <strong>2023</strong> footprint calculation, version 1<br />
Previous inventories: <strong>The</strong> previous version <strong>of</strong> the carbon footprint covering data from the calendar<br />
year 2018 was published by Pro <strong>Carton</strong> in 2019 and is available on request. Calculations prior to this<br />
were based on the previous version <strong>of</strong> the CITPA methodology, and only covered fossil GHG emissions<br />
and cradle-to-gate boundaries.<br />
Biogenic carbon emissions and removals: It might be expected that the overall biogenic flows <strong>of</strong><br />
CO 2 equivalents across the life cycle (including those flows leaving the system as carbon contained in<br />
the recovered fibres) would add up to close to zero (i.e. that the biogenic carbon entering the system<br />
is completely balanced with the biogenic carbon leaving the system). <strong>The</strong> fact that there is not be an<br />
exact balance reflects some <strong>of</strong> the difficulties in quantifying biogenic GHG emissions and removals.<br />
<strong>The</strong> imbalance reflects two aspects <strong>of</strong> the calculations:<br />
1) As cartons achieve a high recycling rate, this means that a proportion <strong>of</strong> the original carbon<br />
removals (which are contained in the product when it is first placed on the market) are carried<br />
through to the life cycle <strong>of</strong> subsequent products outside the boundaries <strong>of</strong> this analysis. In line<br />
with the CITPA methodology, a cut-<strong>of</strong>f method is applied for the share <strong>of</strong> the material that is sent<br />
for recycling. This means that the impacts associated with reprocessing the cartons sent for<br />
recycling and any credits associated with avoided production <strong>of</strong> virgin materials are allocated to the<br />
products which incorporate the recycled content, rather than to the carton system. It also means<br />
that the emissions from the final waste management <strong>of</strong> the products produced from recycled<br />
cartons are outside <strong>of</strong> the boundaries <strong>of</strong> this analysis.<br />
2) <strong>The</strong>re may be differences in the assumptions in the background data regarding the carbon content<br />
(and therefore the biogenic GHG removals) <strong>of</strong> wood and wood chips compared to the carbon<br />
content <strong>of</strong> bi<strong>of</strong>uels used at the mill and the carbon content <strong>of</strong> paper in the energy recovery<br />
processes (and therefore the biogenic emissions arising from these processes).<br />
<strong>The</strong>refore, the results calculated and presented relating to biogenic GHG emissions and removals<br />
should be considered not as an accurate mapping <strong>of</strong> the flows but as informative <strong>of</strong> where in the<br />
life cycle biogenic removals and emissions occur and the likely scale <strong>of</strong> these compared to fossil<br />
GHG emissions and removals.”<br />
Results:<br />
<strong>The</strong> table below summarises the cradle-to-gate and cradle-to-grave emissions and removals,<br />
according to the category <strong>of</strong> emissions/removals i.e., according to fossil GHG emissions, biogenic<br />
GHG emissions, GHG removals and emissions due to direct land-use. <strong>The</strong> table below also<br />
shows that total, which is the sum <strong>of</strong> all categories <strong>of</strong> emissions and removals. <strong>The</strong> chart overleaf<br />
provides the breakdown <strong>of</strong> each category <strong>of</strong> emissions and removals according to the CEPI 10<br />
toes classification.<br />
Boundaries<br />
considered<br />
Cradle-to-gate total<br />
Cradle-to-grave total<br />
Fossil<br />
emissions<br />
kgCO 2 e/<br />
tonne <strong>of</strong><br />
cartons<br />
Biogenic<br />
emissions<br />
kgCO 2 e/<br />
tonne <strong>of</strong><br />
cartons<br />
Removals<br />
kgCO 2 e/<br />
tonne <strong>of</strong><br />
cartons<br />
Direct<br />
land-use<br />
kgCO 2 e/<br />
tonne <strong>of</strong><br />
cartons<br />
Total<br />
kgCO 2 e/<br />
tonne <strong>of</strong><br />
cartons<br />
929 828 -1,619 9 148<br />
852 1,014 -1,626 9 249<br />
4 5
RI<br />
SE<br />
<strong>Carbon</strong> footprint summary<br />
Additional information:<br />
Paper and board products are based on a renewable raw material, using the capacity <strong>of</strong> forests<br />
to bind CO 2 from the atmosphere as the starting point. According to the European GHG<br />
inventory, forests <strong>of</strong> the EU-28 are a net carbon sink, with net CO 2 removals by forests having<br />
increased by over 19% between 1990 and 2014. Subsequently, paper and board products store<br />
carbon. Recycling <strong>of</strong> paper and board products keeps this CO 2 from returning to the atmosphere.<br />
Landfill <strong>of</strong> paper and board product should be avoided whenever possible. <strong>The</strong> preferred end<br />
<strong>of</strong> life treatment is material recovery and if it is not an option, then energy recovery is the<br />
second preference.<br />
<strong>Carbon</strong> contained in the product when first placed on the market: 1,609 kgCO 2 e/tonne <strong>of</strong> cartons.<br />
Contact:<br />
For further information or questions regarding this carbon footprint statement, please contact<br />
Winfried Muehling, Pro <strong>Carton</strong> (muehling@procarton.com)<br />
Cradle-to-grave carbon footprint <strong>of</strong> average European cartons<br />
2000<br />
kg CO2 per tonne <strong>of</strong> cartons<br />
1500<br />
1000<br />
500<br />
0<br />
-500<br />
-1000<br />
-1500<br />
Fossil CO 2 Biogenic CO 2 Removals<br />
Land<br />
transformation<br />
Total<br />
-2000<br />
Toe 10:<br />
Toe 7:<br />
Toe 5:<br />
Toe 4:<br />
Toe 3:<br />
Avoid emissions - end <strong>of</strong> life<br />
Transport<br />
Chemicals<br />
Forestry<br />
Direct emissions from incineration <strong>of</strong> fuels at production sites<br />
Toe 9:<br />
Toe 6:<br />
Toe 5:<br />
Toe 3:<br />
Toe 1:<br />
End <strong>of</strong> life<br />
Purchased electricity<br />
Production purchased fuels<br />
Emissions from purchased pulp<br />
<strong>Carbon</strong> sequestration in forests<br />
This chart provides the breakdown <strong>of</strong> each category <strong>of</strong> emissions and removals according to the<br />
CEPI 10 toes classification.<br />
6<br />
7
RI<br />
SE<br />
Supporting information<br />
Boundary setting<br />
Figure 1. summarises the boundaries <strong>of</strong> a carbon footprint <strong>of</strong> paper and board products according<br />
to the CEPI framework applied.<br />
Recycling<br />
Emissions from<br />
processing: Toe 4<br />
Forest<br />
Non-fibre raw<br />
materials and fuels<br />
Transport <strong>of</strong> raw<br />
materials and fuel<br />
Primary and secondary<br />
manufacturing<br />
Transport <strong>of</strong> primary<br />
and final product<br />
Product use<br />
Transport <strong>of</strong><br />
used product<br />
Landfilling<br />
Burning for<br />
Energy<br />
CH 4 emissions: Toe 9<br />
Biomass CO 2: Toe 9<br />
<strong>Carbon</strong> storage: Toe 2<br />
Biomass carbon removal and storage: Toe 1<br />
GHG emissions from management and harvesting: Toe 4<br />
GHG emissions: Toe 5<br />
GHG emissions: Toe 7<br />
Fig .1 Elements <strong>of</strong> a carbon footprint from the CEPI framework 1<br />
1 CEPI (2017) Framework for the development <strong>of</strong> <strong>Carbon</strong> <strong>Footprint</strong>s For Paper and Board Products, www.cepi.org<br />
Facility GHG emissions: Toe 3<br />
Biomass CO 2 emissions: Toe 3<br />
GHG emissions associated with purchased pulp/wood fibre inputs: Toe 3<br />
GHG emissions associated with purchased electricity and steam: Toe 6<br />
GHG emissions: Toe 7<br />
Biomass carbon stored in paper and board: Toe 7<br />
Biomass carbon stored in paper and board: Toe 2*<br />
GHG emissions: Toe 8<br />
GHG emissions: Toe 7<br />
Biomass CO 2 emissions: Toe 3<br />
Biomass CO 2 emissions: Toe 9<br />
GHG emissions: Toe 9<br />
All relevant processes are included, with the exception <strong>of</strong> the transport <strong>of</strong> the cartons between the<br />
convertor and the filler, and transport and management <strong>of</strong> process wastes arising at the paper mill<br />
and the converting plant that are sent for treatment <strong>of</strong>f-site. <strong>The</strong>se are excluded due to the fact that<br />
data for external process waste treatment are not always available and, as the vast majority <strong>of</strong> the<br />
process wastes from board production are recovered and recycled for other industrial or agricultural<br />
processes, these processes need to be considered together with which emissions would be avoided<br />
by the treatment. In many cases, it may be more appropriate to consider the residue streams as<br />
by-products <strong>of</strong> the board manufacturing process. Including treatment <strong>of</strong> process waste will be<br />
reconsidered when more reliable information becomes available in future.<br />
For calculating land-use change impacts, emission factors are taken directly from the secondary<br />
databases applied.<br />
Allocation<br />
Data presented relates to the production <strong>of</strong> 1 tonne <strong>of</strong> net saleable product (i.e. 1 tonne <strong>of</strong> converted<br />
(cut, creased and printed) cartons. When a cartonboard mill also produces and sells energy from<br />
combined heat power (CHP), only fuels and subsequent emissions to air allocated to paper production<br />
are included in the carbon footprint. No allocation is made for emissions relating to sold by-products<br />
(as opposed to co-products). Sold by-products can include for example tall oil, bark, turpentine, etc.<br />
As average European cartons are manufactured from a combination <strong>of</strong> virgin and recycled grades<br />
<strong>of</strong> cartonboard, the footprint is calculated considering the ratio <strong>of</strong> activities belonging to virgin<br />
and recycled cartonboard production. No further allocation <strong>of</strong> activities belonging to virgin fibre<br />
production and recycled fibre production is made, nor are any credits taken into account for use <strong>of</strong><br />
recycled fibre.<br />
Avoided emissions from end-<strong>of</strong>-life treatment are included – for example, incineration with energy<br />
recovery avoids emissions associated with grid electricity production and heat production from<br />
primary fuel sources. However, for material recycling at end-<strong>of</strong>-life the cut-<strong>of</strong>f method has been<br />
applied (i.e., only the emissions associated with collecting the waste material are allocated to the<br />
system. Any impacts (or credits) from the recycling process are not allocated to the system.)<br />
Data collection and quality<br />
Primary data has been collected for the gate-to-gate inputs and outputs to the cartonboard<br />
production processes. Data was collected from mills representing:<br />
• 53% <strong>of</strong> European production <strong>of</strong> White Lined Chip (WLC) – cartonboard manufactured primarily<br />
from recovered fibres:<br />
• 93% <strong>of</strong> European production <strong>of</strong> Folding Box Board (FBB) and 62% <strong>of</strong> European production <strong>of</strong> Solid<br />
Bleached Board/Solid Unbleached Board (SBB/SUB) – cartonboard grades manufactured primarily<br />
from primary fibres:<br />
Primary data was also collected from converting sites representing 8% <strong>of</strong> European production<br />
<strong>of</strong> cartons.<br />
This primary data has been processed and checked by life cycle assessment practitioners and<br />
technical experts from the mills and converting plants, and it is subsequently deemed to be <strong>of</strong><br />
high quality as it is within the companies’ control and it represents a significant share <strong>of</strong> the<br />
production capacity for cartonboard. Primary data has also been gathered for distances and<br />
modes <strong>of</strong> transport for the delivery <strong>of</strong> pulp wood and chippings used for virgin fibre production,<br />
for the delivery <strong>of</strong> paper for recycling for recycled fibre production, the delivery <strong>of</strong> purchased pulp,<br />
the delivery <strong>of</strong> non-fibre inputs to the papermills, and the delivery <strong>of</strong> cartonboard from the mills<br />
to the converting sites. For purchased pulp, primary data has also been collected wherever<br />
possible. Primary data covers 56% <strong>of</strong> the purchased pulp, with the remainder being covered by<br />
secondary datasets. For purchased electricity, where possible information has been collected from<br />
the cartonboard mills and the converting plants regarding their specific electricity products and<br />
appropriate emission factors have been applied. Where information relating to specific electricity<br />
products was not available, emission factors for national grid electricity mixes have been applied.<br />
8<br />
9
RI<br />
SE<br />
Supporting information<br />
• Methodological choices – in particular, the application <strong>of</strong> the cut-<strong>of</strong>f method to the proportion <strong>of</strong><br />
cartons that are recycled has a significant influence on the results achieved. It means that the<br />
carbon that has been removed from the atmosphere (recorded in Toe 1) and is subsequently<br />
contained within the product when it is placed on the market is carried over from the original<br />
product system to subsequent product systems. <strong>The</strong> release <strong>of</strong> this carbon at the end-<strong>of</strong>-life <strong>of</strong><br />
the subsequent product systems is outside <strong>of</strong> the scope <strong>of</strong> the current analysis. It could therefore<br />
be argued that the carbon emissions from the end-<strong>of</strong>-life <strong>of</strong> the secondary products should be<br />
allocated at least in part to the first product placed on the market. In this case, the biogenic<br />
emissions associated with average European cartons would be considerably increased.<br />
<strong>The</strong> influence <strong>of</strong> end-<strong>of</strong>-life modelling choices is illustrated in the table below, which contrasts the<br />
results considering the baseline scenario investigated with the results considering 100%<br />
incineration with energy recovery and 100% landfilling <strong>of</strong> the cartons at end-<strong>of</strong>-life. In both<br />
the sensitivity scenarios, effectively all carbon contained within the product is released back<br />
into the atmosphere within the system boundaries, rather than being carried over into subsequent<br />
product systems.<br />
Inventory<br />
<strong>The</strong> carbon emission factors for background processes have been selected, in order <strong>of</strong> preference,<br />
from the ELCD , Ecoinvent , Gabi and KCL databases. Where national grid electricity mixes have been<br />
considered, emission factors for purchased electricity are sourced from Ecoinvent.<br />
Uncertainty<br />
<strong>The</strong> carbon footprint results presented here are deemed to be representative <strong>of</strong> the likely GHG<br />
emissions associated with the production <strong>of</strong> the studied product. <strong>The</strong> allocation methods chosen<br />
mean that the models are as close to reality as possible. Efforts have been made to minimise<br />
uncertainties.<br />
However, some key sources <strong>of</strong> uncertainty in this analysis should be recognised:<br />
• <strong>The</strong> carbon emission factors applied for background processes. Primary data has been used to<br />
determine the emission factors applied where possible for purchased electricity and for 56% <strong>of</strong> the<br />
purchased pulp. For other background processes (emissions from the production <strong>of</strong><br />
fuels, chemicals, inks and other inputs, emissions from modes <strong>of</strong> transport, emissions from end-<strong>of</strong>life<br />
processes, etc), as is common in life cycle studies and carbon footprint calculations, average<br />
carbon emission factors have been applied. <strong>The</strong> analysis could be improved by obtaining emission<br />
factors for specific suppliers <strong>of</strong> chemicals, fuels, etc. However, as the manufacturing <strong>of</strong> cartonboard<br />
is energy intensive, and the emissions from the pulp and papermill are based on primary data, the<br />
uncertainty associated with emission factors applied for background processes is not anticipated to<br />
be overly influential for the results achieved and conclusions drawn.<br />
• <strong>The</strong> end-<strong>of</strong>-life pr<strong>of</strong>ile considered – the end-<strong>of</strong>-life pr<strong>of</strong>ile for paper and board products varies<br />
considerably by end-use application and from country-to-country. It is impossible to know the<br />
exact end-<strong>of</strong>-life pr<strong>of</strong>ile on a product-by-product basis. <strong>The</strong>refore, the end-<strong>of</strong>-life pr<strong>of</strong>ile considered<br />
in this analysis is based on consideration <strong>of</strong> the average recycling rate for fibre-based packaging,<br />
with the remaining material assumed to be sent for incineration with energy recovery. Efficient<br />
collection and recycling systems for cartons are in place in Europe. Industry wide efforts to further<br />
increase recycling rates to 90% by 2030 are in place. Changing the proportions <strong>of</strong> material sent to<br />
landfill, incineration and material recycling could significantly influence the end-<strong>of</strong>-life emissions<br />
(Toe 9) and avoided emissions (Toe 10) calculated.<br />
Scenario<br />
Baseline scenario -<br />
Cradle-to-grave total<br />
Sensitivity scenario 1 –<br />
100% <strong>of</strong> end-<strong>of</strong>-life cartons<br />
to incineration with energy<br />
recovery<br />
Sensitivity scenario 2 –<br />
100% <strong>of</strong> end-<strong>of</strong>-life cartons<br />
to landfill<br />
Fossil<br />
emissions<br />
kgCO 2 e/<br />
tonne <strong>of</strong><br />
cartons<br />
852 1,014 -1,626 9 249<br />
499<br />
939<br />
Biogenic<br />
emissions<br />
kgCO 2 e/ tonne<br />
<strong>of</strong> cartons<br />
1,860<br />
1,809<br />
Removals<br />
kgCO 2 e/ tonne<br />
<strong>of</strong> cartons<br />
-1,658<br />
-1,620<br />
Direct<br />
land-use<br />
kgCO 2 e/ tonne<br />
<strong>of</strong> cartons<br />
<strong>The</strong> table shows that the results achieved, and the conclusions drawn, are particularly sensitive to<br />
these end-<strong>of</strong>-life considerations and approaches.<br />
<strong>The</strong> results <strong>of</strong> the sensitivity scenarios also demonstrate that cartons store carbon. <strong>The</strong> recycling <strong>of</strong><br />
paper and board products delays this carbon from returning to the atmosphere and forming<br />
carbon dioxide. Subsequently, the recycling <strong>of</strong> cartons at end-<strong>of</strong>-life should be encouraged and<br />
pursued. When recycling is not possible or the fibres can no longer be recovered, incineration with<br />
energy recovery is always a preferable option compared to landfilling <strong>of</strong> paper and board products.<br />
9<br />
9<br />
Total<br />
kgCO 2 e/<br />
tonne <strong>of</strong><br />
cartons<br />
710<br />
1,136<br />
10<br />
2<br />
European Commission’s “European Reference Life Cycle Data System” v. 3.2, http://lca.jrc.ec.europa.eu<br />
3<br />
<strong>The</strong> ecoinvent database v.3.3 from the ecoinvent Centre, also known as the Swiss Centre for Life Cycle Inventories, is a joint initiative <strong>of</strong><br />
institutes and departments <strong>of</strong> the Swiss Federal Institutes <strong>of</strong> Technology Zürich (ETH Zurich) and Lausanne (EPFL), <strong>of</strong> the Paul Scherrer<br />
Institute (PSI), <strong>of</strong> the Swiss Federal Laboratories for Materials Testing and Research (Empa), and <strong>of</strong> the Swiss Federal Research Station<br />
Agroscope Reckenholz-Tänikon (ART), http://www.ecoinvent.org/.<br />
4<br />
GaBi database from PE INTERNATIONAL, http://www.ikpgabi.uni-stuttgart.de/english/index_e.html<br />
5<br />
KCL EcoData, calculated for CITPA, http://www.kcl.fi<br />
11
RI<br />
SE<br />
Assurance statement<br />
Nature <strong>of</strong> the assurance<br />
This product GHG inventory has been subject to third party reasonable assurance. <strong>The</strong> assurance<br />
was performed by Frank Wellenreuther ifeu (Institut für Energie- und Umweltforschung)<br />
Frank Wellenreuther is an LCA expert with more than 15 years <strong>of</strong> experience in the field <strong>of</strong><br />
packaging and paper life cycle assessments. He has compiled similar inventory datasets and carbon<br />
footprints for paper based products than the one reviewed. Ifeu is an independent and non-pr<strong>of</strong>it<br />
scientific research and consultancy institute. Neither ifeu nor Frank Wellenreuther personally have<br />
an affiliation to RISE, Pro <strong>Carton</strong> or any single members <strong>of</strong> this association.<br />
Assurance procedures<br />
<strong>The</strong> third party reasonable assurance has been commissioned on the 13th <strong>of</strong> January <strong>2023</strong>. A draft<br />
<strong>report</strong> has been made available the same day. On a meeting between the <strong>report</strong>’s author and the<br />
assurance provider on the 17th <strong>of</strong> January <strong>2023</strong> the <strong>report</strong> was presented and discussed. <strong>The</strong> final<br />
slightly amended <strong>report</strong> has been sent to the reviewer on the 22nd <strong>of</strong> February <strong>2023</strong>.<br />
<strong>The</strong> applied CITPA methodology as well as the underlying cartonboard production dataset have<br />
been separately critically reviewed by Frank Wellenreuther <strong>of</strong> ifeu, as well. Thus, the inventory<br />
data and applied methodology have been checked for plausibility and appropriateness to a very<br />
detailed degree. <strong>The</strong> calculations were followed through to check they were correct, and the<br />
additional sensitivity scenarios are much appreciated.<br />
Assurance opinion<br />
Based on the procedures performed, in the assurance provider’s opinion, the product GHG<br />
inventory is reasonably stated.<br />
RI<br />
SE<br />
<strong>Carbon</strong> footprint statement prepared by RISE<br />
(Research Institutes <strong>of</strong> Sweden) Bioeconomy and<br />
Health Unit on behalf <strong>of</strong> Pro <strong>Carton</strong><br />
12
<strong>The</strong> <strong>Carbon</strong> <strong>Footprint</strong> <strong>of</strong><br />
<strong>Carton</strong> <strong>Packaging</strong> <strong>2023</strong><br />
Published in March <strong>2023</strong> by Pro <strong>Carton</strong><br />
info@procarton.com<br />
For further information, please see<br />
www.procarton.com<br />
THE CARBON FOOTPRINT OF CARTON PACKAGING . <strong>2023</strong><br />
RI<br />
SE