Water Framework Directive intercalibration technical report - JRC ...
Water Framework Directive intercalibration technical report - JRC ...
Water Framework Directive intercalibration technical report - JRC ...

Create successful ePaper yourself
Turn your PDF publications into a flip-book with our unique Google optimized e-Paper software.
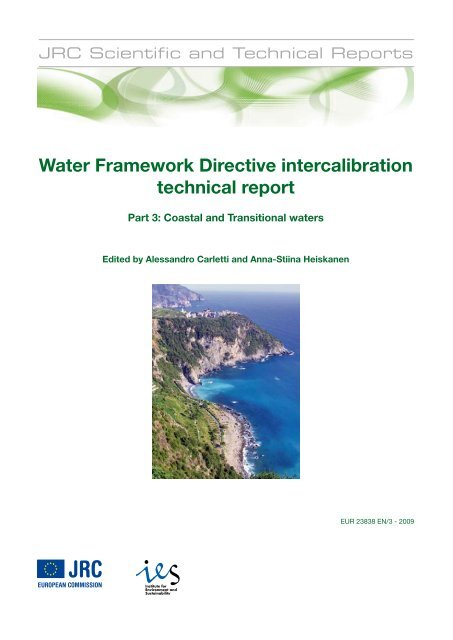
<strong>JRC</strong> Scientific and Technical Reports<br />
<strong>Water</strong> <strong>Framework</strong> <strong>Directive</strong> <strong>intercalibration</strong><br />
<strong>technical</strong> <strong>report</strong><br />
Part 3: Coastal and Transitional waters<br />
Edited by Alessandro Carletti and Anna-Stiina Heiskanen<br />
EUR 23838 EN/3 - 2009
The mission of the Institute for Environment and Sustainability is to provide scientific<strong>technical</strong><br />
support to the European Union’s Policies for the protection and sustainable<br />
development of the European and global environment.<br />
European Commission<br />
Joint Research Centre<br />
Institute for Environment and Sustainability<br />
Contact information<br />
Address: Via Enrico Fermi 2749<br />
I-21020 Ispra (VA), Italy<br />
E-mail: wouter.van-de-bund@jrc.ec.europa.eu<br />
Tel.: +39 0332 789955<br />
Fax: +39 032 789352<br />
http://ies.jrc.ec.europa.eu/<br />
http://www.jrc.ec.europa.eu/<br />
Legal Notice<br />
Neither the European Commission nor any person acting on behalf of the Commission is<br />
responsible for the use which might be made of this publication.<br />
Europe Direct is a service to help you find answers<br />
to your questions about the European Union<br />
Freephone number (*):<br />
00 800 6 7 8 9 10 11<br />
(*) Certain mobile telephone operators do not allow access to 00 800 numbers or these calls may be billed.<br />
A great deal of additional information on the European Union is available on the Internet.<br />
It can be accessed through the Europa server http://europa.eu/<br />
EUR 23838 EN/3<br />
ISBN 978-92-79-12568-3<br />
ISSN 1018-5593<br />
DOI 10.2788/19561<br />
Luxembourg: Office for Official Publications of the European Communities<br />
© European Communities, 2009<br />
Reproduction is authorised provided the source is acknowledged<br />
Printed in Italy
Contents<br />
Section 1 - Introduction ...................................................................................................... 7<br />
1 Introduction ........................................................................................................................... 7<br />
2 Background ............................................................................................................................ 7<br />
3 Geographical Intercalibration Groups (GIGs) and common <strong>intercalibration</strong> types ...... 11<br />
3.1 Geographical <strong>intercalibration</strong> groups ............................................................................... 11<br />
3.2 Common <strong>intercalibration</strong> types ........................................................................................ 11<br />
4 Methodology and Results ...................................................................................................... 15<br />
5 Discussion ............................................................................................................................... 17<br />
5.1 Comparability between quality elements ......................................................................... 17<br />
5.2 Open issues and need for further work ............................................................................. 18<br />
6 Summary and Conclusions ................................................................................................... 18<br />
Section 2 – Benthic Invertebrates .................................................................................. 19<br />
1 Introduction ........................................................................................................................... 19<br />
2 Methodology and results ....................................................................................................... 19<br />
2.1 Baltic GIG ........................................................................................................................ 19<br />
2.1.1 Intercalibration approach ..................................................................................... 19<br />
2.1.2 National methods that were intercalibrated.......................................................... 21<br />
2.1.3 Reference criteria and class boundary setting ...................................................... 24<br />
2.1.4 Results of the comparison ..................................................................................... 26<br />
2.1.5 Results of the harmonization – Boundary EQR values ......................................... 34<br />
2.1.6 Open issues and need for further work ................................................................. 34<br />
2.2 Black Sea GIG .................................................................................................................. 35<br />
2.2.1 Intercalibration approach ..................................................................................... 35<br />
2.2.2 National methods that were intercalibrated.......................................................... 35<br />
2.2.3 Reference conditions and class boundary setting ................................................. 35<br />
2.2.4 Results of the comparison ..................................................................................... 35<br />
2.2.5 Results of the harmonisation – Boundary EQR values ......................................... 42<br />
2.2.6 Open issues and need for further work ................................................................. 43<br />
2.3 Mediterranean GIG .......................................................................................................... 43<br />
2.3.1 Intercalibration approach ..................................................................................... 43<br />
2.3.2 National methods that were intercalibrated.......................................................... 44<br />
2.3.3 Reference conditions and class boundary setting ................................................. 44<br />
2.3.4 Results of the comparison ..................................................................................... 75<br />
3
4<br />
2.3.5 Results of the harmonisation – Boundary EQR values ......................................... 75<br />
2.3.6 Open issues and need for further work ................................................................. 75<br />
2.4 NE Atlantic GIG ............................................................................................................... 76<br />
2.4.1 Intercalibration approach ..................................................................................... 76<br />
2.4.2 National methods intercalibrated ......................................................................... 77<br />
2.4.3 Reference conditions and class boundary setting ................................................. 77<br />
2.4.4 Results of the comparison ..................................................................................... 91<br />
2.4.5 Results of the harmonisation – Boundary EQR values ......................................... 102<br />
2.4.6 Open issues and need for further work ................................................................. 103<br />
3 Discussion ............................................................................................................................... 104<br />
3.1 Comparability between GIGs ........................................................................................... 104<br />
3.2 Open issues and need for further work ............................................................................. 105<br />
4 References ............................................................................................................................... 105<br />
5 Annex ...................................................................................................................................... 108<br />
Section 3 – Phytoplankton ................................................................................................. 109<br />
1 Introduction ........................................................................................................................... 109<br />
2 Methodology and results ....................................................................................................... 109<br />
2.1 Baltic GIG ........................................................................................................................ 109<br />
2.1.3 Intercalibration approach ..................................................................................... 109<br />
2.1.4 National methods that were intercalibrated.......................................................... 111<br />
2.1.5 Reference conditions and boundary setting .......................................................... 111<br />
2.1.6 Results of the comparison and harmonisation ...................................................... 117<br />
2.1.7 Results of the harmonization – Boundary EQR values ......................................... 121<br />
2.1.8 Open issue and need for further work ................................................................... 122<br />
2.2 Black Sea GIG .................................................................................................................. 123<br />
2.2.1 Intercalibration approach ..................................................................................... 123<br />
2.2.2 Reference conditions and class boundary setting ................................................. 123<br />
2.2.3 Results of the harmonization – Boundary EQR values ......................................... 132<br />
2.2.4 Open issues and need for further work ................................................................. 132<br />
2.3 Mediterranean GIG .......................................................................................................... 132<br />
2.3.1 Intercalibration approach ..................................................................................... 132<br />
2.3.2 National methods that were intercalibrated.......................................................... 135<br />
2.3.3 Reference conditions and class boundary setting ................................................. 136<br />
2.3.4 Results of the comparison and harmonization ...................................................... 137<br />
2.3.5 Open issues and need for further work ................................................................. 138
2.4 NE Atlantic GIG ............................................................................................................... 138<br />
2.4.1 Intercalibration approach ..................................................................................... 138<br />
2.4.2 National methods that were intercalibrated.......................................................... 140<br />
2.4.3 Reference conditions and class boundary setting ................................................. 147<br />
2.4.4 Results of the comparison ..................................................................................... 161<br />
2.4.5 Results of the harmonization – Boundary thresholds and EQR values ................ 161<br />
2.4.6 Open issues and need for further work ................................................................. 169<br />
3 Discussion ............................................................................................................................... 170<br />
3.1 Comparability between GIGs ........................................................................................... 170<br />
3.2 Open issues and need for further work ............................................................................. 171<br />
4 References ............................................................................................................................... 171<br />
5 Annex ...................................................................................................................................... 174<br />
Section 4 – Macroalgae ...................................................................................................... 175<br />
1 Introduction ........................................................................................................................... 175<br />
2 Methodology and results ....................................................................................................... 175<br />
2.1 Mediterranean GIG .......................................................................................................... 175<br />
2.1.1 Intercalibration Approach ..................................................................................... 175<br />
2.1.2 National methods that were intercalibrated.......................................................... 176<br />
2.1.3 Reference conditions and class boundary setting ................................................. 178<br />
2.1.4 Intercalibration ..................................................................................................... 186<br />
2.1.5 Results of the comparison ..................................................................................... 188<br />
2.1.6 Results of the harmonisation – Boundary EQR values ......................................... 189<br />
2.1.7 Open issues and need for further work ................................................................. 190<br />
2.2 NE Atlantic GIG ............................................................................................................... 191<br />
2.2.1 Intercalibration approach ..................................................................................... 191<br />
2.2.2 National methods that were intercalibrated.......................................................... 192<br />
2.2.3 Reference conditions and class boundary setting ................................................. 194<br />
2.2.4 Results of the comparison ..................................................................................... 205<br />
2.2.5 Results of the harmonisation – Boundary thresholds and EQR values ................ 208<br />
2.2.6 Open issues and need for further work ................................................................. 213<br />
3 Discussion ............................................................................................................................... 213<br />
3.1 Comparability between GIGs ........................................................................................... 213<br />
3.2 Open issues and need for further work ............................................................................. 213<br />
4 References ............................................................................................................................... 214<br />
Section 5 – Angiosperms ................................................................................................... 219<br />
1 Introduction ........................................................................................................................... 219<br />
2 Methodology and Results ...................................................................................................... 219<br />
5
6<br />
2.1 Baltic GIG ........................................................................................................................ 219<br />
2.1.1 Intercalibration approach ..................................................................................... 219<br />
2.1.2 National methods that were intercalibrated.......................................................... 221<br />
2.1.3 Reference conditions and class boundary setting ................................................. 221<br />
2.1.4 Results of the comparison ..................................................................................... 225<br />
2.1.5 Results of the harmonisation – Boundary EQR values ......................................... 226<br />
2.1.6 Open issues and need for further work ................................................................. 226<br />
2.2 NE Atlantic GIG ............................................................................................................... 227<br />
2.2.1 Intercalibration approach ..................................................................................... 227<br />
2.2.2 National methods that were intercalibrated.......................................................... 228<br />
2.2.3 Reference conditions and class boundary setting ................................................. 229<br />
2.2.4 Results of the comparison ..................................................................................... 237<br />
2.2.5 Results of the harmonisation – Boundary thresholds and EQR values ................ 237<br />
2.2.6 Open issues and need for further work ................................................................. 239<br />
3 References ............................................................................................................................... 240
Section 1 – Introduction<br />
1<br />
Introduction<br />
This Technical Report gives an overview of the <strong>technical</strong> and scientific work that has been carried<br />
out in the Coastal and Transitional <strong>Water</strong>s <strong>intercalibration</strong> of ecological classification systems across<br />
the European Union as required by the <strong>Water</strong> <strong>Framework</strong> <strong>Directive</strong> (WFD).<br />
The results of this exercise were published in the Official Journal of the European Union as<br />
“Commission Decision 2008/915/EC of 30 October 2008 1<br />
The Coastal and Transitional <strong>Water</strong>s <strong>intercalibration</strong> exercise was carried out within 4 Geographical<br />
Intercalibration Groups (GIGs) – Baltic, Black Sea, Mediterranean and North East Atlantic.<br />
Common <strong>intercalibration</strong> types shared by Member States within each GIG were defined for the<br />
<strong>intercalibration</strong> exercise. The results of the first <strong>intercalibration</strong> exercise are the status boundaries<br />
for the benthic invertebrate fauna quality element (all GIGs), metrics and boundaries representing<br />
the phytoplankton quality element (all GIGs), metrics representing the macroalgae and angiosperms<br />
quality elements (Baltic, Mediterranean and NE Atlantic GIGs) and provisional boundaries for the<br />
fish quality element (NE Atlantic GIG only). These boundaries are based on definitions of reference<br />
criteria and the application of the Boundary Setting Protocol (BSP) to set the high-good and goodmoderate<br />
boundaries in line with the normative definitions for status class boundaries for each<br />
quality specified in the WFD.<br />
This <strong>report</strong> includes descriptions common and national coastal and transitional water types, national<br />
methods, common and national boundary setting protocols, the results of harmonisation of these<br />
boundaries between Member States as well as discussion of problems and way forward.<br />
This <strong>report</strong> is available electronically at the following internet address:<br />
http://circa.europa.eu/Public/irc/jrc/jrc_eewai/library?l=/<strong>intercalibration</strong>_2&vm=detailed&sb=Title<br />
Annexes are not included in the printed version, but can be downloaded from the above address.<br />
2<br />
Background<br />
The <strong>Water</strong> <strong>Framework</strong> <strong>Directive</strong> (WFD) establishes a framework for the protection of all<br />
waters (including inland surface waters, transitional waters, coastal waters and groundwater). The<br />
environmental objectives of the WFD set out that good ecological status 2 of natural water bodies and<br />
good ecological potential 3 of heavily modified and artificial water bodies should be reached by 2015.<br />
One of the key actions identified by the WFD is to carry out a European benchmarking or<br />
<strong>intercalibration</strong> (IC) exercise to ensure that good ecological status represents the same level of<br />
1 http://eur-lex.europa.eu/LexUriServ/LexUriServ.do?uri=OJ:L:2008:332:0020:0044:EN:PDF<br />
2 ‘Ecological status’ is an expression of the quality of the structure and functioning of aquatic ecosystems associated<br />
with surface waters, classified in accordance with Annex V WFD; ‘Good ecological status’ is the status of a body of surface<br />
water so classified in accordance with Annex V.<br />
3 ‘Good ecological potential’ is the status of a heavily modified or artificial body of water, so classified in accordance<br />
with the relevant provision of Annex V.<br />
7
ecological quality everywhere in Europe (Annex V WFD). It is designed to ensure that the values<br />
assigned by each Member State (MS) to the good ecological class boundaries are consistent with<br />
the <strong>Directive</strong>’s generic description of these boundaries and comparable to the boundaries proposed<br />
by other MS. The <strong>intercalibration</strong> of surface water ecological quality status assessment systems is a<br />
legal obligation.<br />
Intercalibration is carried out under the umbrella of Common Implementation Strategy (CIS)<br />
Working Group A - Ecological Status (ECOSTAT), which is responsible for evaluating the results<br />
of the IC exercise and making recommendations to the Strategic Co-ordination Group or WFD<br />
Committee. The IC exercise aims at consistency and comparability in the classification results of<br />
the monitoring systems operated by each MS for biological quality elements (CIS WFD Guidance<br />
Document No. 14; EC, 2005). In order to achieve this, each MS is required to establish Ecological<br />
Quality Ratios (EQRs) for the boundaries between high (H) and good (G) status and for the<br />
boundary between good (G) and moderate (M) status, which are consistent with the WFD normative<br />
definitions of those class boundaries given in Annex V of the WFD.<br />
All 27 MS of the European Union are involved in this process, along with Norway, who has joined<br />
the process on a voluntary basis. Expert groups have been established for lakes, rivers and coastal/<br />
transitional waters, subdivided into 14 Geographical Intercalibration Groups (GIGs -groups of MSs<br />
that share the same water body types in different sub-regions or ecoregions).<br />
The IC exercise aims to ensure that the H/G and the G/M boundaries in all MS’s assessment<br />
methods for biological quality elements correspond to comparable levels of ecosystem alteration<br />
(EC, 2005). Intercalibration guidance produced by CIS (WFD Guidance Document No. 14) warns<br />
that the process will only work if common EQR boundary values are agreed for very similar<br />
assessment methods or where the results for different assessment methods are normalised using<br />
appropriate transformation factors (EC, 2005). Different assessment methods (e.g. using different<br />
parameters indicative of a biological element) may show different response curves to pressures and<br />
therefore produce different EQRs when measuring the same degree of impact (EC, 2005).<br />
In each GIG, the IC exercise will be completed for those MS that already have data and (WFD<br />
compliant) assessment methods to set boundary EQR values for some of the biological quality<br />
elements. Countries that do not have data or assessment methods already available, or do not<br />
actively participate in the current IC exercise, need to agree with the outcome of the IC exercise and<br />
harmonise their assessment methods, taking into account the results of the current exercise, when<br />
their data/methods becomes available.<br />
The WFD refers to an ‘<strong>intercalibration</strong> network’, comprising sites selected from a range of surface<br />
water body types present within each ecoregion, as the basis for <strong>intercalibration</strong> (Annex V; 1.4.1).<br />
For each surface water body type selected, the WFD specifies that at least two sites corresponding<br />
to the boundary between high and good status, and between good and moderate status should be<br />
submitted by each Member State for <strong>intercalibration</strong>. However, as the IC exercise evolved, this<br />
network has become redundant, as these datasets were too small to permit robust <strong>intercalibration</strong>.<br />
This Technical Report provides a detailed description of the work that was carried out in the<br />
framework of the EU <strong>Water</strong> <strong>Framework</strong> <strong>Directive</strong> <strong>intercalibration</strong> exercise. harmonising the<br />
classification scales of national methods for ecological classification scales for rivers across the<br />
European Union. The <strong>technical</strong> work was carried from 2004 to 2007 by groups of experts from all<br />
EU Member States, within the framework of the Common Implementation Strategy working group<br />
(2)A on Ecological Status, facilitated by a steering group lead by the European Commission Joint<br />
Research Centre (<strong>JRC</strong>) (Figure 1.1).<br />
8
WG 2A<br />
Intercalibration Steering Group<br />
<strong>JRC</strong><br />
Lake Expert Group representative<br />
River Expert Group representative<br />
Coast Expert Group representative<br />
Lake experts/GIGs River experts/GIGs Coast experts/GIGs<br />
N<br />
AL<br />
C<br />
M<br />
AT<br />
EC<br />
N C<br />
Figure 2.1: Overview of the organisational structure of the <strong>intercalibration</strong> process (from EC 2005).<br />
AL<br />
Before the start of the <strong>intercalibration</strong> exercise a guidance document (EC 2005) was agreed<br />
describing the key principles and process options for the <strong>intercalibration</strong> exercise. The key principles<br />
of the <strong>intercalibration</strong> process as described in the guidance document are reproduced below.<br />
Key principles of the <strong>intercalibration</strong> process (from Guidance on the Intercalibration<br />
Process, EC 2005)<br />
1. The <strong>intercalibration</strong> process is aimed at consistency and comparability of the classification results of the monitoring systems 4<br />
operated by each Member State for the biological quality elements 5 . The <strong>intercalibration</strong> exercise must establish values for<br />
the boundary between the classes of high and good status, and for the boundary between good and moderate status, which are<br />
consistent with the normative definitions of those class boundaries given in Annex V of the WFD 6 .<br />
2. The essence of <strong>intercalibration</strong> is to ensure that the high-good and the good-moderate boundaries in all Member State’s<br />
assessment methods for biological quality elements correspond to comparable levels of ecosystem alteration. Intercalibration<br />
is not necessarily about agreeing common ecological quality ratio (EQR) values for the good status class boundaries as<br />
measured by different assessment methods. Common EQR values only make sense, and are only possible, where very similar<br />
assessment methods are being used or where the results for different assessment methods are normalised using appropriate<br />
transformation factors. This is because different assessment methods (e.g. using different parameters indicative of a biological<br />
element) may show different response curves to pressures and therefore produce different EQRs when measuring the same<br />
degree of impact.<br />
3. The first phase of the process is the establishment of an <strong>intercalibration</strong> network for a limited number of water body types<br />
consisting of sites representing boundaries between the quality classes High-Good and Good-Moderate, based on the WFD<br />
normative definitions. The WFD requires that selection of these sites is carried out “using expert judgement based on joint<br />
inspections and all available information 7 ”.<br />
4 The term ‘monitoring system’ in the way it is commonly used includes the whole process from sampling, measurement<br />
and assessment including all quality elements (biological and other). In the context of WFD Annex V, 1.4.1, the term<br />
‘monitoring system’ only refers to a biological assessment method, applied as a classification tool, the results of which<br />
can be expressed as ecological quality ratios. This guidance uses the term ‘WFD assessment method’ in place of the term<br />
‘monitoring system’ that may be misleading in this context.<br />
5 The WFD <strong>intercalibration</strong> as described in Annex V, 1.4.1 does not concern the monitoring systems themselves, nor the<br />
biological methods, but the classification results<br />
6 WFD Annex V, 1.4.1 (ii), (iii), (iv), (vi)<br />
7 WFD Annex V, 1.4.1 (v)<br />
EC<br />
M<br />
NEA<br />
BA<br />
M<br />
BS<br />
9
10<br />
4. The Intercalibration Guidance states that “some artificial or heavily modified water bodies could be considered to be<br />
included in the <strong>intercalibration</strong> network, if they fit in one of the natural water body types selected for the <strong>intercalibration</strong><br />
network. Artificial and heavily modified water bodies that are not comparable with any natural water bodies should only<br />
be included in the <strong>intercalibration</strong> network, if they are dominant within a water category in one or more Member States; in<br />
that case they should be treated as one or several separate water body types”. An artificial or heavily modified water body is<br />
considered to fit in a natural water type if the maximum ecological potential of the artificial or heavily modified water body<br />
is comparable to the reference conditions of the natural type for those quality elements considered in the <strong>intercalibration</strong><br />
exercise 8 .<br />
5 In the second phase of the process, each Member State’s assessment method must be applied to those sites on the register<br />
that are both in the ecoregion (or, as pointed out in section 2.8, in the Geographical Intercalibration Group (GIG)) and of a<br />
surface water body type to which the system will be applied. The results of the second phase must be used to set the EQR<br />
values for the relevant class boundaries for each Member States’ biological assessment system. The results of the exercise<br />
will be published by the Commission by 22 December 2006 at the latest.<br />
6. Intercalibration sites are selected by the Member States, and represent their interpretation of the WFD normative definitions<br />
of high, good and moderate status. There is no guarantee that different Member States will have the same views on how the<br />
normative definitions should be interpreted. Differences in interpretation are reflected in the <strong>intercalibration</strong> network 9 . A<br />
common interpretation of the normative definitions should be the main outcome of the <strong>intercalibration</strong> exercise. At the end<br />
of the <strong>intercalibration</strong> exercise the <strong>intercalibration</strong> network may need to be revised according to this common interpretation.<br />
7. The Intercalibration Exercise is focused on specific type/biological quality element/pressure combinations 10 . The selection<br />
of these combinations is based on the availability of adequate data within the time constraints of the exercise. This means<br />
that the exercise will not identify good status boundary EQR values for all the type/biological quality element/pressure<br />
combinations relevant for the implementation of the WFD. However, the Intercalibration Exercise will identify, and test the<br />
use of, a procedure and criteria for setting boundaries in relation to any such combinations 11 .<br />
8. The <strong>intercalibration</strong> process described in this guidance is aimed at identifying and resolving:<br />
(a) Any major/significant inconsistencies between the values for the good ecological status class boundaries established<br />
by Member States and the values for those boundaries indicated by the normative definitions set out in Section 1.2<br />
of Annex V of the WFD; and,<br />
(b) Any major/significant incomparability between the values established for the good status class boundaries by<br />
different Member States.<br />
9. The process will identify appropriate values for the boundaries of the good ecological status class applicable to the<br />
ecological quality ratio EQR scales produced by the Member States’ assessment methods.<br />
10. The Intercalibration Exercise will be undertaken within GIGs rather than the ecoregions defined in Annex XI of the WFD.<br />
This is to enable <strong>intercalibration</strong> between a maximum number of Member States.<br />
11. The Intercalibration Exercise assumes that all Member States will have developed their national WFD assessment methods<br />
to a sufficient extent to enable the consistency with the normative definitions, and the comparability between Member<br />
States, of the good status boundary EQR values for those methods to be assessed during 2005. It was recognized however<br />
that this assumption might be problematic. An inventory on the state-of-the-art in the developments of WFD compliant<br />
methods is carried out during the process of finalisation of the <strong>intercalibration</strong> network 12 .<br />
8 This is not the case for those quality elements that are significantly impacted by the hydromorphological alteration that<br />
has led to the water body to be designated as heavily modified.<br />
9 Intercalibration Guidance, section 3.5<br />
10 as described in the document’ Overview of common Intercalibration types’ (available at the <strong>intercalibration</strong> site submission<br />
web pages, http://wfd-<strong>report</strong>ing.jrc.cec.eu.int/Docs/typesmanual)<br />
11 If the results of the method are significantly affected by biogeographical or other ecological differences within the<br />
<strong>intercalibration</strong> type, different boundary EQR values may be appropriate for different parts of the type<br />
12 The metadata questionnaire is available at the <strong>intercalibration</strong> site submission web pages, http://wfd-<strong>report</strong>ing.jrc.<br />
cec.eu.int/Docs/ metadata
3<br />
3.1<br />
Geographical Intercalibration Groups (GIGs)<br />
and common <strong>intercalibration</strong> types<br />
Geographical <strong>intercalibration</strong> groups<br />
For coastal and transitional waters, four geographical <strong>intercalibration</strong> groups were agreed upon:<br />
Baltic, (see chapter 1.1.3), including Denmark, Germany, Finland, Sweden, Latvia, Lithuania,<br />
Estonia and Poland.<br />
Black Sea (see chapter 1.1.4) includes Bulgaria and Romania.<br />
Mediterranean (see chapter 1.1.5), including Spain, France, Italy, Slovenia, Greece, Cyprus, Malta.<br />
Croatia as a potential accession country also participates.<br />
North East Atlantic (see chapter 1.1.6), including Portugal, Spain, France, Ireland, UK, Belgium,<br />
Netherlands, Germany, Denmark, Sweden and Norway.<br />
3.2<br />
Common <strong>intercalibration</strong> types<br />
The common coastal <strong>intercalibration</strong> types are characterised broadly by the descriptors of the WFD<br />
System B typology: geographical position (for latitude and longitude), tidal range and salinity as<br />
obligatory factors plus optional factors such as, exposure, depth, mixing characteristics, substratum<br />
composition, current velocity, residence time and ice cover where applicable.<br />
Baltic<br />
The Baltic GIG includes the whole or parts of the coastline of the following countries: DE= Germany,<br />
DK=Denmark, EE=Estonia, FI= Finland, LT=Latvia, LI=Lithuania, PL=Poland and SE=Sweden.<br />
The common <strong>intercalibration</strong> types were agreed using the basic factors of salinity and exposure with<br />
further delineation based on depth and number of ice cover days plus the identification of one lagoon<br />
type. The countries which have each type within their coastal waters are shown in the table below.<br />
All countries agreed to intercalibrate quality elements that respond to eutrophication pressures. The<br />
chosen elements in each type are also shown in the table below.<br />
Table 2.2.1: Common <strong>intercalibration</strong> types.<br />
Type Pressure Quality element<br />
CW B0<br />
Salinity 0.5-3, sheltered, Eutrophication<br />
shallow, >150 ice days<br />
CW B2<br />
Salinity 3-6, sheltered, shallow, Eutrophication<br />
90-150 ice days<br />
CW B3<br />
Salinity 3-6, sheltered, shallow, Eutrophication<br />
90 ice days<br />
CW B12<br />
Salinity 6-22, sheltered, shallow Eutrophication<br />
CW B13<br />
Salinity 6-22, exposed, shallow<br />
CW B14<br />
Salinity 6-22, sheltered, shallow<br />
lagoons<br />
Phytoplankton: Chlorophyll a<br />
Benthic Fauna: National indices<br />
Phytoplankton: Chlorophyll a<br />
Benthic Fauna: National indices<br />
Phytoplankton: Chlorophyll a<br />
Benthic Fauna: National indices<br />
Phytoplankton: Chlorophyll a<br />
Angiosperms: Eelgrass depth limit (DK + DE)<br />
Benthic Fauna: National indices<br />
Eutrophication Phytoplankton: Chlorophyll a<br />
Benthic Fauna: National indices<br />
Eutrophication Phytoplankton: Chlorophyll a<br />
Countries involved<br />
(number of sites)<br />
SE<br />
FI , SE<br />
FI , SE<br />
FI, SE<br />
FI<br />
FI, SE<br />
DE, DK, EE, SE<br />
EE, LV, PL<br />
DK, LT, LT, PL<br />
PL<br />
DK, PL<br />
11
Black Sea<br />
Bulgaria and Romania are the only two countries participating in the Black Sea GIG and identified<br />
one common <strong>intercalibration</strong> type, BS1: based on salinity (mesohaline), depth (shallow waters)<br />
and substratum (mixed). In this phase of the <strong>intercalibration</strong> only the benthic invertebrates and<br />
phytoplankton quality elements have been considered, as these are the most developed indicators in<br />
the two countries.<br />
Mediterranean<br />
The Mediterranean GIG includes seven Member States, Spain, France, Italy, Slovenia, Greece,<br />
Cyprus and Malta plus Croatia as an accession country. The Mediterranean GIG has at this<br />
stage confined its work to coastal waters. Transitional waters were not included in this phase of<br />
the <strong>intercalibration</strong> exercise due to lack of sites and data in participating countries. Preliminary<br />
discussions on transitional water have taken place with a view to undertaking further assessments in<br />
phase two.<br />
Mediterranean Coastal IC types were defined primarily on the substratum composition and the<br />
depth profile. Salinity was not seen as a primary discriminating factor as it is very similar across the<br />
whole Mediterranean basin. The Mediterranean GIG agreed four basic coastal water types as shown<br />
below:<br />
Table 2.2.2: Mediterranean Coastal <strong>Water</strong>s Types.<br />
12<br />
Type Name of Type Substratum (1) Depth (2)<br />
CW - M1 Rocky shallow coast rocky shallow<br />
CW - M2 Rocky deep coast rocky deep<br />
CW - M3 Sedimentary shallow coast sedimentary shallow<br />
CW - M4 Sedimentary deep coast sedimentary deep<br />
(1) In many cases different seabed substrata will occur within one waterbody type. The dominant<br />
substratum should be selected.<br />
(2) Depth division is based on 40 m depth at 1 mile distance from the coastline.<br />
The following quality elements with respective countries’ participation have been included in<br />
this phase of the <strong>intercalibration</strong> exercise: Phytoplankton: CY, ES (Balearic Islands, Catalonia,<br />
Valencia), F, GR, IT, SL and Croatia participating,<br />
Benthic macroinvertebrates: CY, ES (Balearic Islands, Catalonia, F, GR, IT, SL participating,<br />
Macroalgae: CY, ES (Catalonia, Valencia), F, GR and I, participating<br />
Angiosperms (P.oceanica): ES (Catalonia, Valencia), F, GR, IT, Malta participating.<br />
Typology<br />
Not all types are included for each quality element: in some cases the type distinctions were not<br />
relevant for the IC exercise (e.g. Angiosperm) and new types have been defined for the specific<br />
analysis of phytoplankton, as shown below:
Table 2.2.3: details about typology.<br />
All types included? All pressures included?<br />
Phytoplankton<br />
Revision of Typologies Yes<br />
Benthic invertebrate fauna<br />
Only M2 & M3 Yes<br />
Macroalgae<br />
M1, M2 & M3 Yes<br />
Angiosperms: P.oceanica<br />
No types distinction Yes<br />
Phytoplankton Typologies<br />
Details on the process that was followed for this types’ revision are found in the specific part Section<br />
3. Phytoplankton.<br />
For general information:<br />
Three different water types, in an ecological perspective, have been described as follows:<br />
Type 1 coastal sites highly influenced by freshwater inputs<br />
Type 2 coastal sites not directly affected by freshwater inputs<br />
Type 3 coastal sites not affected by freshwater inputs<br />
Further discrimination within types based on geographical/ecological differences (e.g. eastern,<br />
western Mediterranean basins) was used, in some cases in order that the exercise produced<br />
biologically meaningful results.<br />
North East Atlantic<br />
The North East Atlantic GIG involves eleven countries, Portugal, Spain, France, Ireland, UK,<br />
Belgium, Netherlands, Germany, Denmark, Sweden and Norway. Common <strong>intercalibration</strong> types<br />
were agreed based on the obligatory factors salinity and tidal range, plus optional factors, depth,<br />
current velocity, exposure, mixing and residence time. After consideration of the relevance of the<br />
original types within the NE Atlantic complex, based solely on the above factors, it was decided that<br />
in some cases there was no biological differences between types in relation to the chosen quality<br />
element or metric(s) being intercalibrated and that some could be merged together. This resulted in<br />
the adoption of the following grouped types in this <strong>intercalibration</strong> exercise:<br />
13
Table 2.2.4: NEA Coastal <strong>Water</strong>s Types.<br />
14<br />
New Type ID Name<br />
CW –NEA1/26a<br />
CW –NEA1/26b<br />
CW –NEA1/26c<br />
CW –NEA1/26d<br />
CW –NEA1/26e<br />
CW – NEA3/4<br />
CW – NEA7<br />
CW – NEA8<br />
CW – NEA9<br />
CW – NEA10<br />
Open oceanic, exposed<br />
or sheltered, euhaline,<br />
shallow<br />
Enclosed seas, exposed<br />
or sheltered, euhaline,<br />
shallow<br />
Enclosed seas, exposed<br />
or sheltered, partly<br />
stratified<br />
Scandinavian coast,<br />
exposed or sheltered,<br />
shallow<br />
Areas of upwelling,<br />
exposed or sheltered,<br />
euhaline, shallow<br />
Polyhaline, exposed or<br />
moderately exposed<br />
(Wadden Sea type)<br />
Deep, low current,<br />
sheltered<br />
Polyhaline, microtidal,<br />
sheltered, shallow<br />
(Skagerrak inner arc<br />
type)<br />
Fjord with a shallow<br />
sill at the mouth with<br />
a very deep maximum<br />
depth in the central<br />
basin with poor<br />
deepwater exchange.<br />
Polyhaline, microtidal<br />
exposed, deep<br />
(Skaggerak outer arc<br />
type)<br />
TW – NEA11 Transitional waters<br />
Salinity<br />
(PSU)<br />
Fully saline<br />
(> 30)<br />
Fully saline<br />
(> 30)<br />
Fully saline<br />
(> 30)<br />
Fully saline<br />
(> 30)<br />
Fully saline<br />
(> 30)<br />
Polyhaline<br />
(18 - 30)<br />
Fully saline<br />
(> 30)<br />
Polyhaline<br />
(18 - 30)<br />
Polyhaline<br />
(18 - 30)<br />
Polyhaline<br />
(18 - 30)<br />
Oligo-<br />
Euhaline<br />
(0 - 35)<br />
Tidal range<br />
(m)<br />
Mesotidal<br />
(1 - 5)<br />
Mesotidal<br />
(1 - 5)<br />
Microtiadl/<br />
Mesotidal<br />
(1 - 5)<br />
Microtidal<br />
( 30)<br />
Shallow<br />
(< 30)<br />
Deep<br />
(> 30)<br />
Deep<br />
(> 30)<br />
Shallow<br />
(< 30)<br />
Current<br />
velocity<br />
Medium<br />
(1 - 3<br />
knots)<br />
Medium<br />
(1 - 3<br />
knots)<br />
Medium<br />
(1 - 3<br />
knots)<br />
Low<br />
(
In each type relevant biological quality elements have been included in this stage of the<br />
<strong>intercalibration</strong> process, linked to specified pressures. These are detailed in the table below:<br />
Table 2.2.6: Quality elements and pressures included per types in the <strong>intercalibration</strong>.<br />
Type Biological Quality Elements Pressures<br />
CW – NEA1/26, NEA3/4, NEA7,<br />
NEA8, NEA9, NEA10<br />
Benthic Invertebrates<br />
Phytoplankton<br />
Macroalgae/Angiosperms<br />
TW – NEA11 Benthic Invertebrates<br />
Macroalgae/Angiosperms<br />
Fish<br />
Organic enrichment<br />
Hazardous substances<br />
Nutrient enrichment<br />
Morphological alteration<br />
Organic enrichment<br />
Hazardous substances<br />
Morphological alteration<br />
Organic enrichment (DO)<br />
This does not mean that <strong>intercalibration</strong> for all quality elements (or metrics) has been completed in<br />
each type at this stage of the process.<br />
4<br />
Methodology and Results<br />
Following the CIS guidance on <strong>intercalibration</strong> options the coastal GIGs selected the most<br />
appropriate for each quality element and metric selected. The following describes the options chosen<br />
within each GIG:<br />
Baltic<br />
The following <strong>intercalibration</strong> options were chosen for the relevant biological quality elements and<br />
metrics.<br />
Phytoplankton:<br />
a) Hybrid between option 2 and 3 (Denmark, Estonia, Finland, Germany, Latvia and Sweden)<br />
A common metric – summer mean of chlorophyll a from May/June to September - was<br />
agreed. In some parts of the Baltic Sea the summer period can be shorter. Intercalibration was<br />
performed by comparison of the results from the national assessment tools. Within each type<br />
member state essentially agreed on common reference and classifications values for the whole<br />
type or for sub areas in the type. (However, Type B3 in Sweden and Finland differ a lot from<br />
each other by their natural conditions, which complicates <strong>intercalibration</strong>).<br />
b) Option 3<br />
A combined data set from most member states participating in the Baltic GIG has been<br />
compiled and an overall relation between chl. a and TN established. Further and future work on<br />
establishing type or site specific chl. a-TN relationships and ranges of nutrient concentrations<br />
related to the different ecological classes may provide a useful tool for setting boundaries.<br />
Benthic fauna: Option 3 (Estonia, Denmark, Finland, Germany, Latvia and Sweden)<br />
Intercalibration is performed in three steps, comparison of species sensitivity classifications,<br />
comparison of indices and comparison of classification of water bodies based on national methods<br />
for assessment. Work is still ongoing.<br />
15
Angiosperms: Hybrid between option 2 and 3. Bilaterally between Denmark and Germany<br />
Reference levels are based on historical data, expert judgement and modeling. Two approaches have<br />
been used for classification: 1) percent deviation (3 scenarios) and 2) modeling.<br />
Denmark used the maximum depth of 5 % eelgrass cover to define the depth limit. Germany used<br />
historical records of depth limit to define reference and light modeling to define depth limits.<br />
Black Sea<br />
Taking into account that both countries are aiming to use at national level the same methods<br />
for phytoplankton and macrozoobenthos, Option 1 was initially chosen however the final<br />
<strong>intercalibration</strong> used option 3 in the first instance as only common metrics for each quality element<br />
could be agreed on rather than common whole classification systems covering the whole element.<br />
Mediterranean<br />
For each biological quality element considered, different options were used, mainly hybrids.<br />
Phytoplankton<br />
A hybrid between options 1 and 2 is used. No national methods were intercalibrated. Only common<br />
statistical analysis on chl-α, nutrients and physico-chemical data and some multivariate techniques<br />
have been performed as a starting point (exploratory data analysis) for the <strong>intercalibration</strong> process.<br />
Benthic invertebrates<br />
A hybrid between options 2 and 3 is used.<br />
Macroalgae<br />
Option 3 has been used; i.e. Member States have set national boundaries using their own nationally<br />
developed assessment methods. These systems are then compared between Member States by<br />
application of these methods on each country’s data.<br />
Angiosperms (P.oceanica)<br />
Option 3 has been used; i.e. Member States have set national boundaries using their own nationally<br />
developed assessment methods. These systems are then compared between Member States by<br />
application of these methods on each country’s data.<br />
North East Atlantic<br />
The following <strong>intercalibration</strong> options have been used for the biological quality elements.<br />
Benthic Invertebrates<br />
Option 3 has been used in all types i.e. Member States have set national boundaries using their<br />
own nationally developed assessment methods. These systems are then compared between Member<br />
States by application of these methods on each country’s data. Initial appraisal is made of the<br />
16
level of agreement on status assessments between countries methods when data is exchanged, and<br />
national boundaries adjusted post this comparison until a satisfactory degree of agreement is reached<br />
(e.g. > 80 % comparability).<br />
Phytoplankton<br />
Option 2 has been used in all types. Metrics have been selected that form part of the overall quality<br />
element assessment that are used in all Member States own classification systems where a common<br />
approach can be adopted to setting boundaries for these metrics at the GIG level. These boundaries<br />
may differ according to the type selected and in some cases region specific boundaries within types<br />
have been adopted. At this stage the selected metrics are, chlorophyll-a (90 th percentile over a six<br />
year period), frequency of Phaeocystis cell counts above 10 6 cells/l over a six year period and<br />
frequency of microphytoplanton cell counts above 10 5 cells/l.<br />
Macroalgae and Angiosperms<br />
A hybrid approach between option 2 and 3 has been used for the macroalgae and angiosperms<br />
metrics. Metrics have been selected that form part of the overall quality element assessment that<br />
are used in all Member States own classification systems where a common approach can be adopted<br />
to setting boundaries for these metrics at the GIG level. These boundaries may differ according to<br />
the type selected and in some cases region specific boundaries within types have been adopted. At<br />
this stage the selected metrics are, opportunistic macroalgae (areal extent and/or biomass), perennial<br />
intertidal and subtidal algae (extent and species composition), intertidal and subtidal seagrass (areal<br />
extent, density and species composition) and saltmarsh (areal extent and species composition). For<br />
seagrass a combination of options 2 and 3 was used because UK and NL use broadly the same<br />
metrics but derived boundary conditions separately which were then compared and harmonized.<br />
Fish<br />
Option 3 has been used i.e. Member States have set national boundaries using their own nationally<br />
developed assessment methods. These systems are then compared between Member States<br />
by application of these methods on each country’s data. Initial appraisal is made of the level of<br />
agreement on status assessments between countries methods when data is exchanged, and national<br />
boundaries adjusted post this comparison until a satisfactory degree of agreement is reached (e.g.<br />
> 80 % comparability). The original intention was to pursue an option 1 solution. This is still the<br />
preferred option and may be possible in Phase II.<br />
5<br />
Discussion<br />
5.1 Comparability between quality elements<br />
There has not been an exercise in phase one of the <strong>intercalibration</strong> process to directly compare the<br />
results for common quality elements between the GIGs. A range of <strong>intercalibration</strong> options have<br />
been used for each quality element in the different GIGs. Therefore it is not possible at this time<br />
to demonstrate that where similar metrics or classification systems have been used that they show<br />
the same level of comparability between the GIGs as within individual GIGs. However in many<br />
17
cases the biology of the geographical regions is very different e.g. it is very difficult to compare the<br />
Baltic with the Mediterranean. However further evaluation is needed where the same basic metric<br />
is being used e.g. depth limitation, to investigate if there is more scope for further harmonization of<br />
approaches.<br />
5.2<br />
18<br />
Open issues and need for further work<br />
The main area where further work is needed in the second phase of the process is in transitional<br />
waters. Almost none of the results presented in phase one of the process are applicable in transitional<br />
waters, except for a few metrics developed for coastal waters that can be used in the higher salinity<br />
areas. One key quality element in transitional waters is fish. No agreed results were produced in phase<br />
one, making this a key priority in phase two. However a lot of work has been done on fish in the North<br />
East Atlantic GIG which may be applicable in other GIGs. It is anticipated that results for fish can<br />
be produced quite early in the next phase. Another issue is whether the basic typology needs to be<br />
redefined in some GIGs. There have been some difficulties in phase one with the broad nature of the<br />
typology and further subdivisions have been necessary in order to produce results. Transitional waters<br />
will definitely need a new typology for all quality elements. Further work is also needed to cover the<br />
key pressures that have not been assessed in phase one. Some methods and metrics for which results<br />
have been agreed so far respond to specific pressures. It is also important to look in future at how<br />
biological indicators respond to different combinations of pressures. Another issue is how assessments<br />
of the status of whole waterbodies are done using the agreed methods and metrics. Further work is<br />
needed to ensure a common approach is adopted to classification of waterbodies across all GIGs. This<br />
work should be linked to the development of classification rules, data aggregation and assessment and<br />
common approaches to sampling and analysis strategies.<br />
6<br />
Summary and Conclusions<br />
In summary results have been produced in all GIGs for at least two quality elements. In many<br />
cases these results for which intercalibrated results have been agreed are only part of the overall<br />
national classification systems. Therefore a main conclusion is that while common values have been<br />
agreed principally at the metric level much more work is required in the next phase to compare<br />
Member States’ whole quality element methods and apply these to the status assessment of whole<br />
waterbodies. Only after this has been done can it be truly demonstrated that there is an equal level<br />
of ambition across GIGs and within GIGs.
Section 2 – Benthic Invertebrates<br />
1<br />
Introduction<br />
Three of the four coastal water GIGs have been able to produce results for the benthic invertebrate<br />
quality element. Each GIG has several typologies that are found in these waters. Not all countries<br />
within each GIG have all the types within its borders. Information about the types and countries<br />
with each type in each GIG is described in the sections below.<br />
All the GIGs have chosen Option 3 in this phase of the <strong>intercalibration</strong> process. Therefore Member<br />
States have developed their own classification schemes, these have been assessed against each other<br />
through the exchange and evaluation of data and the boundaries in each scheme harmonized to give<br />
an acceptable level of agreement.<br />
It is important to note that the methods intercalibrated in this phase are habitat specific. All methods<br />
are for use in soft sediment habitats. Methods for other habitats are largely still under development<br />
and cannot be assessed at this stage.<br />
2<br />
2.1<br />
Methodology and results<br />
Baltic GIG<br />
2.1.1 Intercalibration approach<br />
The Baltic Sea Geographical Intercalibration Group (GIG) carried out <strong>intercalibration</strong> of the<br />
macroinvertebrate assessment systems for coastal waters developed in four Member States:<br />
Denmark, Finland, Germany and Sweden. The results from the <strong>intercalibration</strong> between Sweden<br />
and Finland are presented in this <strong>technical</strong> <strong>report</strong>. Comparability between the Danish, German,<br />
and Swedish macroinvertebrate methods could not be demonstrated and thus those results are not<br />
included in the <strong>technical</strong> <strong>report</strong>. In addition, macroinvertebrate assessment methods have been<br />
developed in Estonia, but the <strong>intercalibration</strong> exercise could not be completed as the other countries<br />
sharing the same coastal types with Estonia had not yet their national methods ready13 .<br />
The Option 3, as described in the Guidance of the Intercalibration Process 14 , was used for the<br />
Benthic Invertebrate fauna quality element. The Member States have developed their own<br />
classification schemes, these have been assessed against each other through the exchange and<br />
evaluation of data and the boundaries in each scheme harmonized to give an acceptable level of<br />
agreement. The setting of the reference conditions and high-good and good-moderate boundaries<br />
for each Member States’ assessment systems was first carried out separately and then the outcomes<br />
of these systems were compared on water body (or sample) level against each others by applying<br />
13 Report of the Estonian assessment method and the preliminary evaluation of the comparability with methods from<br />
other Baltic Sea countries is presented in the Baltic Sea Milestone Report 6. Quality element: Benthic Fauna. Version 16<br />
June 2006. Rev. 3, 30 March 2007. Available at: http://circa.europa.eu/Public/irc/jrc/jrc_eewai/library, in folder: GIG Milestone<br />
Reports<br />
14 Guidance on Intercalibration Process, No 14. Available at: http://circa.europa.eu/Public/irc/env/wfd/library<br />
19
different national assessment methods to local data sets from countries sharing the same common<br />
types. At this stage the assessment systems of four countries, Denmark, Finland, Germany and<br />
Sweden could be compared bilaterally against each others using data from the coastal types that<br />
these countries share. Finally, only the results between Sweden and Finland were concluded to be<br />
sufficiently comparable and could be included in the final decision.<br />
Intercalibration was performed in three steps, 1) comparison of species sensitivity classifications,<br />
2) comparison of indices, and 3) comparison of water body classifications using different national<br />
assessment methods applied to local datasets.<br />
Baltic Sea Common <strong>intercalibration</strong> types<br />
The Baltic Sea Geographical Intercalibration Group (GIG) includes the whole or parts of the<br />
coastline of the following countries: Germany, Denmark, Estonia, Finland, Latvia, Lithuania, Poland<br />
and Sweden (Table 2.1.1).<br />
The common coastal water types are characterised by the descriptors of the System B typology.<br />
The typology factors are based on the common typology framework presented in the guidance<br />
on the typology for the coastal and transitional waters 15 . In the Baltic Sea GIG, the common<br />
<strong>intercalibration</strong> types were characterized using basic salinity and exposure with further delineation<br />
based on depth and number of ice cover days (Table 2.1.1). One transitional water type (TW B 13)<br />
was identified. All countries agreed to focus the <strong>intercalibration</strong> on the quality elements that are<br />
sensitive to eutrophication pressures.<br />
Table 2.1.1: Description of Baltic Sea Common <strong>intercalibration</strong> types that have included in the <strong>intercalibration</strong> exercise.<br />
20<br />
Type Salinity<br />
psu<br />
Exposure Depth Ice days Other Characteristics<br />
CW B0 0.5- 3 Sheltered Shallow > 150 Sites in Botnian Bay (Northern Quark)<br />
CW B2 3-6 Sheltered Shallow 90-150 Sites in Bothnian Sea<br />
CW B3 a 3-6 Sheltered Shallow ∼90 Sites in the area extending from the southern<br />
Bothinian Sea to the Archipelago Sea and<br />
CW B3 b 3-6 Exposed Shallow ∼90 the western Gulf of Finland<br />
CW<br />
B12 b<br />
Western<br />
Baltic Sea<br />
8 - 22 Sheltered Shallow - Sites at the Southern Swedish coast and the<br />
South western Baltic Sea open coast along<br />
Denmark and Germany<br />
CW B13 6-22 Exposed Shallow - Sites along the coast of the Estonia, Latvia<br />
and Lithuania, the Polish coast and the<br />
Danish island “Bornholm”<br />
CW B 14 6-22 Sheltered Shallow - Lagoons<br />
TW B 13 6-22 Exposed Shallow Transitional water. Sites along the coast of<br />
Lithuania and Poland<br />
15 Guidance document No. 5 ‘Transitional and Coastal <strong>Water</strong>s - Typology, Reference conditions, and Classification systems’.<br />
Common Implementation Strategy of the <strong>Water</strong> <strong>Framework</strong> <strong>Directive</strong>, Available at: http://forum.europa.eu.int/Public/irc/env/wfd/library
The common <strong>intercalibration</strong> types were characterised by the following descriptors:<br />
– Salinity (using practical salinity scale): low (0,5-3) and high (3-6) oligohaline, mesohaline (6-22)<br />
– Depth: all shallow (150 days/ year, 90-150 days/ year, no or very short ice cover<br />
At this stage four countries, Denmark, Finland, Germany and Sweden had developed benthic<br />
macroinvertebrate assessment systems that could be intercalibrated for five Baltic Sea common<br />
types:<br />
Types CWB0, CWB2, CWB3a, CWB3b: Finland, Sweden.<br />
Type CWB12b: Germany, Denmark, Sweden.<br />
At this stage, <strong>intercalibration</strong> was completed for the four types shared between Finland and Sweden<br />
in the Bothnian Sea and Bothnian Bay. The list of the two national methods intercalibrated is<br />
presented below (Table 2.1.2.).<br />
Table 21.2: The national assessment methods for the classification of ecological quality based on benthic<br />
macroinvertebrates that were compared during the <strong>intercalibration</strong> exercise.<br />
Country Assessment Method<br />
Finland BBI- Finnish Brackish <strong>Water</strong> Benthic Index<br />
Sweden BQI–Swedish multimetric biological quality index (soft sediment infauna)<br />
2.1.2<br />
National methods that were intercalibrated<br />
Macroinvertebrates have for decades been an integrated part of monitoring programmes setup to<br />
detect marine pollution or eutrophication. Soft bottom macrofauna is a well-suited parameter to use<br />
since it is stationary, relatively long-lived, easy to collect quantitatively, restricted to very limited<br />
vertical distribution in or just below the sediment surface, and they can be identified to species also<br />
after unlimited preservation. The impact of pollution in the water column is not necessarily the same<br />
as in the bottom and at the sediment-water interface, in which the long-term effects of discharged<br />
pollutants, may be better monitored by using sessile or sedentary organisms as indicators.<br />
Changes in abundance, biomass and species composition of the benthic communities are signs of<br />
eutrophication. Some of these species will respond to changes in food supply and/or sedimentation<br />
rates and/or lowered oxygen concentrations (Diaz & Rosenberg 1995; Gray et al. 2002). The<br />
complex benthic communities respond to anthropogenic loading and stress by establishing a new<br />
community structure more tolerant to the increasingly unfavorable physio-chemical conditions<br />
(Leppäkoski 1975). Karlson et al. (2002) gives a good review on eutrophication and oxygen<br />
deficiency and their effects on the benthic community in Baltic coastal waters. Many indices and<br />
approaches have been developed for the assessment of the status of zoobenthos communities in<br />
marine waters. However, many of them are not applicable in the brackish Baltic Sea ecoregion due<br />
to the low biodiversity. The gradually decreasing salinity and diminishing species richness towards<br />
16 According to the definitions of the common European exposure categories; Guidance document No. 5<br />
21
north- and east in the Baltic Sea make only region-specific comparisons of data and assessment<br />
systems meaningful.<br />
Finland:<br />
The Finnish Brackish <strong>Water</strong> Benthic Index, BBI, follows the theory that biodiversity increases with<br />
increasing distance from a pollution source along a gradient of disturbance (Pearson & Rosenberg<br />
1978). The index is very similar to other multimetric indices developed for marine conditions<br />
(Danish DKI-index and British BMI-index) (Borja et al. 2007), but it has additional features which<br />
make it apt to brackish water conditions, typical for the Baltic Sea (Perus et al. 2007). The index is<br />
a construction of the Baltic Sea-adapted BQI-index (Rosenberg et al. 2004, Blomqvist et al. 2007)<br />
with additional biodiversity and abundance factors incorporated into the matrix. Therefore the<br />
multimetric BBI index meets the specification of the Annex V in the WFD. The BBI Index values<br />
are continuous and therefore useful for further analysis and interpretations in classification systems<br />
(Perus et al. 2007).<br />
The index compare observed BQI- and Shannon-Weaver (H´) values against highest recorded values<br />
within individual types (serving as reference values) and further deducts the value for stations<br />
showing low biodiversity or abundance. A value of zero (0) indicates conditions without any benthic<br />
macroinvertebrates (azoic) and value one (1) indicate unpolluted bottom conditions.<br />
The multimetric BBI-index includes relative abundance ( %) of sensitive or tolerant species. The<br />
list of the species sensitivity or tolerance is same as used for the Swedish BQI-index (Rosenberg et<br />
al. 2004; Blomqvist et al. 2007). The evaluation of sensitivity and tolerance of each species is based<br />
on literature information (Anger 1975, 1977; Borja et al. 2000; Helawell 1986; Järvekülg 1970;<br />
Landner et al. 1977; Leppäkoski 1975; Mandaville 2002; Wiederholm 1973) and expert judgment.<br />
The levels of sensitivity/tolerance are:<br />
22<br />
1 – Very tolerant to pollution<br />
5 – Tolerant<br />
10 – Pollution sensitive<br />
15 – Very pollution sensitive<br />
The BBI is calculated as following:<br />
where, BQI is the Swedish Biological Quality Index (Rosenberg et al. 2004, Blomqvist et al.<br />
2007), H´ is the (log2-base) Shannon-Weaver diversity, AB is species abundance, and S the species<br />
richness. A detailed presentation of the BBI index and its application for the national Finnish<br />
classification and boundary setting is described in Perus et al. (2007).<br />
Sweden:<br />
The Benthic Quality Index (BQI) is based on the distribution of sensitive and tolerant species, the<br />
number of species and the number of individuals. The complete classification method is described<br />
by Blomqvist et al. (2007), and the original background paper presenting the characteristics and<br />
composition of the BQI is published by Rosenberg et al. (2004).
The distribution between sensitive and tolerant species comprises the base of the BQI index. This<br />
value generally varies between 1 and 15. Low values indicate high proportion of tolerant species<br />
and high values indicate high proportion of sensitive species. The factor enumerating the number<br />
of species will increase the index value when there are more than 9 species per sample and will<br />
decrease the index value when there are less than 9 species per sample. The factor enumerating<br />
the number of individuals has been derived in order to handle situations when there are only a few<br />
individuals per sample. In a few instances, these individuals may represent sensitive species, and<br />
thus produce an unjustifiably high index value. When fewer than about 20 individuals are present in<br />
a sample (0.1 m 2 ), the index is significantly depressed by this factor.<br />
where, S is the number of taxa, S classified is the number of taxa having a sensitivity value, N i is the<br />
number of individuals of taxon I, N totalclassified is the total number of individuals of taxa having a<br />
sensitivity value, N total is the total number of individuals per 0.1 m 2 and the Sensitivityvalue i is the<br />
sensitivity value for taxa i.<br />
The Baltic Sea coastal fauna is already under physiological stress due to low salinity. The fauna was<br />
classified based on national expert knowledge and literature information. Each macroinvertebrate<br />
species was given a value of 1, 5, 10 or 15 depending on its’ sensitivity for anthropogenic<br />
disturbance. A high value indicates high sensitivity for disturbance and a low value high tolerance<br />
against disturbance. The major pressure in the Swedish coastal waters is excess nutrient loading<br />
leading to eutrophication and resulting in increased organic load to the seafloor and decreased<br />
oxygen content in the sediments and deep water. This classification of different species into<br />
sensitive and non-sensitive species is shared between Finland and Sweden. The Sensitivity values<br />
for different taxa are presented in an Excel-file at:<br />
http://www.naturvardsverket.se/sv/Arbete-med-naturvard/Vattenforvaltning/Handbok-20074/<br />
Since benthic invertebrates display large natural spatial variation, we chose to base the estimate for<br />
determining status using the entire water body, instead of basing it on individual sample results. For<br />
this estimate, we chose to follow the precautionary principle and used the 20th percentile instead of<br />
the median of the BQI values from a water body, when comparing with class boundaries per water<br />
body type. The 20th-percentile was calculated using a special method based on 9,999 randomly<br />
selected mean values from the existing index values in a water body. Naturally, the status estimate<br />
becomes more robust the greater the number of sampling stations in a water body. As a rule of<br />
thumb we recommend five or more sampling stations per water body.<br />
A complete classification requires the following calculations in order to derive a value for a water<br />
body in order to compare with the class boundaries for the type of that water body:<br />
1. Calculate the BQI based on species and abundance information from each individual sample<br />
2. Calculate the mean BQI for each station<br />
3. Calculate the 20th-percentile using randomization based on the mean BQI values from<br />
all stations<br />
4.<br />
Compare the value for the 20th percentile with the class boundaries<br />
23
2.1.3<br />
Finland:<br />
24<br />
Reference criteria and class boundary setting<br />
Reference conditions and boundary setting<br />
Areas not influenced by human activities are regarded not to be present in the Baltic Sea today.<br />
Historic reference data is almost completely lacking from Finnish coastal areas and use of old data<br />
is therefore not an option in determining reference conditions. Number of stations for the Baltic<br />
common <strong>intercalibration</strong> types B0, B2, B3a, and B3b in Finland are presented in Table 2.1.3.<br />
Bulk of the benthic macroinvertebrate data in the national database are sampled between 1990<br />
and present. In order to determine reference conditions, a method that is used in lakes and running<br />
waters (Vuori et al. 2006) was modified to be applicable for the coastal waters.<br />
Bäck et al. (2006) concludes on the Finnish coastal zoobenthos monitoring that “Long-term<br />
zoobenthos monitoring has been carried out only in one area with two depth zones since 1964, with<br />
few observations from the 1920s (Kangas et al. 2001). The zoobenthos monitoring is a part of the<br />
HELCOM monitoring for the assessment of the state of the Baltic Sea. In addition to the national<br />
monitoring, there is some regional zoobenthos monitoring carried out along the Finnish coast.<br />
However, all available benthic invertebrate (or zoobenthos) data for setting the WFD reference<br />
conditions and good-moderate boundary is gathered from the pollution control monitoring system,<br />
which covers all the essential Finnish coastal areas impacted by nutrient loading with several<br />
hundreds sampling stations near the sites that are recipients for the loading.”<br />
Baltic Sea common <strong>intercalibration</strong> types B0, B2, B3a, and B3b are spatially larger than the<br />
Finnish national coastal type areas. The environmental conditions (e.g. hydromorphological and<br />
topographic) characteristics of these large <strong>intercalibration</strong> types vary considerably within respective<br />
types and in order to produce more reliable analysis types were subdivided into smaller subtypes. In<br />
the macroinvertebrate analyses a depth separation of the water column (0 to 10 m and deeper than<br />
10 m) was used in relating the ecological meaningfulness on macroinvertebrate communities to the<br />
typology. This was done to improve the interpretation of environmental status in individual types<br />
(Perus et al. 2004).<br />
The Finnish Brackish water Benthic Index (BBI) incorporates all parameters required in Annex V of<br />
the WFD. The index takes into account relative abundance of sensitive/tolerant species, abundance<br />
and biodiversity (Shannon-Wiener and Species Richness) and can thus identify data of different<br />
ecological status.<br />
The determination of the reference conditions for the BBI was carried out as following:<br />
1) The median of the 10 % highest BBI-values were chosen to represent reference conditions for<br />
each type and depth interval.<br />
2) The EQR was calculated by dividing Observed values with the Reference values<br />
3) The value for the high-good ecological status boundary is set at the 10 %-percentile of<br />
reference EQR-values. Values below this boundary are divided into 5 equal classes Good 2/5,<br />
Moderate 1/5, Poor 1/5 and Bad 1/5) to represent classes below high ecological status.<br />
Boundary values were further validated by checking species richness, abundance, diversity values<br />
and community composition of tolerant/sensitive species. The species tolerance or sensitivity was<br />
determined according to species classification list made for the Swedish BQI-index in the Baltic<br />
Sea, which was also used for the Finnish BBI (Perus et al. 2007). Definition criteria for high, good,<br />
and moderate status in the coastal waters were following description in Annex V of the <strong>Directive</strong>.
Table 2.1.3: The classification boundary values for the Finnish Brackish <strong>Water</strong> Benthic Index (BBI). Lower boundary<br />
values for High (H), Good (G), Moderate (M) and Poor (P) status as BBI- and EQR values. Number of stations (Stations)<br />
and reference stations (Ref.) visited. These are the final boundary values adjusted after <strong>intercalibration</strong> with Sweden.<br />
# # BBI-EQR BBI-values<br />
Type Depth Stations Ref. H G M P B H G M P B<br />
B 3<br />
Middle<br />
B 3<br />
Outer<br />
B 2<br />
Inner<br />
B 2<br />
Outer<br />
B 0<br />
Outer<br />
0-10 52 5 0,93 0,56 0,37 0,19 ,70 0,42 0,28 0,14
oundary (BBI value 0.43 from Table 3). The species sensitivity groups 5 and 1 should be dominant<br />
or sub-dominant below the Good-Moderate boundary (Fig. 1). Additionally, diversity was higher<br />
above Good-Moderate boundary than below.<br />
Sweden:<br />
Class boundary setting procedure and reference criteria<br />
It was not possible to describe reference conditions using spatial approach or historical data,<br />
since there are no unaffected areas in the Baltic nowadays. Also historical data was not collected<br />
using comparative methodology as today. Instead the best available data from areas without local<br />
discharges were used as a proxy for reference conditions in the boundary setting. Data from these<br />
regions was assumed represent at least good ecological status.<br />
In deriving the type-specific class boundaries, the greatest emphasis was placed on the good–<br />
moderate boundary. This boundary was primarily determined using data from high–good areas.<br />
Comparative data was chosen for each national type from regions lacking local discharges; in<br />
practice from areas with the highest mean BQI values existing for that type. Sequential tests<br />
identifying the level of BQI (20 th percentile) where a water body significantly differs from the<br />
comparison material were made to assist in the setting of good-moderate boundary. In those types<br />
where the amount of data was insufficient, expert assessments were conducted based on existing<br />
data and data from nearby types with similar properties.<br />
Once the good–moderate boundary was determined, it was deemed acceptable to consider the area<br />
from the good–moderate boundary up to the highest observed index value in the existing type as<br />
mainly constituting a status of good. Two-thirds (2/3) of the span exceeding the good–moderate<br />
boundary was assigned a status of good, while the upper third was reserved for the status of high<br />
(Fig. 2.1.2). The area below the good–moderate boundary was divided into three equal intervals for<br />
the remaining boundaries.<br />
For calculation of EQR we have used the 20 th percentile of BQI in a water body divided by the<br />
highest observed BQI-value in a type.<br />
The low salinity in the Baltic put a big natural stress on the fauna resulting in low number of taxa.<br />
For this reason one can not expect a perfect fit to the normative definition.<br />
More details on this approach are available in Blomqvist et al. (2007).<br />
2.1.4 Results of the comparison<br />
Three steps were carried out in the <strong>intercalibration</strong> exercise: 1) comparison of species sensitivity<br />
classifications between the methods, 2) comparison of index values when applied for different<br />
coastal types, and 3) comparison of ecological status classifications on water body level.<br />
Comparisons between Swedish and Finnish methods<br />
Due to differences in monitoring and assessment methods 17 , two separate comparisons were made.<br />
Firstly, the comparison of the Finnish BBI and Swedish BQI macroinvertebrate classification<br />
systems was made by applying both assessment tools using Swedish monitoring data. Secondly,<br />
both methods were applied to Finnish monitoring data.<br />
17 In Sweden macroinvertebrate monitoring is carried out using 0.1 m 2 van Veen grab and 1 mm sieve, while in Finland<br />
0.025 m 2 Ekman grab and 0.5 mm sieve are used. The Swedish BQI index values are calculated separately for each grab<br />
while the Finnish BBI values are calculated for five (5) pooled grab samples.<br />
26
% abundance<br />
100<br />
80<br />
60<br />
40<br />
20<br />
0<br />
Comparison based on Swedish data<br />
Sensitivity class 1<br />
Sensitivity class 5<br />
National type 8<br />
Sensitivity class 10<br />
Sensitivity class 15<br />
0 2 4 6 8 10 12 14<br />
BQI<br />
Figure 2.1.2: Distribution of the relative abundance of the four macroinvertebrate sensitivity<br />
groups as a function of the BQI values. Group 15 is the most sensitive and group 1 the most<br />
tolerant group of species. Good-moderate boundary is indicated with a green and the High-good<br />
boundary with a blue vertical line.<br />
The first comparison of the two national methods was carried out by Sweden using Swedish national<br />
and regional monitoring data from the Gulf of Bothnia. The data included in this exercise comes<br />
from the national types No. 16 (Coastal waters of South Bothnian Sea, inner parts), 18 (Coastal<br />
waters of North Bothnian Sea, Höga kusten, inner parts), 20 (Coastal waters of the Quark, inner<br />
parts) and 22 (Coastal waters of North Bothnian Bay, inner parts). Only data deeper than 5 m were<br />
used from these types. Due to methodological differences between Sweden and Finland, it was not<br />
possible to apply the Finnish national boundaries on Swedish data. The <strong>intercalibration</strong> is based on<br />
applying the Finnish method for setting of boundaries on Swedish data and comparing this with the<br />
Swedish boundaries derived on the same Swedish data.<br />
The <strong>intercalibration</strong> exercise was carried out in two steps: 1) Comparison of index values in<br />
different environments, and 2) Comparison of classification status on water body level using both<br />
BBI and BQI methods.<br />
1. Comparison of index values<br />
In the first step the Swedish BQI and The Finnish BBI indices were calculated for each grab sample<br />
(~0.1 m 2 ) separately and the results where plotted against each other (Fig. 2.1.3). The Swedish BQI<br />
and the Finnish BBI indices were relatively well correlated, but the scatter increased in the two<br />
northern types (types 20 and 22).<br />
27
BBI<br />
BBI<br />
2. Comparison of classification status on water body level<br />
The classification status of water bodies was calculated applying both BBI and BQI on Swedish<br />
monitoring data. The boundary setting was done following both Finnish and the Swedish<br />
approaches for identifying reference status and the boundary setting principles for each station and<br />
year separately.<br />
The comparison was made using time series data from seven water bodies from the Swedish<br />
national types 16, 18, 20 and 22. The Swedish method states that at least five stations per year<br />
should be present in a water body for an assessment to be made (Blomqvist et al 2007). This rule has<br />
been applied to both assessment methods. Both the Swedish and Finnish methods (Jens Perus, pers.<br />
comm. March 2007) use the 20 th percentile for water body assessment. The results of comparison of<br />
the two methods are shown in (Fig. 2.1.4).<br />
28<br />
0,8<br />
0,7<br />
0,6<br />
0,5<br />
0,4<br />
0,3<br />
0,2<br />
0,1<br />
Typology 16 Typology 18<br />
0,8<br />
0,0<br />
0 2 4 6 8 10 12 14<br />
BQI<br />
0,8<br />
0,7<br />
0,6<br />
0,5<br />
0,4<br />
0,3<br />
0,2<br />
0,1<br />
BBI<br />
0,0<br />
0 2 4 6 8 10 12 14<br />
BQI<br />
Typology 20 Typology 22<br />
0,8<br />
0,0<br />
0 2 4 6 8 10 12 14<br />
BQI<br />
BBI<br />
0,7<br />
0,6<br />
0,5<br />
0,4<br />
0,3<br />
0,2<br />
0,1<br />
0,7<br />
0,6<br />
0,5<br />
0,4<br />
0,3<br />
0,2<br />
0,1<br />
0,0<br />
0 2 4 6 8 10 12 14<br />
BQI<br />
Figure 2.1.3: Correlation between the BQI and BBI using Swedish national and regional monitoring data from the<br />
types 16, 18, 20 and 22 (inner coastal waters, south to north, corresponding to common <strong>intercalibration</strong> types B3, B2<br />
and B0, respectively).
Swedish National type 16<br />
Swedish National type 16<br />
BQI<br />
14,0<br />
12,0<br />
10,0<br />
8,0<br />
6,0<br />
4,0<br />
2,0<br />
Edeboviken<br />
0,0<br />
1981 1986 1991 1996 2001 2006<br />
Swedish National type 18<br />
Swedish National type 18<br />
BQI<br />
BQI<br />
BQI<br />
12,0<br />
10,0<br />
8,0<br />
6,0<br />
4,0<br />
2,0<br />
Svartviksfjärden<br />
0,0<br />
1984 1989 1994 1999<br />
12,0<br />
10,0<br />
8,0<br />
6,0<br />
4,0<br />
2,0<br />
Gaviksfjärden<br />
0,0<br />
1993 1998 2003<br />
12,0<br />
10,0<br />
8,0<br />
6,0<br />
4,0<br />
2,0<br />
Husumbukten<br />
0,0<br />
1983 1985 1987 1989 1991<br />
BBI<br />
BBI<br />
BBI<br />
BBI<br />
0,6<br />
0,5<br />
0,4<br />
0,3<br />
0,2<br />
0,1<br />
Edeboviken<br />
0,0<br />
1981 1986 1991 1996 2001 2006<br />
0,6<br />
0,5<br />
0,4<br />
0,3<br />
0,2<br />
0,1<br />
Svartviksfjärden<br />
0,0<br />
1984 1989 1994 1999<br />
0,6<br />
0,5<br />
0,4<br />
0,3<br />
0,2<br />
0,1<br />
Gaviksfjärden<br />
0,0<br />
1993 1998 2003<br />
0,6<br />
0,5<br />
0,4<br />
0,3<br />
0,2<br />
0,1<br />
Husumbukten<br />
0,0<br />
1993 1998 2003<br />
29
Swedish National type 20<br />
Swedish National type 20<br />
BQI<br />
In most cases the two methods show the same general pattern for the water body assessments. In<br />
some years there are differences in the two assessment methods, e.g. the collapse of the dominating<br />
Monoporeia affinis in Kinnbäcksfjärden year 2004 and Örefjärden year 2000 is more clearly<br />
detected by the Swedish assessment method.<br />
30<br />
12,0<br />
10,0<br />
8,0<br />
6,0<br />
4,0<br />
2,0<br />
Örefjärden<br />
0,0<br />
1982 1987 1992 1997 2002<br />
Swedish National type type 22 22<br />
BQI<br />
BQI<br />
12,0<br />
10,0<br />
8,0<br />
6,0<br />
4,0<br />
2,0<br />
Kinnbäcksfjärden<br />
0,0<br />
1994 1999 2004<br />
12,0<br />
10,0<br />
8,0<br />
6,0<br />
4,0<br />
2,0<br />
Bergöfjärden<br />
BBI<br />
BBI<br />
0,6<br />
0,5<br />
0,4<br />
0,3<br />
0,2<br />
0,1<br />
Örefjärden<br />
0,0<br />
1982 1987 1992 1997 2002<br />
0,7<br />
0,6<br />
0,5<br />
0,4<br />
0,3<br />
0,2<br />
0,1<br />
Kinnbäcksfjärden<br />
0,0<br />
1994 1999 2004<br />
Bergöfjärden<br />
0,0<br />
0,0<br />
1994 1999 2004<br />
1994 1999 2004<br />
Figure 2.1.4: Comparisons of the water body assessments using Swedish (BQI; left column) and Finnish (BBI; right<br />
column) macroinvertebrate methods applied to Swedish monitoring data from the national Swedish types No. 16<br />
(Coastal waters of South Bothnian Sea, inner parts), 18 (Coastal waters of North Bothnian Sea, Höga kusten, inner<br />
parts), 20 (Coastal waters of the Quark, inner parts) and 22 (Coastal waters of North Bothnian Bay, inner parts). Error<br />
bars denotes 20th and 80th percentile. Note that the 20th percentile (lower error bar) is used to determine the calssification<br />
status. Boundaries hose are from March 2007 (Jens Perus, pers. comm. and Blomqvist et al. 2007).<br />
BBI<br />
0,7<br />
0,6<br />
0,5<br />
0,4<br />
0,3<br />
0,2<br />
0,1
Comparison based on Finnish data<br />
The other comparison of the Finnish BBI and Swedish BQI macrozoobenthos assessment methods<br />
was done by using Finnish national and regional monitoring data from the Baltic Sea. Data used in<br />
the comparison was representative for the four national Finnish water body types (Table 2.1.4). Only<br />
data from below 10 m depth was included in the exercise. The national Finnish typology separates<br />
coastal types into two depth zones: above 10 m and below 10 m depth intervals. The national<br />
boundaries are set separately for different depth intervals within the same type.<br />
Table 2.1.4: Correspondence of the common <strong>intercalibration</strong> types for the Northern Baltic Sea with the Finnish<br />
national types (all deeper than 10 m; Perus et al. 2004) and Swedish national types (NFS 2006:11) included in the<br />
<strong>intercalibration</strong> exercise. All the common types were characterized to be deeper than 10 m.<br />
Intercalibration type Finnish type Swedish type<br />
B0 Mu 20<br />
B2 SeS 16<br />
B3a Lv 12<br />
B3b Lu 14<br />
The Finnish BBI and Swedish BQI assessment systems were compared by setting the boundaries<br />
for the Finnish water bodies belonging to the <strong>intercalibration</strong> types B0, B2 and B3 and using the<br />
Swedish assessment method. The Swedish calculation method cannot be applied directly on Finnish<br />
data due to methodological differences 18 . However, this problem was overcome using the boundary<br />
setting principle of the Swedish method (pers. comm. Mats Blomqvist, Hafok AB). According to<br />
this approach 80 % (20 th percentile) of the natural variation within a data set, originating from an<br />
area without local discharges, can be regarded as high or good status i.e. thus being above the goodmoderate<br />
boundary. This good-moderate boundary value was set for each of the four <strong>intercalibration</strong><br />
types (Fig. 2.1.5).<br />
A common species sensitivity classification list is used for both indices and no comparison of<br />
differences in species sensitivity classification is thus needed.<br />
After comparison of the Finnish-Swedish classification results, a change in the Finnish boundaries<br />
was proposed. The original Finnish classification boundaries for the classes Good-Moderate-Poor-<br />
Bad were set as four equally sized classes beneath the High-Good boundary. The proposal is that<br />
the boundary for High-Good remains the same, but that the remaining BBI-index spectra should be<br />
divided in to five equally sized classes out of which the Good status class should occupy two fifths<br />
(2/5) and classes Moderate, Poor and Bad one fifth each (1/5). A new specification on the Finnish<br />
assessment of status is that the use of the 20 th percentile value as assessment value would be taken<br />
into practice (identical to Swedish practice).<br />
18 In Finland 5 pooled (mean of abundances (ind/m -2 ) samples taken by Ekman-Birge grab samples (0.5mm mesh)<br />
are required and total species richness needs to be determined while in Sweden individual (0,1 m 2 ) Van-Veen grab samples<br />
(1mm mesh) are required to be taken. Also the Swedish method requires at least five stations per year for assessment<br />
31
BBI<br />
BBI<br />
BBI<br />
BBI<br />
BBI<br />
32<br />
1<br />
0,8<br />
0,6<br />
0,4<br />
0,2<br />
0<br />
0,8<br />
0,6<br />
0,4<br />
0,2<br />
1<br />
0,8<br />
0,6<br />
0,4<br />
0,2<br />
0<br />
1<br />
0,8<br />
0,6<br />
0,4<br />
0,2<br />
1<br />
0<br />
1<br />
0,8<br />
0,6<br />
0,4<br />
0,2<br />
0<br />
0<br />
Rönnskär (B0 outer 10+m)<br />
1994 1995 1996 1997 1999 2000 All data<br />
Replotfjärden (B0 outer 10+m)<br />
1994 1995 1996 1997 All data<br />
B2 inner (10+m)<br />
1990 1994 1995 1996 1997 1998 All data<br />
B3 middle 10+ (Da10+m)<br />
1991 1994 1995 1996 1997 1998 1999 All data<br />
Kasnas East (B3 middle 10+)<br />
1991 1994 1995 1996 1997 1998 1999 2000 All data<br />
BQI(2006)<br />
BQI(2006)<br />
BQI(2006)<br />
BQI(2006)<br />
BQI(2006)<br />
15<br />
12<br />
9<br />
6<br />
3<br />
0<br />
15<br />
12<br />
9<br />
6<br />
3<br />
0<br />
6<br />
5<br />
4<br />
3<br />
2<br />
1<br />
0<br />
16<br />
14<br />
12<br />
10<br />
8<br />
6<br />
4<br />
2<br />
0<br />
16<br />
14<br />
12<br />
10<br />
8<br />
6<br />
4<br />
2<br />
0<br />
Rönnskär (B0 outer 10+m)<br />
1994 1995 1996 1997 1999 2000 All data<br />
Replotfjärden (B0 outer 10+m)<br />
1994 1995 1996 1997 All data<br />
B2 inner (10+m)<br />
1990 1994 1995 1996 1997 1998 All data<br />
B3 middle 10+ (Da10+m)<br />
1991 1994 1995 1996 1997 1998 1999 All data<br />
Kasnas East (B3 middle 10+)<br />
1991 1994 1995 1996 1997 1998 1999 2000 All data
BBI<br />
BBI<br />
1<br />
0,8<br />
0,6<br />
0,4<br />
0,2<br />
0<br />
1<br />
0,8<br />
0,6<br />
0,4<br />
0,2<br />
0<br />
Kustavi straits (B3 middle 10+)<br />
1995 1998 All data<br />
B3 (outer, 10+m)<br />
1991 1993 1995 1997 All data<br />
Kustavi straits (B3 middle 10+m)<br />
Table 2.1.5: The intercalibrated Finnish and Swedish EQR-values for the high-good (HG) and good-moderate (GM)<br />
boundaries calculated for the national coastal types representative for the common <strong>intercalibration</strong> types B0, B2 B3a,<br />
and 3b.<br />
Type Country National type EQR HG EQR GM<br />
B0 Finland Mu 10+m 0,99 0,59<br />
Sweden 20 0.77 0.31<br />
B2 Finland Ses 10+m 0,95 0,57<br />
Sweden 16 0.76 0.29<br />
B3a Finland Lv 10+m 0,89 0,53<br />
Sweden 12 0.76 0.29<br />
B3b Finland Lu 10+m 0,90 0,54<br />
BQI(2006)<br />
BQI(2006)<br />
Sweden 14 0.76 0.29<br />
16<br />
14<br />
12<br />
10<br />
8<br />
6<br />
4<br />
2<br />
0<br />
16<br />
14<br />
12<br />
10<br />
8<br />
6<br />
4<br />
2<br />
0<br />
1995 1998 All data<br />
B3 (outer, 10+m)<br />
1991 1993 1995 1997 All data<br />
Figure 2.1.5: Comparisons of the water body assessments using Swedish (BQI; left column) and Finnish (BBI; right<br />
column) macroinvertebrate methods applied to national Finnish monitoring data from water bodies belonging to common<br />
<strong>intercalibration</strong> types B0, B2, B3a (B3 middle, Kasnäs East, Kustavi Straits) and B3b (B3 outer, WB Jussarö at the<br />
entrance of the Gulf of Finland (GOF), WB Rosala-Hitis). Error bars denotes 20 th and 80 th percentile. Note that the 20 th<br />
percentile (lower error bar) is used to determine the classification status. Detailed results are presented in Annex 2.1.<br />
33
2.1.5<br />
34<br />
Results of the harmonization – Boundary EQR values<br />
Biological Quality Element Benthic invertebrate fauna<br />
Results: Ecological quality ratios of the national classification systems intercalibrated<br />
Type and country<br />
CW B0<br />
Finland<br />
Sweden<br />
CW B2<br />
Finland<br />
Sweden<br />
CW B3 a<br />
Finland<br />
Sweden<br />
CW B3 b<br />
Finland<br />
Sweden<br />
2.1.6<br />
National classification<br />
system intercalibrated<br />
BBI- Finnish Brackish<br />
water Benthic Index<br />
BQI–Swedish multimetric<br />
biological quality index<br />
(soft sediment infauna)<br />
BBI- Finnish Brackish<br />
water Benthic Index<br />
BQI–Swedish multimetric<br />
biological quality index<br />
(soft sediment infauna)<br />
BBI- Finnish Brackish<br />
water Benthic Index<br />
BQI–Swedish multimetric<br />
biological quality index<br />
(soft sediment infauna)<br />
BBI- Finnish Brackish<br />
water Benthic Index<br />
BQI–Swedish multimetric<br />
biological quality index<br />
(soft sediment infauna)<br />
Open issues and need for further work<br />
Ecological Quality Ratios<br />
High-Good boundary Good-Moderate boundary<br />
0.99 0.59<br />
0.77 0.31<br />
0.95 0.57<br />
0.76 0.29<br />
0.89 0.53<br />
0.76 0.29<br />
0.90 0.54<br />
0.76 0.29<br />
Intercalibration need to be extended to cover all Baltic Sea countries and all common types.<br />
Currently results are completed at quality element level only for two countries (FI, SE) covering<br />
three (3) common types in the Northern Baltic Sea (Bothnian Sea and Bothnian Bay).<br />
Denmark, Sweden, and Germany carried out <strong>intercalibration</strong> of their national methods for the<br />
common type B12. However, at this stage comparability was not sufficiently demonstrated, and the<br />
results are not included in the final <strong>intercalibration</strong> decision. New comparisons have to be carried<br />
out when more monitoring data will be available for common <strong>intercalibration</strong> types in the Southern<br />
Baltic Sea.
Other countries still need to develop and intercalibrate WFD compliant assessment methods for<br />
benthic invertebrates for the Baltic coastal waters.<br />
Currently most national methods have been developed for the soft bottom sediment habitats only,<br />
with the exception the German method that is a multi-habitat method. Assessment methods for other<br />
coastal habitats (sandy and rocky bottoms. littoral zone) have to be developed. methods for the<br />
transitional water types in the Baltic have to be developed.<br />
2.2<br />
2.2.1<br />
Typology<br />
Black Sea GIG<br />
Intercalibration approach<br />
The countries participating at this <strong>intercalibration</strong> exercise into the Black Sea region are Bulgaria<br />
and Romania. One common water body type CW-BL 1 was defined, as is shown below:<br />
Salinity: Mesohaline<br />
Tidal Range: Microtidal<br />
Depth: Shallow<br />
Subsratum: Mixed<br />
Wave Exposure: Moderately Exposed<br />
2.2.2 National methods that were intercalibrated<br />
Boundaries were agreed in this <strong>intercalibration</strong> exercise for the Shannon diversity index H’, AMBI,<br />
M-AMBI, applicable to both Bulgaria and Romania.<br />
2.2.3<br />
Reference conditions and class boundary setting<br />
As Option 3 has been selected, both countries have used the same methods for sampling, laboratorial<br />
analyses, reference conditions and EQRs. Those were derived using literature, historical data and<br />
expert judgment.<br />
The criteria for establishment of biological reference conditions and the boundary setting procedure<br />
are described below separately for each country.<br />
2.2.4<br />
Results of the comparison<br />
The method of sampling and analytical methods are as provided by the Manual “Quantitative<br />
sampling and sample treatment of marine soft bottom – macrozoobentos” (Tsenka Konsulova,<br />
Valentina Todorova – 2005), agreed by the Black Sea Commission. The species names used in the<br />
process of AMBI calculation should be in accordance with the valid names from the same manual.<br />
The macroinvertebrates experts, from both countries, agreed to use three indices to assess the<br />
ecological status of the selected common type: Shannon Diversity Index H’, AMBI and M-AMBI.<br />
Both countries agreed to use “one out all out principle” to establish the ecological status.<br />
35
BULGARIA<br />
Reference conditions and EQR values were developed for Benthic invertebrate fauna in Bulgarian<br />
waters by the following scientists from the Marine Biology and Ecology Department; INSTITUTE<br />
OF OCEANOLOGY, BAS, Varna:<br />
36<br />
Assoc. Researcher Antoaneta Trayanova;<br />
Dr. Assoc. Researcher Valentina Todorova;<br />
Dr. Assoc. Professor Tsenka Konsulova;<br />
For the Bulgarian Black Sea coastal waters, no reliable data of the “pristine” period (before the<br />
1970s) collected with the same methodology as we use today, exist. Use of historical data is<br />
therefore not an option in determining reference conditions. Another approach is screening for unimpacted<br />
areas, i.e. communities not affected by human activities. Unaffected areas are regarded<br />
as absent in the Bulgarian Black Sea coastal waters nowadays. The remaining option to establish<br />
condition comparable to a reference is to derive it from areas as unaffected by human activities<br />
as possible using the data of slightly disturbed benthic communities (having at least good status).<br />
An expert judgment and knowledge of the conditions under evaluation were applied in obtaining of<br />
“virtual” reference conditions.<br />
The study area covers the one nautical mile zone along the entire Bulgarian Black Sea coast.<br />
Nineteen sites have been sampled for macrozoobenthos in the period 2002-2006 (Figure 2.2.1).<br />
Figure 2.2.1: Monitoring sampling<br />
network of the Bulgarian Black<br />
Sea coastal waters (used for<br />
<strong>intercalibration</strong> exercise)
Table 2.2.1: Number of samples per station by sampling years, months and totally.<br />
Station (1nm) / Sampling<br />
year and month<br />
2002 2003 2004 2005 2006 Number<br />
of<br />
8 11 3 6 6 9 3 6 9 11 7<br />
samples<br />
per<br />
station<br />
10 (100) Krapetz 1 1 1 1 1 1 1 1 1 1 10<br />
20 Shabla 1 1<br />
30 Tjulenovo 1 1<br />
40 (111) Rusalka Resort 1 1 1 1 1 1 1 7<br />
200 Kaliakra<br />
(in front of the cape)<br />
1 1 1 1 4<br />
50 (211) Kaliakra<br />
(under the cape)<br />
1 1 1 1 1 1 1 7<br />
60 Albena Resort 1 1<br />
70 (B3) Varna Bay 1 1 1 1 1 5<br />
80 (301) cape Galata 2 2 1 1 1 1 1 1 1 1 1 13<br />
90 Kamchia River 1 1<br />
100 Dvoinitsa River 1 1<br />
411 Irakli 1 1 1 1 4<br />
110 (500) Slanchev Briag 3 1 1 2 2 1 1 1 1 1 1 15<br />
120 Burgas Bay 1 1<br />
130 (501) Burgas 1 1 1 1 1 1 1 1 1 1 1 11<br />
140 - Sozopol 1 1<br />
150 (600) Achtopol 1 1 1 1 1 1 1 1 8<br />
160 - Varvara 1 1<br />
170 (611) Veleka River 1 1 1 3<br />
Total number of samples 9 7 4 7 7 7 8 10 10 9 17 95<br />
a. Shannon diversity index H’<br />
Although the identification of reference and bad status values rely on expert assessment the limited<br />
number of samples and/or replicates results in high degree of uncertainty.<br />
When deriving the type-specific class boundaries, the greatest emphasis was placed on the good–<br />
moderate boundary. This boundary was primarily determined with the aid of data from high–good<br />
areas.<br />
The approach in identifying reference conditions is based on the hypothesis that the high ecological<br />
status represents certain percentage of the good status.<br />
The reference value for water bodies with sandy and mixed sediments is derived with the<br />
assumption that the average community diversity index of stations reaching good ecological status<br />
constitutes 75 % from the high status. The reference value for water bodies with muddy sediments<br />
have been determined from the average community diversity index of stations reaching good status<br />
and having more than 25 species per sample, than the reference value is extrapolated from current<br />
status deemed as 70 % from reference. The percentage is lower due to the specificity of the muddy<br />
sediments characterized by higher sensitivity of the developing communities to environmental<br />
disturbances.<br />
37
The boundaries between the ecological classes are set as percentage from average reference values.<br />
The interval of 0.2 between the ecological status boundaries is equally scaled (80 % for good,<br />
60 % for moderate, 40 % for poor and 20 % for bad status). For determination of EQRs each<br />
class boundary value has been divided by the average reference value – 3.6 for water bodies with<br />
muddy sediments and 4.5 for water bodies with sandy and mixed sediments (Table 2.2.2). The data<br />
available do not allow developing of separate classification schemes for water bodies with sandy<br />
and for water bodies with mixed sediments. It is highly recommended the boundary values to be<br />
readjusted after new data are available as well classification scale for water bodies with mixed<br />
sediments to be developed.<br />
Table 2.2.2. Classification scheme for Shannon community diversity index (H’).<br />
38<br />
<strong>Water</strong> bodies with muddy sediments<br />
Ecological status High Good Moderate Poor Bad<br />
H’ average 3.6 2.9 2.2 1.5 0.7<br />
Range H’ ≥ 3.3 3.3 > H’ ≥ 2.5 2.5 > H’ ≥ 1.8 1.8 > H’ ≥ 1.1 H’ < 1.1<br />
EQR ≥ 0.92 0.69 0.50 0.31 < 0.31<br />
<strong>Water</strong> bodies with sandy and mixed sediments<br />
Ecological status High Good Moderate Poor Bad<br />
H’ average 4.5 3.6 2.7 1.8 0.9<br />
Range H’ ≥ 4 4 > H’ ≥ 3.1 3.1 > H’ ≥ 2.2 2.2 > H’ ≥ 1.3 H’ < 1.3<br />
EQR ≥ 0.89 0.69 0.49 0.29 < 0.29<br />
b. A Marine Biotic Index (AMBI)<br />
The method is based on the assignment of species to five ecological groups, according to the<br />
sensitivity to an increasing stress gradient (Gray and Glemarec (1997):<br />
• Group I – species very sensitive to organic enrichment and present under unpolluted conditions<br />
(initial state). They include the specialist carnivores and some deposit feeding tubicolous<br />
polychaetes;<br />
• Group II – species indifferent to enrichment, always present in low densities with non-<br />
significant variations with time. These includes suspension feeders, less sensitive carnivores<br />
and scavengers;<br />
• Groups III – species tolerant to excess organic matter enrichment. These species may occur<br />
under normal conditions, but their populations are stimulated by organic enrichment. They are<br />
surface deposit – feeding species, as tubiculous spionids;<br />
• Group IV – Second order opportunistic species. Mainly small sized polychaetes; subsurface<br />
deposit feeders, such as cirratulids;<br />
• Group V – First order opportunistic species. These are deposit feeders, which proliferate in<br />
reduced sediments;<br />
The reference value (AMBI ≤ 1.2) is derived as dominance of sensitive and indifferent taxa in<br />
the abundance. The bad status value (AMBI > 5.5) is achieved when second order and first order<br />
opportunists dominate. The boundaries between the ecological classes are those identified by Borja<br />
et al., (2000, 2003) and Muxica et al., (2005). EQR is determined by subtraction of the boundary<br />
value divided by the maximal value 7 from 1 (Table 2.2.3). AMBI is not sediment dependant which<br />
allows to be applied for all WBT regardless of their typology
Table 2.2.3: Classification scheme for A Marine Biotic Index (AMBI).<br />
Ecological status High Good Moderate Poor Bad<br />
Range 0.2 < AMBI ≤ 1.2 1.2 < AMBI ≤ 3.3 3.3 < AMBI ≤ 4.3 4.3 < AMBI ≤ 5.5 5.5 < AMBI ≤ 7.0<br />
EQR ≥ 0.83 0.53 0.39 0.21 < 0.21<br />
c. Multivariate AMBI (M-AMBI)<br />
The default EQR boundaries of M-AMBI are set through <strong>intercalibration</strong> exercise for North Atlantic<br />
ecoregion (Borja et al., 2006). Because no proper <strong>intercalibration</strong> is carried out for the Black Sea<br />
ecoregion we adopted the default boundaries between the ecological classes. Further changes of<br />
these values for each WBT are advisable after <strong>intercalibration</strong> procedure and harmonisation of these<br />
boundaries between Member States took place. The default EQR boundaries of high and bad status<br />
have been accepted for all WBT<br />
Table 2.2.4. Classification scheme for Multivariate AMBI (M-AMBI).<br />
Ecological status High Good Moderate Poor Bad<br />
Range M-AMBI ≥ 0.85<br />
0.85 > M-AMBI<br />
≥ 0.55<br />
0.55 > M-AMBI<br />
≥ 0.39<br />
0.39 > M-AMBI<br />
≥ 0.20<br />
0.20 > M-AMBI<br />
EQR ≥ 0.85 0.55 0.39 0.20 < 0.20<br />
The hierarchical clustering of stations based on the Bray-Curtis similarities of log (x + 1)<br />
transformed abundance was employed to reveal the similarity pattern of macrozoobenthic<br />
community. Five main groups have been differentiated on the dendrogram corresponding to the type<br />
of the sediment (Figure 2.2.2). In some cases the WB typology differentiates from the sediment type<br />
defined by the clustering technique, which is indication of misclassification of sediments resulting<br />
in inaccurate water bodies’ typology.<br />
Because the sediment type determine the development of specific macrozoobenthic communities,<br />
it is reasonable the assignment of high and bad status values for the selected metrics to be done<br />
according to the cluster groupings.<br />
Figure 2.2.2: Dendrogram for<br />
hierarchical clustering (groupaverage<br />
linking) of WBT and<br />
stations.<br />
39
ROMANIA<br />
The study area covers the southern part of the Romanian Black Sea coast, from Singol Cape to<br />
Vama Veche (Fig.1). To assess the ecological status it was use the data from four sampling stations,<br />
during the period 2002-2006 (Table 2.2.4).<br />
Table 2.2.4 Sampling stations / Number of samples per station.<br />
Station/<br />
Sampling year<br />
and month<br />
40<br />
2002 2003 2004 2005 2006<br />
Number of<br />
samples /<br />
station<br />
May Aug May May Aug May Oct Apr<br />
Eforie - - - 1 1 1 1 1 5<br />
Costinesti 1 1 1 1 1 - 1 6<br />
Mangalia - - - 1 1 1 - 3<br />
Vama Veche 1 1 1 1 1 1 1 7<br />
Total number<br />
of samples<br />
2 2 2 1 4 4 3 3 21<br />
Figure.2.2.3: Monitoring sampling<br />
network of the Romanian Black<br />
Sea coastal waters (used for<br />
<strong>intercalibration</strong> exercise)
The sampling and analytical methods used were those provided in the manual Quantitative sampling<br />
and sample treatment of marine soft bottom – macrozoobentos” (Tsenka Konsulova, Valentina<br />
Todorova – 2005), approved by the Black Sea Commission.<br />
a. A Marine Biotic Index (AMBI)<br />
The AMBI was calculated using the data from the period 2002 – 2006. Results are shown in<br />
Table 2.2.5.<br />
Table 2.2.5: AMBI values for the Romanian sampling network.<br />
Sites Eforie South Costinesti Mangalia Vama Veche<br />
2002 - 4.12 3.06<br />
2003 - 3.85 3.25<br />
2004 3.04 4.17 2.96 2.89<br />
2005 3.12 3.13 3.01 2.14<br />
2006 3.31 2.86 1.58<br />
Average 3.2 3.6 3 2.6<br />
It was estimated that the general status was moderate (3.3
42<br />
Table 2.2.8: H/G and G/M boundaries for Shannon diversity index H.<br />
Ecological status H/G G/M<br />
Value 4 3<br />
EQR 0.8 0.6<br />
The evaluation was made processing the data from the period 2002-2006.<br />
2.2.5<br />
Results of the harmonisation – Boundary EQR values<br />
AMBI<br />
In was established that the AMBI should be calculated according to the “Guidelines for the use of<br />
AMBI (AZTI’s Marine Biotic Index) in the assessment of the benthic ecological quality”.<br />
The species names used with AMBI should be according to the valid names from the manual<br />
“Quantitative sampling and sample treatment of marine soft bottom – macrozoobentos” (Tsenka<br />
Konsulova, Valentina Todorova – 2005).<br />
In the assessment of the ecological status, both countries decided to use the boundaries defined by<br />
Borja (Table 2.2.9).<br />
Table 2.2.9: AMBI boundary values.<br />
Ecological status High Good H/G G/M<br />
Range AMBI 4 4> H’ > 3.1 4 3.1<br />
EQR ≥ 0.89 ≥ 0.69 0.89 0.69<br />
M-AMBI<br />
The process of evaluation of M-AMBI was made taking into consideration some values for high<br />
status and bad status for richness and diversity (required by the program), established by common<br />
agreement as being characteristic to the Black Sea common type.<br />
Table 2.2.11: M-AMBI boundary values.<br />
Ecological status High Good H/G G/M<br />
Range M-AMBI>0.85 0.85>M-AMBI>0.55 0.85 0.55<br />
EQR > 0.85 > 0.55 0.85 0.55
In the process of calculation, the reference and bad status values for Species richness (S), diversity<br />
(H’) and AMBI were:<br />
Table 2.2.12: Reference and bad status values for species richness, Shannon diversity, and AMBI.<br />
high bad<br />
Richness 50 15<br />
Shannon 4 1.3<br />
AMBI 1.2 5.5<br />
For macroinvertebrates, both countries agreed to use the “one out, all out” principle to establish the<br />
ecological status.<br />
2.2.6 Open issues and need for further work<br />
Refining of the typology of water bodies is needed after the sediment types are accurately classified.<br />
The determination of the reference values for the community diversity index (H’) was derived<br />
from actual data for good ecological status and based on expert judgement and knowledge. The<br />
limited number of stations and/or replicates in one nautical mile zone allowed partial application<br />
of statistical approaches and did not permit the development of classification scale for water bodies<br />
with mixed sediments. Revision of the boundary values is recommended after accumulation of<br />
further data.<br />
The default boundary values of M-AMBI have to be readjusted for each WBT after <strong>intercalibration</strong><br />
procedure for the whole Black Sea ecoregion takes place.<br />
2.3<br />
Mediterranean GIG<br />
2.3.1 Intercalibration approach<br />
Participation of countries in the Benthic Invertebrates subgroup:<br />
Cyprus<br />
France<br />
Greece<br />
Italy<br />
Slovenia<br />
Spain (Catalonia, Balearic Islands)<br />
TYPOLOGY<br />
In the Mediterranean 4 basic <strong>intercalibration</strong> types have been agreed. These are shown in table 2.3.1<br />
below:<br />
43
Table 2.3.1: Mediterranean coastal common <strong>intercalibration</strong> types.<br />
44<br />
Type Name of Type Substratum (1) Depth (2)<br />
CW - M1 Rocky shallow coast rocky shallow<br />
CW - M2 Rocky deep coast rocky deep<br />
CW - M3 Sedimentary shallow coast sedimentary shallow<br />
CW - M4 Sedimentary deep coast sedimentary deep<br />
(1) In many cases different seabed substrata will occur within one water body type. The dominant substratum should be<br />
defined.<br />
(2) Depth division is based on 40 m depth at 1 mile distance from the coastline.<br />
Benthic invertebrates experts defined that the four Mediterranean coastal IC types (see section 1<br />
General part), primarily defined on substratum composition and depth profile, are not relevant to the<br />
MED-GIG benthic invertebrates <strong>intercalibration</strong>.<br />
It is important to note that the intercalibrated methods in this phase are habitat specific (e.g soft<br />
bottom, hard bottom). All methods are for use in soft sediment habitats. Methods for other habitats<br />
are still under development and cannot be assessed at this stage.<br />
OPTION 3 (direct comparison of national methods) has been used.<br />
All pressures are considered but the methods are particularly sensitive to organic enrichment.<br />
2.3.2<br />
National methods that were intercalibrated<br />
Member State Method Status Boundary<br />
agreement<br />
Cyprus Bentix Finalized yes<br />
France Multimetric approach (AMBI, Shannon<br />
Diversity, BQI Trophic Index)<br />
Under development no<br />
Greece Bentix Finalized yes<br />
Italy AMBI, M-AMBI, Bentix Under development no<br />
Slovenia M-AMBI Finalized yes<br />
Spain - Catalonia MEDOCC Officially accepted yes<br />
Spain- Balearic is. MEDOCC Officially accepted yes<br />
2.3.3 Reference conditions and class boundary setting<br />
As option 3 has been selected for the <strong>intercalibration</strong> of this quality element each Member State has<br />
derived biological reference conditions and the boundaries according to their classification systems.<br />
The criteria for establishment of biological reference conditions and the boundary setting procedure<br />
are described below separately for each country.
GREECE and CYPRUS<br />
Reference conditions<br />
Species sensitivity<br />
General reference conditions are based on the normative definition, which states, “All the<br />
disturbance-sensitive taxa associated with undisturbed conditions should be present”.<br />
Reference sites from Greek data were defined, presenting reference conditions for biological element<br />
macroinvertebrates. The fauna is composed of mostly sensitive species (GI) and corresponding<br />
mean Bentix values are amongst the highest: Bentix>5. In these cases the composition of the fauna<br />
corresponds to sensitive species over 75 %. In special cases where muddy bottoms are encountered<br />
within a reference site Bentix values are expected to reach values over 4 and sensitive species<br />
percentage over 50 %.<br />
Species ecology<br />
Another aspect biological reference conditions setting is based on the autoecology of species.<br />
Each species is designated with an ecological identity as extracted from scientific literature, so it<br />
is possible to identify the species belonging to, or characterizing each type of community > habitat<br />
> water body, and thus to establish reference conditions on an ecological basis. Species reference<br />
lists are established for each kind of habitats-communities (Simboura & Zenetos, 2002) and the<br />
link among community-habitat-water body type is given (Simboura et al., 2005, Sete presentation,<br />
Simboura) following the EUNIS habitat classification scheme for European coasts.<br />
Diversity indices<br />
Other indices as the Shannon Diversity index and species Richness are expected to be among the<br />
highest according to the given type of habitat, in the sites under reference conditions. For example<br />
over a large set of data from Greek coastal areas and for a sample size of 0.1m2, Hmax=6.3<br />
and Smax=110 for mixed sediments, while for muds the respective values were Hmax=4,6<br />
and Smax=39. Generally for the above standard reference sample area and for mixed sediments<br />
H values in reference sites are expected to be over 5 and S over 80 and for muddy bottoms H<br />
over 4-4.5 and S over 30. However, discrepancies in the values of these indices may arise from<br />
sampling methodology differences and habitat particularities. Another point to be considered is<br />
that in transitional zones of disturbance (ecotone) Shannon diversity and species richness maybe<br />
significantly high leading to misinterpretation of reference conditions; so diversity values should be<br />
cross-checked with biotic indices.<br />
Boundary Setting<br />
The Bentix index (Simboura & Zenetos, 2002) is a newly developed biotic index based on the<br />
relative percentage of ‘sensitive’ (GS) and ‘tolerant’ (GT) species in the fauna weighted analogously<br />
to derive a single formula:<br />
Bentix = (6 X %GS + 2 X %GT)/100<br />
(http://www.hcmr.gr/english_site/services/env_aspects/bentix.html).<br />
The formula was initially developed as Bentix = [(6 X %GI + 2 X ( %GII + %GIII)]/100 where<br />
GI includes the sensitive and indifferent taxa, GII the tolerant and second order opportunistic and<br />
GIII the first order opportunistic taxa. As the multiplying factor 2 is the same for groups GII and<br />
GIII, these groups can be merged to simply represent all tolerant taxa (GT) versus all sensitive taxa<br />
(GS). The resulting classification scheme and Ecological Quality Ratio (EQR) which is the universal<br />
comparison scale for different metrics is given in table 2.3.2.<br />
45
The Bentix index was developed in the Mediterranean ecoregion where the benthic fauna is usually<br />
very diverse and evenly distributed with no one species naturally dominating over 10 %. Also under<br />
slight disturbance conditions there might be the situation where a high diversity of sensitive and<br />
opportunistic species may co-exist giving the impression of a high quality status. Given the naturally<br />
even distribution of the fauna, the groups are weighted equally in the Bentix formula taking into<br />
account simply only the ratio of the groups’ occurance in the fauna: the probability of one species<br />
randomly picked up from the fauna to belong to a “tolerant” over a “sensitive” group is 3:1. Also the<br />
indifferent group is counted with the sensitive. This approach combined with an equal scaling of the<br />
ranges of good and moderate classes (2.5-3.5, 3.5-4.5 respectively), results to successfully designate<br />
the community health in the Mediterranean benthic ecosystem where, naturally a high number of<br />
species are evenly distributed over the benthic population.<br />
Table 2.3.2: The Bentix index classification scheme and EQR.<br />
46<br />
EcoQS Bentix values EQR<br />
High 4.5 < Bentix < 6 >0.75-1<br />
Good 3.5 < Bentix < 4.5 >0.58-0.75<br />
Moderate 2.5 < Bentix < 3.5 >0.42-0.58<br />
Poor 2.0 < Bentix < 2.5 >0.33-0.42<br />
Bad 0 0<br />
* For naturally stressed muddy habitats only, boundary limits 4.5 and 3.5 are reduced to 4 and 3 respectively.<br />
** Also for comparison with the m-Ambi EQR, the EQR scale starts from value 2 corresponding with EQR=0, since<br />
the area among 0 and 2 is a non-value area (as for Ambi=6 the EQR=0).<br />
Class boundary values were set by checking community composition of tolerant/sensitive species<br />
over the Bentix values for Greek and Cyprus IC data. This ratio is selected as paired metrics to<br />
locate class boundaries.<br />
Figure 2.3.1 shows the plotting of the percentage of tolerant and sensitive taxa along the gradient of<br />
decreasing Bentix index. Within the range high to poor, changes in the percentage of sensitive and<br />
tolerant taxa are gradual and indicated by the smoothing lines.<br />
Based on this plot, it is evident that the cross-line point of the two lines corresponding to the value<br />
of Bentix=4, represents the class center of “good” where literally the two ecological groups of<br />
tolerant and sensitive share the fauna by 50 % each. This point corresponds with the ecotone point<br />
of the transitional zone, middle of good class.<br />
The points at equal distances (0.5) in each side of the crossline represent the high-good boundary<br />
limit with value 4.5, and at the other side of the center the boundary between good/moderate with<br />
value 3.5. The HG and GM boundaries and the center of good class are indicated by vertical lines.<br />
At the high to good class boundary (Bentix=4.5), the percentage of the sensitive taxa drops to less<br />
than 60 % of the fauna and the percentage of the tolerant taxa accounts for more than 40 %. At the<br />
good to moderate class boundary (Bentix=3.5), the percentage of tolerant species becomes over 60<br />
% (roughly 2/3 of the fauna) and the sensitive taxa less than 40 % (1/3 of the fauna).
Figure 2.3.1: Bentix values<br />
(from Greece and Cyprus IC data)<br />
plotted against the percentages of the<br />
two ecological groups. P: poor class,<br />
M: moderate class, G: good class,<br />
H: high class.<br />
Compliance with Normative definitions<br />
Figure 2.3.2 presents the degradation model of the percentage contribution of the three main<br />
ecological groups treated initially in the formula: GI (sensitive + indifferent), GII (tolerant + second<br />
order opportunistic), GIII (first order opportunistic) in the benthic fauna in relation with the values<br />
of the BENTIX index. The sequence of quality classes and class boundaries are interpreted in<br />
terms of shifts of ecological group percentages. At the border of good to high status (Bentix=4.5)<br />
the sensitive group accounts roughly for more than 60 % or more than 2/3 of the fauna, while the<br />
tolerant group as a whole (tolerant plus opportunists) accounts for less than 40 % or less than 1/3<br />
of the fauna. It is important to stress here that for purely muddy habitats where the benthic fauna is<br />
normally dominated by some tolerant species, and only in this class border among high and good, a<br />
possible refinement of the boundary limit would change 4,5 to 4.<br />
This is to some extent in accordance with the normative conditions, which states that “The level of<br />
diversity and abundance of invertebrate taxa is slightly outside the range associated with undisturbed<br />
conditions. Most of the sensitive taxa of the type specific communities are present”.At the border of<br />
good to moderate status (bentix=3.5) the sensitive group accounts roughly for less than 40 % or<br />
less than 1/3 of the fauna, while the tolerant group as a whole (tolerant plus opportunists) accounts<br />
for more than 60 % or more than 2/3 of the fauna. This is to some extent in accordance with the<br />
normative conditions, which states that “The level of diversity and abundance of invertebrate taxa is<br />
moderately outside the range associated with undisturbed conditions. Most of the sensitive taxa of<br />
the type specific communities are absent”.<br />
47
Figure 2.3.2: Degradation model of benthic fauna composition in terms of ecological groups percentages<br />
(GI, GII, GIII) from heavily polluted to undisturbed communities in relation to the Bentix index tools.<br />
Index response to the impact gradient<br />
Plotting the Bentix results from Greek IC data with chemical parameters available, the Bentix index<br />
showed a linear relationship with the pressure gradient, expressed by chemical pressure factors<br />
(nutrients, oxygen and organic carbon content in sediment) with no discontinuities (Fig. 2.3.3).<br />
Using Cyprus data were the pressure gradient is represented by the increasing distance from fish<br />
farm areas the results of the Bentix EQS assessment shows a good response of the index in relation<br />
with the gradient (Figure 2.3.4).<br />
In the three case areas the EQS is improving (moderate-good or moderate-good-high) with<br />
increasing distance. In series C the presence of Posidonia meadows at 300 and 1000 m distance<br />
from the cages determine the high EQS status.<br />
48<br />
Figure 2.3.3: Correlation of Bentix<br />
with chemical parameters.
6<br />
4.5<br />
3<br />
1.5<br />
0<br />
Μ<br />
0<br />
Results of the comparison<br />
G<br />
50<br />
A-1 A-2<br />
AMBI-BENTIX<br />
Series A<br />
G<br />
200<br />
G<br />
500<br />
G<br />
1800<br />
A-3 A-4 L-ref<br />
Increasing distance from cages<br />
G<br />
5000<br />
A-ref<br />
Figure 2.3.4: Variation of the Bentix index and resulted<br />
EQS along a gradient of increasing distance from fish<br />
farm cages in Cyprus (distances in meters are marked<br />
below the EQS).<br />
Series C<br />
The two indices were compared after revising the scores of both indices reaching an agreement<br />
on certain ambiguous scores. A direct comparison among the two biotic indices EQRs (Figure<br />
2.3.5) shows the relation among the two indices’ Ecological Quality Ratio (EQR) which is linear<br />
and statistically significant (R2=61, p=0.000). The lines in the plot define the ranges of each class<br />
set by the boundary limits of each method. The Ambi boundary limits were set according to WFD<br />
ecological status classification (Muxica et al., 2005). The two indices are linearly correlated, but the<br />
EQS assessment rendered by each method differs as shows a Box-and-Whisker plot comparison of<br />
the EQS assessment versus the values of the EQRs of the two indices (Figure 2.3.6). This difference<br />
is due to a) the differential weight each index puts in the various ecological groups and b) in the<br />
different boundary limits of Ambi values and EQRs set among classes as fig. 2.3.5 shows.<br />
In the good class range, the two indices give a common assessment. However, the Ambi<br />
classification method gives a wider “good” class range compared with the Bentix, classifying most<br />
moderate and often high class sites according to the Bentix to the “good” class. Generally, moderate<br />
and high class ranges in the Ambi are more compressed compared to the Bentix scheme.<br />
These differences are structural: in the Ambi method the indifferent group species are weighted<br />
separately, while Bentix counts them with the sensitive. Also the Ambi gives different significance<br />
to each “tolerant” group of species. In the Bentix method all tolerant species are weighted equally<br />
versus the sensitive ones. Besides, the scaling of the distances among classes is different in the two<br />
methods. The Bentix sets equal distances for the moderate (2.5-3.5) and good (3.5-4.5) classes,<br />
while the Ambi renders a wider good class (1.2-3.3) compared to the moderate (3.3-4.3) and high<br />
(0-1.2).<br />
6<br />
4.5<br />
3<br />
1.5<br />
0<br />
6<br />
4.5<br />
3<br />
1.5<br />
0<br />
Μ<br />
0<br />
Series B<br />
B-1 B-2B-3 B-Ref<br />
Increasing distance from cages<br />
Μ<br />
0<br />
Μ<br />
200<br />
G<br />
50<br />
H<br />
300<br />
G<br />
250<br />
H<br />
1000<br />
CI CII CIII Pos CV Pos CVI<br />
Increasing distance from cages<br />
G<br />
4000<br />
H<br />
1000<br />
49
AMBI EQR<br />
m-AMBI - BENTIX<br />
The Bentix was compared with the combined AMBI-Shannon Diversity-Species Richness<br />
multivariate method. In this method a factorial analysis of the three combined indices, using high<br />
and bad values for all indices determine the distance of each point-station from the two extremes<br />
(high and bad). The threshold values for the EQS classification (EQR determination) were based<br />
upon the REFCOND (non-intercalibrated values; Borja et al., 2007) and are referred below (Muxica<br />
et al., 2006).<br />
For this comparison two sets of habitats was decided to be treated separately. This is because the<br />
indices of Shannon Diversity and species richness vary a lot depending on the type of habitat.<br />
50<br />
Ambi EQR<br />
1<br />
0.8<br />
0.6<br />
0.4<br />
0.2<br />
1.00<br />
0.80<br />
0.60<br />
0.40<br />
0.20<br />
0.00<br />
AMBI EQR<br />
Ambi EQR<br />
1<br />
0.8<br />
0.6<br />
0.4<br />
1.00<br />
0.80<br />
0.60<br />
0.40<br />
0.20<br />
0.00<br />
Comparison of AMBI-BENTIX EQRs<br />
Comparison of AMBI-BENTIX EQRsR<br />
2 = 0.6126<br />
0.00 0.20 0.40 0.60 0.80 1.00<br />
Bentix EQR<br />
R 2 = 0.6126<br />
0.00 0.20 0.40 0.60 0.80 1.00<br />
Box-and-Whisker Plot<br />
Bentix EQR<br />
Figure 2.3.5: Comparison among the AMBI and BENTIX EQRs and class boundary thresholds.<br />
Box-and-Whisker Plot<br />
Box-and-Whisker Plot<br />
0<br />
H 0.2 G M P B<br />
0<br />
H 0.2 G M P B<br />
EQS<br />
EQS<br />
0<br />
0<br />
Figure 2.3.6: Box-and-Whisker H plot G of EQS M classification P Bresults<br />
using AMBI and BENTIX H on GGreek MIC data. PFor this B<br />
comparison EQR=0 for Ambi=6 and Bentix=2.<br />
EQS<br />
EQS<br />
BENTIX EQR<br />
1<br />
0.8<br />
0.6<br />
0.4<br />
0.2<br />
BENTIX EQR<br />
1<br />
0.8<br />
0.6<br />
0.4<br />
Box-and-Whisker Plot
For this reason two main types of habitats were decided to be treated separately: the mixed and<br />
vegetated sediments and the purely muddy sediments which is considered a special kind of naturally<br />
stressed biotope where normally is inhabited by several tolerant species. Also the Bentix index<br />
renders some modifications in the class boundaries for the muddy bottom habitats.<br />
Various sets of “reference” or “highest values” were tested for the indices to run the factor analyis.<br />
Finally it was decided to select the ones well above the maximum values encountered in real data.<br />
However there is some speculation to use these highest values as reference values in general, as<br />
these indices (diversity and species richness) depend much on specific conditions of the substrate,<br />
sampling size and methodology, seasonal cycles etc.<br />
In the comparison of Bentix and m-Ambi EQRs the lowest EQR=0 was equated<br />
with AMBI=6 and Bentix=2 because of the lack of numeric values in the area 0-7 for Ambi and 0-2<br />
for Bentix.<br />
a) mixed sediments<br />
Highest values for H (=6) and S (=120) were selected above the maximum values from real data<br />
(reference sites) and refer to the standard unit of sampling surface (0.1 m 2 ) and the mixed sediments<br />
habitat. The variability explained by the data is high (69 %) and the agreement in the EQS<br />
assessment is moderate (kappa value-0.52), but in the limit with very good (Figure 2.3.7).<br />
EQR-Multivariate<br />
1.0<br />
0.9<br />
0.8<br />
0.7<br />
0.6<br />
0.5<br />
0.4<br />
0.3<br />
0.2<br />
0.1<br />
y = 0.9751x + 0.0959<br />
R 2 = 0.6928<br />
0.0<br />
0.0 0.1 0.2 0.3 0.4 0.5 0.6 0.7 0.8 0.9<br />
EQR-Bentix<br />
Figure 2.3.7: Correlation among m-AMBI and BENTIX methods’ EQRs in the mixed<br />
sediments habitat.<br />
High and Bad values of the indices selected<br />
for the factor analysis in the mixed sediments<br />
analysis<br />
HIGH BAD<br />
H 6 0<br />
S 120 0<br />
AMBI 0 6<br />
Status Class Boundary<br />
REFCOND (non intercalibrated values)<br />
EQS EQR<br />
B/P 0.2<br />
P/M 0.41<br />
M/G 0.62<br />
G/H 0.83<br />
51
) purely muddy bottoms<br />
In this type of habitat are considered those stations sampled in muddy bottoms with silt and clay or<br />
mud content of 85 % and over (according to Folk, 1954 classification scheme).<br />
52<br />
EQR-multivariate<br />
0.8<br />
0.7<br />
0.6<br />
0.5<br />
0.4<br />
0.3<br />
0.2<br />
0.1<br />
R 2 = 0.3778<br />
0.0<br />
0.0 0.1 0.2 0.3 0.4 0.5 0.6 0.7 0.8<br />
EQR-Bentix<br />
Figure 2.3.8: Correlation among m-AMBI and BENTIX methods’ EQRs in the muddy sediments habitat.<br />
High and Bad values of the indices selected<br />
for the factor analysis in the muddy sediments<br />
analysis<br />
HIGH BAD<br />
H 5 0<br />
S 40 0<br />
AMBI 0 6<br />
Status Class Boundary<br />
REFCOND (non intercalibrated values)<br />
EQS EQR<br />
B/P 0.2<br />
P/M 0.41<br />
M/G 0.62<br />
G/H 0.83<br />
The agreement of m-AMBI and Bentix in this kind of habitat type is almost perfect (kappa<br />
value=0.98). The explained variability is moderate (40 %) because of the high aggregation of data<br />
in the moderate class. However, again care should be taken in the selection of high values for the<br />
diversity and species richness, which could only be considered as a highest threshold for reference<br />
conditions setting. Figure 9 shows an overall comparison of EcoQ classification results for all Greek<br />
data and separately for muds where different reference values for m-Ambi are used. The agreement<br />
between Bentix and m-Ambi is good, especially in the muddy habitats.<br />
Figure 2.3.10 shows the comparison among indices in the Cyprus data. Ambi tends towards higher<br />
classes, m-Ambi towards lower classes and the agreement is better among Bentix and m-Ambi.
100<br />
90<br />
80<br />
70<br />
60<br />
50<br />
100<br />
40<br />
90<br />
30<br />
80<br />
20<br />
70<br />
10<br />
60<br />
0<br />
50<br />
40<br />
30<br />
20<br />
10<br />
0<br />
FRANCE<br />
Greek IC data comparison of indices<br />
H G M P B<br />
Ambi m-ambi Bentix<br />
H G M P B<br />
Ambi m-ambi Bentix<br />
The results here presented have to be considered only as an Ambiexercise. m-ambi Data Bentix used for the<br />
<strong>intercalibration</strong> exercise was obtained using an identical methodology at all sampling stations:<br />
5 samples per station<br />
use of Van Venn or Smith Mac Intyre bucket<br />
sample size 0.1 m²<br />
sample depth between 20 and 35 metres (according to depth of Posidonia meadow lower limit).<br />
The exercise was mainly based on datasets collected in Languedoc Roussillon by the ARAGO<br />
laboratory, situated in Banyuls. Corsican data was supplied by the STARESO station. The company<br />
CREOCEAN provided data acquired during numerous impact studies in Languedoc Roussillon.<br />
Data collected by CREOCEAN at reference sites (Languedoc Roussillon and Provence-Alpes-Côte<br />
d’Azur) during the 2005 cruise was also used (Fig. 2.3.11).<br />
Indices tested in the framework of the <strong>intercalibration</strong> exercise<br />
Each dataset was processed using H’, AMBI, BENTHIX and TI (Trophic Index) index formulas as<br />
shown below:<br />
100<br />
50<br />
40<br />
90<br />
30<br />
80<br />
20<br />
70<br />
10<br />
60<br />
0<br />
50<br />
100 30<br />
A- Shannon-Weaver (H’) Index<br />
The Shannon-Weaver index is a diversity index taking into account both the number of species in a<br />
sample as well as their relative abundance, and is hence an efficient tool for assessing the ecological<br />
balance of ecosystem populations.<br />
40<br />
30<br />
20<br />
10<br />
0<br />
90 20<br />
80 10<br />
700<br />
60<br />
50<br />
40<br />
30<br />
20<br />
10<br />
0<br />
Habitat 2 (muds)<br />
H G M P B<br />
Ambi m-ambi Bentix<br />
Figure 2.3.9: Relative frequency distribution of EcoQ status of all Greek data and separately for muddy habitat<br />
according to the various indices tested.<br />
Figure 2.3.10: Relative frequency distribution of EcoQ<br />
status of Cyprus data.<br />
100<br />
90<br />
80<br />
70<br />
60<br />
100<br />
90<br />
80<br />
70<br />
60<br />
50<br />
40<br />
H G M P B<br />
Ambi m-ambi Bentix<br />
H G M P B<br />
Ambi m-ambi Bentix<br />
H G M P B<br />
53
Ni = number of individus belonging to the species i; N = total number of individuals per m²<br />
A maximum Shannon index (H’max) is achieved when all species are found in equal numbers. A<br />
zero trend indicates that the population is dominated by a single species.<br />
B- AZTI Marine Biotic Index (AMBI) & Biotic Index (BI)<br />
The AMBI (AZTI Marine Biotic Index), also referred to as the benthic coefficient (BC), is based<br />
on ecological successions. The 5 ecological groups (GI, GII, GIII, GIV and GV) are defined<br />
according to species polluosensitivity. Group I comprises species which are the most sensitive to<br />
hypertrophication; group V comprises opportunistic species inhabiting reduced sediment. The<br />
reliability of this index also depends on the extent of sampling: if data is too limited, the same<br />
average value will be achieved but with a high standard deviation. It has the advantage of being<br />
applicable to all environments, as it is based on a predefined list of species.<br />
%GI, %GII, %GIII, %GIV, %GV = relative abundance of various trophic groups versus total<br />
number.<br />
AMBI values range from 0 to 6. A 0 value indicates an unpolluted environment, whereas a 6 value<br />
indicates major pollution and an azoïc environment.<br />
54<br />
1<br />
1. Gulf of Lions : 214 stations<br />
2. Reference sites : 7 stations<br />
3. Corsica : 15 stations<br />
Figure 2.3.11: French Mediterranean coastal regions sampled during the <strong>intercalibration</strong><br />
exercise on soft-substrate benthic populations.<br />
2<br />
3
C- Biological Quality Index (BQI)<br />
The BQI index is used to evaluate the composition of biological communities and hence pinpoint<br />
environmental disturbances. BQI values are only valid for the target habitat and the maximum value<br />
measured in that particular habitat. Moreover, the reliability of this index depends largely on the<br />
extent of sampling. Extensive data is therefore needed to calculate the ES500,05 19 of each species<br />
and perform a reliable analysis.<br />
Ni = number of individus belonging to the species i; N = total number of individuals per m²; S:<br />
Number of species<br />
The BQI index is mainly used to detect physical disturbances to the environment.<br />
D- Trophic Index (TI)<br />
This index assesses the feeding habits of species present in a sample on the basis of the ecological<br />
succession principle. Species are classified into 4 trophic groups (1: suspension feeders, 2: detritus<br />
feeders, 3: deposit feeders, 4: anaerobic substrate species).<br />
n1, n2, n3, n4 = number of species from trophic groups 1, 2, 3 and 4<br />
N = total number of species<br />
Index values range from 0 to 100. Values above 60 indicate a normal population, unaffected by<br />
sediment enrichment with organic matter. Values between 30 and 60 indicate a population<br />
imbalance , slightly affected by sediment enrichment with organic matter. Values below 30 highlight<br />
a disturbed population impacted by sediment deterioration due to excessive enrichment with organic<br />
matter. The Trophic Index is therefore used to pinpoint environmental disturbances of organic<br />
origin.<br />
Using the values calculated at each station with the Shannon, AMBI, BQI and Trophic indices,<br />
we can establish ecological status class boundaries per index, as defined in the <strong>Water</strong> <strong>Framework</strong><br />
<strong>Directive</strong> (“High”, “Good”, “Moderate”, “Poor” and “Bad”) (Tab. 2.3.3).<br />
Results of the comparison<br />
LANGUEDOC – ROUSSILLON REGION<br />
Data from 214 stations was analyzed. Thanks to in-depth knowledge of the sampling sites,<br />
population counts and surveys conducted at each station, we were able to establish that 170 (79 %)<br />
were undeteriorated.<br />
19 ES50: represents the theoretical number of species obtained if this sample contained only 50 individuals. On the basis<br />
of this result, we can establish an ES50 distribution curve for this species according to the associated theoretical specific<br />
number. The first 5 % of this distribution are referred to as ES50 0.05 .<br />
55
Table 2.3.3: EcoQ values for the Shannon, AMBI, BQI and Trophic indices.<br />
The Shannon Index (H’) enabled an efficient discrimination of deteriorated stations, 89 % of which<br />
obtained a “Moderate” “Poor” or “Bad” score. Moreover, the majority of undeteriorated stations<br />
(86 %) achieved a good score.<br />
The AMBI index did not enable discrimination and all stations were classified as “undeteriorated”.<br />
We noted a drop in the index value at higher depths.<br />
The BQI did not provide satisfactory discrimination between the various stations either. Although<br />
all deteriorated stations scored badly, so did half (46 %) of the undeteriorated stations.<br />
The Trophic Index (TI) failed to identify 16 % of the deteriorated stations. The index value dropped<br />
at higher depths and 50 % of undeteriorated stations obtained a low score.<br />
56<br />
EcoQ H’ AMBI<br />
BQI<br />
Depth. < 20m Depth. > 20m<br />
High H’ > 4 AMBI ≤ 1.2 BQI > 18.8 BQI > 26.4 IT > 80<br />
Good 3 < H’ ≤ 4 1.2 < AMBI ≤ 3.3 14.1 < BQI ≤ 18.8 19.8 < BQI ≤ 26.4 60 < IT ≤ 80<br />
Moderate 2 < H’ ≤ 3 3.3 < AMBI ≤ 4.3 9.4 < BQI ≤ 14.1 13.2 < BQI ≤ 19.8 50 < IT ≤ 60<br />
Poor 1 < H’ ≤ 2 4.3 < AMBI ≤ 5.5 4.7 < BQI ≤ 9.4 6.6 < BQI ≤ 13.2 30 < IT ≤ 50<br />
Bad H’ < 1 5.5 < AMBI ≤ 6 BQI ≤ 4.7 BQI ≤ 6.6 IT ≤ 30<br />
degraded stations have bad indices.<br />
Most not degraded stations have<br />
good indices<br />
H’ AMBI<br />
All the stations are considered<br />
as good<br />
Indices decreased with depth<br />
BQI IT<br />
degraded stations have bad indices.<br />
Many not degraded stations have<br />
bad indices<br />
None degraded stations have<br />
bad indices.<br />
Indices decreased with depth<br />
Figure 2.3.12: Comparison of Languedoc-Roussillon site classifications using the AMBI, Shannon-Weaver, BQI and<br />
Trophic indices.
Out of the 214 stations sampled in Languedoc Roussillon, 79 % were defined as having a “Good” or<br />
“High” status. Application of the various indices to the Languedoc Roussillon stations showed that<br />
the H’ index provided the best characterization of deteriorated and undeteriorated sites (Tab. 2.3.3)<br />
Table 2.3.3: Comparison of scores obtained using each index versus actual impacts evaluated at Languedoc-Roussillon<br />
sites.<br />
Eco Q<br />
Biotic Indices “High” or “Good” “Moderate”, “Poor” or “Bad”<br />
Actual Impact 79 % 21 %<br />
Shannon (H’) 69 % 31 %<br />
BQI 26 % 64 %<br />
AMBI 100 % 0 %<br />
TI 57 % 43 %<br />
CORSICA<br />
The dataset included 15 stations sampled for the last 5 years by STARESO.<br />
Generally speaking, the sediment particles found around Corsica are fairly large, hence incurring<br />
low species densities. This particular characteristic impedes index reliability, in particular that of the<br />
Shannon (H)’ index which indicates a poor ecological status even in undeteriorated environments.<br />
We could circumvent this difficulty by calculating the EQRs of each reference site using major<br />
community-type sampling (Fig. 2.3.13).<br />
Figure 2.3.13: Application of H’, AMBI and TI indices for the classification of Corsican<br />
coastal sites.<br />
57
Reference sites<br />
7 stations corresponding to reference sites in Languedoc Roussillon (2 stations) and Provence-<br />
Alpes-Côte d’Azur (5 stations) were sampled during the 2005 cruise.<br />
Overall, the sampled stations showed balanced populations, with relatively to very high biomasses<br />
and densities. Data processed using the H’ and BQI indices gave “High” results at all stations; the<br />
AMBI index gave “Good” to “High” results and the Trophic Index gave “Moderate” to “Good”<br />
results (Fig. 2.3.14). Using BQI calculations, just 27 % of cruise target species were identified using<br />
the data collected from over 200 stations. If results obtained with the H’ and BQI indices prove<br />
similar, the Shannon index would hence appear to be more efficient than the BQI<br />
Analysis of the various results demonstrated that no single index is capable of characterizing<br />
environmental disturbances as a whole. None of the indices are exhaustive, and each has its pros and<br />
cons. Some are harder to implement than others. However, comparatively speaking, the Shannon index<br />
proved more efficient at highlighting environmental disturbances along French Mediterranean coasts.<br />
The Shannon Index could usefully be associated with the AMBI and usual biological parameters<br />
(specific numbers, density and biomass).<br />
The BQI requires relatively complicated calculations and an extensive database. The database used<br />
to obtain the BQI index (data from over 200 stations) resulted in the identification of just 157 species<br />
58<br />
Figure 2.3.14: Classification of<br />
reference sites using the H’, BQI,<br />
AMBI and TI indices.
out of the 586 identified at the reference sites during the cruise. In addition, the BQI and H’ (Fig.<br />
2.3.15) are strongly correlated and are both structural indices, although H’ is very easy to calculate.<br />
Although the TI and AMBI are generally associated (both are organic pollution indicators), they<br />
actually appear to differ in several ways due to the AMBI’s weaker range versus the TI, which is<br />
more penalizing that the AMBI.<br />
Moreover, the results highlight a close relationship between particle size and population composition,,<br />
due to the fact that particle size defines the types of habitat available in the environment.<br />
In view of the heterogeneous character of the sediment particles found in French Mediterranean<br />
waters (Languedoc-Roussillon, Provence, Corsica), the experts who took part in this <strong>intercalibration</strong><br />
exercise recommended using stratified sampling per major community type (4 particle types) and per<br />
reference station (undisturbed zone). This would give us a reference notwithstanding the type of sample<br />
collected during monitoring and would also offer greater sampling flexibility (samples taken from the<br />
predominant substrate of monitored water masses), as, to all intents and purposes, it is very difficult to<br />
obtain samples with similar particle characteristics at all French Mediterranean coastal stations.<br />
ITALY<br />
Results presented here have to be considered only as an exercise which is based on the data<br />
available till now for the Italian coasts. Data were collected in 50 stations along 11 coastal Regions<br />
within the National Monitoring programme (2001-2006) of the Italian Ministry of Environment<br />
(still under evaluation).<br />
Major reasons of concerns about this data set and the validation of the ecological classification<br />
obtained by their use are related to the following points:<br />
– a high percentage of individuals not identify to species level is present in some samples;<br />
– no chemical-physical parameters (oxygen, organic matter, nutrients, sediment grain size)<br />
are available for most of the stations. The chemical-physical parameters are fundamental<br />
to interpret the results and to understand the reliability of the quality indices tested.<br />
BQI<br />
40<br />
35<br />
30<br />
25<br />
20<br />
15<br />
10<br />
5<br />
y = 2.2693e 0.4857x<br />
R = 0.7386<br />
2<br />
Relation between H' and BQI<br />
0<br />
0 1 2 3 4 5 6<br />
H'<br />
Figure 2.3.15: Correlations between the Shannon (H’) and BQI indices.<br />
59
The a-priori classification of the <strong>intercalibration</strong> sites is in some case questionable.<br />
No real reference sites exist.<br />
Having this in mind, the Multimetric AMBI method (M-AMBI) (Muxika et al., 2007) with several<br />
reference conditions (RC) and boundaries, adapted to Italian data, were applied and tested. Three<br />
different approaches that give similar reference values for AMBI, richness (R) and diversity (H),<br />
and that provide the most reliable ecological status classification, are described below.<br />
Reference conditions<br />
The WFD identifies four options for determining reference conditions: 1) existing undisturbed sites,<br />
2) historical data and information, 3) models, and 4) expert judgement. Option 3 and 4 were selected<br />
to define different reference values.<br />
1. RC1<br />
In this case, samples with individuals in ecological group I >70 % (sensu Borja et al., 2000) were<br />
selected. Then, among those only samples with R> 20, H> 2 were considered as reference. The high<br />
percentage of sensitive species is here considered more important than high R and H. The median<br />
value of AMBI, R and H in these samples, is used as reference . The mean or median value from the<br />
distribution of reference site values are considered the most robust values to be used as reference<br />
and relatively few data are needed for sufficient confidence in RC (Wallin et al., 2003).<br />
60<br />
RC1<br />
AMBI R H<br />
0.5 30 4<br />
2. RC2<br />
In this second attempt, the reference values were calculating on all the data set. For this reason a<br />
higher percentile than the median (the 90th percentile) was used for R and H and a lower one (the<br />
10th) for AMBI.<br />
RC2<br />
AMBI R H<br />
0.4 42 4<br />
3. RC3<br />
In this case the Intercalibration sites, which were a-priori classified in High/Good ES and the<br />
stations indicated by Regional Agencies as “control sites”, were considered as reference sites . In<br />
order to establish the reference values, not being sure of the a-priori classification of these sites, we<br />
have considered a higher (lower for AMBI) percentile than the median value: the 75th percentile for<br />
R and H, and to the 25th for AMBI.<br />
Boundary Setting<br />
RC3<br />
AMBI R H<br />
0.8 33 3.3<br />
Different boundaries were set on the basis of the different reference conditions considered (1, 2, 3).<br />
1. The 10th percentile of EQR values obtained for the reference samples was selected as the “upper<br />
anchor” (Wallin et al., 2003) and the class boundary between high and good. The width of the four<br />
remaining classes was evenly spaced over the remaining interval. This has resulted in the following<br />
class boundaries.
1<br />
High status ≥ 0.81<br />
Good status ≥ 0.61<br />
Moderate status ≥ 0.41<br />
Poor status ≥ 0.20<br />
Bad status
M-AMBI options 1, 2, 3/Bentix<br />
Results obtained by applying M-AMBI with different RC and boundaries were compared with those<br />
obtained by Bentix Index; the different boundaries are <strong>report</strong>ed in table 2.3.5. The Bentix EQR<br />
values for Italian data were calculated by Mika Simùboura.<br />
Table 2.3.5: Boundaries values for Bentix and for M-AMBI (options 1, 2, 3).<br />
62<br />
Percentage %<br />
70<br />
60<br />
50<br />
40<br />
30<br />
20<br />
10<br />
0<br />
1 2 3<br />
H G M P B<br />
ES<br />
Figure 2.3.15: Percentage of samples classified in High, Good, Moderate, Poor, and Bad<br />
Ecological Status by applying M-AMBI with different RC and boundaries (options 1, 2, 3).<br />
Boundaries Bentix M-AMBI 1 M-AMBI 2 M-AMBI 3<br />
H/G 0.75 0.81 0.80 0.78<br />
G/M 0.58 0.61 0.60 0.59<br />
M/P 0.42 0.41 0.40 0.39<br />
P/B 0.33 0.20 0.20 0.20<br />
Figure 2.3.16 shows, as an example, the relationship between Bentix EQR and M-AMBI 1 EQR<br />
(the M-AMBI option that gives results nearest to those obtained by Bentix). Only a low correlation<br />
exists; the major difference is about the H/G classification, the 32 % of the sample classified in high<br />
ecological status by Bentix result in Good ES for M-AMBI (Fig. 2.3.17).<br />
Results of Kappa analysis (table 3) confirms low agreement between the two different Ecological<br />
Status classifications.
Bentix<br />
Bentix<br />
Percentage %<br />
K values and agreement among Ecological status classification were obtained by applying M-AMBI<br />
with different RC and boundaries (options 1, 2, 3) and Bentix index<br />
SLOVENIA<br />
0.60<br />
1.00<br />
0.40<br />
0.80<br />
0.20<br />
0.60<br />
0.00<br />
0.40<br />
0.00 0.20 0.40 0.60 0.80 1.00<br />
0.20<br />
0.00<br />
0.00 0.20 0.40 0.60 0.80 1.00<br />
70<br />
40<br />
60<br />
30<br />
50<br />
20<br />
40<br />
10<br />
30<br />
0<br />
20<br />
0<br />
r=0.221 p
SLOVENIA<br />
Metric Reference condition<br />
AMBI 1,3/6<br />
Shannon-Wiener (H’) 5,8<br />
Richness(S) 110<br />
Setting of Boundaries<br />
Boundaries were determined according to expert judgement. This was the only possible method,<br />
since the Slovenian data were not equally distributed over the whole range of EQR values and due<br />
to the fact that more than one metrics has been used to calculate EQR.<br />
SLOVENIAN BOUNDARIES<br />
H/G 0,83<br />
G/M 0,62<br />
M/P 0,41<br />
P/B 0,20<br />
Boundary between High and Good ecological class was set according to the reference conditions and<br />
natural variability. Natural variability defines width of High class. In our case natural variability is<br />
presumed to be around 20 %, meaning that upper and lower limit of High class differ for 20 %. H/G<br />
boundary (lower limit) was calculated by taking median from EQR values of the two stations used<br />
in calculating reference conditions (SD_VT2_P1 and SD_VT2_P2) and subtracting additional 5 %<br />
on this value. Subtracting of 5 % was done because median of our actual data lays 15 % from upper<br />
limit, so to get the lower limit, which differs from upper for 20 % this subtraction must be done.<br />
Other boundaries were set equidistantly from the H/G boundary (0,83): between G/M on 0,62,<br />
between M/P on 0,41 and between P/B on 0,20.<br />
Results of the comparison<br />
M-AMBI/BENTIX<br />
64<br />
M-AMBI<br />
1<br />
0,9<br />
0,8<br />
0,7<br />
0,6<br />
0,5<br />
0,4<br />
0,3<br />
0,2<br />
0,1<br />
0<br />
1,00<br />
0,90<br />
0,80<br />
0,70<br />
M-AMBI<br />
y = 0,9142x + 0,1154<br />
R 2 = 0,7537<br />
0 0,2 0,4 0,6 0,8 1<br />
Bentix-EQR<br />
Figure 2.3.18: Correlation among EQR_M-AMBI (SI) and EQR_BENTIX (GR, CY) using<br />
Slovenian benthic invertebrate data.
M-AMBI<br />
0,6<br />
0,5<br />
0,4<br />
Table 2.3.5: Agreement for ecological status analysis between the methods used y in = 0,9142x Slovenia + 0,1154 (M-AMBI),<br />
Greece/Cyprus (Bentix).<br />
R 2 0,3<br />
0,2<br />
= 0,7537<br />
0,1<br />
M-AMBI (SI) BENTIX (GR, CY)<br />
M-AMBI (SI)<br />
0<br />
1,00<br />
0 0,2 0,4 0,6 0,8 1<br />
BENTIX (GR, CY) 0,83<br />
Bentix-EQR<br />
1,00<br />
EQR_M-AMBI (SI)<br />
EQR_BENTIX (Gr,Cy)<br />
1,00<br />
0,90<br />
0,80<br />
0,70<br />
0,60<br />
0,50<br />
0,40<br />
0,30<br />
0,20<br />
0,10<br />
0,00<br />
1.00<br />
0.90<br />
0.80<br />
0.70<br />
0.60<br />
0.50<br />
0.40<br />
0.30<br />
0.20<br />
0.10<br />
0.00<br />
High<br />
Good<br />
EQS_M-AMBI (SI)<br />
Bad<br />
High Good Bad<br />
Figure 2.3.19 . Boxplot-and-Whisker plot (75 percentile) of EQS classification results using<br />
M-AMBI (SI) and BENTIX (GR, CY) on Slovenian IC data.<br />
EQS<br />
65
M-AMBI/MEDOCC<br />
Table 2.3.6: Agreement for ecological status analysis between the methods used in Slovenia (M-AMBI) and Spain<br />
(MEDOCC) (Slovenian benthic invertebrate data).<br />
EQR_M-AMBI (SI)<br />
EQR_MEDOCC<br />
66<br />
1,00<br />
0,90<br />
0,80<br />
0,70<br />
0,60<br />
0,50<br />
0,40<br />
0,30<br />
0,20<br />
0,10<br />
0,00<br />
0,8<br />
0,7<br />
0,6<br />
0,5<br />
0,4<br />
0,3<br />
0,2<br />
0,1<br />
0<br />
EQR_M-AMBI (SI)<br />
1<br />
0,9<br />
0,8<br />
0,7<br />
0,6<br />
0,5<br />
0,4<br />
0,3<br />
0,2<br />
0,1<br />
M-AMBI (SI) 1,00<br />
M-AMBI (SI) MEDOCC<br />
MEDOCC 0,75 1,00<br />
y = 0,8819x + 0,2431<br />
R 2 = 0,583<br />
0<br />
0,0 0,1 0,2 0,3 0,4 0,5 0,6 0,7 0,8<br />
EQR-MEDOCC<br />
Figure 2.3.20: Correlation among EQR_M-AMBI (SI) and MEDOCC using Slovenian benthic<br />
invertebrate data.<br />
High<br />
G<br />
Good<br />
EQS_M-AMBI (SI)<br />
M<br />
EQS_MEDOCC<br />
Bad<br />
B<br />
Figure 2.3.21: Boxplot-and-<br />
Whisker plot (75 percentile) of EQS<br />
classification results using M-AMBI<br />
(SI) and MEDOCC on Slovenian IC<br />
data.
SPAIN (Catalonia and Balearic Islands)<br />
The MEDOCC index is an adaptation to the western Mediterranean area of the AMBI index<br />
developed for the Atlantic coast (Borja et al.,2000) based on sensitivity/tolerance of the species.<br />
Species sensitivity<br />
Species from the dataset have been assigned to one ecological group (EG) in relation to the<br />
sensitivity/tolerance of the species mainly to organic enrichment.<br />
Ecological groups have been divided into four categories: sensitive, indifferent, tolerant and<br />
opportunistic species, based on available literature, AMBI list (http://www.azti.es), Simboura &<br />
Zenetos, (2002); http://www.hcmr.gr/english_site/services/env_aspects/bentix.html), Pinedo (1998)<br />
and expert judgment.<br />
MEDOCC index<br />
The MEDOCC index is able to detect organic enrichment following communities succession<br />
described by Pearson & Rosenberg (1978) and posterior authors. The main differences with the<br />
original AMBI method proposed by Borja et al. (2000) are the following:<br />
Change in the categories of the ecological groups in some species. Although Borja has defended<br />
the idea of assigning species to the same ecological group uniquely according to the species’<br />
biogeographical latitudinal range, it can be considered that species react differently depending on<br />
inter-species interaction and environmental conditions (Rosenberg et al., 2004; Dauvin, 2007). In<br />
other way, assigning a species to different ecological groups according to the region could become<br />
subjective related to the experience and expertise of the scientist (Dauvin, 2007).<br />
During the <strong>intercalibration</strong> exercise it was attempted to get an unanimous species scores assignation<br />
but we did not arrive to an agreement for some species; thus finally we consider the necessity of<br />
changing ecological groups in some species that respond differently to organic enrichment in the<br />
Mediterranean and the Atlantic. Carvalho et al. (2006) also suggest different EGs to those assigned<br />
in AMBI list for some species. In the following table we include only those species that change EGs<br />
comparing with AMBI list and species with no ecological group in AMBI list but assigned to one in<br />
MEDOCC index.<br />
67
Table 2.3.7: Species changing the ecological group and species with no ecological group in AMBI list.<br />
Species MEDOCC AMBI<br />
Acanthocardia tubercula 2 1<br />
Ampelisca typica 2 1<br />
Ampharete sp. 2 1<br />
AMPHARETIDAE 2 -<br />
Amphipholis squamata 2 1<br />
Amphiura chiajei 3 2<br />
Anthura gracilis 2 1<br />
Apseudes latreillei 2 3<br />
Aricidea catherinae 2 1<br />
Aricidea suecica 2 1<br />
Bodotria pulchella 1 2<br />
Caecum sp. 1 -<br />
Capitellethus sp. 4 -<br />
Cardium sp. 2 3<br />
Corbula gibba 3 4<br />
Corophium runcicorne 2 3<br />
Cyclichna cylindracea 1 2<br />
Chone longiseta 1 2<br />
Diastilis rugosa 2 1<br />
Euclymene collaris 3 1<br />
Eurydice sp. 1 -<br />
Exogone naidina 3 2<br />
Exogone verugera 3 2<br />
Fabriciola tonerella 4 2<br />
Galathowenia oculeata 2 3<br />
Glans sp. 1 -<br />
Glycera oxycephala 1 2<br />
Goniadella galaica 3 2<br />
Four ecological groups have been considered (instead of five in AMBI): sensitive (EGI), indifferent<br />
(EGII), tolerant (EGIII) and opportunistic species (EGIV). The reduction of the five EGs to four is<br />
proposed as a way to avoid errors in assignation of species to the first or second-order opportunists<br />
EG. At the current level of knowledge, we are not able to distinguish between both order of response<br />
to disturbance.<br />
The calculation of the index is as following<br />
68<br />
MEDOCC= [(0 x % EGI + 2 x %EGII + 4 x % EGIII +6 x % E GIV)]/100<br />
Index response to the impact gradient<br />
Species MEDOCC AMBI<br />
Gouldia minima 2 1<br />
Iphinoe trispinosa 2 1<br />
Loripes lacteus 3 1<br />
Lumbrineris latreilli 3 2<br />
Magelona mirabilis 2 1<br />
Marphysa sp. 3 2<br />
Mastobranchus sp. 3 -<br />
Micronephthys maryae 3 2<br />
Pariambus typicus 2 3<br />
Parvicardium ovale 2 1<br />
Parvicardium exiguum 2 1<br />
Parvicardium juvenil 2 1<br />
Pectinaria koreni 2 4<br />
Phtisica marina 2 1<br />
Phyllodoce mucosa 2 3<br />
Plagiocardium papillosum 2 1<br />
Prionospio caspersi 2 4<br />
Pseudolirius kroyeri 3 2<br />
Retusa truncatula 1 2<br />
Retusa umbilicata 1 2<br />
Scolaricia typica 2 1<br />
Scolelepis squamata 2 3<br />
Scoloplos armiger 1 3<br />
Sigalion mathildae 1 2<br />
Sigalion squamosus 1 2<br />
Spiochaetopterus solitarius 2 3<br />
Tellina pulchella 2 1<br />
For the development of this methodology to asses the ecological status and to obtain the boundaries<br />
required by the WFD we have analysed samples from fine to muddy fine sediments from Catalonia<br />
and Balearic Islands. Although the communities’ composition in terms of ecological groups is
expected to respond to the extent of anthropogenic pressure (sensu lato), this method is developed to<br />
detect mainly organic enrichment. Plotting the MEDOCC results from our data with organic matter<br />
content in sediment, MEDOCC index shows a significant linear relationship with the pressure<br />
gradient (Figure 2.3.22).<br />
Reference conditions and class boundary setting<br />
(Catalonia and Balearic Islands, SPAIN)<br />
Reference conditions<br />
One of the problems in deriving reference conditions arises from the absence of unimpacted areas<br />
in some European regions. The WFD identifies four options for determinig reference conditions: 1)<br />
existing undisturbed sites, 2) historical data and information, 3) models, and 4) expert judgement.<br />
Option 3 and 4 have been selected to define reference sites for Catalonia and Balearic Islands,<br />
thus selecting the best situation (sample) of our dataset where the most species belong to EGI<br />
(sensitive species) and EGII (indiferent species). After choosing this “best of all” situation from<br />
our dataset, we have excluded all tolerant (EGIII) and opportunistic species (EGIV) and created a<br />
new theoretical situation where the fauna is composed of only sensitive (EGI: 90 %) and indifferent<br />
species (EGII: 10 %).<br />
Boundary Setting<br />
Class boundary values are obtained by checking community composition of sensitive/tolerant<br />
species over the MEDOCC index for the dataset (Catalonia and Balearic Islands dataset). Figure<br />
2 shows the plotting of the percentage of all EGs considered along the gradient of increasing<br />
MEDOCC index in Catalonia and Balearic Islands. The sequence of quality classes and class<br />
boundaries are interpreted in terms of shifts of ecological group percentages.<br />
The relation between MEDOCC values and the ecological status classification of the WFD is<br />
based on the ecological theory describing the communities succession in an increasing disturbance<br />
gradient followed by Glémarec & Hily (1981), Hily (1984), Majeed (1987), Grall & Glémarec<br />
(1997), and Borja et al. (2000).<br />
The five levels of ecological status in the WFD are described as below:<br />
High status: “The level of diversity and abundance of invertebrate taxa is within the range<br />
normally associated with undisturbed conditions. All the disturbance-sensitive taxa associated<br />
MEDOCC<br />
6.00<br />
5.00<br />
4.00<br />
3.00<br />
2.00<br />
1.00<br />
r=0.362 p
with undisturbed conditions are present”. This could be associated to normal or unpolluted benthic<br />
community, dominated by the Ecological Group I. We propose the border between high and good<br />
ecological status for MEDOCC equal to 1.6; that is, sensitive ecological group (EGI) accounting for<br />
more than 40 % of total abundances.<br />
Good status: “The level of diversity and abundance of invertebrate taxa is slightly outside the<br />
range associated with the type-specific conditions. Most of the sensitive taxa of the type-specific<br />
communities are present”. This could be associated to unbalanced or slightly polluted benthic<br />
community, dominated by the Ecological Group III. The border between good and moderate<br />
ecological status is 3.2 for MEDOCC index; in this case tolerant ecological group (EGIII) accounts<br />
for 20-50 %, but sensitive taxa (EGI) are also present (10-40 %).<br />
Moderate status: “The level of diversity and abundance of invertebrate taxa is moderately outside<br />
the range associated with the type-specific conditions. Taxa indicative of pollution are present”. This<br />
could be associated to a transitional benthic community, dominated by the Ecological Group III and<br />
IV. We propose that tolerant ecological group (EGIII) accounting for nearly 50 % and opportunistic<br />
taxa accounting less than 45 %. The border value between moderate and poor ES is 4.77 for<br />
MEDOCC.<br />
Poor status: “… the relevant biological communities deviate substantially from those normally<br />
associated with the surface water body type under undisturbed conditions”. This could be associated<br />
to polluted areas, dominated by the Ecological Group IV but still with some presence of species<br />
belonging to the ESIII. We propose that the opportunistic ecological group (EGIV) accounts for<br />
more than 45 %. The border between poor and bad ecological status is 5.5 for MEDOCC index.<br />
Bad status: “… In which large portions of the relevant biological communities normally associated<br />
with the surface water body type under undisturbed conditions are absent”. It includes areas heavily<br />
polluted and azoic sediments. We propose that opportunistic ecological group (EGIV) accounting<br />
for more than 80 %.<br />
Thus, the ranges of the MEDOCC index and Boundaries obtained for Catalonia and Balearic Islands<br />
data following the ecological theory are showed in Table 2.3.8. Boundaries are obtained rescaling<br />
MEDOCC values (between 0-6) from 1 to 0.<br />
70<br />
Figure 2.3.23: MEDOCC values relating to the percentages of the ecological groups for<br />
the Catalonia and Balearic Islands dataset. Vertical lines show boundaries of the different<br />
ecological status. H: High ecological status; G: good ES; M: moderate ES; P: poor ES; and<br />
B: bad ES. I: Sensitive species; II: indifferent species; III: tolerant species; IV: opportunistic<br />
species.
Table 2.3.8: MEDOCC index and EQRs obtained for Catalonia and Balearic Islands.<br />
Ecological Status MEDOCC values (6-0) Boundaries (0-1)<br />
High (0
BENTIX/MEDOCC<br />
The MEDOCC was compared with BENTIX. The EQR values for our data applying BENTIX index<br />
were obtained by Mika Simboura. The BENTIX limits between ES were selected from the boundary<br />
setting protocol elaborated by Greece (Table 2.3.9). Figure 2.3.24 shows a linear relationship<br />
statistically significant (r=0.714; p
Percentage (%)<br />
70<br />
60<br />
50<br />
40<br />
30<br />
20<br />
10<br />
0<br />
H G M P B<br />
Figure 2.3.25: Relative frequency distribution of Ecological Status (High, Good, Moderate, Poor, and Bad) of Catalonia<br />
and Balearic Islands data with BENTIX and MEDOCC indexes.<br />
M-AMBI/MEDOCC<br />
The MEDOCC was compared with M-AMBI. M-AMBI uses a factorial analysis to determine<br />
the distance of each station from the two extreme situations (reference conditions bad and high).<br />
Various sets of reference conditions were tested for highest values. Finally we decided to select the<br />
maximum values encountered in real data, as it was chosen in MEDOCC index. The highest values<br />
were: AMBI= 0.14; R=100; H’=5.54. Bad reference conditions were: AMBI=6; R=0; H’=0.<br />
The M-AMBI limits between ES were selected from Borja et al. (2007) (Table 2.3.10). The two<br />
indices were compared showing a linear relationship statistically significant (r=0.517; p
with one index but “good” ES for the other. Anyway, the number of stations in critical situation,<br />
thus is is “moderate”, “poor”, and “bad” ES for one of the methods and “high” or “good” for the<br />
other is low: 6.7 %. Figure 2.3.27 shows the comparison of Ecological Status classification results<br />
for Catalonia and Balearic Islands with MEDOCC and M-AMBI index.<br />
We believe that the slight relationship between both methods could be related mainly to the<br />
assignation of the boundaries, which, as we have explained above, they have to be obtained from<br />
each dataset depending on the evolution of the ecological groups considered. This disagreement is<br />
understandable if we observe the boundary for “H-G” ES considered for M-AMBI in Table 2.3.10.<br />
Selecting an elevated EQR value for H-G ES (=0.85) enhance the high number of stations classified<br />
as “good” for M-AMBI in the Figure 5; this result is the main responsible of the disagreement.<br />
Anyway, we also think that the inclusion in the multivariate method of the diversity index and<br />
species richness worsen the results, as those indexes change depending on other environmental<br />
variables and they are not necessarily related to the degree of habitat disturbance. As an example,<br />
Percentage (%)<br />
74<br />
90<br />
80<br />
70<br />
60<br />
50<br />
40<br />
30<br />
20<br />
10<br />
0<br />
Figure 2.3.24: Comparison between MAMBI and MEDOCC EQRs with the class boundaries.<br />
Shady areas show the space where the two methods have the same status classification.<br />
MEDOCC<br />
M-AMBI<br />
H G M P B<br />
Figure 2.3.27: Relative frequency<br />
distribution of Ecological Status<br />
of Catalonia and Balearic Islands<br />
data with M-AMBI and MEDOCC<br />
indexes.
the station with “bad” ES classification using both methods shows similar values in H’ and species<br />
richness to that of other stations classified as “high” ES.<br />
2.3.4 Results of the comparison<br />
Each country has tested the different methods with their own data applying boundaries established<br />
by each method. Moreover, they compared the ecological status obtained with the different methods<br />
in order to know the percentage of agreement. Results are described, for each country.<br />
2.3.5 Results of the harmonisation – Boundary EQR values<br />
Member<br />
State<br />
Method<br />
Boundary<br />
High/Good (EQR)<br />
Cyprus Bentix 0.75 0.58<br />
France<br />
Multimetric approach (AMBI, Shannon Diversity,<br />
BQI Trophic Index)<br />
Greece Bentix 0.75 0.58<br />
Italy<br />
AMBI with factor analysis<br />
Bentix<br />
Slovenia M-AMBI (AMBI, Shannon Diversity, S) 0,83 0,62<br />
Spain -<br />
Catalunya<br />
Spain-<br />
MEDOCC index 0.73 0.47<br />
Balearic is. MEDOCC index 0.73 0.47<br />
Boundary<br />
Good/Moderate (EQR)<br />
2.3.6 Open issues and need for further work<br />
For all: need to consider different sub-regions (eastern, western Med), and to develop analysing<br />
tools (multimetric indices) for hard bottom substrates.<br />
Still some comparison/harmonization between methods should be done.<br />
For Italy: Application of MEDOCC methods to Italian data, in collaboration with Spanish colleagues.<br />
In the attempt of taking into account the variability of Italian coastal areas, a classification of the<br />
benthic invertebrates stations using the same method used by the MED GIG phytoplankton group for<br />
typologies will be tested. Coastal sites are characterized according to different freshwater influence:<br />
Type 1, coastal sites highly influenced by freshwater inputs; Type 2, coastal sites not directly affected<br />
by freshwater inputs; Type 3, coastal sites not affected by freshwater inputs. Development of RC for<br />
each of these typologies will be assessed.<br />
For Spain: Future work has to be focussed in the harmonization of boundaries. Although a<br />
comparison of the results of the ecological status with the different methodologies has been<br />
performed, the boundaries obtained by each member state have not been harmonized to get a better<br />
agreement. The base of this exercise must to be focused on the agreement around the definition of the<br />
conditions of the different Ecological Status.<br />
2 countries (France and Italy) are working on the methods to be used as national: either adopting<br />
one method used in other countries or developing their own.<br />
75
2.4<br />
2.4.1<br />
76<br />
NE Atlantic GIG<br />
Intercalibration approach<br />
In the NE Atlantic seven basic <strong>intercalibration</strong> types have been agreed. These are shown in table<br />
2.4.1 below:<br />
Table 2.4.1: NEA GIG Intercalibration Types.<br />
New Type ID Name Salinity Tidal range (m) Depth (m) Current<br />
velocity<br />
(knots)<br />
CW –NEA1/26 Exposed or sheltered,<br />
euhaline, shallow<br />
CW – NEA3/4 Polyhaline, exposed or<br />
moderately exposed<br />
(Wadden Sea type)<br />
CW – NEA7 Deep, low current,<br />
sheltered<br />
CW – NEA8 Polyhaline, microtidal,<br />
sheltered, shallow<br />
(Skagerrak inner arc<br />
type)<br />
CW – NEA9 Fjord with a shallow<br />
sill at the mouth with<br />
a very deep maximum<br />
depth in the central<br />
basin with poor<br />
deepwater exchange.<br />
CW – NEA10 Polyhaline, microtidal<br />
exposed, deep<br />
(Skaggerak outer arc<br />
type)<br />
Fully saline<br />
(> 30)<br />
Polyhaline<br />
(18 - 30)<br />
Fully saline<br />
(> 30)<br />
Polyhaline<br />
(18 - 30)<br />
Polyhaline<br />
(18 - 30)<br />
Polyhaline<br />
(18 - 30)<br />
TW – NEA11 Transitional waters Oligo-<br />
Euhaline<br />
(0 - 30)<br />
Mesotidal<br />
(1 - 5)<br />
Mesotidal<br />
(1 - 5)<br />
Mesotidal<br />
(1 - 5)<br />
Microtidal<br />
(< 1)<br />
Microtidal<br />
(< 1)<br />
Microtidal<br />
(< 1)<br />
Mesotidal<br />
(1 – 5 )<br />
Shallow<br />
(< 30)<br />
Shallow<br />
(< 30)<br />
Deep<br />
(> 30)<br />
Shallow<br />
(< 30)<br />
Deep<br />
(> 30)<br />
Deep<br />
(> 30)<br />
Shallow<br />
(< 30)<br />
Medium<br />
(1 - 3)<br />
Medium<br />
(1 - 3)<br />
Low<br />
(< 1)<br />
Low<br />
(< 1)<br />
Low<br />
(< 1)<br />
Low<br />
(< 1)<br />
Exposure Mixing Residence<br />
time<br />
Exposed or<br />
sheltered<br />
Exposed or<br />
moderately<br />
exposed<br />
Medium Sheltered or<br />
moderately<br />
Exposed<br />
Fully mixed Days<br />
Fully mixed Days<br />
Sheltered Fully mixed Days<br />
Sheltered Partially<br />
Stratified<br />
The above types occur in Member States’ waters as detailed below in table 2.4.2:<br />
Table 2.4.2: Member States sharing types.<br />
Sheltered Permanently<br />
Stratified<br />
Exposed Permanently<br />
Stratified<br />
Partially- or<br />
Permanently<br />
Stratified<br />
Type BE DE DK ES FR IE NL NO PT SE UK<br />
CW – NEA1/26 X X X X X X X X X X<br />
CW – NEA3/4 x x<br />
CW – NEA7 x X<br />
CW – NEA8 x x X<br />
CW – NEA9 x x<br />
CW – NEA10 x x<br />
TW – NEA11 X X X X X X X X<br />
Days-<br />
Weeks<br />
Weeks<br />
Days<br />
Days-<br />
Weeks
For benthic invertebrates, all classification schemes intercalibrated relate only to the soft sediment<br />
infauna component. Member States use the same classification schemes in all their types.<br />
Differences occur in the reference conditions for the types; these are specific for the habitat type,<br />
and for some Member States (NL and DE), sometimes even specific for the water body. However,<br />
the basic metrics in each country’s scheme remains the same. As Option 3 has been used, the<br />
classification schemes are compared at the type level and boundaries set that are specific to<br />
particular types. This process is described below.<br />
2.4.2 National methods intercalibrated<br />
The national methods that have been assessed in this <strong>intercalibration</strong> exercise are shown in table<br />
2.4.3 below:<br />
Table 2.4.3: Member States national methods.<br />
Member State Method Status<br />
BE Benthic Ecosystem Quality Index (BEQI) 1 Agreed<br />
DE Multimetric Factorial Analysis (M-AMBI) Agreed<br />
DK Danish Quality Index (DKI) Agreed<br />
ES Multimetric Factorial Analysis (M-AMBI) Agreed<br />
FR Multimetric Factorial Analysis (M-AMBI) Agreed<br />
IE Infaunal Quality Index (IQI) Agreed<br />
NL Benthic Ecosystem Quality Index (BEQI) 1 Agreed<br />
NO Norwegian Quality Index (NQI) Agreed<br />
PT Portuguese Benthic Assessment Tool (P-BAT) Agreed<br />
SE Biological Quality Index (BQI) Agreed<br />
UK Infaunal Quality Index (IQI) Agreed<br />
NB. BEQI 1 -For the <strong>intercalibration</strong> exercise, only the level 3 of BEQI (within habitat quality) is applied.<br />
2.4.3<br />
Reference conditions and class boundary setting<br />
Type - NEA1/26 and NEA7<br />
Reference Conditions<br />
DE, DK, ES, IE, NO, PT, UK<br />
As Option 3 has been selected for the <strong>intercalibration</strong> of this quality element each Member State has<br />
derived biological reference conditions for the indices within their classification systems. Reference<br />
conditions are specific for habitat sampled and sampling method. For this <strong>intercalibration</strong> exercise,<br />
all Member States used reference conditions that relate to subtidal, mud/sand habitats and these<br />
are described below in table 2.4.4. (If different habitats were to be assessed, alternative reference<br />
conditions would need to be used.)<br />
General physico-chemical and hydromorphological reference conditions for all types have not been<br />
defined.<br />
77
Table 2.4.4: Reference conditions.<br />
78<br />
MS Method Sample area<br />
(m 2 )<br />
Component metrics - reference values Combined<br />
reference value<br />
Taxa no. Diversity AMBI<br />
DK DKI Shannon’s<br />
(logbase2) = 5<br />
ES M-AMBI 42 Shannon’s = 4 1<br />
IE IQI 0.1 68 Simpsons = 0.97 1-AMBI/7 = 0.96<br />
NO NQI 0.4 0.78<br />
PT P-BAT 0.1 Shannon’s = 4.1<br />
Margarlef = 5<br />
UK IQI 0.1 68 Simpsons = 0.97 1-AMBI/7 = 0.96<br />
DE<br />
Reference values used for the Intercalibration of the German M-AMBI classification methods are<br />
specific for waterbody and habitat type. Because no regional reference sites or sample data were<br />
available DE used reference values from NL database, which is based on similar habitats and shown<br />
in table 2.4.5 below. Germany will generate own local reference data within Phase 2.<br />
Table 2.4.5: DE reference conditions.<br />
Method <strong>Water</strong>Body Component metrics - reference values<br />
Taxa no.<br />
Diversity<br />
Shannon’s<br />
AMBI<br />
M-AMBI Vortrapptief, (NEA 1 subtidal 18m), fine sand - sand 31 2.66 0.107<br />
M-AMBI Hoher Weg (NEA 26), low, littoral sand) 17 2.22 0.393<br />
NL/BE<br />
The BEQI method (used by NL and BE) requires a reference dataset for each habitat within a water<br />
body. The requirement of a reference dataset is different from the other MS multimetrics, which<br />
only require a (maximal) reference value for a specified habitat. The reference values are also<br />
related to sampling surface (determined by a randomisation procedure) and defined for each WFD<br />
boundary.<br />
NL: The reference values for reaching good status (good/moderate boundary, sampling surface of<br />
1m2 ) for the fine muddy sand coastal habitat of the Dutch coast (Hollandse kust and Waddenkust)<br />
are summarised in table 2.4.6 below.<br />
Table 2.4.6: NL reference conditions.<br />
Habitat type Sampling<br />
surface<br />
Dutch coast (fine<br />
muddy sand Q1)<br />
No. of species Similarity Density (ind/<br />
m 2 )<br />
0<br />
0<br />
Biomass<br />
(gAFDW/ m 2 )<br />
1 m 2 60 0.74 2584 and 7975 14.2 and 52.4
Reference conditions correspond to assessment class Good/Moderate. Reference values are based<br />
on the habitat type Q1 cluster of stations within six nautical miles from the coast, using samples<br />
between 1983 and 1990.<br />
N.B. The analysis of the benthic communities of Hollandse kust and Waddenkust did not reflect<br />
differences related with the current WFD typology: Hollandse kust (NEA3) and Waddenkust (NEA<br />
1). The typology differences between the areas only reflect the polyhaline versus euhaline water<br />
characteristics. As such in the <strong>intercalibration</strong> exercise, the Hollandse kust and Waddenkust and<br />
Eems-Dollard kust are taken together in the NEA 1 type <strong>intercalibration</strong> comparison.<br />
BE: The reference values for reaching good status (good/moderate boundary) for the fine muddy sand<br />
coastal habitat (for the minimal sampling surface of 1.5 m²) are summarised below in table 2.4.7.<br />
Table 2.4.7: BE reference conditions.<br />
Habitat type Sampling<br />
surface<br />
No. of species Similarity Density (ind/m2 ) Biomass (gAFDW/ m2 )<br />
Fine muddy sand<br />
– Abra alba community<br />
1.5 m2 60 0.84 1516 and 5394 Not yet determined<br />
Too few data were available in the Belgian WFD benthos dataset to determine the reference<br />
conditions for the other habitats; this could only be done for the Abra alba community. In fact,<br />
the habitat typology of the Belgian continental shelf is based on four different macrobenthic<br />
communities with typical species associations in between. The reference values for the three<br />
other communities will have to be determined in future research on historical data or monitoring<br />
in the future. The communities are each characterised by different habitat specifications as briefly<br />
illustrated below.<br />
Macrobenthic communities (habitats):<br />
– Abra alba community: shallow muddy sand<br />
– Nephtys cirrosa community: well-sorted mobile sands<br />
– Ophelia limacina – Glycera lapidum community: medium to coarse sand<br />
– Macoma balthica community: shallow sandy mud<br />
The macrobenthos status classification will have to be performed for these four communities<br />
separately, based on community-oriented monitoring, to come to an overall macrobenthos<br />
assessment for the Belgian coastal waters.<br />
Some important issues and difficulties to be highlighted:<br />
The Belgian reference data for the different habitats is gathered in the period 1994 – 2000 and<br />
comes not from a `natural, undisturbed` reference period, as required by the WFD. However, this<br />
reference dataset aims to give a reflection of the spatial and temporal variability within the habitats<br />
Using the BEQI method, reference values for species richness, species composition and density<br />
have been given for one community. Reference biomass data is not yet available.<br />
Class Boundary Setting Procedure<br />
As Option 3 has been used, Member States have derived their own initial boundaries for the<br />
National classification methodology.<br />
Two examples of boundary setting procedures are as follows for i) the IQI (sample level procedure)<br />
and ii) the BEQI (waterbody level procedure incorporating biomass):<br />
i) Infaunal Quality Index (IQI)<br />
79
The Infaunal Quality Index (IQI) operates over a scale range from 0 (impacted) to 1 (non-impacted).<br />
Initially, class boundaries were set at equidistant points along the scale (0.2, 0.4, 0.6, and 0.8). These<br />
boundaries were then modified to ensure that the communities conform to the status characteristics<br />
as defined in the Normative Definitions. Figure 2.4.1 illustrates the process followed in setting and<br />
testing the ecological status boundaries.<br />
Figure 2.4.1: Flow diagram of stepwise process followed to establish boundaries for each status class which reflect the<br />
Normative Definitions.<br />
80<br />
Benthic Invertebrate Abundance Dataset<br />
Calculate IQI (Infaunal Quality<br />
Index) for each sample:<br />
IQI<br />
IQI<br />
IQI 0.1<br />
( ( 0.38×<br />
AMBI ) + ( 0.08×<br />
1 − λ' ) + ( 0.54×<br />
S ) − 0.4)/0.6<br />
No<br />
Calculate the 1st and<br />
3rd quartiles for each<br />
status class<br />
Assess the<br />
quartiles as in *<br />
above<br />
Adjust the status<br />
class boundaries<br />
towards the 1st<br />
and/or 3rd<br />
quartile so taxa<br />
composition fits<br />
with Normative<br />
Definitions<br />
%<br />
Intercalibration <strong>technical</strong> <strong>report</strong><br />
– Part 3 Coastal/Transitional,<br />
Section 2 Benthic Invertebates<br />
In each status class assess*<br />
AMBI ecological group<br />
proportions<br />
Taxa abundances using<br />
SIMPER analysis<br />
Breakdown of Phyla, Class,<br />
Order, Family and Genus<br />
using SIMPER analysis and<br />
reference to MNCR habitat<br />
characterising taxa<br />
100<br />
80<br />
60<br />
40<br />
20<br />
0<br />
Does the taxa<br />
composition in each<br />
status class fit with<br />
Normative<br />
Definitions?<br />
AMBI group proportions at the upper and lower quartiles of each status class<br />
BQ1<br />
B<br />
BQ3<br />
PQ1<br />
P<br />
PQ3<br />
MQ1<br />
M<br />
MQ3<br />
GQ1<br />
G<br />
Status class (Quartile 1 and 3 indicated)<br />
GQ3<br />
HQ1<br />
H<br />
HQ3<br />
I<br />
II<br />
III<br />
IV<br />
V<br />
Set equidistant boundaries<br />
within the IQI range for<br />
each status class.<br />
STATUS IQI range<br />
High >0.8<br />
Good 0.6-0.8<br />
Moderate 0.4-0.6<br />
Poor 0.2-0.4<br />
Bad
The class boundaries were set using samples from an organic enrichment gradient; the sewage<br />
sludge disposal site at Garroch Head (data courtesy of the Fisheries Research Services, Scotland).<br />
Benthic invertebrate abundance data had been obtained across the pressure gradient annually over<br />
a 20-year period (total of 186 samples). The samples were taken from habitats classified as type<br />
A5.3 (marine sublittoral muds) under the European Nature Information System (EUNIS) habitat<br />
classification scheme.<br />
The IQI, which is comprised of three indicators of benthic ecosystem health (Simpson’s evenness,<br />
taxa number, AZTI Marine Biotic Index (AMBI)), was calculated for all samples.<br />
The IQI is calculated as:<br />
IQI = ((0.38× AMBIIQI )+ (0.08×1 − λ’ IQI )+ (0.54×SIQI 0.1 )− 0.4)/0.6<br />
Where:<br />
AMBIIQI = Observed value of (1-AMBI/7) divided by maximum expected value under reference<br />
conditions for a given habitat type.<br />
1-λ’ IQI = Observed value of Simpsons evenness index (1-λ’) divided by the maximum expected<br />
value under reference conditions for a given habitat type.<br />
S IQI = Observed number of taxa divided by the maximum expected value under reference<br />
conditions for a given habitat type.<br />
AMBI assigns taxa a sensitivity score (ecological group, EG) as follows: EG I – sensitive taxa,<br />
EG II – indifferent taxa, EG III – tolerant, EG IV – opportunistic, EG V – indicator taxa. The<br />
composition of an assemblage in terms of ecological groups is expected to respond to the extent of<br />
anthropogenic pressure (e.g. Figure 2.4.2). The proportions of sensitive taxa, tolerant taxa and taxa<br />
indicative of pollution were used to establish class boundaries.<br />
PERCENTAGE OF GROUPS<br />
POLLUTION<br />
WFD<br />
100<br />
90<br />
80<br />
70<br />
60<br />
50<br />
40<br />
30<br />
20<br />
10<br />
0<br />
0<br />
I<br />
II<br />
III<br />
BIOTIC COEFFICIENT<br />
1 2 3 4 5<br />
6<br />
0 1 2 3 4 6 5 7<br />
UNPOLLUTED<br />
HIGH<br />
STATUS<br />
SLIGHTLY POLLUTED<br />
GOOD<br />
STATUS<br />
BIOTIC INDEX<br />
INCREASING POLLUTION<br />
Figure 2.4.2: The AMBI biotic coefficient, relating the ecological groups present in a sample to an assessment of the<br />
benthic invertebrate community (Borja et al, 2003).<br />
IV<br />
MEANLY POLLUTED<br />
MODERATE<br />
STATUS<br />
POOR<br />
STATUS<br />
V<br />
HEAVILY<br />
`POLLUTED<br />
AZOIC SEDIMENT<br />
EXTREM.<br />
POLLUTED<br />
BAD<br />
STATUS<br />
81
Using equidistant class boundaries initially, AMBI ecological group proportions in the gradient<br />
dataset were POLLUTION assessed as to whether the proportions of sensitive MEANLY taxa, tolerant POLLUTEDtaxa<br />
HEAVILY<br />
UNPOLLUTED SLIGHTLY POLLUTED<br />
and taxa<br />
`POLLUTED<br />
indicative of pollution were in line with the Normative Definition for each status class (Figure<br />
2.4.3).<br />
The boundaries were then adjusted to ensure they captured the sampling occasions that provided<br />
INCREASING POLLUTION<br />
the highest agreement with the Normative Definitions. This was achieved by plotting the ecological<br />
group proportions within the first and third quartiles of each status (Figure 2.4.4) and adjusting the<br />
boundaries until agreement with the Normative Definitions was maximised.<br />
The validity of the adjusted boundaries was then assessed by analysis of the composition of the<br />
taxa in each status class. SIMPER analysis (PRIMER©) was carried out, assessing the top 90 %<br />
%<br />
82<br />
100<br />
80<br />
60<br />
40<br />
20<br />
0<br />
%<br />
100<br />
80<br />
60<br />
40<br />
20<br />
0<br />
PERCE<br />
WFD<br />
20<br />
10<br />
B<br />
0<br />
P<br />
Figure 2.4.3: The proportions of AMBI ecological groups for each ecological status class (B<br />
= Bad, P = Poor, M = Moderate, G = Good, H = High) as determined by an equidistant split of<br />
the IQI.<br />
II<br />
0 1 2 3 4 6 5 7<br />
HIGH<br />
STATUS<br />
GOOD<br />
STATUS<br />
M<br />
Status<br />
BIOTIC INDEX<br />
G<br />
MODERATE<br />
STATUS<br />
EG I<br />
EG II<br />
EG III<br />
EG IV<br />
EG V<br />
H<br />
IV<br />
POOR<br />
STATUS<br />
EG I<br />
EG II<br />
EG III<br />
EG IV<br />
EG V<br />
BQ1 B BQ3 PQ1 P PQ3 MQ1 M MQ3 GQ1 G GQ3 HQ1 H HQ3<br />
Status class (Quartile 1 and 3 indicated)<br />
Figure 2.4.4: AMBI group proportions of status classes (B = Bad, P = Poor, M = Moderate, G = Good, H = High) and<br />
their upper (Q3) and lower (Q1) quartiles using preliminary equidistant divisions of the IQI.<br />
AZO<br />
EXTREM.<br />
POLLUTED<br />
BAD<br />
STATUS
of contributing taxa (family level taxonomic discrimination). Changes in composition between the<br />
status classes were evaluated to determine whether the adjusted ranges mirrored the Normative<br />
Definitions in terms of contributing taxa. In addition, the Marine Nature Conservation Review<br />
(MNCR) Habitat <strong>Directive</strong> types were used to ensure an understanding of the characterising taxa<br />
and their composition expected for a particular habitat type.<br />
The resulting IQI boundaries and are shown in table 2.4.8 and AMBI group proportions in Figure<br />
2.4.5 respectively.<br />
ii) Benthic Ecosystem Quality Index (BEQI)<br />
The BEQI statistically integrates the risk of misclassification at water body level related to sample<br />
size in the methodology and boundary setting. Based on permutation calculations, reference values<br />
are determined for each component metric and class boundary.<br />
The reference values are calculated per habitat over increasing sampling surfaces. This allows<br />
for the estimation of the reference value for any given sampling surface. The reference for a 1m 2<br />
sampling surface is based on a set of 2000 artificial random samples out of the reference dataset.<br />
Out of the randomisation procedure, each component metric (indicators: density, biomass, species<br />
richness, species composition changes), a 5 th percentile value is selected as the value that has to be<br />
reached to achieve good status (the value of the good/moderate boundary) (Figure 2.4.6).<br />
%<br />
Table 2.4.8: Class Status boundaries – IQI assessment<br />
(prior to optimisation through the Intercalibration exercise).<br />
100<br />
80<br />
60<br />
40<br />
20<br />
0<br />
Status Class Boundary IQI<br />
High/ Good 0.80<br />
Good/ Moderate 0.65<br />
Moderate/ Poor 0.43<br />
Poor/ Bad 0.20<br />
B<br />
P<br />
M<br />
Status<br />
Figure 2.4.5: AMBI group proportions within each status based on the Garroch Head data<br />
using the following boundaries: High/Good =0.8; Good/Moderate = 0.65; Moderate/Poor =<br />
0.43; Poor/Bad = 0.2.<br />
G<br />
H<br />
EG I<br />
EG II<br />
EG III<br />
EG IV<br />
EG V<br />
83
number of species<br />
For the parameters density and biomass, a two side deviation from the reference values is scored<br />
(Figure 2.4.7). The other boundary values were adopted from this value (equal intervals), except the<br />
high/good reference value, which is also directly extracted from the randomisation procedure.<br />
84<br />
50<br />
40<br />
30<br />
20<br />
10<br />
0<br />
0.02<br />
0.25<br />
poor<br />
moderate<br />
good<br />
high<br />
0.47<br />
0.7<br />
0.92<br />
1.15<br />
High status (1 – 0.8) (1 : – median 0.8) : median<br />
1.37<br />
1.6<br />
1.82<br />
2.05<br />
2.27<br />
2.5<br />
2.72<br />
sampling surface (m 2)<br />
the percentile<br />
Good status status (0.6 -0.8): (0.6 5-<br />
0.8): 5 the percentile<br />
Moderate status status (0.4 – 0.6): (0.4 2/3 – of 0.6): good boundary 2/3 of good value boundary value<br />
Poor status status (0.2 – (0.2 0.4): 1/3 – 0.4): of good 1/3 boundary of good valueboundary<br />
value<br />
Bad status (0 – 0.2) (0 – 0.2)<br />
Figure 2.4.6: The boundary settings for number of species in relation to sampling surface. A similar protocol is applied<br />
for similarity (species composition changes).<br />
ind./m 2 (fourth root)<br />
14<br />
12<br />
10<br />
8<br />
6<br />
4<br />
2<br />
0<br />
0.02<br />
0.25<br />
0.47<br />
0.70<br />
0.92<br />
Bad status (0 – (0 0.2): – 0.2): < 2 x < good 2 x good boundaryvalue boundary value<br />
Poor status (0.2 (0.2 – 0.4): – 0.4): < 5/3 < of 5/3 good of boundary good boundary value value<br />
Moderate status (0.4 (0.4 – 0.6): – 0.6): < 4/3 < of 4/3 good of good boundaryvalue<br />
High status (1 – (1 0.8) – 0.8) : between : between 25 25 ste ste steand and 75 75ste ste percentile<br />
Good status (0.6 (0.6 -0.8): -0.8): > 2.5><br />
2.5 thepercentile Moderate status (0.4 – 0.6): > 2/3 of good boundary value<br />
the percentile<br />
Moderate status (0.4 – 0.6): > 2/3 of good boundary value<br />
1.15<br />
1.37<br />
1.60<br />
1.82<br />
2.05<br />
Sampling surface (m2 )<br />
Figure 2.4.7: The boundary settings for density in relation to sampling surface. A similar protocol is applied for<br />
biomass.<br />
2.27<br />
2.50<br />
2.72<br />
2.95<br />
2.95<br />
3.17<br />
3.17<br />
3.4<br />
Good status (0.6 (0.6 -0.8): -0.8): < 97.5 < 97.5 thepercentile the percentile<br />
Poor status (0.2 (0.2 – 0.4): – 0.4): > 1/3 > of 1/3 good of boundary good boundary value value<br />
Bad status (0 – (0 0.2): – 0.2): < 1/3 < of 1/3 good of good boundary boundaryvalue<br />
value<br />
3.40<br />
3.62<br />
3.62<br />
3.85<br />
3.85<br />
4.07<br />
4.07<br />
4.3<br />
4.30<br />
4.52<br />
4.52<br />
4.75<br />
4.75<br />
4.97<br />
poor poor min<br />
min<br />
mod mod min<br />
min<br />
good good min<br />
min<br />
high high min<br />
min<br />
median<br />
median<br />
high high max<br />
max<br />
good good max<br />
max<br />
mod mod max<br />
max<br />
poor poor max<br />
max<br />
4.97
The boundaries selected from the randomisation procedure, with the corresponding WFD class<br />
boundaries are summarised below in table 2.4.9.<br />
Table 2.4.9: NL boundaries.<br />
Boundary No. species and species composition change Density & biomass<br />
High/Good: 0.8 Median 25 and 75 percentile<br />
Good/Moderate: 0.6 5 th percentile 2.5 th and 97.5 th percentile<br />
Moderate/Poor: 0.4 2/3 of Good/Mod value 2/3 and 4/3 of Good/Mod value<br />
Poor/Bad: 0.2 1/3 of Good/Mod value 1/3 and 5/3 of Good/Mod value<br />
The boundaries set by the BEQI method are therefore statistical significance levels related to a fixed<br />
WFD Class boundary value.<br />
Type - NEA3/4<br />
Reference Conditions<br />
Intercalibration was carried out between the BEQI (Netherlands) and the M-AMBI (Germany).<br />
Reference boundary values for four habitats of major importance in NEA3/4 types are shown below<br />
in table 2.4.10 (for G/M status).<br />
Table 2.4.10: NL and DE reference conditions.<br />
BEQI Habitat Sample<br />
surface (m 2 )<br />
No. species Similarity Density (ind/m 2 ) Biomass<br />
(gAFDW/ m 2 )<br />
High Littoral Mud 3 13 0.68 448 - 7643 4.1 - 20.6<br />
Middle Littoral<br />
Muddy Sand<br />
3 17 0.7 269 - 12063 18.4 - 58.9<br />
Low Littoral Sand 3 13 0.6 106 - 7384 4.3 - 24.3<br />
Brackish Sub<br />
Littoral<br />
3 26 0.82 1810 - 103353 18.7 - 88.8<br />
M-AMBI No. species AMBI Shannon<br />
High Littoral Mud<br />
18 2.7 2.16<br />
Middle Littoral<br />
Muddy Sand 23 0.947 2.34<br />
Low Littoral Sand<br />
17 0.393 2.22<br />
Brackish Sub-<br />
Littoral 16 1.541 2.178<br />
85
Class Boundary Setting Procedure<br />
Netherlands (BEQI): see section above for procedure described under NEA1/26.<br />
Germany (M-AMBI): The class boundaries to classify the results of the M-AMBI were set after<br />
comparison of the assessment results using the boundaries given by Muxika et al. (2007) and Spain<br />
(Intercalibration Report, 2007) with a classification by expert judgement. The boundaries were<br />
then modified to ensure that the communities conform to the status characteristics as defined in the<br />
Normative Definitions of the WFD.<br />
The High/Good boundary (0.85) was in agreement with the boundary given by Muxika et al.<br />
(2007) but higher than the value of Borja (0.77) (Intercalibration <strong>report</strong> 2007). The Good/Moderate<br />
boundary was set at 0.7, which is higher than the boundaries given by Muxika et al. (2007) (0.55)<br />
or Borja (Intercalibration <strong>report</strong> 2007) (0.53). The reference values chosen for the M-AMBI<br />
calculations were determined by NL (van Hoey et al. 2007) on a data basis including the years 1969<br />
to 1983 for the littoral Wadden Sea and the years 1988 to 1990 for the Wadden- and Eemskust.<br />
These reference datasets derived therefore from times, in which human impacts on the North Sea<br />
and the Wadden Sea were already obvious and first changes in benthic species composition and<br />
biomass were detected (e.g. Beukema 1991, Kröncke 1995). Therefore the ‘reference data do not<br />
represent an unaffected status’ and the boundaries needed adjustment. Further calculations should<br />
be carried out with references derived from own data sets of the relevant stations. The boundary<br />
G/M was set as 0.7, because for all of the chosen <strong>intercalibration</strong> stations and for many additional<br />
stations (Heyer 2007) the M-AMBI results corresponded with the expert judgement.<br />
Type - NEA8/9/10<br />
Reference Conditions<br />
Denmark, Sweden and Norway have these types.<br />
In Sweden when deriving the type-specific class boundaries, the greatest emphasis was placed on<br />
the good–moderate boundary. This boundary was primarily determined with the aid of comparative<br />
data from high–good areas. Comparative data was chosen for each national type from regions<br />
lacking local discharges; in practice areas with the highest mean BQI values existing for that type.<br />
Sequential tests identifying the level of BQI (20th percentile) where a water body significantly<br />
differs from the comparison material were made to assist in the setting of good-moderate boundary.<br />
In those types where the amount of data was insufficient, expert assessments were conducted based<br />
on existing data and data from nearby types with similar properties. Once the good–moderate<br />
boundary was determined, it was deemed acceptable to consider the area from the good–moderate<br />
boundary up to the highest observed index value in the existing type as mainly constituting a status<br />
of good. Two-thirds (2/3) of the span exceeding the good–moderate boundary was assigned a<br />
status of good, while the upper third was reserved for the status of high. The area below the good–<br />
moderate boundary was divided into three equal intervals for the remaining boundaries. It was not<br />
possible to describe reference conditions due to a lack of unaffected areas today and historical data<br />
were not collected with the same methodology as in use today. As shown above the best available<br />
data from unimpacted areas has been used as a reference in setting the boundaries. This data<br />
assumed having a status of at least good.<br />
In Denmark the Good-Moderate boundary was determined by the 5 th percentile of samples/sites<br />
classified as being in at least Good status. The High-Good boundary was set midway between the<br />
GM value and the theoretical highest index value of 1. The reference state using this approach is the<br />
highest diversity (Hmax) and the lowest<br />
86
AMBI found in the material having at least Good status from the type in question. In accordance<br />
with the normative definition concerning sensitive species the reference state is characterized by<br />
high dominance of sensitive species (Ecological group I according to the AMBI system), followed<br />
by group II. Group III and the opportunists, groups IV and V are subdominant and virtually absent<br />
respectively.<br />
In Norway the 90-percentile (the border value between the 90 % lower and 10 % higher values<br />
among all the grab samples from the reference stations) was used to quantify the reference value for<br />
the metric.<br />
Class Boundary Setting Procedure<br />
Again as Option 3 has been used Member States have derived their own initial boundaries for the<br />
national classification methodology. An example of this from Sweden is as follows:<br />
The performance of Swedish, Danish and Norwegian national methods of assessing status have been<br />
compared by Sweden on Swedish national and regional monitoring data from coastal deeper parts (><br />
20 m depth) of the Kattegat/Skagerrak area. Three steps have been carried out in this <strong>intercalibration</strong><br />
exercise, comparison of species sensitivity classifications, comparison of index values in different<br />
environments and comparison of status classification on water body level.<br />
Species classifications<br />
A major part of the Swedish (BQI), Danish (DKI, Borja et al. 2006) and Norwegian (NQI) method<br />
for classification is based on species sensitivity classifications. In the Swedish method an objective<br />
method was used to classify species sensitivity to environmental degradation. In general, few species<br />
appear in degraded areas. Thus, a species that frequently appears in species-poor environments are<br />
given a low index value compared with species that only appear in species-rich environments. We<br />
have used Hurlberts diversity index as a measure of the number of species in a sample. The species<br />
sensitivity value has been calculated as the 5th percentile of that species diversity-value frequency<br />
distribution, where each observation in the frequency distribution represents an individual’s<br />
diversity value from the sample in which that individual appeared. We have used a large amount of<br />
both Swedish and Danish data when calculating the sensitivity values.<br />
The Danish and Norwegian method uses AMBI species classifications (see Borja et al 2000). AMBI<br />
classifies species into five ecological groups, I = Sensitive, II = Indifferent, III = Tolerant, IV =<br />
Second order opportunists and V = First order opportunists.<br />
The correspondences between the two classifications are not that good. There are only small<br />
differences between distributions of sensitivity values in the ecological groups I, II, III and IV.<br />
Index correlations<br />
To see how the indices correlates the BQI, DKI and NQI was calculated in each grab sample (~0.1<br />
m 2 ) and the results where plotted against each other. The Swedish good and moderate boundary<br />
lies around a BQI value of 12 for this type. Up to this value there is an almost linear relationship<br />
but over this value DKI and NQI tends to level off while BQI continues to increase. Still there is<br />
a rather good correlation between BQI, DKI and NQI. The relationship between NQI and DKI is<br />
nearly perfect, not unexpectedly because they both use the same components i.e. AMBI.<br />
87
No of taxa<br />
No of taxa<br />
88<br />
28<br />
26<br />
24<br />
22<br />
20<br />
18<br />
16<br />
14<br />
12<br />
10<br />
8<br />
6<br />
4<br />
2<br />
0<br />
28<br />
26<br />
24<br />
22<br />
20<br />
18<br />
16<br />
14<br />
12<br />
10<br />
8<br />
6<br />
4<br />
2<br />
0<br />
Ecological group I Sensitive<br />
Rare<br />
Common<br />
0 1 2 3 4 5 6 7 8 9 10 11 12 13 14 15<br />
Sensitivity value<br />
Ecological group IV Second order opportunistic<br />
Rare<br />
Common<br />
0 1 2 3 4 5 6 7 8 9 10 11 12 13 14 15<br />
Sensitivity value<br />
No of taxa<br />
No of taxa<br />
28<br />
26<br />
24<br />
22<br />
20<br />
18<br />
16<br />
14<br />
12<br />
10<br />
8<br />
6<br />
4<br />
2<br />
0<br />
28<br />
26<br />
24<br />
22<br />
20<br />
18<br />
16<br />
14<br />
12<br />
10<br />
8<br />
6<br />
4<br />
2<br />
0<br />
Ecological group II Indifferent<br />
Rare<br />
Common<br />
0 1 2 3 4 5 6 7 8 9 10 11 12 13 14 15<br />
Sensitivity value<br />
Ecological group V First order opportunistic<br />
Rare<br />
Common<br />
0 1 2 3 4 5 6 7 8 9 10 11 12 13 14 15<br />
Sensitivity value<br />
No of taxa<br />
No of taxa<br />
28<br />
26<br />
24<br />
22<br />
20<br />
18<br />
16<br />
14<br />
12<br />
10<br />
8<br />
6<br />
4<br />
2<br />
0<br />
28<br />
26<br />
24<br />
22<br />
20<br />
18<br />
16<br />
14<br />
12<br />
10<br />
8<br />
6<br />
4<br />
2<br />
0<br />
Ecological group III Tolerant<br />
Rare<br />
Common<br />
0 1 2 3 4 5 6 7 8 9 10 11 12 13 14 15<br />
Sensitivity value<br />
Ecological group not assigned<br />
Rare<br />
Common<br />
0 1 2 3 4 5 6 7 8 9 10 11 12 13 14 15<br />
Sensitivity value<br />
Figure 2.4.8: Swedish sensitivity values in different ecological groups. Only species found in the Swedish coastal part<br />
of deeper (> 20 m depth) areas in the Kattegat/Skagerrak are included in the comparison. Common taxa, found in more<br />
than 500 samples, are indicated with purple color.<br />
DKI<br />
1<br />
0,8<br />
0,6<br />
0,4<br />
0,2<br />
0<br />
y = 6E- 3 - 0,0043x 2 +<br />
R 2 = 0,7872<br />
0 5 10 15 20<br />
BQI<br />
Figure 2.4.9: Correlation between BQI, DKI and NQI.<br />
NQI<br />
1<br />
0,8<br />
0,6<br />
0,4<br />
0,2<br />
0<br />
y = 0,0002x 3 - 0,0077x 2 + 0,1272x<br />
R 2 = 0,7532<br />
0 5 10 15 20<br />
BQI<br />
NQI<br />
1<br />
0,8<br />
0,6<br />
0,4<br />
0,2<br />
0<br />
y = 0,8204x + 0,1515<br />
R 2 = 0,9214<br />
0 0,2 0,4 0,6 0,8 1<br />
DKI<br />
To compare how the indices behaves in different disturbed situations plots were made on data from<br />
the deepest part of the Gullmar fjord where low oxygen levels have affected the fauna at several<br />
occasions and data from the Saltkälle fjord where organic loading have decreased and fauna<br />
recolonized after closure of a sulphite mill factory in 1966.<br />
In both of these examples the BQI, DKI and NQI behaves similarly, only minor differences can be<br />
seen.
DKI and NQI<br />
0,8<br />
0,6<br />
0,4<br />
0,2<br />
0,0<br />
BQI<br />
DKI<br />
NQI<br />
1980 1985 1990 1995 2000 2005<br />
Figure 2.4.10: Comparison of index response to low oxygen content at Alsbäck 118 m depth in Gullmar fjord on the<br />
Swedish west coast. The indices are shown with standard error of the mean. Data from monitoring programmes and<br />
Agrenius pers comm.<br />
BQI<br />
BQI<br />
BQI<br />
16<br />
14<br />
12<br />
10<br />
8<br />
6<br />
4<br />
2<br />
L6<br />
0<br />
0,0<br />
1965 1970 1975 1980 1985 1990 1995 2000<br />
16<br />
14<br />
12<br />
10<br />
8<br />
6<br />
4<br />
2<br />
L11<br />
BQI<br />
DKI<br />
NQI<br />
0<br />
0,0<br />
1965 1970 1975 1980 1985 1990 1995 2000<br />
18<br />
16<br />
14<br />
12<br />
10<br />
8<br />
6<br />
4<br />
2<br />
L18<br />
BQI<br />
DKI<br />
NQI<br />
BQI<br />
DKI<br />
NQI<br />
0<br />
0,0<br />
1965 1970 1975 1980 1985 1990 1995 2000<br />
0,8<br />
0,6<br />
0,4<br />
0,2<br />
0,8<br />
0,6<br />
0,4<br />
0,2<br />
0,8<br />
0,6<br />
0,4<br />
0,2<br />
DKI and NQI<br />
DKI and NQI<br />
DKI and NQI<br />
Figure 2.4.11: Comparison of index response to decreased organic load after closure of sulphite mill factory in 1966.<br />
Stations L6, L9, L11, L12 and L18 are shown with increasing depth (25 – 44 m) and increasing distance to discharge<br />
from river Örekilsälven in the inner part of the Saltkällefjord on the Swedish west coast. Station L9 had a low value in<br />
1988 due to a temporary drop in oxygen concentration. The indices are shown with standard error of the mean. Data<br />
from Bagge 1969, Leppäkoski 1975, Rosenberg 1972, 1973, 1976 and monitoring programmes.<br />
BQI<br />
BQI<br />
16<br />
14<br />
12<br />
10<br />
8<br />
6<br />
4<br />
2<br />
L9<br />
BQI<br />
DKI<br />
NQI<br />
0<br />
0,0<br />
1965 1970 1975 1980 1985 1990 1995 2000<br />
16<br />
14<br />
12<br />
10<br />
8<br />
6<br />
4<br />
2<br />
L12<br />
BQI<br />
DKI<br />
NQI<br />
0<br />
0,0<br />
1965 1970 1975 1980 1985 1990 1995 2000<br />
14<br />
12<br />
10<br />
8<br />
6<br />
4<br />
2<br />
0<br />
BQI<br />
0,8<br />
0,6<br />
0,4<br />
0,2<br />
0,8<br />
0,6<br />
0,4<br />
0,2<br />
DKI and NQI<br />
DKI and NQI<br />
89
BQI<br />
<strong>Water</strong> body status<br />
To compare the assessment of status of water bodies’ national indices and boundaries were applied<br />
on data from a selection of Swedish water bodies with at least 5 stations sampled in a year. Denmark<br />
and Norway has not yet presented any method for how to go from sample to water body level so<br />
for comparison the mean value of DKI and NQI were compared with the 20 th percentile of BQI<br />
according to the Swedish method.<br />
Comparisons on time series from three water bodies have been made. The results of these<br />
comparisons are shown. The agreement between the three methods are good, only in a few instances<br />
does the status differ slightly between them.<br />
Type - NEA11<br />
This is the generic single transitional water type covering all transitional waters in eight countries.<br />
As such it is very wide ranging and demands methods that cover all the salinity ranges in the<br />
different transitional waters.<br />
Reference Conditions<br />
Reference conditions derived for coastal waters may be used in the euhaline parts of transitional<br />
waters assuming equivalent habitats (sediment types) are assessed. The reference conditions from<br />
the coastal water type into which the transitional water drains may therefore be applicable. For the<br />
Figure 2.4.12: Comparison of water body status assessed with Swedish (left column), Danish (middle column) and<br />
Norwegian (right column) methods. Error bars in Swedish graphs denotes 20 th and 80 th percentile. Note that the<br />
Swedish method uses the 20th percentile for assessment. The agreements between the methods are good. Data from<br />
Bagge 1969, Leppäkoski 1975, Rosenberg 1972, 1973, 1976 and monitoring programmes.<br />
90<br />
N m Hallands kustvatten (vd)<br />
16<br />
14<br />
12<br />
10<br />
8<br />
6<br />
4<br />
2<br />
0<br />
1970 1975 1980 1985 1990<br />
BQI<br />
BQI<br />
Saltkällefjorden<br />
16<br />
14<br />
12<br />
10<br />
8<br />
6<br />
4<br />
2<br />
0<br />
1967 1969 1971 1973 1975 1977 1979<br />
Gullmarn centralbassäng<br />
16<br />
14<br />
12<br />
10<br />
8<br />
6<br />
4<br />
2<br />
0<br />
1979 1984 1989 1994 1999<br />
DKI<br />
1,0<br />
0,8<br />
0,6<br />
0,4<br />
0,2<br />
N m Hallands kustvatten (vd)<br />
0,0<br />
1970 1975 1980 1985 1990<br />
DKI<br />
DKI<br />
1,0<br />
0,8<br />
0,6<br />
0,4<br />
0,2<br />
Saltkällefjorden<br />
0,0<br />
1967 1969 1971 1973 1975 1977 1979<br />
1,0<br />
0,8<br />
0,6<br />
0,4<br />
0,2<br />
Gullmarn centralbassäng<br />
0,0<br />
1979 1984 1989 1994 1999<br />
NQI<br />
NQI<br />
NQI<br />
1,0<br />
0,8<br />
0,6<br />
0,4<br />
0,2<br />
N m Hallands kustvatten (vd)<br />
0,0<br />
1970 1975 1980 1985 1990<br />
1,0<br />
0,8<br />
0,6<br />
0,4<br />
0,2<br />
Saltkällefjorden<br />
0,0<br />
1967 1969 1971 1973 1975 1977 1979<br />
1,0<br />
0,8<br />
0,6<br />
0,4<br />
0,2<br />
Gullmarn centralbassäng<br />
0,0<br />
1979 1984 1989 1994 1999
polyhaline and mesohaline stretches within transitional waters different reference criteria may be<br />
required for use in the specified classification scheme. At this time, these reference conditions are still<br />
under development. All required reference conditions are not expected to be fully developed before<br />
June 2007 therefore postponing <strong>intercalibration</strong> in transitional waters until Phase II, 2006 to 2009.<br />
Class Boundary Setting Procedure<br />
If assessments are made in the euhaline areas of transitional waters (or with a similar salinity regime<br />
to the adjoining coastal waterbody) then the classification tool for coastal waters would be used in<br />
the same habitats to which that tool applies. As such the boundary setting procedure would be the<br />
same as described above for the coastal waters types. The same principles would be used in setting<br />
boundaries in other areas of transitional waters with different salinity regimes but the classification<br />
would be anchored by different reference condition specific to those areas. At this time, there are<br />
no classification systems developed that allow a comparison between Member States, therefore<br />
postponing <strong>intercalibration</strong> in transitional waters until Phase II, 2006 to 2009.<br />
Any future approach should build on the lessons learnt from the coastal water <strong>intercalibration</strong><br />
exercise. It has been suggested that as many transitional waters have been identified as ‘heavily<br />
modified water bodies, it may complicate the simple aggregation of present metrics adapted to cover<br />
salinity ranges and differences in habitats, for some classification assessments.<br />
2.4.4<br />
Results of the comparison<br />
Type - NEA1/26 and NEA7<br />
DK, ES, IE, NO, PT, UK<br />
Data have been exchanged by Member States and a standardised Intercalibration dataset collated.<br />
This dataset has been run through each proposed national classification scheme to determine the<br />
matches in status obtained when assessed by the different methods. For example, Danish data were<br />
assessed using the UK classification scheme, and vice versa, and the matches in status assessed.<br />
Five classification schemes (M-AMBI, IQI, NQI, DKI and P-BAT) were available for this<br />
assessment. The assessment indicated the agreement of sites that have been assigned similar status<br />
(High/Good or Moderate/Poor/Bad) by the different assessment methods. The EQR boundaries<br />
in the ecological status assessment were then altered, to achieve the highest agreement between<br />
Member States (i.e. optimisation of boundaries).<br />
Following optimisation of the boundaries, agreement between boundaries was assessed according to<br />
guidelines issued by Ecostat to compare the agreement in classes both for all five classes and only<br />
three, high, good and moderate or worse. In addition further evaluation was made using harmonised<br />
boundaries and allowing a 0.05 EQR range of deviation around the boundaries. These results are<br />
presented in the table 2.4.11 below.<br />
91
Table 2.4.11: Percentage agreement between classification methods. (Following optimisation of boundaries).<br />
Average A<br />
(DKI –DK)<br />
Average B<br />
(M-AMBI –<br />
FR/ES)<br />
Average C<br />
(NQI – NO)<br />
Average D<br />
(PBAT – PT)<br />
Average E<br />
(IQI – UK/IE)<br />
Overall average<br />
ABCDE<br />
92<br />
Agreement<br />
(5 classes)<br />
Agreement<br />
(3 classes)<br />
Agreement<br />
(5 cl.+0.05 EQR)<br />
Agreement (3<br />
cl. +0.05 EQR)<br />
Average class<br />
difference<br />
77.098 80.303 97.918 98.13 0.035 0.068<br />
71.77 75.01 95.098 95.273 0.013 0.078<br />
72.635 76.298 94.033 94.173 0.01 0.085<br />
70.995 74.448 94.958 95.205 0.018 0.085<br />
71.578 75.275 96.55 96.69 -0.035 0.08<br />
72.815 76.267 95.711 95.894 0.008 0.079<br />
Table 2.4.12: Overall summary data for this comparison.<br />
Number of classes 3 5 3 5<br />
Absolute<br />
average class<br />
difference<br />
EQR deviation No deviation No deviation 0.05 EQR 0.05 EQR<br />
Percentage of<br />
classification agreement<br />
76.3 72.8 95.9 95.7<br />
In the case of three classes the percentage of classifications that differ by 2 classes is 0.479 for no<br />
deviation allowance and 0.028 for the 0.05 EQR deviation allowance situations.<br />
Table 2.4.13: Average and absolute class differences.<br />
Average of class difference 0.008<br />
Absolute average of class difference 0.079<br />
This is a high level of agreement bearing in mind that the data was collected by participating<br />
countries independently, in many cases before <strong>intercalibration</strong> really started and the inherent<br />
variability of biological data. This is deemed by the GIG to be an acceptable level of agreement and<br />
validates the national boundaries.<br />
DE<br />
In the <strong>intercalibration</strong> <strong>report</strong> of Heyer (2007) a comparison of the methods (BEQI, M-Ambi)<br />
showed following results:<br />
Comparison of the BEQI, M-AMBI, and IQI were carried out for two sites in NEA1/26. (This<br />
differs from the above exercise where a standardised Intercalibration dataset was used by all the<br />
Member States involved.)<br />
Table 2.4.14 shows the compilation of the assessment results for different assessment methods for<br />
the German <strong>intercalibration</strong> stations: blue =’high status’(‘I’), green = ’good status’(‘II’), yellow =<br />
’moderate status’(‘III’) and orange = ’poor status’(‘IV’).
Table 2.4.14: DE comparisons.<br />
<strong>Water</strong>body<br />
Type<br />
NEA1<br />
NEA26<br />
Station Sediment Expert<br />
judgement<br />
NS2, Vortrapptief,<br />
mean 2002 to<br />
2004<br />
Fine sand<br />
to sand<br />
M-AMBI<br />
Assessment,<br />
DE boundaries<br />
BEQI<br />
Assessment,<br />
NL boundaries<br />
‘II’ to ‘III’ 0.77 0.36 0.78<br />
Hoher Weg 1988 Low ‘II’ to ‘III’ 0.46 0,53 0,57<br />
Hoher Weg 2004<br />
littoral<br />
sand<br />
0.52 0,79 0,68<br />
IQI Assessment,<br />
UK boundaries<br />
(pre-harmonisation)<br />
Type NEA1: The assessments of the ecological status of station ‘NS2’ by three different methods<br />
showed following results: ‘high status’ assessed by the ‘IQI, ‘good status’ assessed by the<br />
‘M-AMBI’ and ‘poor status’ assessed by the ‘BEQI’. The assessment by the M-Ambi reflected the<br />
status given by expert judgement better than the other methods (status ‘good’ to ‘moderate’)<br />
Type NEA26: For the year 1988, the ecological status of the stations was assessed as ‘moderate’<br />
by the three methods. For 2004, the status of the stations was assessed as ‘good’ by the IQI and<br />
the BEQI, while the M-AMBI led again to the assessment ‘moderate’. The results of the different<br />
methods were in good agreement, also with the expert judgement (status ‘good’ to ‘moderate’).<br />
NL<br />
This <strong>intercalibration</strong>/comparison of methods is on a habitat level, as the BEQI evaluates directly at<br />
a habitat level within a waterbody. This approach to <strong>intercalibration</strong> at a water body level may be<br />
completed in Phase II Intercalibration.<br />
Comparison of the BEQI, M-AMBI, IQI, DKI and NQI on Dutch data was done for the habitat Q1<br />
(fine muddy sand) in two water bodies in the North Sea coastal zone, Waddenkust and Hollandse<br />
Kust. DKI, IQI and M-AMBI scores were calculated with reference settings suggested by the<br />
member states for their defined habitats in the earlier exercise (fixed reference) and with reference<br />
values determined from the Q1 reference dataset of the North Sea coastal zone (Table 2.4.15). The<br />
reference setting is the same for Hollandse Kust and Waddenkust. NQI does not allow for use of<br />
local reference values.<br />
The assessment period is 3 years (2002-2004) with a total of 15 samples per habitat in the two water<br />
bodies. Except for the BEQI method the average of assessment station scores within a habitat was<br />
taken as the overall habitat status.<br />
Assessment results were very similar for both water bodies (Figure 2.4.13). DKI, IQI and NQI<br />
are hardly different between water bodies. BEQI and M-AMBI show more variation between<br />
Hollandse Kust and Waddenkust. In all cases, the outcomes were higher when the local determined<br />
reference settings were used, in three out of six cases use of the local reference resulted in a shift<br />
Table 2.4.15: Local reference values used for index calculation. Reference values based on the Q1 cluster of stations<br />
within six nautical miles from the coast, sampled between 1983 and 1990.<br />
AMBI Shannon-Wiener # Species Simpson<br />
Bad High Bad High Bad High Max<br />
Waddenkust 6 0.107 0 2.66 0 31 0.91<br />
Hollandse kust 6 0.246 0 2.83 0 31 0.92<br />
93
to a higher quality status. Of the five compared methods the BEQI method assigned both water<br />
bodies to a lower quality class than the other methods, regardless of the reference used (fixed<br />
or local). Differences in assessment ranged as much as between poor and high status. These<br />
differences are caused by differences in the applied methodology. In the first place, total biomass<br />
of the macrobenthic community is included in the BEQI but not in the other assessment methods.<br />
Biomass has increased considerably in the North Sea coastal zone since the period of reference<br />
setting, causing very low scores for the sub-metric biomass and subsequent low overall scores. Also<br />
the measure of similarity between reference and assessment was rated not more than moderate at<br />
the Hollandse Kust and Waddenkust, as it detects the changes in species composition caused by an<br />
invasive species.<br />
Besides the use of different input and sub-metrics, the BEQI relates assessment and reference<br />
conditions differently. The BEQI explicitly takes spatial and temporal variability into account. The<br />
class boundaries are determined by the variance in the reference data.<br />
To increase the number of data for comparison, index scores are calculated for several time intervals<br />
(four periods: 91-95, 96-98, 99-01 and 02-04). BEQI responds strongest to the temporal and spatial<br />
differences with a coefficient of variation (cv) of 0.12. M-AMBI showed less variation in time and<br />
space with a cv of 0.09. The other indices DKI IQI and NQI responded least with cvs of 0.06, 0.05<br />
and 0.05 respectively. M-AMBI, DKI, IQI and NQI are all positively correlated. This is not really<br />
surprising as the indices rely on the same or similar sub metrics. The BEQI correlates poorly (not<br />
significant) with the other methods.<br />
Based on this very limited comparison between the BEQI and classification methods, the BEQI<br />
seems to rate water bodies at a lower ecological class than the other methods. Further comparisons<br />
with a larger dataset with a larger variation in conditions are needed to further evaluate the<br />
performance of BEQI relative to the other indices.<br />
94<br />
Figure 2.4.13: Bar graph of five metrics calculated for two water bodies of the Dutch coast,<br />
Hollandse kust and Waddenkust. Calculations are done using a fixed reference (in red)<br />
suggested by the member states and a local reference (blue) determined from a reference data<br />
set (Q1 cluster). Boundaries of the indices are indicated with horizontal lines.
Figure 2.4.14: Scatterplot matrix of the index scores<br />
of the different methods calculated for two water<br />
bodies and four time periods in the coastal zone of the<br />
Netherlands, Waddenkust and Hollandse Kust. Sample<br />
ellipses are plotted together with the data.<br />
Type – NEA3/4<br />
NL<br />
At present Germany applies the M-AMBI to the Wadden Sea, which is assigned to Intercalibration<br />
type cluster NEA 3/4. A comparison is made between the results of the BEQI method for the<br />
different habitats of the Dutch Wadden Sea, and M-AMBI values calculated for the same assessment<br />
data. Additionally the BEQI and M-AMBI are calculated for benthos datasets from Norderney and<br />
the Leybucht, supplied by Germany for the <strong>intercalibration</strong> exercise. Norderney data cover a fiveyear<br />
period from 1998 to 2002. For Leybucht, data from a longer period are available and there<br />
the six most recent years from 1998 to 2003, are selected for the BEQI and M-AMBI calculation.<br />
Information on biomass of the macrobenthic species is not available, so only three of the four submetrics<br />
are calculated.<br />
Results of the BEQI calculations are presented in Table 2.4.16. For Norderney reference conditions<br />
of Middle Littoral Muddy Sand are used. Leybucht results are relative to the reference for High<br />
Littoral Mud. Total densities of the macro fauna are higher than the reference. Number of species<br />
is very large, in both areas more species are found than described in the reference data. Similarity<br />
is rated poor in both areas. The overall score is good for Norderney and moderate for the Leybucht.<br />
This difference is due to the larger deviance of total density in the Leybucht. This very strong<br />
divergence from the reference conditions is caused by high numbers of Hydrobia ulvae, Tubificoides<br />
benedeni and Corophium sp. This could indicate a disturbed situation, however it is questionable if<br />
the reference description is appropriate in this case. No T. benedeni or other Oligochaetes are present<br />
in the reference set, which might suggest that this group was neglected in the Dutch monitoring, or<br />
alternatively this ecotype was not well covered. However, excluding T. benedeni in the calculations<br />
still leads to a poor density status.<br />
M-AMBI scores are calculated for the same six assessment samples as are used for the BEQI<br />
scores, four habitats of the Dutch Wadden Sea are presented and the two German sites discussed<br />
above. M-AMBI scores are calculated per station and then averaged per habitat. Reference values<br />
are outlined in Section 2.3.3 (reference conditions NEA 3/4).<br />
95
A comparison between the BEQI and M-AMBI scores for the Dutch and German Wadden Sea<br />
habitats is made in Table 2.4.17. In three out of six cases the status classification is the same for both<br />
metrics. In the other three cases BEQI gives a lower quality status, twice moderate versus good and<br />
once moderate versus high for the Leybucht. In the Leybucht the difference is mainly caused by the<br />
very high abundances of three species with much stronger effect on BEQI than M-AMBI. Moderate<br />
BEQI scores in the Dutch Brackish Sub-Littoral and High Littoral Mud habitats are caused by<br />
large biomass values relative to the reference and moderate similarities. This partly explains the<br />
difference in status score.<br />
A more detailed analysis of the comparison between BEQI and M-AMBI results for the Wadden<br />
Sea does not seem adequate until the number of cases is substantially larger. In the next section<br />
data from the Coastal zone of the North Sea, the Wadden Sea and the Eems-Dollard are combined<br />
to increase sample size and variation in assessment conditions for a comparison between the two<br />
indices. This generates a larger dataset with a larger range of variation in conditions reflected in the<br />
indices. M-AMBI scores are calculated per assessment station and averaged per habitat. M-AMBI<br />
96<br />
Table 2.4.16: BEQI results of three sub-metrics for Norderney<br />
(years 1998 to 2002) and Leybucht (years 1998-2003)<br />
in the German Wadden.<br />
Table 2.4.17: BEQI and M-AMBI assessment (Spanish pre-optimisation boundaries) results for the Dutch and German<br />
Wadden Sea habitats. The samples in the Dutch Wadden Sea consist of stations in several areas.
eference values are selected from the same reference datasets as are used for the BEQI reference<br />
description. Calculation of BEQI scores and results are presented in previous sections of this <strong>report</strong>.<br />
The comparison was made based on 20 observations from the combined water bodies. In Figure<br />
2.4.15 the AMBI scores are plotted against the BEQI scores. The range of M-AMBI scores is 31<br />
% and the range of BEQI 43 % of the scale from 0 to 1. In this limited comparison most M-AMBI<br />
assessments fall within a single category, good and a few in high. The BEQI status assessments<br />
mainly fall within two categories moderate and good. Overall the two indices are positively<br />
correlated with a Pearson correlation coefficient of 0.45 (P
Compilation of the assessment results for different assessment methods for the German<br />
<strong>intercalibration</strong> stations, blue = ’high status’(‘I’), green = ’good status’(‘II’), yellow = ’moderate<br />
status’(‘III’) and orange = ’poor status’(‘IV’) ecological as shown in table 2.4.18 below.<br />
The boundaries (H/G and G/M), that were proposed by Borja et al. (2007) would result in much<br />
too high ecological assessments for the German <strong>intercalibration</strong> sites, since in comparison to<br />
historical papers (eg. Hagmeier & Kändler 1927, Hagmeier 1925, Linke 1939) - at all stations<br />
more or less changes in species composition and numbers were detected. Therefore the boundaries<br />
(H/G and G/M) had to be adjusted, which was done by expert judgement under consideration of the<br />
Normative Definitions of the WFD. The assessment results with the adjusted German boundaries<br />
resulted in assessments, which were, at all stations, in better agreement with expert judgement and<br />
in most cases in agreement with the other assessment methods.<br />
Table 2.4.18: DE assessments in type 3/4.<br />
<strong>Water</strong>body type Station Sediment Expert<br />
judgement<br />
NEA ¾<br />
NEA ¾<br />
BE<br />
98<br />
Norderney,<br />
Mean T1 to T8,<br />
1998 to 2003<br />
Leybucht,<br />
mean autumn<br />
2003, mud stations<br />
Middle littoral<br />
muddy sand<br />
M-AMBI<br />
Assessment,<br />
DE boundaries<br />
BEQI<br />
Assessment,<br />
NL boundaries<br />
‘II’ 0.75 0.63<br />
High littoral mud ‘III’ 0.71 0.51<br />
The comparability between the BEQI (Benthic Ecosystem Quality Index) and the other benthic<br />
evaluation methods is tested on a temporal dataset (1995-2003) at a slightly organically enriched<br />
station in the Belgian coastal waters. The BEQI evaluates the benthic status on habitat/water body<br />
level (by directly pooling the samples), whereas for the other benthic evaluation methods, the<br />
average of the EQR (Ecologocial Quality Ratio) of the samples within the habitat/water body is<br />
used as the habitat/water body assessment. This way of habitat/water body level assessment has<br />
been accepted at the NEA-GIG benthos workshop in Lisbon (February 2007) in anticipation of<br />
the final acceptance of the habitat/water body level assessment methods, which are currently in<br />
development in other European countries. For an appropriate comparison, only the third level of the<br />
BEQI method is applied. The parameter biomass could not be included due to lack of sufficient data.<br />
This analysis delivers 22 assessment cases (based on 200 samples) for testing the comparability<br />
between the different methods at habitat/water body level. Through the use of the average of the<br />
EQR’s of the samples as habitat/water body assessment, the comparison best takes into account a<br />
standard deviation, in order not to consider variability of the result within sample-based methods<br />
as a real difference with another methodology. Therefore, the average of the standard deviations<br />
of the sample EQR’s of each method has been taken into account. A small deviation from the class<br />
boundaries less than 0.05 (IQI, NQI) or 0.06 (DKI, m-AMBI, PT) EQR units, is not considered as a<br />
real misclassification. The same principle is applied in other GIG’s (Alpine and central-Baltic GIG)<br />
for the <strong>intercalibration</strong>, but they arbitrarily selected 0.05 EQR units. The results of the comparison<br />
between the BEQI and the other methods are shown in table 2.4.19.<br />
Agreement between boundaries of the BEQI and the other methods was further assessed according<br />
to guidelines issued by ECOSTAT to compare the agreement in classes, both for all five classes
and for only three classes (being (1) high, (2) good and (3) moderate or worse). In addition, a<br />
comparison was also made between allowing a 0.05 EQR range of deviation around the boundaries<br />
and not allowing any deviation. The results of the comparison between the BEQI index (whole<br />
water body assessment) used in BE and NL and the other national methods are presented in figures<br />
2.4.16, 2.4.17 and tables 2.4.20, 2.4.21, 2.4.22.<br />
Table 2.4.19: The percentage of cases in which a certain class difference is found between the BEQI and the other<br />
methods (a deviation of 0,05 taken into account).<br />
1,0<br />
0,9<br />
0,8<br />
0,7<br />
0,6<br />
0,5<br />
0,4<br />
0,3<br />
0,2<br />
0,1<br />
0,0<br />
class difference IQI DKI m-AMBI NKI PT Total<br />
-4 0 0 0 0 0 0<br />
-3 4,5 18,2 0 0 0 4,5<br />
-2 22,7 40,9 9,1 9,1 4,5 17,3<br />
-1 50,0 31,8 50,0 45,5 45,5 44,5<br />
0 22,7 9,1 40,9 45,5 50,0 33,6<br />
1 0 0 0 0 0 0<br />
2 0 0 0 0 0 0<br />
3 0 0 0 0 0 0<br />
4 0 0 0 0 0 0<br />
equal or 1 class 72,7 40,9 90,9 90,9 95,5 78,2<br />
1995/2<br />
1995/3<br />
1995/4<br />
1995/1<br />
1996/1<br />
1996/2<br />
1996/3<br />
1997/1<br />
1997/2<br />
1997/3<br />
1997/4<br />
1999/1<br />
1999/2<br />
1999/3<br />
1999/4<br />
2002/1<br />
High<br />
Good<br />
Moderate<br />
Poor<br />
Bad<br />
2002/2<br />
2002/3<br />
2002/4<br />
2003/1<br />
BEQI<br />
IQI<br />
DKI<br />
m-AMBI<br />
Figure 2.4.16: Comparison of the results from the BEQI and the other national methods (no standard deviation of 0,05<br />
EQR taken into account) for 22 assessments of one site that is subject to some organic enrichment in the Belgian coastal<br />
waters. One assessment is a cluster of a series of samples per season (indicated by number 1 to 4).<br />
1,0<br />
0,9<br />
NKI<br />
PT<br />
2003/2<br />
2003/3<br />
99
1,0<br />
0,9<br />
0,8<br />
0,7<br />
0,6<br />
0,5<br />
0,4<br />
0,3<br />
0,2<br />
0,1<br />
0,0<br />
Table 2.4.20: Percentage of classification agreement between the BEQI and the other benthic methods for the four<br />
different comparison options.<br />
100<br />
1995/2<br />
1995/3<br />
1995/4<br />
1995/1<br />
1996/1<br />
1996/2<br />
1996/3<br />
1997/1<br />
3 classes<br />
no deviation<br />
5 classes<br />
no deviation<br />
3 classes<br />
0,05 EQR deviation<br />
5 classes<br />
0,05 EQR deviation<br />
IQI 0 (40,9) 0,0 36,4 (13,6) 22,7<br />
DKI* 0 (86,4) 0,0 9,1 (45,5) 9,1<br />
m-AMBI 31,8 (4,5) 13,6 63,6 (0,0) 40,9<br />
NKI 36,4 (22,7) 18,2 68,2 (0,0) 45,5<br />
PT 54,5 (0,0) 18,2 77,3 (0,0) 50,0<br />
Total 24,5 (30,9) 10,0 50,9 (11,8) 33,6<br />
*DKI comparability results were very low; more investigation is needed to clarify this and meanwhile caution is needed<br />
by the interpretation of this result.<br />
For the option of using three classes, the percentage of classifications that differs 2 classes is given between brackets.<br />
Table 2.4.21: Average of class difference between the BEQI and the other benthic methods.<br />
3 classes<br />
no deviation<br />
1997/2<br />
1997/3<br />
1997/4<br />
5 classes<br />
no deviation<br />
3 classes<br />
0,05 EQR deviation<br />
5 classes<br />
0,05 EQR deviation<br />
IQI -1,4 -1,8 -0,8 -1,1<br />
DKI* -1,9 -2,3 -1,4 -1,7<br />
m-AMBI -0,7 -1,1 -0,4 -0,7<br />
NKI -0,9 -1,3 -0,3 -0,6<br />
PT -0,5 -0,9 -0,2 -0,5<br />
Total -1,1 -1,5 -0,6 -0,9<br />
1999/1<br />
1999/2<br />
1999/3<br />
1999/4<br />
2002/1<br />
High<br />
Good<br />
Moderate<br />
Poor<br />
Bad<br />
2002/2<br />
2002/3<br />
2002/4<br />
2003/1<br />
BEQI<br />
IQI<br />
DKI<br />
m-AMBI<br />
Figure 2.4.17: Comparison of the results from the BEQI and the other national methods (standard deviation of 0,05<br />
EQR taken into account) for 22 assessments of one site that is subject to some organic enrichment in the Belgian coastal<br />
waters. One assessment is a cluster of a series of samples per season (indicated by number 1 to 4).<br />
NKI<br />
PT<br />
2003/2<br />
2003/3
Table 2.4.22: Absolute average of class difference between BEQI and other benthic methods.<br />
3 classes<br />
no deviation<br />
5 classes<br />
no deviation<br />
3 classes<br />
0,05 EQR deviation<br />
5 classes<br />
0,05 EQR deviation<br />
IQI 1,4 1,8 0,8 1,1<br />
DKI* 1,9 2,3 1,4 1,7<br />
m-AMBI 0,7 1,1 0,4 0,7<br />
NKI 0,9 1,3 0,3 0,6<br />
PT 0,5 0,9 0,2 0,5<br />
Total 1,1 1,5 0,6 0,9<br />
Figures 2.4.16 and 2.4.17 illustrate that all the methods show similar trends, but still significant<br />
differences remain. The conclusion is that, for the current state-of-the-art, the BEQI is generally<br />
one class more stringent than the other methods. The PT shows the highest comparability with the<br />
BEQI, followed by the NKI and the m-AMBI. The lowest comparability is observed with the IQI<br />
and especially the DKI, with which a classification difference of about 2 classes is observed.<br />
The reasons for the deviations can be described as follows:<br />
• different approaches are applied within the BEQI and the other methods concerning<br />
statistical confidence (requirements sufficiently sampled area) and water body level<br />
assessment versus sample level assessment<br />
• the multimetric set-up of the BEQI includes community species composition, which is more<br />
sensitive than a classification based on assigning species to specific categories (sensitive,<br />
tolerant etc.)<br />
• the multipressure set-up of the BEQI detects the impact of a combination of pressures<br />
on the benthos, not only eutrophication or enrichment with organic matter or specific<br />
substances, but also physical disturbances or impacts of invasive species<br />
• significantly higher densities in relation to the reference are considered as a negative impact<br />
within the BEQI and contribute to an assessment result with a lower classification<br />
• the amount of reference data used within the BEQI is still very limited and not ideal yet.<br />
This has an influence on the reliable estimation of the natural reference situation and the<br />
derived statistical boundaries. Further elaboration of the reference dataset and improvement<br />
of the method is necessary and will enhance comparability. However, this cannot be done<br />
on the very short time and will be performed as part of the monitoring contracts.<br />
The comparability at the level of the habitat/water body will be improved in the second<br />
<strong>intercalibration</strong> round, when every country has its definitive assessment method at habitat/water<br />
body level.<br />
Class Boundaries – Member States (in summary)<br />
Type NEA1/26<br />
DE, DK, ES, FR, IE, NO, PT, UK<br />
Despite differences in index construction, classifications (M-AMBI, DKI, IQI, NQI and P-BAT) for<br />
DK, ES, IE, NO, PT, and UK behave in a similar way. Class boundaries were harmonised through<br />
the Intercalibration exercise and status classifications are in good agreement between the Member<br />
States.<br />
101
NL/BE<br />
As the BEQI method evaluates directly at the water body level, and in the current <strong>intercalibration</strong><br />
exercise no water body <strong>intercalibration</strong> was done, an adjustment of class boundaries is not<br />
considered appropriate. Adjustment of the class boundaries in the harmonisation of ecological<br />
status classification of the water body will affect the statistical significance levels for the individual<br />
parameters.<br />
Status classification between Belgium and the Netherlands is in full agreement as the BEQI is used<br />
by both Member States.<br />
The assessment results comparing the BEQI (BE, NL) with M-AMBI, DKI, IQI, and NQI (DK, ES,<br />
FR, IE, NO, UK) clearly result from the differences in methods (as described earlier).<br />
Type - NEA3/4<br />
Adjustment of the class boundaries for the German m-AMBI, as a result of the comparison with the<br />
BEQI, is fully consistent for larger (5 year) datasets and sufficient using a one year comparison and<br />
expert judgement.<br />
Status classification between DE and NL is in good agreement.<br />
Type - NEA8/9/10<br />
Despite differences in index construction and species classifications indices behave in a similar way<br />
and status classifications are in good agreement between Sweden, Denmark and Norway.<br />
Type - NEA11<br />
As described above the boundaries agreed for coastal waters could be used in transitional waters in<br />
areas with a similar salinity regime. However, as NEA11 <strong>intercalibration</strong> will be postponed until<br />
Phase II, class boundaries for habitats within varying salinity regimes are not available at this time.<br />
2.4.5<br />
102<br />
Results of the harmonisation – Boundary EQR values<br />
Type - NEA1/26 and NEA7 (EQRs) (Site level assessment, soft sediment habitat)<br />
Good/Moderate High/Good<br />
Denmark 0.53 0.67<br />
France 0.53 0.77<br />
Germany 0.70 0.85<br />
Ireland 0.64 0.75<br />
Spain 0.53 0.77<br />
Portugal 0.58 0.79<br />
Norway 0.81 0.92<br />
United Kingdom 0.64 0.75<br />
Type - NEA1/26 (EQRs) (<strong>Water</strong>body level assessment, all habitats)<br />
Belgium 0.60 0.80<br />
Netherlands 0.60 0.80
Type - NEA3/4 (EQRs)<br />
Good/Moderate High/Good<br />
Germany 0.70 0.85<br />
Netherlands 0.60 0.80<br />
Type - NEA8/9/10 (EQRs)<br />
Good/Moderate High/Good<br />
Denmark 0.63 0.82<br />
Norway 0.81 0.92<br />
Sweden 0.68 0.89<br />
Type - NEA11 (EQRs)<br />
Boundaries cannot be agreed by June 2007. Boundaries are to be completed in Phase II of the<br />
Intercalibration process.<br />
2.4.6 Open issues and need for further work<br />
There are a high number of issues remaining to be resolved in Phase II so clear prioritization must<br />
take place.<br />
The <strong>intercalibration</strong> process to date has concentrated on the assessment of classification methods for<br />
the subtidal soft sediment infauna within waterbodies. Classifications relate to general disturbance<br />
pressures (hazardous substances, organic enrichment, eutrophication, etc) but not necessarily to<br />
physical disturbance (method dependent). (Data used by Member States, however, may relate to<br />
multi-pressure environments where physical disturbance may play a role.) Hydromorphological<br />
pressures may require a different assessment methodology which takes more account of spatial<br />
variation (e.g. habitat extent tools). May also need to revisit the coastal waters types to see if any<br />
subdivision is necessary.<br />
The key work area in the next phase will be to develop <strong>intercalibration</strong> of assessment methods that<br />
are applicable in the polyhaline, mesohaline and oligohaline habitats of transitional waters. Both<br />
intertidal and subtidal habitats need to be considered.<br />
The majority of developed classifications for the coastal soft sediment infauna, deal with<br />
samples grouped within specifically defined habitat types. There is now a general need to assess<br />
classifications at a water body level, incorporating sampling design and risk of misclassification.<br />
The Dutch/Belgian methodology (BEQI) has made a start with such an approach.<br />
There is also a need to further investigate the <strong>intercalibration</strong> of methods for other habitats (e.g.<br />
maerl, mobile sands, zostera beds, gravels) where they will be sampled by Member States.<br />
Reference conditions and methods are still under development and would need to be assessed in a<br />
further stage of the Intercalibration process.<br />
The development of reference species lists for all habitats to be considered and agreement on<br />
the designation of sensitive species, the role of invasive species in classification, and community<br />
changes in habitats where there is little occurrence of “sensitive” species is required.<br />
103
Methods applicable for hard substratum and subtidal epibenthos assessments are yet to be<br />
developed.<br />
Results of ongoing FP6 research could not be taken fully into account in this phase of<br />
Intercalibration but should be addressed in starting a second phase of Intercalibration. Better<br />
communication is required between the scientists involved in FP7 research related to WFD and the<br />
people involved in the application of the science (according to the CIS process). This requires new<br />
ways of interactive bridging, which should be made transparent in programming both processes.<br />
All future work is dependent on adequate funding being made available by countries within the<br />
GIG. We should also consider using the FP7 framework if possible.<br />
3<br />
3.1<br />
104<br />
Discussion<br />
Comparability between GIGs<br />
Table 2.4.23: Summary of <strong>intercalibration</strong> topics per GIGs.<br />
INDICES/Metrics<br />
NEA GIG MED GIG BAL GIG<br />
BEQI, M-AMBI, DKI,<br />
IQI, NQI, P-BAT<br />
BENTIX, Multimetric<br />
approach, AMBI, M-AMBI,<br />
MEDOCC<br />
N O . TYPES 7 4 not relevant 1<br />
OPTION 3 3 3<br />
BOUNDARY<br />
SETTING<br />
PROCEDURE<br />
REFERENCE<br />
CONDITION<br />
OPEN ISSUES<br />
Metrics<br />
Equal classes revised by<br />
expert judgement<br />
Expert judgement on<br />
indices values,<br />
Refine typology, relate to<br />
pressure,<br />
Expert judgement on<br />
indices values,<br />
Percentage from reference<br />
sites<br />
Expert judgement on<br />
indices values,<br />
Percentage from reference<br />
sites<br />
consider different subregions,<br />
introduce new<br />
multimetric indices<br />
Shannon, AMBI,<br />
M-AMBI<br />
percentage from<br />
average reference<br />
values; ecological status<br />
boundaries equally scaled<br />
(80 % for good, 60 % for<br />
moderate, 40 % for poor<br />
and 20 % for bad status),<br />
H/G, G/M.<br />
Expert judgement,<br />
unaffected areas or good<br />
status sites<br />
Refine typology<br />
Intercalibration for the benthic invertebrates quality element has been successfully performed by<br />
all of the four Coastal <strong>Water</strong>s GIGs. AMBI and its multivariate version (M-AMBI) results to be the<br />
favourite experts choice (or at least the more common), together with Shannon index (in some cases<br />
aggregated with other indices) and a few highly specific national methods.
Types<br />
Most of the types result to be covered by the Intercalibration results, even though there is a common<br />
view (e.g. MEDGIG) stating that the a-priori types are definitely not relevant for the quality element<br />
ecological assessment.<br />
Option<br />
Option 3 has been chosen by all GIG, thus Member States have developed their own classification<br />
schemes, these have been assessed against each other through the exchange and evaluation of data<br />
and the boundaries in each scheme harmonized to give an acceptable level of agreement.<br />
Boundary Setting Procedure<br />
All Coastal <strong>Water</strong>s GIGs are providing results for the H/G and G/M boundaries (at least), applying<br />
similar approaches based on the expert supervised selection of appropriate percentiles as boundaries<br />
best fitting with evident changes in ecological status.<br />
Reference Condition<br />
The expert judgment has been selected as the favorite option in setting Reference Condition.<br />
3.2 Open issues and need for further work<br />
To refine typology going down to a level of details that include the sub-ecoregion in the process has<br />
been highlighted as a major task for the next phase.<br />
4<br />
References<br />
Anger, K. 1975. On the influence of sewage pollution on inshore benthic communities in the south of Kiel Bay.<br />
Part 1. Qualitative studies on indicator species and communities. Merentutkimuslait. Julk./Havsforskningsinst.<br />
Skr. 239:116-122.<br />
Anger, K. 1977. Benthic invertebrates as indicators of organic pollution in the Western Baltic Sea. Int. Revue<br />
ges. Hydrobiol. 62:245-254.<br />
Bäck, S., Kauppila, P., Kangas, P., Ruuskanen, A., Westberg, V., Perus, J. & Räike, A. 2006. A biological<br />
monitoring programme for the coastal waters of Finland according to the EU <strong>Water</strong> <strong>Framework</strong> <strong>Directive</strong>.<br />
Environmental research, engineering and management 4 (38): 6-11 (ISSN 1392-1649)<br />
Blomqvist, M., Cederwall, H., Leonardsson, K. & Rosenberg, R. 2007. Bedömningsgrunder för kust och<br />
hav. Bentiska evertebrater 2006. Rapport till Naturvårdsverket 2007-04-11. 70 pp. (in Swedish with English<br />
summary)<br />
Borja A., Muxika I., Franco J. (2003). The application of a Marine Biotic Index to different impact sources<br />
affecting soft-bottom benthic communities along European coasts. Mar. Pollut. Bull. 46 : 835 – 845<br />
Borja, A., A. B. Josefson, A. Miles, I. Muxika,, F. Olsgard, G. Phillips, J. G. Rodríguez and B. Rygg. 2007.<br />
An approach to the <strong>intercalibration</strong> of benthic ecological status assessment in the North Atlantic ecoregion,<br />
according to the European <strong>Water</strong> <strong>Framework</strong> <strong>Directive</strong>. Mar. Poll. Bull., 55: 42-52.<br />
Borja, A., Franco, J., Muxika, I., 2003. Classification tools for marine ecological quality assessment: the<br />
usefulness of macrobenthic communities in an area affected by a submarine outfall. ICES CM 2003/Session<br />
J-02, Tallinn, Estonia, 24–28 September.<br />
Borja, A., J. Franco & V. Pérez, 2000. A marine biotic index to establish the ecological quality of soft bottom<br />
benthos within European estuarine and coastal environments, Marine Pollution Bulletin, 40(12): 1100-1114.<br />
105
Carvalho, S., M. Barata, F. Pereira, M. B. Gaspar, L. C. da Fonseca, and P. Pousão-Ferreira. 2006. Distribution<br />
patterns of macrobenthic species in relation to organic enrichment within aquaculture earthen ponds. Mar. Poll.<br />
Bull., 52: 1573-1584.<br />
Clarke, K. R., R. M. Warwick, 1994. Change in marine communities: an approach to statistical analysis and<br />
interpretation. Plymouth, Plymouth Marine Laboratory, 144 pp.<br />
Common implementation strategy for the <strong>Water</strong> <strong>Framework</strong> <strong>Directive</strong> (2000/60/EC). Guidance Document<br />
№ 13, Overall Approach to the Classification of Ecological Status and Ecological Potential, 2005, EC, 53 pp.<br />
Common implementation strategy for the <strong>Water</strong> <strong>Framework</strong> <strong>Directive</strong> (2000/60/EC). Guidance Document<br />
№ 5, Transitional and Coastal <strong>Water</strong>s Typology, Reference Conditions and Classification Systems, 2003, EC,<br />
116 pp.<br />
Dauvin, J-C. 2007. Paradox of estuarine quality: Benthic indicators and indices, consensus or debate for the<br />
future. Mar. Poll. Bull., 55: 271-281.<br />
Diaz, R. J. & Rosenberg, R. 1995. Marine benthic hypoxia: a review of its ecological effects and the behaviour<br />
responses of benthic macrofauna. Oceanogr. Mar. Biol. Ann. Rev. 33: 245-303.<br />
<strong>Directive</strong> 2000/60/EC of the European Parliament and of the Council of 23 October 2000 establishing a<br />
framework for Community action in the field of water policy, 72 pp.<br />
Fauvel, P., 1923. Polychètes errantes. Faune de France, Vol. 5, Paris.<br />
Fauvel, P., 1927. Polychètes sédenteires. Faune de France, Vol. 16, Paris.<br />
Glémarec, M. and C. Hily. 1981. Perturbations apportées à la macrofaune benthique de la baie de Concarneau.<br />
Acta Œcologica, 2: 139-150.<br />
Grall, J. and M. Glémarec. 1997. Using biotic indices to estimate macrobenthic community perturbations in<br />
the Bay of Brest. Estuar. Coast. Shelf Sci., 44: 43-53.<br />
Gray, J. S., Shiu-Sun Wu, R. & Ying Or, Y. 2002. Effects of hypoxia and organic enrichment on the coastal<br />
marine environment. Mar. Ecol. Prog. Ser. 238: 249-279.<br />
Hansson, M. & Håkansson, B. 2004. Indelning av Svenska Övergångs- & Kustvatten i typer enligt Ramdirektivet<br />
för Vatten. Dnr: 2002/1796/1933 SMHI (http://www.vattenportalen.se/<br />
Helawell, J.M. 1986. Biological Indicators of Freshwater Pollution and Environmental Management. Pollution<br />
Monitoring Series. Elsevier Appl. Sci. Publ., London.<br />
Heyer, K. 2007; German Intercalibration Report for the NEA-GIG (May 2007) ‘ Assessment of German<br />
Coastal <strong>Water</strong>s (NEA1/26, NEA3/4) by benthic invertebrates with the ‘M-AMBI’ assessment method’ for the<br />
Intercalibration Report- Coastal GIGs for the 6th milestone <strong>report</strong> for CIS<br />
Hily, C. 1984. Variabilité de la macrofaune benthique dans les milieux hypertrophiques de la Rade de Brest. Ph<br />
D thesis, Úniversité Bretagne Occidentale. Vol 1, 359 pp; Vol 2, 337 pp.<br />
Järvekülg, A. 1970. Bottom fauna as an indicator of pollution of the marine benthal in the vicinity of Tallinn.<br />
Estonian Contribution to the International Biological Programme 1: 158-193.<br />
Kangas, P., Byholm, L., Stigzelius, J. 2001: Changes in zoobenthos communities. In: Kauppila, P. & Bäck, S.<br />
(eds.). The state of Finnish coastal waters in the 1990s. Helsinki, Finnish Environment Institute. The Finnish<br />
Environment ; 472: 79-88.<br />
Kangas, P., Bäck, S. & Kauppila, P.(eds) 2003. Suggestions for a Typology of Coastal <strong>Water</strong>s for the Finnish<br />
Coast According to the European Union <strong>Water</strong> <strong>Framework</strong> <strong>Directive</strong> (2000/60/EC). Mimeograph series of<br />
Finnish Environment Institute 284, 51 p. (in Finnish with an English summary)<br />
Karlson, K., Rosenberg, R. & Bonsdorff, E. 2002. Temporal and spatial large-scale effects of eutrophication<br />
and oxygen efficiency on benthic fauna in Scandinavian and Baltic waters – a review. Oceanogr. Mar. Biol.<br />
Ann. Rev. 40: 427–489.<br />
Labrune C., 2006. Utilisation de la macrofaune benthique en tant qu’indicateur des changements<br />
environnementaux. PhD, Université de Perpignan: 1-250 + annexes.<br />
Labrune C., Amouroux J.M., Sarda R., Dutrieux E., Thorin S., Rosenberg R., Gremare A., 2006. Characterization<br />
of the ecological quality of the coastal Gulf of Lions (NW Mediterranean). A comparative approach based on<br />
three biotic indices. Mar. Pollut. Bull. 52: 34-47.<br />
106
Landner, L., Nilsson, K. och Rosenberg, R. 1977. Assessment of industrial pollution by means of benthic<br />
macrofauna surveys along the Swedish Baltic coast. Vatten 3:324-379.<br />
Leppäkoski, E. 1975. Assessment of degree of pollution on the basis of macrozoobenthos in marine brackishwater<br />
environments. Acta Academiae Aboensis. 35: 1-96.<br />
Licari M.L, 1998. Mise au point d’un système d’aide à l’interprétation des données benthiques en milieu marin<br />
et lagunaire. PhD, Ecole Pratique des hautes Etudes : 1-280 + annexes.<br />
Lipej, L., P. Mozetič, M. Orlando Bonaca, B. Mavrič, M. Šiško & N. Bettoso (2006). Opredelitev ekološkega<br />
stanja morja v skladu z Vodno direktivo (<strong>Water</strong> <strong>Framework</strong> <strong>Directive</strong>, 2000/60/ EC). Poročila 85. Morska<br />
Biološka Postaja, Nacionalni Inštitut za Biologijo, Piran, 180 str.<br />
Majeed, S. A. 1987. Organic matter and biotic indices on the beaches of North Brittany. Mar. Poll. Bull., 18:<br />
490-495.<br />
Mandaville, S.M. 2002. Benhic Macroinvertebrates in Freshwaters – Taxa Tolerance Values, Metrics, and<br />
Protocols. Project H-1, Soil and <strong>Water</strong> Conservation Society of Metro Halifax. http://chebucto.ca/Science/<br />
SWCS/SWCS.html, 48 s.<br />
Marinov, T., 1977. Fauna of Bulgaria, 6. Polychaeta. Sofia, Publishing house of the Bulgarian Academy of<br />
Sciences, 258 pp. (In Bulgarian).<br />
Morduhay-Boltovskoy, M. D., (Ed.), 1968. A key to Black Sea and Azov Sea fauna, vol. I, Kiev, Naukova<br />
Dumka, 437 pp. (In Russian).<br />
Morduhay-Boltovskoy, M. D., (Ed.), 1969. A key to Black Sea and Azov Sea fauna, vol. III, Kiev, Naukova<br />
Dumka, 340 pp. (In Russian).<br />
Morduhay-Boltovskoy, M. D., (Ed.), 1972. A key to Black Sea and Azov Sea fauna, vol. II, Kiev, Naukova<br />
Dumka, 536 pp. (In Russian).<br />
Muxika I., Borja A., Bald J., 2007. Using historical data, expert judgement and multivariate analysis in assessing<br />
reference conditions and benthic ecological status, according to the European water framework <strong>Directive</strong>. Mar.<br />
Poll. Bull., 55: 16-29.<br />
Muxika, I., Borja, Á., Bonne, W., 2005. The suitability of the marine biotic index (AMBI) to new impact<br />
sources along European coasts. Ecological Indicators, 5: 19-31.<br />
NFS 2006:11 http://www.naturvardsverket.se/sv/Lagar-och-andra-styrmedel/Lag-och-ratt/Foreskrifter-ochallmanna-rad/Foreskrifter-utgivningsordning/#2006<br />
Pearson, T.H. and Rosenberg, R., 1978. Macrobenthic succession in relation to organic enrichment and pollution<br />
of the marine environment. Oceanogr. Mar. Biol. Ann. Rev. 16: 229–311.<br />
Perus, J., Bäck, S., Lax, H-G., Westberg, V., Kauppila, P. & Bonsdorff, E. 2004. Coastal marine zoobenthos as<br />
an ecological quality element: a test of environmental typology and the European <strong>Water</strong> <strong>Framework</strong> <strong>Directive</strong>.<br />
Coastline Reports 4: 27-38.<br />
Perus, J., Bonsdorff, E., Bäck, S., Lax, H-G., Westberg, V. Villnäs, A. 2007. Zoobenthos as indicator of ecological<br />
status in coastal brackish waters: A comparative study from the Baltic Sea. Ambio 36 (2-3): 250-256.<br />
Pinedo, S. 1998. Structure and dynamics of Western Mediterranean soft-bottom communities along a<br />
disturbance gradient. Natural and man-induced variability in the Bay of Blanes. Ph D thesis, Universidad de<br />
Barcelona, Spain. 177 pp.<br />
Rosenberg, R., Blomqvist, M., Nilsson, C.H., Cederwall, H., Dimming, A., 2004. Marine quality assessment<br />
by use of benthic species-abundance distributions; a proposed new protocol within the European Union <strong>Water</strong><br />
<strong>Framework</strong> <strong>Directive</strong>. Mar. Poll. Bull. 49, 728-73<br />
Shannon, C. E. & W. Weaver, 1963. The mathematical theory of communication, University Illinois Press,<br />
Urbana, 117 pp.<br />
Simboura N, Panayotidis P, Papathanassiou E., 2005. A synthesis of the Biological Quality Elements for the<br />
implementation of the European <strong>Water</strong> <strong>Framework</strong> <strong>Directive</strong> in the Mediterranean Ecoregion: the case of<br />
Saronikos Gulf. Ecol. Indicators, 5: 253-266.<br />
Simboura, N. and A. Zenetos. 2002. Benthic indicators to use in ecological quality classification of Mediterranean<br />
soft bottom marine ecosystems, including a new Biotic index. Med. Mar. Science, 3(2):77-111.<br />
107
Simboura, N., E. Papathanassiou & D. Sakellariou, 2007.The use of a biotic index (Bentix) in assessing long<br />
term effects of dumping coarse metalliferous waste on soft bottom benthic communities. /Ecological Indicators,<br />
7(1): 164-180.<br />
Todorova V. & Konsulova T., 2005. Manual for collection and treatment of soft bottom macrozoobenthos<br />
samples. Online: http://bsc.ath.cx/documents/ExpertNetwork/docs/<br />
Expert %20Network %20- %20Zoobenthos/Todorova %20Manual_zoobenthos.doc<br />
Vuori, K-M., Bäck, S., Helssten, S., Karjalainen, S. M., Kauppila, P., Lax, H-G., Lepistö, L., Londesborough, S.,<br />
Mitikka, S., Niemelä, P., Niemi, J., Perus, J., Pietiläinen, O-P., Pilke, A., Riihimäki, J., Rissanen, J., Tammi, J.,<br />
Tolonen, K., Vehanen, T., Vuoristo, H., Westberg, V. 2006. The basis for typology and ecological classification<br />
of water bodies in Finland. The Finnish Environment. 807. 151 pp. (in Finnish with English summary)<br />
Wallin M., Wiederholm T., Johnson R.K., 2003. Guidance on establishing reference condition and ecological<br />
class boundaries for inland surface waters. Produced by CIS Working Group 2.3 – REFCOND: 86 pp.<br />
Wiederholm, T. 1973. Bottom fauna as an indicator of water quality in Sweden´s large lakes. AMBIO 2:107-<br />
110.Warwick R (1986) A new method for detecting pollution effects on marine macrobenthic communities.<br />
Mar.Biol. 92: 557-562.<br />
5<br />
108<br />
Annexes<br />
Annexes can be downloaded from the following address:<br />
http://circa.europa.eu/Public/irc/jrc/jrc_eewai/library?l=/<strong>intercalibration</strong>_2&vm=detailed&sb=Title<br />
Section 2 – Benthic Invertebrates – Overview of Annexes<br />
A – Baltic GIG<br />
Annex 2.1: Comparison of the Finnish and Swedish macroinvertebrate classification systems using Finnish coastal data<br />
from the Baltic Sea
Section 3 – Phytoplankton<br />
1<br />
Introduction<br />
All four coastal water GIGs have been able to produce results for the phytoplankton quality element.<br />
NE Atlantic, Baltic and Mediterranean GIG have intercalibrated single metrics based on chlorophyll<br />
a concentration, while Romania and Bulgaria in the Black Sea GIG agreed on the phytoplankton<br />
boundaries based on seasonal average biomass (mg/m 3 ). Only NEA GIG intercalibrated also other<br />
metrics (besides chlorophyll a) indicative for phytoplankton composition. Those were Indicator<br />
Taxa (Frequency of Phaeocystis Cell counts) and Taxa Cell Counts (Frequency of phytoplankton<br />
taxa cells counts).<br />
All the GIGs have chosen option 2 or a hybrid between option 2 and 3 in this phase of the<br />
<strong>intercalibration</strong> process. Member States have developed metrics as part of their own classification<br />
schemes. All Selected metrics have been chosen by each GIG for assessment and agreement of<br />
boundaries in this phase of the <strong>intercalibration</strong> process. At this stage not all the metrics that make up<br />
Member States’ schemes can be intercalibrated, so it is not possible to produce EQRs for the whole<br />
quality element. Boundaries have been agreed for the selected metrics.<br />
2<br />
2.1<br />
Methodology and results<br />
Baltic GIG<br />
2.1.1 Intercalibration approach<br />
The Baltic Sea Geographical Intercalibration Group (GIG) includes the whole or parts of the<br />
coastline of the following countries: Germany, Denmark, Estonia, Finland, Latvia, Lithuania, Poland<br />
and Sweden (Table 2.1.1).<br />
The common coastal water types are characterised by the descriptors of the System B typology.<br />
The typology factors are based on the common typology framework presented in the guidance<br />
on the typology for the coastal and transitional waters 20 . In the Baltic Sea GIG, the common<br />
<strong>intercalibration</strong> types were characterized using basic salinity and exposure with further delineation<br />
based on depth and number of ice cover days (Table 2.1.1). One transitional water type (TW B 13)<br />
was identified. All countries agreed to focus the <strong>intercalibration</strong> on the quality elements that are<br />
sensitive to eutrophication pressures.<br />
The common <strong>intercalibration</strong> types were characterized by the following descriptors:<br />
– Salinity (using practical salinity scale): low (0,5-3) and high (3-6) oligohaline, mesohaline (6-22)<br />
– Depth: all shallow (
110<br />
– Exposure (using agreed Pan-European scale 21 ): exposed, sheltered and very sheltered<br />
– Duration of ice cover: >150 days/ year, 90-150 days/ year, no or very short ice cover<br />
For phytoplankton a hybrid between option 2 and 3 was used. A common metric – summer mean<br />
of chlorophyll a from May/June to September 22 - was agreed. Intercalibration was performed by<br />
comparison of the results of the national assessments. Within each type member states essentially<br />
agreed on common reference and classifications values for the whole type or for sub areas in the type.<br />
Details of the national methods, reference condition and boundary setting, as well as references to<br />
earlier literature and <strong>report</strong>s within each country, are available in Annex 3.1-3.7.<br />
Table 2.1.1: Description of Baltic Sea Common <strong>intercalibration</strong> types that have included in the <strong>intercalibration</strong> exercise.<br />
Type Salinity psu Exposure Depth Ice days Other Characteristics<br />
CW B0 0.5- 3 Sheltered Shallow > 150 Sites in Botnian Bay (Northern Quark)<br />
CW B2 3-6 Sheltered Shallow > 150 Sites in Bothnian Sea<br />
CW B3 a 3-6 Sheltered Shallow 90-150 Sites in the area extending from the southern<br />
CW B3 b 3-6 Exposed Shallow 90 -150<br />
Bothinian Sea to the Archipelago Sea and<br />
the western Gulf of Finland<br />
CW<br />
B12 a<br />
Eastern<br />
Baltic Sea<br />
CW<br />
B12 b<br />
Western<br />
Baltic Sea<br />
5-8 Sheltered Shallow - Sites in the Gulf of Riga<br />
8 - 22 Sheltered Shallow - Sites at the Southern Swedish coast and the<br />
South western Baltic Sea open coast along<br />
Denmark and Germany<br />
CW B13 6-22 Exposed Shallow - Sites along the coast of the Estonia, Latvia<br />
and Lithuania, the Polish coast and the<br />
Danish island “Bornholm”<br />
CW B 14 6-22 Sheltered Shallow - Lagoons<br />
TW B 13 6-22 Exposed Shallow Transitional water. Sites along the coast of<br />
Lithuania and Poland<br />
Countries sharing types that have been intercalibrated:<br />
Types CWB0, CWB2, CWB3a, CWB3b: Finland, Sweden.<br />
Type CWB12a: Estonia<br />
Type CWB12b: Germany, Denmark, Sweden.<br />
Type CWB13: Denmark, Estonia, Lithuania, Latvia, Poland.<br />
Type CWB14: Denmark, Poland<br />
Type TWB13: Lithuania, Poland.<br />
21 According to the definitions of the common European exposure categories; Guidance document No. 5<br />
22 The definition of the length of the summer period depends on the latitude and area of the Baltic Sea.
2.1.2 National methods that were intercalibrated<br />
In the Baltic Sea GIG average summer chlorophyll a concentration was chosen as the metric for<br />
the <strong>intercalibration</strong> of the phytoplankton element. All countries used the monitoring data available<br />
in their national data bases to set the reference conditions for their national types. At the time of<br />
the <strong>intercalibration</strong>, final national metrics were not yet available. Chlorophyll a values for summer<br />
growth season were averaged to obtain reference conditions and boundary values for seasonally<br />
defined phytoplankton metric. The period of aggregation varied depending of the latitude. Finland<br />
and Sweden used average chlorophyll a values from data sampled between June and August for<br />
the types in the Northern Baltic Sea. For the types in the Baltic Proper (B13) and Gulf of Riga<br />
(B12) Estonia used growth period between June-September to calculate average values. In the<br />
Southern Baltic Sea, Denmark and Poland used values averaged over May-September. In Germany<br />
chlorophyll a values were originally averaged for the period between March-October in their<br />
national reference conditions setting.<br />
Further information on national methods and assessments can be found in Annexes 3.1-3.7.<br />
2.1.3 Reference conditions and boundary setting:<br />
Denmark<br />
Two methods have been used to establish reference conditions for phytoplankton biomass expressed<br />
as chlorophyll a in Danish waters:<br />
1. Development of reference conditions using historical Secchi depth measurements and<br />
relationships between Secchi depth and chlorophyll a obtained from recent monitoring<br />
data from Danish coastal waters (more detailed presentation of the method and procedure<br />
is presented in the Annex 3.1) Reference conditions for chlorophyll a are calculated as<br />
predictions from the relationships corresponding to an average secchi depth around the<br />
beginning of the 20th century.<br />
2. Reference conditions were estimated from a combination of 1) hind-casted nutrient inputs<br />
(loading of total nitrogen) to the Danish straits based on estimates of the nitrogen surplus<br />
from Danish agriculture and estimated changes in point sources, 2) characterization (expert<br />
judgment) of reference loading using the hind-casted estimates, and 3) historical nitrogen<br />
inputs projected into total nitrogen (TN) levels and related to chlorophyll a levels in coastal<br />
waters (see Annex 3.1 for detailed presentation)<br />
Two different approaches were used to set the chlorophyll a boundaries between good and moderate<br />
ecological status for the selected Danish <strong>intercalibration</strong> sites (described in detail in Annex 3.2):<br />
1. Historical secchi depth observations are compared to chlorophyll a -secchi depth relationships<br />
established from recent data (as described above). Boundaries between good and moderate<br />
status for chlorophyll a are then defined as reference conditions plus 50 % in accordance with<br />
the HELCOM Eutro approach.<br />
2. Relationships between nitrogen loading and total nitrogen (TN) as well as between TN and<br />
chlorophyll a are established using recent monitoring data. Site-specific boundaries for TN<br />
and chlorophyll a were predicted from modelled time series of nutrient inputs to the Danish<br />
straits. The boundary values of nutrient inputs for different time periods were been selected<br />
using expert judgement.<br />
Comparing the results from the two approaches indicated that the use of historical nitrogen inputs<br />
(method 2) generally resulted in lower reference conditions and boundaries than the use of historical<br />
111
secchi depths (method 1). Confidence intervals for the historical secchi depth method are also wider,<br />
suggesting that the use of historical nitrogen input is giving more precise and unbiased estimates of<br />
reference conditions (Table 2.1.2).<br />
Table 2.1.2: Comparison of good - moderate boundary values of the summer mean chlorophyll a (µg l -1 ) from a number<br />
of Danish coastal water bodies, based on two different approaches: 1) Historical secchi depths and chlorophyll a -<br />
secchi relationships, and 2) historical nitrogen inputs projected into total nitrogen levels and subsequently to chlorophyll<br />
a levels. In the second approach median values are shown in order to obtain a comparable value to the geometric mean<br />
of the first approach.<br />
Area<br />
112<br />
Geometric<br />
mean<br />
1) Historical secchi depths 2) Historical nitrogen inputs<br />
Lower<br />
confidence<br />
Upper<br />
confidence<br />
Median<br />
Lower<br />
confidence<br />
Upper<br />
confidence<br />
Northern Kattegat 2.28 1.72 3.01 1.69 1.45 1.96<br />
Fakse Bay 2.06 1.51 2.81 1.62 1.04 2.34<br />
Hjelm Bay 2.32 1.75 3.06 1.53 0.86 2.37<br />
Hirtshals 2.42 1.65 3.54 2.84 2.62 3.07<br />
Århus Bay 2.40 2.11 2.73 1.84 1.60 2.09<br />
West of Bornholm 3.66 2.57 5.23 1.31 1.01 1.68<br />
Outer Wadden Sea 3.76 2.82 5.01 6.13 5.57 6.74<br />
North of Funen 2.79 2.42 3.22 2.25 1.97 2.56<br />
Northern Sound 2.55 1.55 1.05 2.17<br />
Dybsø Fjord 1.31 0.65 2.55<br />
Inner Wadden Sea 6.10 5.25 7.11<br />
The recommended boundaries for the Danish <strong>intercalibration</strong> sites, based on the relationship<br />
between total nitrogen and chlorophyll a (as method 2), are presented in Table 2.1.3. The good-<br />
moderate boundaries are calculated as the range between the median value and the upper confidence<br />
value from the Table 2.1.2. The high-good boundary and the reference conditions are established<br />
by expert judgement based on historical nitrogen loading and corresponding TN and chlorophyll a<br />
relationships.<br />
Table 2.1.3: Recommended chlorophyll a boundaries (arithmetic mean for summer values between May<br />
–September, as µg l -1 ) for the Danish <strong>intercalibration</strong> sites in the Baltic Sea.<br />
Intercalibration sites Reference conditions<br />
Estonia<br />
Fakse Bay<br />
Hjelm Bay<br />
Bornholm west<br />
Dybsø Fjord<br />
1.4<br />
1.2<br />
0.9<br />
High/good<br />
boundary<br />
1.5<br />
1.3<br />
1.1<br />
Good/moderate<br />
Boundary<br />
1.7 – 2.6<br />
1.5 – 1.9<br />
1.6 – 3.1<br />
In Estonian waters reference conditions were obtained by setting empirical relationships between<br />
nutrient concentrations, water transparency and phytoplankton parameters. The time series data<br />
from the period 1993-2005 was used to assess average concentrations levels and trends for summer
period (between June to September) in each national coastal type. Reference conditions were set by<br />
using frequency distributions and assuming that 20 % deviation from the lowest concentrations as<br />
reference conditions. For the Secchi depth transparency, 20 % deviation from the maximum values<br />
was proposed as reference conditions, respectively.<br />
Expert judgement based on analysis of the monitoring data from the period 1993-2005 was used in<br />
the boundary setting. The areas belonging to the Baltic GIG common type B13 have been monitored<br />
only in 2005. The time series data were considered to assess average concentrations levels and<br />
trends in each coastal type. The high-good and good-moderate boundary values for chlorophyll a<br />
were derived as 20, and 50 % deviation from the reference conditions (Table 2.1.4).<br />
Table 2.1.4: Recommendations for the reference conditions and classification boundaries for the Estonian coastal<br />
waters belonging to the common <strong>intercalibration</strong> type B13. The boundary value for the high status class represents 20 %<br />
deviation and the good-moderate boundary 50 % deviation from the reference conditions. The two lower boundaries are<br />
derived as 70 % and 90 % deviation from the reference conditions.<br />
Parameter<br />
Total nitrogen<br />
(annual mean)<br />
Total phosphorus<br />
(annual mean)<br />
Reference<br />
value<br />
unit<br />
% deviation from reference conditions<br />
20 % 50 % 70 % 90 %<br />
10.6 µM 12.27 15.90 18.02 20.14<br />
0.28 µM 0.336 0.42 0.476 0.532<br />
Secchi depth 8 m 7.20 6.00 4.40 2.40<br />
Chlorophyll a 1.1 mg m -3 1.32 1.65 1.87 2.09<br />
Biomass 0.29 mg l -1 0.348 0.43 0.493 0.551<br />
Finland<br />
In Finnish coastal waters, the reference values of chlorophyll a were estimated based on three<br />
methods: (1) empirical modeling using the relationships between chlorophyll a and Secchi depth,<br />
(2) statistical analyses on frequency distribution data by using 5 % deviation from the lowest<br />
values as the boundary between high and good status and (3) trend analyses of chlorophyll a in the<br />
<strong>intercalibration</strong> sites or in the vicinity of them (detailed presentation in Annex 3.4).<br />
Type specific reference conditions for phytoplankton have been estimated using empirical<br />
relationships between concentrations of chlorophyll a and Secchi depth of the present monitoring<br />
programs and the historical Secchi values of the early 1900s (Annex 3.4). The reference chlorophyll<br />
a concentrations represent mean values which were estimated from the empirical equations using<br />
the historical Secchi values covering the Finnish <strong>intercalibration</strong> types. Following the Swedish<br />
model, the 95 % confidence limits of variation were estimated to represent the boundary between<br />
high and good at its maximum.<br />
Scientific grounds are required to justify the boundaries between good and moderate status.<br />
Therefore, changes in eutrophication, revealed by other ecological variables, were used to find out<br />
if there is an ecologically reasonable base to estimate the chlorophyll boundary between good and<br />
moderate status in the Finnish coastal types. The variables included were the depth limit of Fucus<br />
vesiculosus and the occurrence of cyanobacteria in phytoplankton assemblages in relation to Secchi<br />
depth and chlorophyll a concentrations.<br />
113
Germany<br />
In the German coastal waters, modelling was used to calculate loading of total nitrogen (TN) from<br />
rivers (see Annex 3.7). The marine value of 10 µM TN was taken from the literature was considered<br />
to be consistent with pristine coastal data. This value was also taken for the Baltic Sea due to the<br />
long time period between pristine and recent conditions. References for all salinities were estimated<br />
using mixing diagrams. For local calculations of references, recent mean salinity data and the<br />
freshwater reference of the next eastern located river were used, assuming a residual current moving<br />
westward along the surface of the German Baltic coastline. The reference chlorophyll a values were<br />
calculated using regression between total nitrogen (TN) and chlorophyll a concentrations during the<br />
growth season (months March- October).<br />
Boundary values were calculated from summer values of recent monitoring data. The analysis<br />
is based on 438 data sets sampled during 1978 and 2004 on 8 outer coastal sites along a salinity<br />
gradient from 7 to 17 PSU, which represent the extended <strong>intercalibration</strong> sites. A significant<br />
correlation between TN and chlorophyll a could not be found for these <strong>intercalibration</strong> sites.<br />
Therefore the boundary setting was performed by linear division along the actual gradient of<br />
chlorophyll a values. The 80 %-percentile (3.4 µg chlorophyll a /l) marked the boundary poor-bad.<br />
The boundaries between good and moderate status as well as between moderate and poor status<br />
represent the three equal parts between high and poor state of the water type.<br />
Poland<br />
Reference conditions were calculated on the basis of empirical relationships obtained from<br />
contemporary monitoring data. Only data obtained in summer period (May-September) in<br />
1999-2005 were taken into consideration – in total: 61 chlorophyll a concentration values with<br />
corresponding water transparency values (SD) and TN concentration values (detailed description in<br />
Annex 3.5).<br />
Assuming that 6 m is a water transparency reference value for summer – estimated from historical<br />
data, corresponding chlorophyll a concentrations values were calculated by means of linear<br />
regression. Chlorophyll a reference values were also estimated on the basis of total nitrogen (TN)<br />
concentration reference values determined for outer Puck Bay, using the method of extrapolation of<br />
temporary trends. Results of reference value calculations obtained by different methods are shown<br />
in the Table 2.1.5.<br />
In the calculations of the relationship between chlorophyll a and TN, only summer nitrogen<br />
concentrations were used because data from the winter period was incomplete. However, the<br />
relationship between chlorophyll a and transparency was better, and therefore the chlorophyll<br />
a reference concentration for Kępa Redłowska <strong>intercalibration</strong> site was estimated by using the<br />
chlorophyll a and water transparency regression. The obtained reference values (3.7 mg·m -3 ) was<br />
Table 2.1.5: Chlorophyll a (chl-a) reference values for Kępa Redłowska area assessed on the basis of relationship with<br />
water transparency and total nitrogen (TN) concentrations.<br />
Method of reference values determination Chlorophyll a reference value<br />
Linear correlation chl-a/ transparency 3.7<br />
Exponential relationship chl-a/ transparency 3.7<br />
Linear correlation chl-a/ TN 3.0<br />
Exponential relationship chl-a/ TN 3.1<br />
114
much higher than the reference value (1.2 mg·m -3 ) obtained for the Swedish coastal waters type<br />
for the CWB13. However, the this value reflects the strong impact of the Vistula River – one of the<br />
biggest rivers in Europe. Therefore a significant part of the Gulf of Gdańsk (inner Gulf of Gdańsk)<br />
was assigned to be transitional waters having thus higher reference values for that region than for<br />
other coastal waters belonging to the type B13.<br />
Discontinuities, which could indicate class boundaries, in the chlorophyll a concentration/ water<br />
transparency relationship were not found. Consequently, the ecological status classification was<br />
based on statistic methods.<br />
Values 25 % and 50 % were agreed to be the acceptable deviation from the reference conditions<br />
(following recommendation of the HELCOM EUTRO project), that is, if the chlorophyll a<br />
concentration increases by 25 % or 50 % in relation to reference value, ecological state is still good.<br />
With regard to considerable scatter of chlorophyll a concentration values, which indicates significant<br />
natural variability of environmental conditions, the higher acceptable deviation from reference value –<br />
50 % was adopted. In this way the boundary between good ecological status and moderate ecological<br />
status (3.7 + 50 %) was obtained and it equals chlorophyll a concentration value – 5.6 mg·m -3 .<br />
The boundary between moderate and poor ecological status was established on the basis of statistical<br />
analyses on the frequency distribution of data. This value was 7.3 mg·m -3 , which is a median in<br />
value range 6.0
The reference value indicates the average pristine condition. There is natural variation around this<br />
value. The boundary between high and good status was set at a level where this natural variation is<br />
judged to be exceeded. The 95 % confidence limit of variation was used as guidance.<br />
Classifications for the Baltic proper coastal areas are based on dose-effect relations with total<br />
nitrogen which was used to calibrate classes to assure a similar outcome of classification<br />
exercises. In the Baltic proper the relation between phytoplankton and TN was stronger than<br />
between phytoplankton and TP and consequently only TN was used to develop classifications<br />
for phytoplankton. The empirical relationship between chlorophyll and TN was used to set<br />
corresponding boundaries for chlorophyll. The southern Gulf of Bothnia is influenced by the Baltic<br />
proper and a similar classification has been used in both areas. Further north in the Gulf of Bothnia<br />
the influence of humic substances from freshwater increases which motivate an upward adjustment<br />
of the classification limits for Secchi depth, chlorophyll a and phytoplankton<br />
The classification of the general condition in open coastal areas as moderate means that the<br />
ecological status of many coastal waters is not mainly determined by the local discharges, but rather<br />
the general conditions of the Baltic Sea (Fig. 2.1.1). This calls for methods to separate the effect on<br />
coastal waters into two parts: one that is directly manageable by local measures and one part that<br />
is manageable by efforts by all countries together. An empirical model was developed to provide<br />
quantitative estimates of the possible improvements in Secchi depth and reductions in chlorophyll a<br />
and phytoplankton biomass resulting from local measures (Annex 3.6).<br />
Estimated chlorophyll a values for reference conditions and classification boundaries, as well as<br />
the subsequent Ecological Quality Ratios for Swedish coastal waters corresponding the common<br />
<strong>intercalibration</strong> types for the Baltic Sea are presented in Table 2.1.7.<br />
116<br />
R.v. fresh<br />
water<br />
Tot-N<br />
FW correction<br />
Mixing model<br />
Measured<br />
salinity<br />
Ex. measured tot-N<br />
FW corrected<br />
+OS corrected<br />
OS corr.<br />
Measured in open<br />
R.v. in open<br />
sea<br />
Salinity<br />
in open sea<br />
Salinity<br />
Fig. 2.1.1: Mixing model used to correct for natural background of fresh water inputs of total nitrogen (FW correction).<br />
The fresh water corrected value forms the basis for classification of ecological status. The model also can be used to<br />
estimate the influence of the open sea on total nitrogen (OS correction). The open sea correction is used to estimate the<br />
degree to which local measures will have an effect on local ecological status (R.v. = Reference values).
Table 2.1.7: Reference values (Rv), class boundaries (HG=high-good, GM= good-moderate, MP= moderate-poor, PB=<br />
poor-bad) and corresponding EQR for summer levels of chlorophyll a (µg/l). Grey marking means that values should be<br />
corrected according to salinity and estimated natural background load of nitrogen in respective area before comparison with<br />
class boundaries (see text). Intercalibration sites correspond to the the common <strong>intercalibration</strong> types of the Baltic GIG.<br />
2.1.4 Results of the comparison and harmonisation<br />
Type B0: Salinity 0.5-3, sheltered, shallow, >150 ice days<br />
Sites Preliminary<br />
Status 1<br />
Bergö (FI)<br />
Gaviksfjarden (SE)<br />
Holmöarne, N<br />
Kvarken (SE)<br />
The Quark –<br />
Orefjärden (SE)<br />
-<br />
H/G<br />
G/M<br />
H/G<br />
Reference<br />
values<br />
1.3<br />
1.4<br />
1.1<br />
1.2<br />
1 Borderline in the Intercalibration network register<br />
Classification table<br />
Type B 0 Boundary high/<br />
good<br />
Sweden: Gaviksfj.<br />
Holmöarna<br />
Örefjärden<br />
1.8<br />
1.5<br />
1.8<br />
Calculated value<br />
1995 – 2000<br />
2.2<br />
Data missing<br />
1.6<br />
Calculated<br />
value<br />
2000 – 2004<br />
2.0<br />
1.4<br />
EQR H/G Boundary good/<br />
moderate<br />
0.78<br />
0.73<br />
0.67<br />
2.3<br />
2.0<br />
2.3<br />
Time period<br />
for ref values<br />
1925-1932<br />
1900-1920<br />
1900-1920<br />
Finland<br />
Classification<br />
G<br />
H<br />
H<br />
Sweden<br />
Classification<br />
G<br />
H<br />
H<br />
EQR G/M Period<br />
0.61<br />
0.55<br />
0.52<br />
June – August<br />
Finland 1.8 0.72 2.7 0.48 July – August<br />
117
Type B2: Salinity 3-6, sheltered, shallow, >150 ice days<br />
Sites Prelimin.<br />
Status 1<br />
Domarkobban (FI)<br />
Järviluoto (FI)<br />
Pjelaxfjarden (FI)<br />
Rounakari (FI)<br />
Harkskars and Trodjefjard (SE)<br />
Langvinds- and Skarsfjarden (SE)<br />
The Bay of Gavle, Outer (SE)<br />
Ljusnan and Voxnan (SE)<br />
118<br />
H/G<br />
G/M<br />
G/M<br />
G/M<br />
H/G<br />
H/G<br />
G/M<br />
G/M<br />
Reference<br />
values<br />
1.4<br />
1.4<br />
1.4<br />
1.4<br />
1.4<br />
1.4<br />
1.4<br />
1.4<br />
1 Borderline in the Intercalibration network register<br />
Classification table<br />
Type B 2 Boundary high/<br />
good<br />
Calculated<br />
value<br />
1995 – 1999<br />
-<br />
3.8<br />
2.4<br />
3.3<br />
-<br />
-<br />
-<br />
-<br />
Calculated<br />
value<br />
2000 – 2004<br />
1.4<br />
3.2<br />
4.2<br />
2.1<br />
EQR H/G Boundary good/<br />
moderate<br />
Time period<br />
for ref values<br />
1925-1934<br />
1925-1934<br />
1925-1934<br />
1925-1934<br />
1900-1920<br />
Finland<br />
Classifikation<br />
Data 2000-2004<br />
H<br />
M or lower<br />
M or lower<br />
G<br />
Sweden<br />
classifikation<br />
H<br />
M or lower<br />
M or lower<br />
G<br />
EQR G/M Period<br />
Sweden 1,8 0,78 2.3 0,61 June – August<br />
Finland 1,8 0,78 2,6 0,54 July – August<br />
Type B3: Salinity 3-6, sheltered, shallow, 90-150 ice days<br />
Sites Prelimin.<br />
Status 1<br />
Bågaskär I (FI)<br />
Långskär I (FI)<br />
Putsaari II (FI)<br />
Seili II (FI)<br />
The Askoe area<br />
(SE)<br />
The Yxla area<br />
(SE)<br />
G/M<br />
H/G<br />
H/G<br />
G/M<br />
G/M<br />
G/M<br />
Reference<br />
values<br />
1.8<br />
1.8<br />
1,5<br />
1.5<br />
1.2<br />
1.3<br />
Calculated<br />
value<br />
1995 – 1999<br />
4.9<br />
3.7<br />
2.1<br />
2.7<br />
2.7*<br />
Calculated<br />
value<br />
2000 – 2004<br />
6.3<br />
6.6<br />
2.4<br />
4.2<br />
2.7**<br />
3.3***<br />
1 Borderline in the Intercalibration network register<br />
* 0 m, Jun-Aug 1995-1999, 1 station, ca 6 samplings/year during Jun-Aug<br />
** 0 m, Jun-Aug 2000-2003, 1 station, ca 6 samplings/year during Jun-Aug<br />
*** 0 m, Aug 2001, 2004, 2005, 6 stations, one sampling per year.<br />
Classification table<br />
Time<br />
period for<br />
ref values<br />
1925- 1934<br />
c.1930 –<br />
1950<br />
Finland<br />
Classification<br />
M or lower<br />
M or lower<br />
H<br />
M<br />
G<br />
G or M<br />
Sweden<br />
Classification<br />
M or lower<br />
M or lower<br />
M or lower<br />
M or lower<br />
M or lower<br />
M or lower<br />
Type B 3 Boundary high/good EQR H/G Boundary good/moderate EQR G/M Period<br />
Sweden: Askoe area<br />
(More exposed)<br />
1.5 0.80 1.8 0.67 June – August 0 m<br />
Sweden: Yxla area 1.6a 0.81 1.9a 0.69 June - August 0 m<br />
Finland<br />
I: Archipelago Sea<br />
II: Western Gulf of<br />
Finland<br />
2.2<br />
2.6<br />
0.82<br />
0.58<br />
a: Dynamic reference values (and boundaries) estimated from salinity during sampling.<br />
2.9<br />
4.0<br />
0.62<br />
0.38<br />
July – August
Type B 12b: Salinity 6-22, sheltered, shallow<br />
Sites Borderline in<br />
Intercalibration<br />
network<br />
database<br />
Faxe Bay, DK<br />
Hjelm Bay, DK<br />
Darss-Zingst DE<br />
Geltinger Birk, DE<br />
Arc. Torhamn, SE<br />
Koiguste laht, EE<br />
G/M<br />
G/M<br />
G/M<br />
G/M<br />
G/M<br />
G/M<br />
Reference<br />
value<br />
1,4<br />
1,4<br />
Type B 14: Salinity 6-22, sheltered, shallow lagoons<br />
Sites Borderline in<br />
Intercalibration<br />
network database<br />
Dybsø Fjord (DK)<br />
Mielizna Borzynska (PL) 1 *<br />
Piaski Dziewicze (PL) 1 *<br />
Classification table<br />
120<br />
G/M<br />
H/G<br />
G/M<br />
Reference<br />
value<br />
0,9<br />
5<br />
4<br />
Calculated<br />
value<br />
1995-2000<br />
Calculated<br />
value<br />
2000-2004<br />
Time period<br />
for ref values<br />
Polish<br />
Classification<br />
2,3 1,3 G/M<br />
Type B 14 Boundary high/good EQR H/G Boundary good/moderate EQR G/M Period<br />
Danish<br />
Classification<br />
Denmark 1,1 0.82 1,6 0.56 May – September<br />
Data below not comparable with the information from other countries<br />
Mielizna Borzynska (PL)* 5 10 ?<br />
Piaski Dziewicze (PL)* 4 7,5 ?<br />
* Transitional waters. Data not comparable with the information from other countries
2.1.5 Results of the harmonization – Boundary EQR values<br />
Summery table with the results of the phytoplankton <strong>intercalibration</strong> in the Baltic Sea area.<br />
Reference<br />
conditions<br />
Boundary<br />
High/good<br />
EQR<br />
High/Good<br />
Boundary<br />
Good/ moderate<br />
EQR<br />
Good/ Moderate<br />
Type B 0<br />
Sweden 1.1 – 1.4 1.5 – 1.8 0.67 – 0.78 2.0 – 2.3 0.52 – 0.61<br />
Finland<br />
Type B 2<br />
1.3 1.8 0.72 2.7 0.48<br />
Sweden 1.4 1.8 0.78 2.3 0.61<br />
Finland<br />
Type B 3<br />
Sweden:<br />
1.4 1.8 0.78 2.6 0.54<br />
Askoe area (More<br />
exposed)<br />
1.2 1.5 0.80 1.8 0.67<br />
Sweden: Yxla area<br />
Finland<br />
1.3 1.6 0.81 1.9 0.69<br />
I: Archipelago Sea<br />
II: Western Gulf of<br />
Finland<br />
Type B 12<br />
1.8<br />
1.5<br />
2.2<br />
2.6<br />
0.82<br />
0.58<br />
2.9<br />
4.0<br />
0.62<br />
0.38<br />
Denmark 1.4 1.5 0.93 1.9 0.74<br />
Sweden<br />
Germany,<br />
1.2 1.5 0.80 1.9 0.63<br />
Geltinger Birk<br />
Germany,<br />
< 1.1 1.1 - 1.9 < 0.58<br />
Darss-Zingst < 1.1 1.1 - 1.9 < 0.58<br />
Estonia<br />
Type B13 CW<br />
1.8 2.2 0.82 2.7 0.67<br />
Denmark 1.2 1.3 0.92 1.6 0.75<br />
Estonia and Latvia<br />
Type B13 TW<br />
1.1 1.3 0.85 1.65 0.67<br />
Poland < 3.7 3.7 ? 5.6 0.67<br />
Lithuania<br />
Type B 14<br />
3.85 4,8 0.80 6,0 0.64<br />
Denmark 0.9 1.1 0.82 1.6 0.56<br />
Phytoplankton: parameter indicative of biomass (Chlorophyll a)<br />
Results: Ecological quality ratios and parameter values<br />
The following results refer to summer mean May/June – September<br />
121
Type and country Ecological Quality Ratios for the<br />
national classification systems<br />
CW B0<br />
All countries sharing the type<br />
CW B2<br />
All countries sharing the type<br />
CW B3 a<br />
Sheltered<br />
All countries sharing the type<br />
CW B3 b<br />
Exposed<br />
All countries sharing the type<br />
CW B 12 a<br />
Eastern Baltic Sea<br />
Salinity 5-8 psu<br />
All countries sharing the type<br />
CW B 12 b<br />
Western Baltic Sea<br />
Salinity 8 -22 psu<br />
All countries sharing the type<br />
CW B 13<br />
Denmark, Estonia and Latvia<br />
CW B 14<br />
Denmark<br />
TW B 13<br />
All countries sharing the type<br />
122<br />
High-Good<br />
boundary<br />
Good-Moderate<br />
boundary<br />
Countries sharing types that have been intercalibrated:<br />
Types CWB0, CWB2, CWB3a, CWB3b: Finland, Sweden.<br />
Type CWB12a: Estonia<br />
Type CWB12b: Germany, Denmark, Sweden.<br />
Type CWB13: Denmark, Estonia, Lithuania, Latvia, Poland.<br />
Type CWB14: Denmark, Poland<br />
Type TWB13: Lithuania, Poland.<br />
Parameter values/ranges<br />
Chlorophyll a µg/l<br />
High/-Good<br />
boundary<br />
Good-Moderate<br />
boundary<br />
0.76 0.56 1.7 (1.5 – 1.8) 2.3 (2.0 -2.7)<br />
0.78 0.56 1.8 2.5 (2.3 -2.6)<br />
0.71 0.49 2.4 (2.2 - 2.6) 3.5 (2.9 – 4.0)<br />
0.81 0.68 1.6 (1.5 – 1.6) 1.9 (1.8 – 1.9)<br />
0.82 0.66 2.2 2.7<br />
0.92 0.63 1.3 (1.1 – 1.5) 1.9<br />
0.92 0.75 1.3 1.6<br />
0.82 0.56 1.1 1.6<br />
0.90 0.66 4.2 5.8<br />
2.1.6 Open issue and need for further work<br />
All member states were participating in the <strong>intercalibration</strong> of the chlorophyll a metrics and setting<br />
of reference conditions and boundaries as well as EQR values for chlorophyll a (Latvia agreed<br />
on the boundaries for type CWB13 developed by other member states). Further development and<br />
<strong>intercalibration</strong> is needed for other phytoplankton parameters. Assessment methods were not yet<br />
ready for phytoplankton species composition and phytoplankton blooms in any of the Baltic GIG<br />
member states.
2.2<br />
2.2.1<br />
Black Sea GIG<br />
Intercalibration approach<br />
Typology<br />
In the Black Sea was identified only one common type, as is shown in the table below:<br />
Tab 2.2.1: Black Sea GIG Coastal <strong>Water</strong> Types included in the <strong>intercalibration</strong>.<br />
Type Salinity Tidal range Depth Substratum<br />
CW – BL1 mezohaline microtidal shallow mixed<br />
The countries participating at this <strong>intercalibration</strong> exercise into the Black Sea region are Bulgaria<br />
and Romani<br />
2.2.2<br />
Reference conditions and class boundary setting<br />
a. BULGARIA<br />
Dr. Assoc. Prof. Snejana Moncheva, Junior Res. Natalia Slabakova, Marine Biology and Ecology<br />
Department, INSTITUTE OF OCEANOLOGY, BAS, Varna<br />
Identification of type-specific biological reference conditions for the coastal waters<br />
After the critical review of the possible phytoplankton descriptors and the outlined constrains and<br />
uncertainties for the identification of type-specific biological reference conditions for the coastal<br />
waters the following metrics have been selected:<br />
• Phytoplankton biomass [mg/m 3 ]<br />
• Chlorophyll a [mg/m 3 ] and<br />
• Phytoplankton blooms (need of further development)<br />
Approach<br />
The approach for the identification of reference conditions is based on:<br />
• historical data from the relatively pristine period of the Bulgarian Black Sea coast (1954-1970<br />
– published seasonal data);<br />
• 10 th percentile (lower quartile) of a long-term data set (period 1983-2005) to test applicability<br />
for definition of reference values and for the selection of “bad values” (from the period of<br />
intensive anthropogenic eutrophication – the 80-ies) (Heiskanen et al., 2005). This step was<br />
crucial for the identification of reference values for chlorophyll a. Due to lack of chlorophyll a<br />
measurements from the reference period and before 1990, the 10 th percentile from a long-term<br />
data set (1990-2006) was determined and its applicability tested against the results from the<br />
analysis of the phytoplankton data set .<br />
• expert judgment<br />
• As initially phytoplankton is an indicator of eutrophication mainly, the typology groups were<br />
considered in relation to the level of exposure and depth. In addition due to the influence of<br />
the Danube river nutrient enriched waters through the main Black Sea current along the Black<br />
Sea coast the moderately-exposed-intermediate and exposed-shallow types were combined<br />
123
124<br />
into one group. Thus the classification tool was developed for the following 2 typology<br />
groups: moderately exposed - shallow (CW602330; CW602310) and moderately-exposedintermediate/exposed-shallow<br />
types (CW602210; CW602220; CW602230; CW602321).<br />
• Due to the high seasonal variability of phytoplankton communities composition and abundance<br />
the average annual values are not adequate and the classification tool should be developed on<br />
seasonal bases<br />
In order to illustrate the approach the Galata/Varna Bay sites were selected on the basis of the best<br />
(only) available long-term data set, over the period 1954-2006 (phytoplankton) and 1990-2006<br />
(chlorophyll a).<br />
The data sets of the two sites were merged into one data array based on the following assumptions:<br />
1) the intensive hydrophysical interaction between the two sites that to a great extent determine<br />
the spatial distribution and dynamic of phytoplankton communities thus reflecting the synergy<br />
between the local land base sources and the Danube influence through the main Black Sea<br />
currents.<br />
2) Principally the analytical procedure of phytoplankton processing (biomass estimation) are<br />
comparable for the data array 1954-1998, assuming 25 % analytical error inherent in the<br />
method itself. The difference of sampling frequency (seasonal sampling for the historical data<br />
versus monthly /bimonthly sampling after 1980) should be underlined.<br />
3) Originally phytoplankton is the biological quality element most sensitive to external forcing<br />
(nutrient over-enrichment (eutrophication), light, currents etc.).<br />
4) the values estimated for the period 1954-1970 correspond to High status, and those from the<br />
period 1983-1998 to Bad status, and they represent the worst High and the worst Bad along<br />
the Bulgarian Black Sea coast (Moncheva et al, 1995, 2001, Moncheva, Kamburska, 2002).<br />
Results<br />
Table 2.2.2: Statistical summary of phytoplankton biomass B[mg/m3] by seasons (Galata-Varna Bay).<br />
years<br />
winter winter spring spring summer summer autumn autumn annual annual<br />
1954-<br />
1970<br />
1983-<br />
1997<br />
1954-<br />
1970<br />
1983-<br />
1997<br />
1954-<br />
1970<br />
1983-<br />
1997<br />
1954-<br />
1970<br />
1983-<br />
1997<br />
1954-<br />
1970<br />
n 15 18 14 45 11 39 15 18 55 120<br />
1983-<br />
1997<br />
Average* 2075 7763 3995 36892 526 39035 783 31639 1845 28832<br />
Median* 1214 3088 2700 8055 534 23196 489 854 1234 8798<br />
Max* 6800 42260 12290 583139 900 157789 2483 296675 12290 583139<br />
*the values within the 95 % confidence interval after the statistical processing of the data array<br />
As apparent from the data presented the average annual gives no idea about the alterations in the<br />
seasonal pattern of phytoplankton dynamics, the severe increase in summer biomass in particular<br />
(related hypoxia/anoxia conditions and ecosystem deterioration as one of the most important<br />
ecological concerns) bearing implications for the proper environmental management policy and<br />
monitoring design.<br />
Principally the historical median was selected as the seasonal reference value, and the “average”<br />
for autumn only. The threshold “bad” was based on the 90 percentile of the long-term data set and<br />
expert judgment.<br />
As apparent from Fig. 1. the lower quartile of the long-term data set for spring (A) is very close to<br />
the historical reference, which does not hold for summer (B).
A)<br />
B)<br />
Fig. 2.2.1: Cumulative distribution of spring and summer phytoplankton biomass [mg/m 3 ].<br />
125
Table 2.2.3: Inventory of chlorophyll a [mg/m3] data by sites.<br />
126<br />
Site<br />
period<br />
Winter Spring Summer Autumn Total<br />
No<br />
Samples<br />
period<br />
No<br />
Samples<br />
period<br />
No<br />
Samples<br />
period<br />
No<br />
Samples<br />
No<br />
Samples<br />
Kaliakra 1995-2005 9 1990-2006 22 1990-2006 28 1990-2006 23 82<br />
Varna Bay 1990-2005 39 1991-2005 101 1990-2006 93 1990-2006 88 321<br />
Galata 1990-2005 9 1990-2006 16 1990-2006 30 1990-2006 11 66<br />
Burgas Bay 1987-2005 32 1984-2006 51 1987-2006 53 1982-2006 46 182<br />
The chlorophyll a reference and threshold values were determined based on the 10 (or 25) percentile<br />
and the 90 percentile (bad) of the long-term data set – Fig.2., Table.3<br />
The proposed classification and QRs based on phytoplankton biomass and chlorophyll a to be<br />
applied for the Bulgarian Black Sea coastal waters is presented in Tab.4 and 5.<br />
Fig. 2.2.2: Cumulative distribution of long-term chlorophyll a data for winter and summer.
Table 2.2.4: Seasonal “high” values as inferred by the cumulative distribution.<br />
Site<br />
High – chl. a [mg/m 3 ]<br />
Winter Spring Summer Autumn<br />
10th % 25th % 10th % 25th % 10th % 25th % 10th % 25th %<br />
Kaliakra 0.77 2.30 0.79 0.97 0.65 1.12 1.32 1.82<br />
Galata<br />
V. Bay<br />
1.4 1.7 1.3 2.2 1.2 2.1 0.8 1.3<br />
Burgas Bay 1.05 1.7 1.4 2.1 0.8 1.2 0.7 1.2<br />
Table 2.2.5: Classification and EQR based on phytoplankton biomass [mg/m 3 ] by seasons.<br />
Type Winter<br />
Index High Good Moderate Poor Bad<br />
CW602330<br />
CW602310<br />
CW602210<br />
PhB [mg/m3] (1200) 2070 4150 7600 11600 >15000<br />
CW602220<br />
CW602230<br />
CW602321<br />
PhB [mg/m3] (1200)1700 3200 6000 9100 >12000<br />
EQR 0.85 0.7 0.45 0.16<br />
Type Spring<br />
Index High Good Moderate Poor Bad<br />
CW602330<br />
CW602310<br />
CW602210<br />
PhB [mg/m3] (2700) 3700 5200 9500 14500 >15000<br />
CW602220<br />
CW602230<br />
CW602321<br />
PhB [mg/m3] (2500)2900 4100 7400 11600 >15000<br />
EQR 0.85 0.7 0.45 0.16<br />
Type Summer<br />
Index High Good Moderate Poor Bad<br />
CW602330<br />
CW602310<br />
CW602210<br />
PhB [mg/m3] (600-900) 1160 2750 5500 7600 >10000<br />
CW602220<br />
CW602230<br />
CW602321<br />
PhB [mg/m3] (750) 1100 2150 4000 6100 >8000<br />
EQR 0.85 0.7 0.45 0.16<br />
Type Autumn<br />
Index High Good Moderate Poor Bad<br />
CW602330<br />
CW602310<br />
CW602210<br />
PhB [mg/m3] (1000) 1650 3300 6100 9200 >12000<br />
CW602220<br />
CW602230<br />
CW602321<br />
PhB [mg/m3] (1000) 1350 2700 4950 7500 >10000<br />
EQR 0.85 0.7 0.45 0.16<br />
127
Table 2.2.6: Classification and EQR based on chlorophyll a data [mg/m 3 ] by seasons.<br />
128
In addition based on the correlation chl. α/Secchi depth as inferred from the available data for the<br />
north-western Black sea the regression equation was used (Fig.3) to suggest classification thresholds<br />
for the Secchi depth presented on – Table 6.<br />
At this stage it is not possible to suggest classification based on phytoplankton blooms for the<br />
following reasons.<br />
The reference data (1954-1970) are seasonal, as well as the recent data which makes quantification<br />
and the application of the 6 years monthly frequency records as suggested by some expert groups<br />
(WFD ITR, 2007) impossible. The records for the species that were the most frequent drivers of<br />
ecosystem dysfunction (Prorocentrum minimum and the related hypoxia events in summer during<br />
the eutrophication period – Moncheva et al., 1995, 2001) are of little use due to the shifts in the<br />
phytoplankton taxonomic composition after 2000 (Moncheva et al, 2006) – Table 7.<br />
Figure 2.2.3: Correlation between chlorophyll a<br />
[mg/m3] and Secchi disk depth [m] – log scale<br />
(after V. Doncheva. 2007).<br />
Table. 2.2.7: Classification based on TRIX and Secchi depth.<br />
All types and seasons<br />
Index High Good Moderate Poor Bad<br />
TRIx 2-4.5 4.5-5.4 5.5-6.4 6.5-7.9 >8<br />
Secchi depth[m] >4.5 4.5-3.5 3.5-2.5 2.5-1.5
Table 2.2.8: Summary of phytoplankton blooms (Galata-Varna Bay).<br />
Descriptor Winter Winter<br />
1954-1970 1983-1998<br />
Bacillariophyceae Bacillariophyceae<br />
Skeletonema costatum Skeletonema costatum<br />
Most typical species Pseudonitzschia seriata Pseudonitzschia seriata<br />
Detonula confervaceae<br />
Dinophyceae<br />
Heterocapsa triquetra<br />
Prorocentrum minimum<br />
No species 3 13<br />
No blooms 6 31<br />
Max N [1x10 6 cells/l] 8.2 43.47<br />
Descriptor Spring Spring<br />
1954-1970 1983-1998<br />
Bacillariophyceae Bacillariophyceae<br />
Pseudonitzschia delicatissima Skeletonema costatum<br />
Most typical species Pseudinitzschia seriata P. delicatissima<br />
Dinophyceae Dinophyceae<br />
Prorocentrum minimum Heterocapsa triquetra<br />
Prorocentrum minimum<br />
No species 7 24<br />
No blooms 16 63<br />
Max N [1x10 6 cells/l] 13.5 220<br />
Descriptor Summer Summer<br />
1954-1970 1983-1998<br />
Bacillariophyceae Bacillariophyceae<br />
C.caspia Cerataulina pelagica<br />
Most typical species Pseudonitzschia delicatissima<br />
Nitzschia tenuirostris<br />
Pseudinitzschia seriata<br />
Rhizosolenia fragilissima<br />
Dinophyceae Dinophyceae<br />
Prorocentrum minimum Gymnodinium uberimum<br />
Prorocentrum minimum<br />
Alexandrium monilatum<br />
Lingulodinium polyedrum<br />
Haptophyceae<br />
Phaeocystis pouhettii<br />
No species 2 21<br />
No blooms 4 73<br />
Max N [1x10 6 cells/l] 2.1 481<br />
Descriptor Autumn Autumn<br />
1954-1970 1983-1998<br />
Bacillariophyceae<br />
Skeletonema costatum Skeletonema costatum<br />
Most typical species Detonula confervaceae Detonula confervaceae<br />
Leptocylindrus minimus Leptocylindrus minimus<br />
Dinophyceae Dinophyceae<br />
Prorocentrum minimum<br />
Alexandrium monilatum<br />
Lingulodinium polyedrum<br />
Oxyphisis oxytoxoides<br />
No species 2 15<br />
No blooms 2 33<br />
Max N [1x10 6 cells/l] 5.7 60.17<br />
130
. ROMANIA<br />
The site selected was Constanta/Mamaia Bay were the phytoplankton samples have been collected<br />
twice per week. The long-term data set is available for the period 1960-1970 and 1986-1997 for this<br />
site.<br />
Phytoplankton samples have been collected from the surface layer (enabling more then 500 ml of<br />
water per sample) and immediately treated with a formaldehyde solution of 4 % concentration,<br />
followed by further processing based on sedimentation method (Morozova-Vodyanitzkaya, 1954;<br />
Bodeanu, 1987-1988). The taxonomic determination and cells counting by species of respective<br />
samples has been carried out by means of plankton inverted microscopes, equipped with 40x<br />
magnification lens, in the case of small-sized cells (less then 15-20 µm) or with 16.3x / 20x<br />
magnification lens, in the case of larger-sized cells. Afterwards numerical densities (cell×l -1 ) and<br />
biomass (mg/m 3 ) were calculated for each specific component of each taxonomic group and for total<br />
phytoplankton.<br />
In order to identify the biological reference condition for the Romanian coastal waters the<br />
phytoplankton biomass (mg/m 3 ) has been selected. The identification of reference condition is based<br />
on historical data from pristine period of the Romanian Black Sea coast (1960-1970), from period<br />
of intensive eutrophication (’80 years).<br />
In order to identify the EQRs for the common body waters, we found the values estimated for the<br />
period 1960-1970 corresponding to high status and those from the period 1986-1997 to bad status.<br />
The limits between these classes, for good, moderate and poor have been decided based on expert<br />
judgment.<br />
Table 2.2.9: Summary of phytoplankton biomass (mg / m 3 ) by season.<br />
Winter Spring Summer Autumn Annual<br />
1960-1970<br />
Average 2692 2583 690 540 1627<br />
Max<br />
1986-1997<br />
5725 19165 1035 921 19165<br />
Average 1255 5064 10664 6603 6747<br />
Max 5465 34647 46809 61195 31195<br />
Table 2.2.10: Classification based on phytoplankton biomass (mg/m 3 ).<br />
High Good Moderate Poor Bad<br />
Winter<br />
2500 3600 5500 8000 > 10000<br />
EQR<br />
Spring<br />
3000 5700 9000 14000 > 15000<br />
EQR<br />
Summer<br />
1000 2500 6000 7500 > 12000<br />
EQR<br />
Autumn<br />
1500 3500 7200 9500 > 15000<br />
EQR<br />
131
2.2.3<br />
132<br />
Results of the harmonization – Boundary EQR values<br />
Table 2.2.11: Phytoplankton biomass.<br />
Ecological status High Good Moderate Poor Bad<br />
Winter<br />
Range < 2000 2000 - 3000 3001 - 5500 5501 - 12000 > 12000<br />
EQR<br />
Spring<br />
> 0.85 0.7 0.45 0.16 < 0.16<br />
Range < 3000 3000 - 5000 5001 - 9000 9001 - 20000 > 20000<br />
EQR<br />
Summer<br />
> 0.85 0.7 0.45 0.16 < 0.16<br />
Range < 1000 1000 - 2500 2501 - 5000 5001 - 10000 > 10000<br />
EQR<br />
Autumn<br />
> 0.85 0.7 0.45 0.16 < 0.16<br />
Range < 2000 2000 - 3500 3501 - 6500 6501 - 15000 > 15000<br />
EQR > 0.85 0.7 0.45 0.16 < 0.16<br />
It was agreed that the assessment system for phytoplankton have to be applied for surface layer<br />
samples, with a monthly frequency sampling, at least between May and September; the assessment<br />
should be made based on seasonal values and for annual assessment will be made using the “one<br />
out, all out” principle; harmonization of EQR values resulted with separation of the most northern<br />
water body of the common water body type in Bulgaria (CW602230) from the rest of the bodies at<br />
the same type, and eventually separation of a new type.<br />
The rest of the metrics have not been harmonized because Romanian part was not ready with their<br />
reference values and EQRs.<br />
2.2.4 Open issues and need for further work<br />
The future work plan will focus on preparation of assessment system for bloom concentrations,<br />
bloom species and chl α, according to the methods provide in the Black Sea Commission Manual.<br />
Other parameters will be considered at a later stage.<br />
2.3<br />
Mediterranean GIG<br />
2.3.1 Intercalibration approach<br />
Participation of countries in the Phytoplankton subgroup:<br />
Cyprus<br />
France<br />
Greece<br />
Italy<br />
Slovenia<br />
Spain (Valencia, Catalonia, Balearic Islands)<br />
+ Croatia (Accession Country)
Data availability<br />
The examination of the datasets provided by each MedGIG Member States highlighted a huge data<br />
heterogeneity, mainly due to different monitoring schemes. Table 1 summarized the main features<br />
of the datasets, highlighting the availability of key features (sites, parameters, vertical profile and<br />
amount of data) needed for the typological identification of water bodies.<br />
Data used are referred to Chl a concentrations measured in “coastal waters”, as defined in the<br />
<strong>Directive</strong>: “within the 1 nautical mile distance from the coastline”,<br />
A common decision is to recommend the use of nearshore data only (500-1500 m from the coast),<br />
(while for the IC all “coastal” data have been considered, as <strong>report</strong>ed above), when not differently<br />
advised by MS23 .<br />
Table 2.3.1: Data features for MED GIG MSs datasets.<br />
MS N° Sites N° Records Period Freq (d) Profile Temp Sal data<br />
France 8 1250 1997-2006 7 not available available<br />
Italy 11 2541 2001-2004 15 available available<br />
Slovenia 2 332 1997-2004 30 available available<br />
Cyprus 48 158 2005 60 not available not available<br />
Spain 117 1109 1991-2006 regional available available<br />
Croatia 19 1784 2000-2004 120 not available available<br />
Greece 5 1225 2000-2004 30 available available<br />
Typology<br />
Phytoplankton experts defined that the 4 Mediterranean Coastal IC types, (see Section 1 General<br />
Part), based primarily on the substratum composition and the depth profile, cannot be applied to<br />
the IC for the current BQE, within the Mediterranean basin: the classification criterion is based<br />
mainly on the morphological features of the bottom and therefore it is not so meaningful in a<br />
“phytoplankton perspective”.<br />
A new typology has been developed, mainly focused on hydrological parameters characterizing<br />
water bodies’ dynamics and circulation. The typological approach is based on the introduction of<br />
the static stability parameter (derived from temperature and salinity values in the water column):<br />
such a parameter, having a robust numerical basis, can describe the dynamic behaviour of a coastal<br />
system. The group agreed then to adopt surface density as a proxy indicator for static stability as<br />
both Temperature and Salinity are relevant in the dynamic behavior of a coastal marine system: both<br />
are involved in circulation and mixing dynamics and all information is then nested in the surface<br />
density parameter (Russo et al., 2006, submitted).<br />
On the basis of surface (density (σ t) values three major water types have been defined:<br />
Table 2.3.2: density thresholds defining new coastal water types.<br />
Type I Type II Type III<br />
σ t (density) (kg m -3 )
The same three water types are defined below as salinity classes, since for Spain (Catalonia)<br />
variability due to seasonal fluctuation is marginal: using relationships between density and salinity,<br />
Spain calculated the following table (at 18 °C)<br />
134<br />
Table 2.3.3: salinity thresholds defining new coastal water types.<br />
Type I Type II Type III<br />
Annual Mean Salinity (psu)
Table 2.3.4: Types occurrence per MSs in Coast MED GIG.<br />
Types description France Spain Italy Slovenia Croatia Greece Cyprus<br />
Type I<br />
Type II<br />
Type III<br />
Highly influenced by<br />
freshwater input<br />
A<br />
B<br />
W<br />
E<br />
Moderately influenced<br />
by freshwater input<br />
(continent influence)<br />
Influenced by Atlantic<br />
waters<br />
Continental coast , Not<br />
influenced by freshwater<br />
input<br />
Not influenced by<br />
freshwater input<br />
X X<br />
X X X X<br />
X<br />
X X X X<br />
X X<br />
Based on this new Typology and on the available data for the different types in the Member States,<br />
Intercalibration was performed as follows:<br />
for Type I France is not able at the moment to provide enough data to be compared with the Italian<br />
data; therefore no Intercalibration is performed for this typology at the present phase<br />
for Type II Spain had to make distinction within the same type (as specified below (3)). As this<br />
subdivision is not found in the other Mediterranean MS, IC performed on Type II does not include<br />
the Spanish Type II B (influenced by Atlantic waters)<br />
for Type III the distinction between Type III Western Mediterranean and Type III Eastern<br />
Mediterranean was already agreed for evident ecological differences within the 2 Mediterranean<br />
basins. Only Greece and Cyprus belong to the Eastern Mediterranean basin, therefore Type III E<br />
Intercalibration was performed only between these 2 countries<br />
2.3.2 National methods that were intercalibrated<br />
Since we did not elaborate a methodology based on a common data set, which would be then<br />
adopted at national level of each MS, we compared boundaries (Chl-a concentrations and EQRs)<br />
derived from national methods having different status at present (under development, finalized,<br />
officially accepted). Available methodologies descriptions are detailed or cited in the Annex 3.8:<br />
National methods included in the <strong>intercalibration</strong>.<br />
Only one parameter of the BQE phytoplankton was considered for this phase of the Intercalibration<br />
process: Chlorophyll a concentration as parameter/indicator for biomass.<br />
Common statistical analysis on Chl-a, nutrients and physico-chemical data, and some multivariate<br />
techniques have been performed in order to facilitate the reaching of a wide agreement for the<br />
<strong>intercalibration</strong> process. Since a methodology based on a common data set, which would be then<br />
adopted at national level of each MS, was not elaborated, different metrics of this parameter and<br />
different statistical approaches for setting the boundaries (derived from national methods, where<br />
defined) were analysed and compared. Boundaries are in terms of Chl-a concentrations and EQRs<br />
that have different status of implementation/finalization, at present in the Mediterranean Member<br />
State (see Table below). Different metrics of this parameter and different statistical approaches for<br />
setting the boundaries were compared.<br />
135
The finally agreed approach that has been followed for the <strong>intercalibration</strong>, is an the hybrid option, as<br />
described in the Intercalibration Guidance as follows:<br />
“Boundary values are first established with national classification assessment methods (as in Option<br />
3). The subsequent comparison of the boundary values could then be done with the help of a<br />
common metrics method (as in Option 2).”<br />
National methods adopted, mostly, three kinds of metrics: percentile90 th , annual geometric mean<br />
(geomean) and average. Depending on the MS the metrics were calculated using only surface data<br />
or water-column integrated data, covering different period (e.g. one year in case of geomean and 5<br />
to 6 years when using percentile 90 th . The metrics used by MSs are shown in the table below.<br />
Table 2.3.5: Metrics adopted by MSs.<br />
MS Percentile90 th Average (A-arithmetic,<br />
G-geometric)<br />
136<br />
Based on: Raw data (R)/<br />
Geomean (G)<br />
France X R<br />
Spain X A R<br />
Italy X G<br />
Slovenia G R<br />
Greece X A<br />
Cyprus X A<br />
2.3.3<br />
Reference conditions and class boundary setting<br />
For the 3 intercalibrated types every MS defined reference conditions, boundaries and EQRs<br />
applying their own methodologies. These methodologies are detailed or cited in the 2.3. 1.<br />
Reference conditions<br />
Reference conditions will be different according to different water types.<br />
Each MS proposed its own reference conditions based on their phytoplankton experts’ knowledge.<br />
All of them based their calculations of reference conditions by selecting High status stations from<br />
their monitoring programmes. For more details of the methods see Annex 3.8: National MSs <strong>report</strong>s<br />
on phytoplankton element.<br />
Type-specific reference conditions, as suggested by MSs, are listed in table 2.3.6, below.<br />
Table 2.3.6: Type-specific Reference conditions, expressed as surface Chl a concentration (μg /L)<br />
RC Type II-A Type III WM Type III EM Metric<br />
France
Setting of Boundaries<br />
In the following table the MSs boundaries, as chl a concentration, (μg /L), for each water type are<br />
listed:<br />
Table 2.3.7: Type-specific MSs boundaries.<br />
Reference H/G<br />
EQR<br />
H/G<br />
G/M<br />
EQR<br />
G/M<br />
Metric<br />
T1 France Percentile 90th TRUE VALUES<br />
Italy 1,8 2,4 0,75 3,5 0,51 Geometric mean<br />
T2 - A France
Type III<br />
Table 2.3.9: Harmonized boundaries for Type III.<br />
Type MS REFERENCE H/G EQR G/M EQR<br />
T3 – Western Med<br />
T3 – Eastern Med<br />
138<br />
France<br />
Spain<br />
Italy<br />
Cyprus<br />
Greece<br />
0.9 1.1 0.80 1.8 0.50<br />
0.08 0.1 0.80 0.40 0.20<br />
2.3.5 Open issues and need for further work<br />
A few suggestions have been pointed out by MS for an eventual further <strong>intercalibration</strong> activity:<br />
1. Include species composition analysis or blooms frequency analysis for a better<br />
understanding of the system’s behavior and efficiency/status Initially common indicator<br />
metrics will be considered (option 1 or 2), but it may be possible to move to option 3 when<br />
member states will have developed their full phytoplankton classification systems.<br />
2. Improve dose/response analysis correlating pressures (nutrients) with trophic conditions.<br />
2.4<br />
NE Atlantic GIG<br />
2.4.1 Intercalibration approach<br />
Option 2 has been used in the <strong>intercalibration</strong> process for phytoplankton. Three metrics have been<br />
selected: chlorophyll, Indicator Taxa (Frequency of Phaeocystis Cell counts) and Taxa Cell Counts<br />
(Frequency of phytoplankton taxa cells counts). Boundaries have been agreed for all countries for<br />
the measurement of chlorophyll a using a 90th percentile metric. Total cell counts and Phaeocystis<br />
metric are not relevant in all countries’ waters, but common thresholds have been agreed where<br />
applicable.<br />
Generic typologies for NEAGIG types<br />
In the NE Atlantic six basic <strong>intercalibration</strong> types have been agreed. These are shown in the Table 1.<br />
Types were distinguished by salinity, tidal range, depth, velocity, exposure, mixing and residence<br />
time.<br />
The above types occur in Member State’s waters as detailed in Table 2.
Table 2.4.1: Broad geographical types within the North East Atlantic GIG.<br />
New Type ID Name Salinity (PSU) Tidal range (m) Depth (m) Current<br />
velocity<br />
CW<br />
–NEA1/26<br />
a,b,c,d,e<br />
CW –<br />
NEA3/4<br />
Exposed or sheltered,<br />
euhaline, shallow<br />
Polyhaline, exposed or<br />
moderately exposed<br />
(Wadden Sea type)<br />
CW – NEA7 Deep, low current,<br />
sheltered<br />
CW – NEA8 Polyhaline, microtidal,<br />
sheltered, shallow<br />
(Skagerrak inner arc<br />
type)<br />
CW – NEA9 Fjord with a shallow<br />
sill at the mouth with<br />
a very deep maximum<br />
depth in the central<br />
basin with poor<br />
deepwater exchange.<br />
CW – NEA10 Polyhaline, microtidal<br />
exposed, deep<br />
(Skaggerak outer arc<br />
type)<br />
TW – NEA11<br />
(will be split<br />
into subtypes)<br />
Fully saline<br />
(> 30)<br />
Polyhaline (18<br />
- 30)<br />
Fully saline<br />
(> 30)<br />
Polyhaline (18<br />
- 30)<br />
Polyhaline (18<br />
- 30)<br />
Polyhaline (18<br />
- 30)<br />
Transitional waters Oligo-Euhaline<br />
(0 - 35)<br />
Mesotidal<br />
(1 - 5)<br />
Mesotidal<br />
(1 - 5)<br />
Mesotidal<br />
(1 - 5)<br />
Microtidal<br />
(< 1)<br />
Microtidal<br />
(< 1)<br />
Microtidal<br />
(< 1)<br />
Mesotidal<br />
(1 – 5 )<br />
Shallow<br />
(< 30)<br />
Shallow<br />
(< 30)<br />
Deep<br />
(> 30)<br />
Shallow<br />
(< 30)<br />
Deep<br />
(> 30)<br />
Deep<br />
(> 30)<br />
Shallow<br />
(< 30)<br />
Medium<br />
(1 - 3 knots)<br />
Medium<br />
(1 - 3 knots)<br />
low<br />
(< 1 knot)<br />
low<br />
(< 1 knot)<br />
low<br />
(< 1 knot)<br />
low<br />
(< 1 knot)<br />
Exposure Mixing Residence time<br />
Exposed or<br />
sheltered<br />
Exposed or<br />
moderately<br />
exposed<br />
Medium Sheltered or<br />
moderately<br />
Exposed<br />
Fully mixed Days<br />
Fully mixed Days<br />
Sheltered Fully mixed Days<br />
Sheltered Partially<br />
Stratified<br />
Sheltered Permanently<br />
Stratified<br />
Exposed Permanently<br />
Stratified<br />
Partially- or<br />
Permanently<br />
Stratified<br />
Days-Weeks<br />
Weeks<br />
Days<br />
Days-Weeks<br />
Table 2.4.2: The occurrence of the broad geographical types and sub-geographical types within each member state.<br />
NB. Type CW – NEA1/26 has been split down into 5 sub-types due to regional geographic differences within the North<br />
East Atlantic Geographic Intercalibration Group.<br />
Type BE DK FR DE IE NL NO PT ES SE UK<br />
CW - NEA1/26a X X X X X<br />
CW - NEA1/26b X X X X<br />
CW- NEA1/26c X X<br />
CW- NEA1/26d X<br />
CW- NEA1/26e X X<br />
CW – NEA3/4 x x<br />
CW – NEA7 x x<br />
CW – NEA8 x x X<br />
CW – NEA9 x x<br />
CW – NEA10 x x<br />
TW – NEA11 X X X X X X X X<br />
139
2.4.2<br />
140<br />
National methods that were intercalibrated<br />
For the phytoplankton element, three metrics were chosen:<br />
• Chlorophyll a<br />
• Elevated cell counts<br />
• Phaeocystis blooms<br />
National methods from each country have all used a variation of these metrics within their<br />
own assessment protocols. All countries have used chlorophyll-a as a primary assessment<br />
tool for phytoplankton, though typically chlorophyll is used within a suite of phytoplankton<br />
tools and calculated as an EQR. All MS have agreed to use chlorophyll-a as a metric within the<br />
<strong>intercalibration</strong> process. Elevated cell counts and Phaeocystis are not all used uniformly across<br />
member states in the national methods and as such, have not been adopted as an <strong>intercalibration</strong><br />
tool for all MS. Five countries are using the elevated count tool and four counties are using the<br />
Phaeocystis tool. National methods for each MS are listed below and further discussed in Table 3.<br />
UK<br />
Biomass - 90 th percentile of chlorophyll a data<br />
Blooms/Counts - Frequency (%) of blooms of any single phytoplankton taxa<br />
- Seasonal succession of functional groups<br />
SPAIN<br />
Biomass - 90 th percentile of chlorophyll a data<br />
Blooms/Counts - Frequency (%) of blooms of any single phytoplankton taxa.<br />
REPUBLIC OF IRELAND<br />
Biomass - 90 th percentile and median of chlorophyll-a data<br />
Blooms/Counts - Frequency (%) of blooms of any single phytoplankton taxa<br />
- Seasonal succession of functional groups (under development)<br />
NETHERLANDS<br />
Biomass - 90 th percentile of chlorophyll a data<br />
Blooms - Phaeocystis counts<br />
FRANCE<br />
Biomass - 90 th percentile of chlorophyll a data<br />
Blooms/Counts - Frequency (%) of blooms of any single phytoplankton taxa.<br />
Blooms of all species<br />
Composition - Blooms of harmful species<br />
PORTUGAL<br />
Biomass - 90 th percentile of chlorophyll a data<br />
Blooms/Counts - Frequency (%) of blooms of any single phytoplankton taxa.<br />
Blooms of all species<br />
SWEDEN<br />
Biomass - 90 th percentile and median of chlorophyll-a data, (original<br />
Swedish metric: mean of chlorophyll-a data)<br />
Blooms/Counts - Frequency (%) of phytoplankton, total cells of all taxa, divided<br />
into two size fractions, >20 µm and 2-20 µm (>20 µm includes common<br />
species, e.g. Skeletonema costatum and many Chaetoceros spp.)]
DENMARK<br />
Biomass - 90 th percentile of chlorophyll a data<br />
BELGIUM<br />
Biomass - 90 th percentile of chlorophyll a data<br />
Blooms/Counts - Phaeocystis counts<br />
Composition - Blooms of harmful species (under development, thus not intercalibrated yet)<br />
GERMANY<br />
Biomass - 90 th percentile of chlorophyll-a data<br />
Blooms/Counts - Phaeocystis counts<br />
NORWAY<br />
Biomass - 90 th percentile of chlorophyll-a data<br />
- 90 th percentile of biovolume/cellcarbon (under development)<br />
Blooms/Counts - Frequency (%) of blooms of any single phytoplankton taxa >5 µm<br />
(Need further development)<br />
- Seasonal succession of functional groups (under development)<br />
Table 2.4.3: Description of national methods using a chlorophyll a metric.<br />
Description of national method/<br />
assessment of phytoplankton biomass<br />
using the plant pigment chlorophyll<br />
UK Metric: 90 th percentile of the<br />
chlorophyll-a data set (µg L -1 ).<br />
• Sampling frequency: monthly (*)<br />
• Season: growth period, from March<br />
to October (*)<br />
• Period: 6-year (*)<br />
Spain Metric: 90 th percentile of the<br />
chlorophyll-a data set (µg L -1 ).<br />
• Sampling frequency: monthly (*)<br />
• Season: growth period, from February<br />
to October (*)<br />
• Period: 6-year (*)<br />
Boundary classes agreed for national<br />
assessment<br />
Atlantic Coast - Exposed West Coast<br />
of England & Northern Ireland<br />
(NEA 1/26a)<br />
High -90 th %
ROI Metric: 90 th percentile and median of the<br />
chlorophyll-a data set (µg L -1 ).<br />
• Sampling frequency: monthly (*)<br />
• Season: growth period, from March<br />
to October (*)<br />
• Period: 5-year (*)<br />
France Metric: 90 th percentile of the<br />
chlorophyll-a data set (µg L -1 ).<br />
• Sampling period: March to October.<br />
• Sampling frequency: once a fortnight<br />
or once a month.<br />
• Period: 6-year<br />
• Concern coastal waterbodies<br />
Netherlands<br />
142<br />
Metric: mean summer (March –<br />
September) chlorophyll-a concentration<br />
(µg/l) and on the maximum abundance<br />
of Phaeocystis (10 6 cells/l).<br />
The class boundaries for the 90 %ile<br />
summer chlorophyll-a concentrations are<br />
water-type specific.<br />
For Phaeocystis the boundaries high/<br />
good and good/moderate are set to<br />
10 6 cells/l and 10 7 cells/l, respectively.<br />
These boundaries are identical for all<br />
waterbodies.<br />
High<br />
Median and 90 th below H/G boundary<br />
Good<br />
Median and 90 th below G/M boundary<br />
Moderate<br />
Median and/or 90 th above G/M<br />
boundary<br />
H/G boundary = 5 (µg L -1 ) a<br />
G/M boundary = 10 (µg L -1 ) a<br />
For the Channel and Atlantic coast<br />
except North of France<br />
(type NEA 1/26a)<br />
High 90 th % 5 and 10 and 20 and 40<br />
For the French Northern coast<br />
(type NEA 1/26b)<br />
High 90 th % 10 and 15 and 20 and 40<br />
NEA 1/26b)<br />
High 90 th %
Norway<br />
Denmark<br />
Sweden<br />
Portugal<br />
Metric: 90 th percentile of the<br />
chlorophyll-a data set (µg L -1 ).<br />
• Sampling frequency: once a fortnight<br />
or once a month.<br />
• Season: growth period, from February<br />
to October<br />
• Period: 6-year<br />
Metric: 90 th percentile of the<br />
chlorophyll-a data set (µg L -1 ).<br />
Metric: 90 th percentile of the<br />
chlorophyll-a data set (µg L -1 ).<br />
• Sampling frequency: monthly<br />
• Season: growth period, March -<br />
September<br />
• Period: 6-year<br />
Metric: 90 th percentile of the<br />
chlorophyll-a data set (µg L -1 ).<br />
• Sampling frequency: all available data<br />
• Season: all available data<br />
• Period: all available data Sa<br />
For the North Sea and Norwegian<br />
Sea (NEA 1/26a) and Skagerrak<br />
(NEA 9)<br />
High 90 th % 2.5-5.0<br />
Mod. 90 th % > 5.0<br />
For Skagerrak (NEA 8)<br />
High 90 th % 1.5-3.0<br />
Mod. 90 th % > 3.0<br />
For Skagerrak (NEA 10)<br />
High 90 th % 3.0-6.0<br />
Mod. 90 th % > 6.0<br />
NEA 1/26c – North Sea – German<br />
Bight & Jutland<br />
High/Good: 5 µg/L<br />
Good/Moderate: 7.5 µg/L<br />
NEA 1/26d – Denmark Skagerrak<br />
High/Good: 3 µg/L<br />
Good/Moderate: 4 µg/L<br />
NEA 8 – (Kattegat + small area of<br />
Skagerrak)<br />
High/Good: 1.5 µg/L<br />
Good/Moderate: 3 µg/L<br />
High<br />
Median and 90 th below H/G boundary<br />
Good<br />
Median and 90 th below G/M boundary<br />
Moderate<br />
Median and/or 90 th above G/M<br />
boundary<br />
H/G boundary<br />
NEA8 (Kattegat + small area of<br />
Skagerrak): 1.5 µg/L<br />
NEA9 (Skagerrak): 2.5 µg/L<br />
NEA10 (Skagerrak): 3 µg/L<br />
G/M boundary<br />
NEA8 (Kattegat + small area of<br />
Skagerrak): 3 µg/L<br />
NEA9 (Skagerrak): 5 µg/L<br />
NEA10 (Skagerrak): 6 µg/L<br />
Type NEA 1/26e<br />
High<br />
90 th percentile
Belgium<br />
Germany<br />
144<br />
Metric: 90 th percentile of the chlorophyll<br />
“a” data set (µg L -1 ).<br />
• Sampling frequency: monthly or once<br />
a fortnight from 2008 onwards<br />
• Season: growth period, from March<br />
to October<br />
• Period: 5-year, in 2007 with lower<br />
frequency<br />
Metric: 90 th percentile of the chlorophyll<br />
“a” data set (µg L -1 ).<br />
NEA 1/26b<br />
High 90 th % 10 and 15 and 30 and 45<br />
NEA GIG Type 1/26c – North Sea -<br />
German Bight & Jutland –<br />
High/Good: 5 µg L -1<br />
Good/Moderate:7.5 µg L -1<br />
Chlorophyll is measured<br />
with the same frequency<br />
as the Phaeocystis counts<br />
measurements (once a month<br />
or once a fortnight, from 2008<br />
onwards).
Table 2.4.4: Description of national methods using phytoplankton counts and/or composition.<br />
Description of national method<br />
1 Frequency ( %) of blooms of any<br />
single phytoplankton taxa.<br />
2 Frequency ( %) Phaeocystis above<br />
10 6 Cells/l)<br />
UK Elevated counts of phytoplankton<br />
groups are recorded and compared<br />
against thresholds, and calculated as<br />
a percentage of the total number of<br />
sampling occasions.<br />
There are 4 sub--metrics of<br />
phytoplankton, including<br />
• Total cell count,<br />
• individual species count,<br />
• Phaeocystis count and<br />
• Chlorophyll concentrations.<br />
Final assessment is on the mean of the<br />
four phytoplankton metrics<br />
Spain The phytoplankton taxa included in<br />
the analysis are the species routinely<br />
monitored in coastal waters.<br />
• Three different approaches are<br />
followed depending on the degree<br />
of expertise in the identification and<br />
counting step<br />
� Only diatoms, dinoflagellates and<br />
euglenophyceans are considered.<br />
Small flagellates and coccoids are not<br />
included.<br />
� Small flagellates and coccoids are<br />
included and the phytoplankton is<br />
classified by two size categories:<br />
small (< 20 µm) and large<br />
phytoplankton (> 20 µm).<br />
� Small flagellates and coccoids are<br />
included, but size categories are not<br />
established.<br />
• Sampling frequency: monthly (*)<br />
• Season: whole year, from January to<br />
December (*)<br />
• Period: 6-year (*)<br />
ROI Percentage of samples where counts of<br />
individual phytoplankton taxa (> 20 µm)<br />
are above a threshold of 250,000 cells/l.<br />
Sampling frequency: monthly between<br />
January and December.<br />
Assessment period: 5-6 years<br />
Boundary classes agreed for<br />
national assessment<br />
Single (individual) taxa cell<br />
counts:<br />
Threshold: 250,000 cells per liter<br />
(large phytoplankton)<br />
Percentage exceeding threshold:<br />
High – Count ( %) < 20 %<br />
Good – Count ( %) < 20 %-39 %<br />
Mod – Count ( %) < 40 %-69 %<br />
Poor – Count ( %) < 70 %-90 %<br />
Bad – Count ( %) > 90 %<br />
Phaeocystis cell count metric:<br />
Threshold: 1,000,000 cells per liter<br />
Percentage exceeding threshold:<br />
High – Count ( %) < 10 %<br />
Good – Count ( %) 10 %-17 %<br />
Mod – Count ( %) > 17 %<br />
Poor – Count ( %) > 35 %<br />
Bad – Count ( %) > 80 %<br />
All geographical areas except<br />
Iberian upwelling coast and<br />
Western Cantabrian coast<br />
NEA 1/26a<br />
High -Frequency of samples<br />
exceeding the threshold < 20 %<br />
Good-Frequency of samples<br />
exceeding the threshold ≥ 20 % and<br />
< 40 %<br />
Moderate-Frequency of samples<br />
exceeding the threshold ≥ 40 %.<br />
Iberian Coast and Western<br />
Cantabrian Coast NEA 1/26e<br />
High -Frequency of samples<br />
exceeding the threshold < 30 %<br />
Good-Frequency of samples<br />
exceeding the threshold ≥ 30 % and<br />
< 50 %<br />
Moderate-Frequency of samples<br />
exceeding the threshold ≥ 50 %.<br />
NEA Type 1/26a<br />
High -Frequency of samples<br />
exceeding the threshold < 20 %<br />
Good -Frequency of samples<br />
exceeding the threshold ≥ 20 % and<br />
< 40 %<br />
Moderate -Frequency of samples<br />
exceeding the threshold ≥ 40 %.<br />
Variation in methods/<br />
Comments on tools<br />
Elevated counts of single<br />
species are taken as a submetric<br />
within a tool, and final<br />
assessment is calculated as<br />
a combination of the 4 submetrics<br />
Other tools are used in the<br />
national assessment including<br />
• Seasonal succession of<br />
functional groups<br />
• Community indicator species<br />
(under development)<br />
Boundaries apply to UK NEA<br />
Type 1/26a & NEA Type 1/26b<br />
The use of two thresholds<br />
(large and small phytoplankton)<br />
is not convenient for the<br />
national methodology. But, for<br />
<strong>intercalibration</strong> purposes in the<br />
coast of the País Vasco (Eastern<br />
Cantabrian coast) thresholds<br />
have been calculated for<br />
• large (75,000 cells/L) and<br />
• Small phytoplankton<br />
(750,000 cells/L).<br />
Note: some difference in<br />
sampling strategy may occur<br />
along the NEA Spanish Coast<br />
NB: Cells/litre thresholds<br />
for the other Spanish regions<br />
and types are documented, in<br />
the reference conditions and<br />
‘Results of Harmonisation’<br />
sections of this chapter.<br />
For Irish coastal waters it will<br />
be necessary to distinguish<br />
between phytoplankton<br />
populations that are known to<br />
originate offshore and show<br />
no response to local nutrient<br />
conditions and those resident<br />
populations that do. Blooms<br />
that are considered to have<br />
originated offshore (based<br />
on existing knowledge of<br />
the region’s oceanography)<br />
rather than in response to in<br />
situ growth conditions will be<br />
omitted from the analysis.<br />
145
France Metric: percentage of samples where a<br />
single taxa count is above the exceeding<br />
threshold.<br />
146<br />
• Definition of the exceeding threshold:<br />
100 000 cells per liter for large cells,<br />
and 250 000 cells per liter for small<br />
cells.<br />
• Sampling period : all the year<br />
• Sampling frequency: once a fortnight<br />
or once a month.<br />
• Concern coastal waterbodies<br />
• Period: 6-year<br />
Portugal Phytoplankton counts are carried<br />
out. When elevated chlorophyll<br />
concentrations are detected (>12µg L-1 G/M threshold).<br />
Elevated counts of phytoplankton<br />
single taxon groups are recorded<br />
and compared against the cell count<br />
threshold, (microphytoplankton 100,000<br />
cells /L, micro+nanophytoplankton<br />
1,000,000 cells /ml). The occurrences<br />
of single taxon blooms are calculated<br />
as a percentage of the total number of<br />
sampling occasions.<br />
The metrics are<br />
• total cell count,<br />
• single taxon counts<br />
Blooms of all species<br />
Types NEA 1/26a & 1/26b<br />
High - Count ( %) < 20<br />
Good - Count ( %) >= 20 and < 40<br />
Mod – Count( %) >= 40 and < 70<br />
Poor – Count( %) >= 70 and < 90<br />
Bad – Count ( %) >= 90<br />
Iberian Upwelling Coast<br />
NEA 1/26e<br />
High -Frequency of samples<br />
exceeding the threshold < 30 %<br />
Good-Frequency of samples<br />
exceeding the threshold ≥ 30 % and<br />
< 50 %<br />
Moderate-Frequency of samples<br />
exceeding the threshold ≥ 50 %.<br />
Denmark N/A N/A N/A<br />
Norway Percentage of samples where a single<br />
taxa count is above the exceeding<br />
threshold.<br />
• Definition of the exceeding threshold:<br />
500 000 cells per liter.<br />
• Sampling period : all the year<br />
• Sampling frequency: once a fortnight<br />
or once a month.<br />
• Period: 6-year<br />
Sweden Percentage of samples with Total cells of<br />
phytoplankton above a set threshold.<br />
Microplankton (>20 µm):<br />
Tentative – no threshold (cells/L) at<br />
present<br />
Nanoplankton (2-20 µm):<br />
Tentative – no threshold (cells/L) at<br />
present<br />
• Sampling frequency: monthly<br />
• Season: growth period,<br />
March - September<br />
• Period: 6-year<br />
Blooms of all species, frequency of<br />
samples – TBC<br />
High - Count ( %) < 20<br />
Good - Count ( %) >= 20 and < 40<br />
Mod. – Count( %) >= 40 and < 70<br />
Poor – Count( %) >= 70 and < 90<br />
Bad – Count ( %) >= 90<br />
Total cell counts, frequency of<br />
samples - TBC<br />
High – < 20 %<br />
Good – 20 % - 39 %<br />
Moderate – 40 % - 69 %<br />
Poor – 70 % - 90 %<br />
Bad – > 90 %<br />
The Phaeocystis metric is<br />
not applicable for the Iberian<br />
Upwelling Coast<br />
The metric need further<br />
development because among<br />
other factors the cell size is not<br />
taken into consideration.<br />
Postponed to phase II<br />
<strong>intercalibration</strong>.<br />
This metric is not fully<br />
developed and evaluated for<br />
the Swedish NEA GIG 8, 9, 10,<br />
but needs further work, if to be<br />
used at all.<br />
In Sweden phytoplankton<br />
biovolume mean values during<br />
June-August have been used,<br />
resulting in different reference<br />
values and borders between the<br />
classes.<br />
Postponed to phase II<br />
<strong>intercalibration</strong>.
Belgium Metric Phaeocystis counts<br />
• Sampling frequency: monthly or once<br />
a fortnight from 2008 onwards<br />
• Period: 5-year<br />
• Cell Threshold: 1,000,000 Cells/l<br />
Netherlands<br />
Metric Phaeocystis counts<br />
• Sampling frequency: monthly during<br />
growing season (March-Sept (incl.))<br />
• Period: 6-year<br />
• Cell Threshold: 1,000,000 Cells/l<br />
Germany Metric Phaeocystis counts<br />
• Cell Threshold: 1,000,000 Cells/l<br />
% Phaeocystis samples exceeding<br />
threshold (NEA Type 1/26b)<br />
HIGH - 17 %<br />
POOR- >35 %<br />
BAD- >80 %<br />
% Phaeocystis samples exceeding<br />
threshold (NEA Type 1/26b)<br />
HIGH - 17 %<br />
POOR- >35 %<br />
BAD- >80 %<br />
NEA GIG Type 1/26c – North Sea<br />
- German Bight & Jutland & NEA<br />
Type 3/4 – North Se - Ems, Weser,<br />
Elb Coast<br />
HIGH - 17 %<br />
POOR- >35 %<br />
BAD- >80 %<br />
A metric evaluating<br />
elevated counts of harmful<br />
phytoplankton taxa is under<br />
development.<br />
Sampling takes place in the<br />
growing season only. The<br />
frequency is calculated under<br />
the assumption that there are no<br />
Phaeocystis blooms outside the<br />
growing season.<br />
2.4.3 Reference conditions and class boundary setting<br />
Initially reference conditions for the phytoplankton quality element were put forward by each MS,<br />
using established background criteria from unimpacted sites (assumed to be in reference condition),<br />
modelling and regression from impacted site data, marine conventions, scientific literature and<br />
through expert agreement in the GIG. The diversity of measures required for setting reference<br />
conditions reflects the extremely diverse and localised ecohydrodynamics of the NEA GIG causing<br />
gross and subtle modification to phytoplankton responses to nutrients and climate.<br />
The following outlines the reference setting protocols established by each Member state, and the<br />
reference thresholds that were derived for each of the different types.<br />
United Kingdom (NEA GIG TYPE 1/26A and 1/26B)<br />
• Atlantic Coast – Exposed West Coast of England and Northern Ireland (NEA 1/26a)<br />
• North Sea, Eastern Irish Sea and Channel (NEA 1/26B)<br />
Chlorophyll-a metric<br />
An appropriate standard for assessing chlorophyll a concentration can be derived from the<br />
background nutrient concentrations by making some reasonable assumptions about nutrient<br />
conversion to plant biomass. From practical experience the UK has adopted 10 µg L-1 chlorophyll<br />
a as a guide for assessment in North Sea, Channel and Eastern Irish Sea <strong>Water</strong>s. It is therefore<br />
proposed that for UK Type 1/26b offshore waters that 10 µg L-1 chlorophyll a is adopted as the 50<br />
% elevated value (implying a background value of 6.7 µg L-1 and a reasonable C : Chl factor of<br />
0.012). For further information on conversion of C : Chl see Malcolm et al (2002).<br />
For Atlantic Coastal <strong>Water</strong>s which include the Exposed West Coast of England and Northern Ireland,<br />
the UK has adopted 5 µg L -1 chlorophyll a as a guide for assessment. It is therefore proposed that<br />
for Atlantic Coast offshore waters 5 µg L -1 chlorophyll a is adopted as the 50 % elevated value<br />
(implying a background value of 3.33 µg L -1 ).<br />
147
Proposed Chl-a reference values for UK waters<br />
• NEA GIG Type 1/26A – Atlantic Coast – 3.33 µg L-1 • NEA GIG Type 1/26B – North Sea, Channel, Eastern Irish Sea – 6.7 µg L-1 Taxa count metric<br />
Proposed reference values for the taxa count metric – UK<br />
• NEA GIG Type 1/26a – Atlantic Coast & NEA 1/26b – North Sea, Channel, Eastern Irish Sea<br />
Cell Threshold: 250,000 cells/L (large phytoplankton)<br />
• Reference Percentage exceedent threshold: 16.7 % (2 samples, associated with natural spring<br />
and autum blooms. Assumes monthly sampling)<br />
• Percentage exceedent thresholds: H/G 20 %, G/M 40 %<br />
Phaeocystis metric<br />
Proposed reference values for the Phaeocystis metric – UK<br />
• NEA GIG Type 1/26a – Atlantic Coast & NEA 1/26b – North Sea, Channel, Eastern Irish Sea<br />
Cell Threshold: 1,000,000 cells/L.<br />
• Reference percentage exceedent threshold: 8.30 % (1 sample in 12 months as part of natural<br />
spring bloom. Assumes monthly sampling)<br />
• Percentage exceedent thresholds: H/G 10 %, G/M 17 %<br />
Spain (NEA GIG 1/26a and 1/26e)<br />
The NEA coast of Spain has been divided into five different sub-areas that reflect the natural<br />
variation in abiotic factors driving the phytoplankton communities: Eastern Cantabrian Coast,<br />
Western Cantabrian Coast, Western Iberian Coast (upwelling), Canary Islands and Atlantic Coast<br />
(Southern Spain). A summary of the boundary setting protocol in each of these areas is provided<br />
below.<br />
Eastern Cantabrian Coast (NEA 1/26a)<br />
At the North of Spain, it extends between the border with France in País Vasco (43º 22´ N, 1º 46´<br />
W) and Cape Peñas in Asturias (43º 39´ N, 5º 50´ W).<br />
Chlorophyll-a metric<br />
The 90 th percentile of the chlorophyll-a in reference stations ranged between 0.8 µg L -1 (País<br />
Vasco) and 2.8 µg L -1 (Asturias). If these values are compared to those observed in other Atlantic<br />
coastal waters (e. g. France, Portugal) the phytoplankton biomass in the Eastern Cantabrian coast is<br />
considerably lower. However the specific hydrographical conditions of the Eastern Cantabrian coast<br />
in relation to other Atlantic areas can explain the differences in chlorophyll “a” concentration. The<br />
Cantabrian shelf is narrower compared to the French shelf. Also, nutrient fluxes to the Cantabrian<br />
shelf are distributed among several small rivers along the coast and no large plumes are formed<br />
(Diez et al. 2000). The intensity of the Iberian upwelling system decreases eastward along the<br />
Cantabrian shelf and it only slightly affects the Eastern Cantabrian Coast (Valencia et al. 2004;<br />
Mason et al. 2005; Lavin et al. 2006).<br />
148
Taxa count metric<br />
Phytoplankton counts were conducted since 2002 in the coastal waters of País Vasco. The<br />
anthropogenic eutrophication impact in the studied stations is considered negligible due to the<br />
strong hydrodynamic forces that act on this coast and, therefore, the phytoplankton is assumed to<br />
be in High or Good status. Low chlorophyll concentrations (see above) support this assumption.<br />
<strong>Water</strong> samples were collected at surface every 6 months. Sampling seasons corresponded to spring<br />
(May) and summer (August). Standard methods were used for field and laboratory: Van-Dorn<br />
bottle sampling, inverted microscopy and Uthermöhl. Based on the work of Borja et al. (2004), a<br />
bloom frequency of 20 % was considered the boundary between High and Good status and 40 %<br />
the boundary between Good and Moderate status. In order to calculate the abundance threshold that<br />
defines a bloom, three different approaches were followed:<br />
1.<br />
2.<br />
3.<br />
Only diatoms, dinoflagellates and euglenophyceans were included in the data analysis. Small<br />
flagellates and coccoids were not included. By this method, 500,000 cells L-1 was the most<br />
suitable threshold to define a bloom.<br />
Small flagellates and coccoids were included in the data analysis and the phytoplankton<br />
community was split into two size categories: small (< 20 µm) and large phytoplankton (><br />
20 µm). By using a criteria based on the Equivalent Spherical Diameter (ESD), 102 taxa<br />
were classify as large phytoplankton and 126 taxa as small phytoplankton. The thresholds<br />
that best fitted with this method were: 75,000 cells L-1 for large phytoplankton and<br />
750,000 cells L-1 for small phytoplankton.<br />
Small flagellates and coccoids were included in the data analysis, but size categories were<br />
not established. The resulting threshold to be applied to any single phytoplankton taxa<br />
(regardless of its cellular size) was 750,000 cells L-1 .<br />
The most accurate method was based on the use of two different thresholds, for large and small<br />
phytoplankton respectively (approach 2). However, the size-fractionation method was very timeconsuming<br />
as it required obtaining and processing the information of the ESD for the phytoplankton<br />
taxa. Therefore, it was found not suitable as a routine phytoplankton monitoring method. Other<br />
alternative methods were based on the use of a single threshold (approach 1 and 3) and the results<br />
obtained by them in the Basque coast (País Vasco) were acceptable and very similar. At present, in<br />
the Eastern Cantabrian Coast the approach 3 and the 750,000 cells L -1 threshold have been chosen<br />
because the monitoring programs provide accurate counts of the small phytoplankton forms.<br />
However, it is important to note that the abundance threshold to define a phytoplankton bloom<br />
depends on the methodology used (the counting expertise and the type of data analysis employed).<br />
This is evidenced by the different thresholds obtained with similar samples when using the<br />
approach 1 (only some taxonomic groups), the approach 2 (size-fractionation) or the approach 3 (all<br />
phytoplankton taxa).<br />
Western Cantrabrian Coast (NEA 1/26e)<br />
At the North of Spain, it extends between Cape Peñas in Asturias (43º 39’ N, 5º 50’ W) and Cape<br />
Estaca de Bares in Galicia (43º 47´ N, 7º 41´ W).<br />
Chlorophyll -a metric<br />
The chlorophyll “a” data were obtained in the coast of Asturias (43º 36´ N, 6º 08´ W). The 90 th<br />
percentile value in the reference station was 2.2 µg L -1 . In addition to the time series of field data<br />
from Asturias, the influence and regional variation of the upwelling process over the Western<br />
Cantabrian coast needs to be taken into consideration to establish sensible limits for the whole<br />
region. The review of published data by Bode et al. (1996) showed geographic differences in the<br />
upwelling regime, so that the mean chlorophyll “a” concentration increases westward along the<br />
149
N-NW Spanish coast in most oceanographic stages. These geographic differences are lower during<br />
unproductive phases (summer stratification and winter) and the highest during the upwelling<br />
stage, when the mean integrated chlorophyll “a” concentration increases twofold from the Western<br />
Cantabrian Coast to the Western Iberian Coast (Southern Galicia). In turn, this geographic gradient<br />
in the mean chlorophyll “a” concentration should reflect on a gradient for the limits of the 90 th<br />
percentile chlorophyll “a” along the N-NW coast of the Iberian Peninsula.<br />
Taxa count metric<br />
By expert judgement, in accordance with the westward gradient of increasing upwelling influence<br />
along the N-NW Spanish coast, 750,000 cells L -1 is proposed as the most suitable threshold for<br />
defining a phytoplankton bloom in the Western Cantabrian Coast and, similarly to the Iberian<br />
upwelling coast (see below), 30 % and 50 % as the boundaries between classes (High/Good, Good/<br />
Moderate). As with phytoplankton biomass, it is important to stress that the current paucity of data<br />
available for <strong>intercalibration</strong>, together with the high spatial and temporal variability associated to<br />
the wind-driven upwelling processes, may require a thorough revision of the proposed thresholds,<br />
once suitable databases become available.<br />
Western Iberian Coast (upwelling) (NEA 1/26e)<br />
The Iberian upwelling coast in Spain extends along the coast of Galicia, from the Cape Estaca de<br />
Bares (43º 47’ N, 7º 41’ W) to the border with Portugal.<br />
Hydrographic changes associated with upwelling and their influence on nutrient regimes and<br />
phytoplankton cycles in the Galician coast are well-documented. Many studies have focused on the<br />
hydrographical and biological features of the Iberian upwelling system with particular emphasis<br />
on the enhancement of biological productivity (Fraga 1976; 1981; Álvarez-Salgado et al. 1996;<br />
Moncoiffé et al. 2000; Cermeño et al 2006). The Galician coast is also characterised by the presence<br />
of wide coastal embayments or rías. These are deep estuaries (ca. 40 m depth near the mouth),<br />
whose intense exchange of water, and hence materials, with the ocean leads to their consideration as<br />
coastal intrusions of the shelf. The fertilizing process in the rías leads to higher primary production<br />
rates than in other estuarine or coastal systems (Boynton et al. 1982). For example in the Ría de<br />
Vigo mean annual primary production rates are about 800 mg C m-2 d-1 (Prego 1994) and the<br />
maximum values from spring to autumn range between 700 and 1800 mg C m-2 d-1 (Vives and<br />
Fraga 1961, in Nogueira et al. 1997). In terms of biomass and primary production there are not<br />
significant differences between the upwelling season and the spring bloom. Although seasonally<br />
variable in frequency and intensity, the upwelling is an episodic process driven by the wind. The<br />
close relationship between wind regime, nutrient inputs and chlorophyll concentration has been<br />
<strong>report</strong>ed in several papers (Moncoiffé et al. 2000, Cermeño et al. 2006). This close relationship with<br />
the wind regime reflects on a high frequency of phytoplankton blooms and very high short-scale<br />
variability in sea surface chlorophyll “a” concentration.<br />
Chlorophyll-a metric<br />
The data were obtained at the Ría de A Coruña (43° 21.8’ N, 8° 22.2’ W) and in the middle zone<br />
of the Ría de Vigo (42º 14.5’ N, 8º 45.8’ W). The calculated values of the 90 th percentile were 4.73<br />
µg L -1 at the A Coruña station (monthly sampled, from 1992 to 2006) and 10.55 µg L -1 at the Vigo<br />
station (two samples per week, from 1987 to 1996). A previous analysis by the INTECMAR Centre<br />
in Galicia (Phytoplankton tools for NEA type 1 Galician waters), calculated the 90 th percentile from<br />
37 stations distributed in the southern part of the Spanish upwelling coast (between the border with<br />
Portugal and Cape Finisterre) and 13 stations in the northern part (between Cape Finisterre and<br />
Cape Estaca de Bares). All the stations were weekly sampled from 1992 to 2004 and the values<br />
obtained for the 90 th percentile were 4 and 5 µg L -1 in the southern and northern part of the Spanish<br />
upwelling coast, respectively.<br />
150
Taxa count metric<br />
Phytoplankton cell counts in the Ría de A Coruña (43° 21.8’ N, 8° 22.2’ W) were carried out from<br />
1992 to 1998. Samples were collected monthly, preserved with Lugol’s solution and counted under<br />
an inverted microscope following the technique described by Uthermöl (1958). The Ría de A<br />
Coruña can be considered a bay with important oceanic influence, whose status is considered High<br />
or Good. According to the data from the Ría de A Coruña, a value of 10 6 cells L -1 is proposed as the<br />
threshold for a phytoplankton bloom. This coincides with the value proposed by the INTECMAR<br />
Centre (Phytoplankton tools for NEA type 1 Galician waters) after a study of data from 40 stations<br />
weekly sampled along the Galician coast from 1999 to 2004. According to the data analysis and the<br />
knowledge of the high variability in sea surface phytoplankton in the area (see above), the High/<br />
Good and Good/Moderate boundaries are set at 30 % and 50 % bloom frequencies, respectively.<br />
Canary Islands (NEA 1/26a)<br />
Chlorophyll-a metric<br />
The Canary Islands (~28° N) are located in a transition zone between the oligotrophic waters of the<br />
open ocean and the NW Africa upwelling system (Barton et al. 1998). Although there is a slight<br />
increasing gradient in chlorophyll-a towards the Eastern islands, the mean values are low during<br />
most of the year all around the Archipelago and maxima are typically < 1 µg L -1 (Aristegui 1990).<br />
Taxa count metric<br />
Taking into account the oligotrophic character of the Canary Islands in comparison to other Spanish<br />
NEA coastal waters, 500,000 cells L -1 is proposed as the threshold for defining a phytoplankton<br />
bloom and 20 % and 40 % as the boundaries between classes (High/Good, Good/Moderate) in this<br />
coastal area.<br />
Atlantic Coast (NEA 1/26a)<br />
The Atlantic coast in the South of Spain extends from the mouth of the Guadiana River at the<br />
Portuguese border to the mouth of the Guadalmesí River at the Straight of Gibraltar. This coastline<br />
belong to the area of the Gulf of Cadiz in Andalucía and it can be distinguished from the coastline<br />
open to the ocean (from Cape San Vicente to the North of Spain) as it represents an area of transition<br />
between the Mediterranean Sea and the Atlantic Ocean (OSPAR 2000).<br />
Chlorophyll-a metric<br />
The Atlantic coast in the South of Spain presents a large continental platform and it receives the<br />
runoff from two important rivers (Guadalquivir and Guadiana Rivers).<br />
In addition, some upwelling influence has been described in the Gulf of Cadiz (Garcia et al.<br />
2002). Also, the continuity with the Portuguese coast, westward of the Guadiana mouth, must be<br />
considered and the thresholds for phytoplankton biomass should not differ importantly between<br />
them. Extensive data series for chlorophyll in reference monitoring stations are not available.<br />
Therefore, on the basis of expert judgment, the thresholds proposed for the 90 th percentile of<br />
chlorophyll “a” in the Atlantic coast (S Spain) are 5 µg L -1 (between high and good status) and 10<br />
µg L -1 (between good and moderated status). Nevertheless, in the future, chlorophyll data that are<br />
being acquired now could lead to consider a new definition of these thresholds for the Atlantic coast<br />
in the South of Spain.<br />
Taxa count metric<br />
For the determination of the cell abundance that indicates a bloom event in the Gulf of Cadiz, data<br />
series corresponding to 6-year periods have been studied. The minimum sampling frequency was<br />
monthly and, in some cases, weekly or fortnightly. Small phytoplankton forms (mainly flagellates)<br />
151
were not recorded. Different abundance values to define a phytoplankton bloom were studied both,<br />
in reference stations and, in other areas considered with a slightly higher level of eutrophication.<br />
Attending to the results, the threshold of 500,000 cells L -1 was set to define a bloom event, with<br />
20 % and 40 % as the boundaries between classes (High/Good, Good/Moderate).<br />
Proposed reference values for the chlorophyll “a” (90 th percentile) metric – Spain<br />
• Eastern Cantabrian Coast (NEA Type 1/26a) 1 - 3 µg L -1<br />
• Western Cantabrian Coast (NEA Type 1/26e) 2 – 5 µg L -1<br />
• Western Iberian Coast upwelling (NEA Type 1/26e) 4 -11 µg L -1<br />
• Canary Islands (NEA Type 1/26a) < 1 µg L -1<br />
• Atlantic Coast (NEA Type 1/26a) < 5 µg L -1<br />
Proposed reference values for the taxa count metric – Spain<br />
• Eastern Cantabrian Coast (NEA1/26a)-Threshold 750,000 cells/L- % Frequency Exceeding cell<br />
threshold: Reference 16.70 %, H/G 20 %- G/M 40 %<br />
• Western Cantabrian Coast (NEA1/26e)- Threshold 750,000 cells/L- % Frequency Exceeding<br />
cell threshold: Reference 25 %, H/G 30 %- G/M 50 %<br />
• Western Iberian Coast (upwelling, NEA1/26e)- Threshold 1,000,000 cells/L- % Frequency<br />
Exceeding cell threshold: Reference 25 %, H/G 30 %- G/M 50 %<br />
• Canary Islands (NEA1/26a)- Threshold 500,000 cells/L- % Frequency Exceeding cell threshold:<br />
Reference 16.70 %, H/G 20 %- G /M 40 %<br />
• Atlantic Coast (NEA1/26a)- Threshold 500,000 cells/L- % Frequency Exceeding cell threshold:<br />
Reference 16.70 %, H/G 20 %- G/M 40 %<br />
Portugal<br />
NEA GIG TYPE 1/26e Western Iberian Coast (upwelling)<br />
Chlorophyll-a metric<br />
The coast of Portugal extends north from Cape St Vincent to the border with northern Spain at<br />
the Minho. This coastline has a narrow continental shelf and is subject high hydrodynamics and<br />
upwelling.<br />
The south coast of Portugal extends west from Cape St Vincent to the border with southern Spain at<br />
the Guadiana. Although less exposed than the west coast it also has a narrow continental shelf and is<br />
subjected to upwelling, (Garcia et al. 2002).<br />
The continuity with the Andalucian coast, east of the Guadiana mouth, and the northern border<br />
with Spain must be considered, and the thresholds for phytoplankton biomass should not differ<br />
significantly between Portugal and Spain. The 90th percentile of chlorophyll “a” for Portugal is 5 µg<br />
L-1 (boundary 8 µg L-1 between high and good status) and 10 µg L-1 (boundary 12 µg L-1 between<br />
good and moderate status). Nevertheless, these may be revised in the future, as more chlorophyll<br />
data becomes available.<br />
Proposed Reference chl-a values for Portuguese waters<br />
• NEA GIG TYPE 1/26e Western Iberian Coast (upwelling) -<br />
• Reference condition
Taxa count metric<br />
Proposed Reference taxa counts values for Portuguese waters<br />
• NEA GIG TYPE 1/26e Western Iberian Coast (upwelling) Cell Threshold: 100,000 cells/L (large<br />
phytoplankton threshold), 1,000,000 cells/L (small phytoplankton threshold)<br />
• Percentage exceedent thresholds: Reference = 25 % (3 blooms expected per year, spring,<br />
summer and autumn, with monthly sampling), H/G
Proposed reference chl-a values for ROI waters<br />
• NEA GIG Type 1/26A – Irish Sea (Acetone Method) – 3.7 µg L-1 • NEA GIG Type 1/26A – Atlantic Sea (Acetone Method) – 3.4 µg L-1 Taxa count metric<br />
Proposed reference taxa count values for ROI waters<br />
• NEA GIG Type 1/26A – Irish Sea & Atlantic Sea Cell Threshold: 250,000 cells/L (Large<br />
phytoplankton)<br />
• Reference Percentage exceedent threshold: 16.7 % (2 samples, associated with natural spring<br />
and autumn blooms. Assumes monthly sampling)<br />
• Percentage exceedent thresholds: H/G 20 %, G/M 40 %<br />
Netherlands<br />
NEA Type 3, 4 & NEA Type 1/26b<br />
• Holland and North Delta Coast (NEA Type 3)<br />
• Dutch Wadden Sea (NEA Type 4)<br />
• Zeeland Coast and Wadden Coast (NEA Type 1, 1/26b)<br />
Chlorophyll-a metric<br />
Originally all coastal waters of UK (east) and NL were classified as one type (NEA1) and therefore<br />
had the same reference values. However, with regard to the mean salinity values the Holland Coast<br />
more properly fell in the NEA3 type. The difference between the UK discharges and the Dutch<br />
discharges is a factor 1.7, and between the German discharges and the Dutch discharges is a factor<br />
2.3. Assuming that the concentrations of nutrients in the pristine situation were identical in the<br />
British and the continental rivers, the nutrient load on the Holland Coast can be expected to be 1.7<br />
times higher than that in the British waters and 2.1 times higher than in the German waters. New<br />
class boundaries of NEA3 have been calculated based on freshwater discharges. Therefore the<br />
elevated values for the 90-percentile of the chlorophyll-a concentrations in the Holland Coast will<br />
be in the range of 11 to 17 µg L -1 i.e. at least a factor 2.1 higher than the values of the German<br />
Coast and at most 1.7 higher than the values for the English coast due to the higher run off of the<br />
Netherlands/Holland Coast typology.<br />
According to Cadée and Hegeman (2002) the annual average chlorophyll-a concentrations in<br />
the 70’s of the last century have been between 2 and 5 µg L -1 . With the relationships between<br />
annual mean and summer mean, the related range of the summer mean could be calculated and by<br />
multiplying the numbers of this range with the factor 2 (relation mean – 90-percentile) the range of<br />
the summer 90-percentile has been derived, as being 5 – 13 µg L -1 1 . Assuming that the chlorophyll<br />
concentrations in the 70’s were elevated in relation to the undisturbed background concentrations,<br />
but still below 1.5 times the background, the value 14 μg/l deduced from the freshwater discharges<br />
agrees very well with the value deduced from Cadée & Hegeman (2002). In the framework of the<br />
“<strong>Water</strong>systeemverkenning” (<strong>Water</strong> System Exploration) in the Netherlands, so called reference values<br />
(which were in fact the boundaries between High and Good) for a number of functional groups and<br />
individual species have been calculated (Baptist & Jagtman, 1997). For chlorophyll the “reference”<br />
value has been expressed as the 90-percentile value of the concentration. The calculation of this value<br />
has been based on model simulations and expert judgement and is calculated as 14.3 μg/l for NEA3 in<br />
Dutch coastal waters. Taking 14 µg/l as boundary between High and Good gives a reference value of<br />
9.3 µg L -1 (2/3 * 14) and a boundary between Good and Moderate of 21 µg L -1 (1.5 *14).<br />
154
The waterbodies Zeeland Coast and Wadden Coast are belonging to the euhaline water type, NEA1.<br />
Although the influence of freshwater in the Zeeland Coast is slightly higher than in UK coastal<br />
waters the class boundaries for the 90-percentile summer chlorophyll-a concentrations for both<br />
areas could be set on 10 and 15 µg L -1 , with a reference values of 6.7 µg L -1<br />
Class boundaries for NEA4 for the Dutch Wadden Sea are set equal to NEA3 (14 and 21 µg L -1 ),<br />
based on comparable influence of Rhine discharges.<br />
Proposed reference chl-a values for Netherlands <strong>Water</strong>s<br />
• NEA GIG Type 4 – Dutch Wadden Sea – 9.3 µg L-1 • NEA GIG Type 3 – Holland and North Delta Coast – 9.3 µg L-1 • NEA GIG Type 1 (1/26b) – Zeeland Coast and Wadden Coast – 6.7µg L-1 Phaeocystis metric<br />
Proposed reference Phaeocystis values for Netherlands waters<br />
• NEA GIG Type 1 (1/26b) - Zeeland Coast and Wadden Coast, NEA Type 3 - Holland and NEA<br />
Type 4 - North Delta Coast, Dutch Wadden Sea - Cell threshold: 1,000,000 cells/L<br />
• Reference percentage exceedent threshold: 8.30 % (1 sample in 12 months as part of natural<br />
spring bloom. Assumes monthly sampling)<br />
• Percentage exceedent thresholds: H/G 10 %, G/M 17 %<br />
France<br />
Chlorophyll-a metric<br />
French Channel and Atlantic coast (except Northern part) / type NEA 1/26a<br />
Reference values are based on data collected from undisturbed sites that are considered to be<br />
close to or at reference as determined by expert judgment. The 90 th percentile calculated on these<br />
reference sites shows that the reference values may be different between sites:<br />
site 90 th percentile<br />
Cherbourg Port / 2004-2005 4.40<br />
Donville / 2002-2006 2.58<br />
Chausey / 2001-2006 2.29<br />
Bréhat / 1992-2006 1.71<br />
Ouessant - cale de Porz Arlan / 2006 1.30<br />
Groix nord / 1996-2006 3.99<br />
Port Joinville / 2006 2.20<br />
Bouée 7 / 2003-2006 2.85<br />
This is considered as reflecting the diversity of the French coast, since the values are consistent<br />
between large geographical regions: the lowest values concern the Northern and Western parts<br />
of Brittany, while the highest ones concern primarily Normandy. The reference value is therefore<br />
proposed as a range between the lowest (1.30) and the highest value (4.4) of these reference sites.<br />
155
Northern part of the French coast (North Sea) / type NEA 1/26b<br />
No reference site could be found in this region. However, data collected in two offshore sites (site 4<br />
SRN Dunkerque and site 3 SRN Boulogne) show that the values of 90th percentile chlorophyll-a on<br />
the period 1992-2006 are respectively 9.9 and 6.2 µg/L. It may be considered by expert judgment<br />
that these values are consistent with the reference value calculated for the type NEA 1/26b. So it is<br />
decided that, in the absence of reference site for this part of French coast, the calculated value of<br />
6.7 µg/L should be the reference value.<br />
Proposed reference chl-a values for French <strong>Water</strong>s<br />
• NEA GIG Type 1/26a – French Channel and Atlantic Sea – 1.3 – 4.4 µg L-1 • NEA GIG Type 1/26b – French North Sea – 6.7 µg L-1 Taxa count metric<br />
Proposed reference taxa count values for French waters<br />
• NEA GIG Type 1/26a – French Channel and Atlantic Sea – 100,000 cells/L (Large<br />
phytoplankton threshold, 250,000 cells/L (Small phytoplankton threshold)<br />
• Reference Percentage exceedent threshold: 16.7 % (2 samples, associated with natural spring<br />
and autumn blooms. Assumes monthly sampling)<br />
• Percentage exceedent thresholds: H/G 20 %, G/M 40 %<br />
Sweden<br />
NEA GIG TYPE 8, 9 and 10<br />
• Öresund and Kattegat (8)<br />
• Skagerrak (9)<br />
• Skagerrak (10)<br />
Chlorophyll-a metric<br />
Sweden is using the method outlined in the Combine manual of HELCOM (www.helcom.fi).<br />
In short this means; fluorometric measurement, calibrated against spectrophotometric method,<br />
ethanol as solvent. Sweden <strong>report</strong>s Chlorophyll-a, without subtraction of Phaeopigment.<br />
Along the Swedish west coast (Skagerrak, Kattegat and Öresund) reference values of chlorophyll<br />
are based on off shore data. Temporal changes of Secchi depth and Total Nitrogen were used to<br />
establish “unaffected” (background) values. The relations between Secchi depth, Total Nitrogen,<br />
salinity and chlorophyll-a were then used to establish the Chlorophyll a reference value for each<br />
Type Area. Boundary classes were calculated using the relationships between Secchi depth, Total<br />
Nitrogen and chlorophyll-a. The boundary between GOOD and MODERATE was set with the<br />
assumption that the Skagerrak and Kattegat are not unaffected by man. Other class boundaries were<br />
set by a 50-75 % increase between the classes.<br />
Proposed reference chl-a values for Swedish waters<br />
• NEA GIG Type 8 – Öresund and Kattegat – 1.0 µg L-1 • NEA GIG Type 9 – Skagerrak – 1.7 µg L-1 • NEA GIG Type 10 – Skagerrak – 2.0 µg L-1 156
Abundance of phytoplankton as a metric has not been used in Sweden and reference values and<br />
boundaries can therefore not be presented at present. However Sweden is developing phytoplankton<br />
abundance as a metric, which can be used as a parallel to the Swedish phytoplankton metric<br />
BIOVOLUME of phytoplankton.<br />
Norway<br />
Chlorophyll-a metric<br />
The method for measuring chlorophyll-a in Norway is in accordance to Norwegian Standard 4767<br />
using methanol for pigment extraction. There is no correction for pheopigments.<br />
For establishing reference values and boundary criteria “Classification of environmental quality<br />
in fjord and coastal waters. A guide” (Norwegian Pollution Control Authority 1997) and expert<br />
judgment has been used. Lack of long term series from monitoring programs from relevant areas<br />
have prevented use of historical data.<br />
Proposed reference chl-a values for Norwegian waters<br />
• NEA GIG Type 1/26a – North Sea, Norwegian Sea – 1.7 µg L-1 • NEA GIG Type 8 – Skagerrak (see map) – 1.0 µg L-1 • NEA GIG Type 9 – Skagerrak (see map) – 1.7 µg L-1 • NEA GIG Type 10 – Skagerrak (see map) – 2.0 µg L-1 Norway has not used abundance of phytoplankton as a metric, as reference values and boundaries<br />
can not be presented at this stage. However, phytoplankton as a metric is under development as well<br />
as cell carbon and biovolume.<br />
Belgium<br />
NEA GIG TYPE 1/26b<br />
Chlorophyll-a metric<br />
For Chl-a, a background Chl-a concentration was determined for the application of phytoplankton<br />
assessment criteria for the Belgian Continental Shelf. Eutrophication in the BCS occurs in the form<br />
of massive, ephemeral Phaeocystis colony blooms during spring (April-May). Phaeocystis colonies<br />
generally occur simultaneously with diatom (mainly Guinardia spp.) blooms that considerably<br />
affect the Chl-a concentrations. Analysis of historical data (ASMO 98/3/Info.1-F) suggests<br />
that foam accumulation would occur from a Phaeocystis cell concentration of 10 7 l -1 . This cell<br />
concentration can be converted into a Chl-a concentration of 5 μg Chl-a l -1 (C : Chla = 29) using the<br />
experimentally determined factor of 0.5 pg Chl-a /Phaeocystis cell (Rousseau et al., 1990).<br />
The contribution of diatoms to the spring bloom has been established from the analysis of a 13<br />
year time series at a monitoring station (330) located in the centre of the Belgian Continental<br />
Shelf. Seasonal evolution of Chl-a concentrations measured on a weekly basis indicates that the<br />
average Chl-a concentration of 9.2 μg l -1 corresponds to the Phaeocystis pre-bloom situation, itself<br />
determined as a Phaeocystis concentration higher than 1x10 6 cells l -1 (Cadée & Hegeman, 1991).<br />
This allows us to consider a threshold of 15 μg Chl-a l -1 from which nutrient over-enrichment would<br />
result in ecosystem disturbance.<br />
Proposed reference chl-a values for Belgium waters<br />
(Calculated reference condition, based on 50 % deviation of reference from the high/good boundary)<br />
NEA GIG Type 1/26b – North Sea – 6.7 µg L -1<br />
157
Phaeocystis metric<br />
Proposed reference Phaeocystis values for Belgium waters<br />
NEA GIG Type 1/26b – North Sea – Cell threshold: 1,000,000 cell/L<br />
Reference percentage exceedent threshold: 8.30 % (1 sample in 12 months as part of natural<br />
spring bloom. Assumes monthly sampling)<br />
Percentage exceedent thresholds: H/G 10 %, G/M 17 %<br />
Denmark<br />
• NEA GIG Type 1/26c – North Sea (German Bright & Jutland)<br />
• NEA GIG Type 1/26d – Denmark Skagerrak<br />
• NEA GIG Type 8 – Kattegat + Small area of Skagerrak<br />
Chlorophyll-a metric<br />
Proposed reference chl-a values for Denmark waters<br />
(Calculated reference condition, based on 50 % deviation of reference from the high/good<br />
boundary)<br />
• NEA GIG Type 1/26c – North Sea (German Bright & Jutland) – 3.3 µg L-1 • NEA GIG Type 1/26d – Denmark Skagerrak – 2.0 µg L-1 • NEA GIG Type 8 – Kattegat + Small area of Skagerrak – 1.0 µg L-1 Germany<br />
Chlorophyll-a metric<br />
Proposed reference chl-a values for German waters<br />
• NEA GIG Type 1/26c – North Sea - German Bright & Jutland – 3.3 µg L-1 • NEA GIG Type 3/4 – North Se - Ems, Weser, Elb Coast – 3.3 µg L-1 Phaeocystis metric<br />
Proposed reference Phaeocystis values for German waters<br />
• NEA GIG Type 1/26c – North Sea - German Bright & Jutland – Cell threshold: 1,000,000 cell/L<br />
• NEA GIG Type 3 4 – North Sea - Ems, Weser, Elb Coast – Cell threshold: 1,000,000 cell/L<br />
• Reference percentage exceedent threshold: 8.30 % (1 sample in 12 months as part of natural<br />
spring bloom. Assumes monthly sampling)<br />
• Percentage exceedent thresholds: H/G 10 %, G/M 17 %<br />
Class Boundary Setting Procedures<br />
The reference values put forward by each MS for the typologies were specific to each type, and<br />
vary geographically. The boundary setting protocols investigated conditions that influenced the<br />
geographical difference between the NEA GIG types. Examination of the conditions influencing the<br />
variation between NEA types supported the delineation of the geographical areas, and the reasoning<br />
behind the differences in reference conditions.<br />
158
The NEA GIG covers a very large geographic area from Southwest Spain (including the Canary<br />
Islands, 28 o N) to Northern Norway (71 o N). These areas will have different non-anthropogenic<br />
pressures, which would affect the onset, rate of growth and overall productivity of phytoplankton<br />
populations in identical typologies, consequently different thresholds need to be set. The main nonanthropogenic<br />
drivers are:<br />
• Isolation<br />
• Freshwater discharge & catchment geology<br />
• Upwellings<br />
• Continental shelf width / break<br />
• Coastal geomorphology & Sediment loads<br />
• Tidal height & coastal currents<br />
• Basic salinity regime<br />
The OSPAR Quality Status Review (2000) recognizes some of these hydromorphic features in its<br />
approach to regional seas (Figure 2.4.1).<br />
However for the purposes of setting chlorophyll boundaries and thresholds the local nature of all the<br />
factors above also needs to be taken into account.<br />
Major influences on sub-types<br />
The first layer of types was determined primarily on freshwater inflow. Details of freshwater flow<br />
characteristics are found in Table 6. On the basis of freshwater flow, an initial boundary setting<br />
procedure differentiates 9 broad coastal types as shown in Table 7<br />
Higher freshwater flows within the Dutch coastal zone compared to other NEA-GIG coasts, change<br />
the typology of the Holland Coast from North Sea euhaline (NEA1) into a polyhaline (NEA3).<br />
However, freshwater flow does not account for all the variability between GIG types and further<br />
delineation is explained by both upwelling and localised influences.<br />
Within each of the broad typologies, further delineation was required to account for upwelling and<br />
localized and regional variations within the typologies.<br />
Figure 2.4.1: Hydromorphic areas of the NEA GIG Atlantic area.<br />
159
Table 2.4.6: Freshwater flow characteristics of each region associated with reference conditions of chlorophyll.<br />
Zone Member States<br />
Western Iberian coast upwelling Portugal / Spain West coast 63<br />
Cantabrian coast North Spanish Coast 16<br />
Atlantic Coast French Atlantic coast 46.5<br />
Atlantic Coast Atlantic Coast (UK and IE) 40<br />
North Sea North Sea (UK, NL, Belgium) 122<br />
Irish Sea Irish Sea (UK & IE) 80<br />
German Bight Germany & Denmark 22<br />
Scandinavian Coast Denmark, Sweden & Norway 21.5<br />
For example, because of the extreme variation in latitude within the type NEA1/26 it was<br />
not possible to agree a single range of chlorophyll thresholds across the entire area as there are<br />
significant differences in how phytoplankton reacts to natural and anthropogenic nutrient<br />
enrichment. There are clear differences between the open clearer Atlantic waters and the more<br />
enclosed sea areas and special cases e.g. where natural upwelling occurs, particularly on the Western<br />
Iberian coast.<br />
It was therefore agreed by the GIG that the only way to produce meaningful results was to split type<br />
NEA1/26 into five sub-types, NEA1/26a, b, c, d, e. The sea areas grouped under this new typology<br />
are described in Table 7.<br />
Type 1/26a generally reflects open clearer Atlantic <strong>Water</strong>s and Type1/26b generally reflects more<br />
enclosed sea areas. Spain and Portugal are both affected by the Iberian Upwelling, which reacts<br />
very differently from other regions in the NEA GIG, with naturally nutrient enriched coastal waters<br />
and more natural phytoplankton blooms expected through out the year. This upwelling area has been<br />
designated Type 1/26e.<br />
Kattegat and Skagerrak also behave differently from the other areas. It is a complex system with low<br />
salinity (surface values from salinity 10-12 in south Kattegat increasing up 25-30 in the Skagerrak)<br />
and the areas are greatly influenced by inflow of water from the Baltic Sea, the German Bight, the<br />
North sea and the Atlantic. Stratification, sometimes three layers, occurs in most of the area in the<br />
growing season due to the different salinity in the different inflowing water types and the relatively<br />
shallow water. Due to these complex factors, the Scandinavian coast is divided into type 8, 9, 10<br />
with additional separation of small areas into 1/26a, 1/26c and 1/26d.<br />
There is also a change of chlorophyll thresholds across the Spain/ France border. The differences<br />
in morphological and hydrographical features between the Spanish and French shelves have been<br />
taken into account to justify lower thresholds of the Eastern Cantabrian coast (Spain’NEA1/26a).<br />
The Eastern Cantabrian coast has almost no coastal plain and the rivers are small, whereas the French<br />
shelf presents a wide coastal plain and much higher river runoff.<br />
160<br />
Freshwater Discharge/ Runoff<br />
(km 3 /year)
Table 2.4.7: Description of NEA GIG types and associated areas.<br />
New Type Areas<br />
NEA1/26a<br />
NEA1/26b<br />
Eastern Cantabrian Coast, Canary Islands. Atlantic Coast, Western Irish Sea, Scandinavian Coast:<br />
North Sea Norway + Norwegian Sea<br />
Eastern Irish Sea, North Sea (UK East Coast, Channel, NL Wadden Coast, Zeeland Coast,<br />
Belgium Coast)<br />
NEA1/26c German Bight & Jutland<br />
NEA1/26d Scandinavian Coast: Denmark Skagerrak<br />
NEA 1/26e Western Iberian Coast upwelling, Western Cantabrian Coast<br />
NEA8 Denmark, Norway, Sweden: Kattegat + small area of Skagerrak<br />
NEA9 Sweden, Norway: Skagerrak<br />
NEA10 Sweden, Norway: Skagerrak<br />
Thus if we take into account, the variation between freshwater flow, upwelling and localised<br />
regional differences, the NEA GIG can be separated into 9 distinct coastal areas. The nine coastal<br />
types will be intercalibrated in Phase I. Intercalibration on NEA Type 11 (Transitional waters) will<br />
be taken up in Phase 2 Intercalibration. The final delineation of NEA GIG Coastal Types for Phase I<br />
<strong>intercalibration</strong> is illustrated in Figure 2.<br />
NB. The map in Figure 2 shows the regions and areas and the coastal types that apply, Germany &<br />
Netherlands appears to have two types overlying each other, this is due to off shore coastal islands<br />
that respond to North Sea influences defined by type NEA 1/26b and an inshore area (Wadden Sea<br />
Coast) which response to influences defined by type NEA3/4.<br />
2.4.4 Results of the comparison<br />
As option 2 has been used, the boundaries have been agreed by experts representing all countries<br />
in the GIG phytoplankton sub-group. Therefore the final agreed results presented below are the<br />
results of comparing expert views on what the boundaries should be related to type differences and<br />
reference levels.<br />
2.4.5 Results of the harmonization – Boundary thresholds and EQR values<br />
Metric-Chlorophyll-a concentration (90th Percentile) (Boundary Setting Procedure and Results<br />
(All Coastal <strong>Water</strong> Types: NEA 1/26a,b,c,d,e, NEA3/4, NEA7, NEA8, NEA9, NEA10))<br />
This tool is based on the location of the 90 th percentile of chlorophyll concentration against<br />
boundary thresholds set for the High/Good and Good/Moderate boundaries. The tool assumes that<br />
6 years of chlorophyll data are available with monthly sampling during the growing season. The<br />
assessment is made against the phytoplankton agreed growing season which varies with latitude.<br />
Recommendations from Quasimene on chlorophyll analysis show an accepted 12 % error in<br />
sampling and analysis. The inherent sampling error can then account for the small differences in<br />
reference values within the same type and same boundary conditions (i.e. Portugal and Spain –<br />
Iberian Upwelling coast).<br />
161
The same level of deviation from reference values to the High/Good and Good/Moderate boundaries<br />
have been agreed within these new (and existing) types and numeric 90 th percentile thresholds<br />
set for each of the geographic areas described above. There have been three different levels of<br />
deviations within types set for chlorophyll, which translates into type specific EQRs for the three<br />
different deviations (see Table 8). The three levels of difference between high/good and good/<br />
moderate thresholds are set at 100 % for type 1/26a, 8, 9, 10, 50 % for type 1/26b, 1/26e, 3 and 4<br />
and 33 % for type 1/26c and 1/26d. These typologies reflect the different way the phytoplankton<br />
reacts in these waterbodies. In the clear open Atlantic waters, the phytoplankton respond quickly<br />
to small changes in nutrients while those areas of more enclosed seas and upwelling’s tend to have<br />
higher turbidity and nutrients, so may respond more slowly initially but bigger natural blooms can<br />
be maintained.<br />
NEA Types 1/26a, 8, 9, 10 are all relatively clear waters with relatively low natural inputs of<br />
nutrients (therefore fast initial reaction but may not be sustained). For these types with low<br />
reference thresholds, it was decided that in the absence of good empirical data, 100 % deviation<br />
was considered to give a reasonable indication of a slight to moderate deviation from the high/good<br />
162<br />
Figure 2.4.2: NEA Coastal Typology<br />
Delineation, Phase I Intercalibration.
oundary. ROI, France, Spain and Scandinavian countries all have the same percentage of change<br />
between boundaries in areas where reference values are lower than 5 µg/L.<br />
NEA Type 1/26b, 1/26e, 3, 4 are a combination of relatively high amounts of natural nutrients<br />
(either from run off or upwelling) and / or relatively high turbidity (slower reaction which can<br />
sustain bigger and longer blooms). In these areas where the reference values are higher, a 50 %<br />
change has been agreed on in keeping with the OSPAR recommendation that 50 % is adequate to<br />
describe a slight to moderate deviation from the reference level.<br />
In NEA Types 1/26c and 1/26d, the inflow of deep water, relatively rich in nutrients but initially<br />
unavailable to algae enters the Kattegat bottom waters and eventually mixing to the surface water<br />
and re-exports to the Skagerrak frontal area.<br />
Table 8 shows both the numeric chlorophyll thresholds and the associated EQRs. Table 9 shows a<br />
summary of the type specific EQRs only. Extent of boundary conditions is illustrated in Figure 3.<br />
Table 2.4.8: Final boundary thresholds grouped by NEA GIG geographic zones and types for chlorophyll a metric.<br />
Geographical Zone Member States New Type Reference (calculated<br />
from High/Good)<br />
90 %ile<br />
High /<br />
Good<br />
90 %ile<br />
Good /<br />
Mod<br />
H/G<br />
EQR<br />
Canary Islands ES NEA1/26a 0.67 1 2 0.67 0.33<br />
Western Iberian Coast<br />
upwelling<br />
Western Cantabrian<br />
Coast<br />
Eastern Cantabrian<br />
Coast<br />
Atlantic Coast FR , UK (exposed<br />
West Coast & NI.),<br />
ROI, ES (Gulf of<br />
Cadiz, Sweden<br />
G/M<br />
EQR<br />
PT, ES NEA1/26e 5.33 8 12 0.67 0.44<br />
ES NEA1/26e 4.00 6 9 0.67 0.44<br />
ES NEA1/26a 2.33 3.5 7 0.67 0.33<br />
NEA1/26a 3.33 5 10 0.67 0.33<br />
Western Irish Sea UK (NI), ROI NEA1/26a 3.33 5 10 0.67 0.33<br />
Eastern Irish Sea UK (England, Wales,<br />
Scotland)<br />
North Sea NL (Wadden coast),<br />
BE, UK (East Coast,<br />
Channel), FR<br />
North Sea - , “German<br />
Bight”, & Jutland<br />
NEA1/26b 6.67 10 15 0.67 0.44<br />
NEA1/26b 6.67 10 15 0.67 0.44<br />
DE, DK NEA1/26c 3.33 5 7.5 0.67 0.44<br />
Scandinavian Coast DK NEA 1/26d 2.00 3 4 0.67 0.50<br />
Scandinavian Coast DK,NO,SE NEA8 1.00 1.5 3 0.67 0.33<br />
Scandinavian Coast NO,SE NEA9<br />
NEA1/26a<br />
1.67 2.5 5 0.67 0.33<br />
Scandinavian Coast SE,NO NEA10 2.00 3 6 0.67 0.33<br />
163
Table 2.4.9: Summary of EQR ratios of Chlorophyll-a for the NEA GIG types and areas.<br />
Type Areas H/G EQR G/M EQR<br />
NEA1/26a Eastern Cantabrian Coast, Canary Islands. Atlantic Coast, Western<br />
Irish Sea, Scandinavian Coast: North Sea Norway + Norwegian Sea<br />
NEA1/26b Eastern Irish Sea, North Sea (UK East Coast, Channel, NL Wadden<br />
Coast, Zeeland Coast, Belgium Coast)<br />
164<br />
0.67 0.33<br />
0.67 0.44<br />
NEA1/26c German Bight and Jutland 0.67 0.44<br />
NEA1/26d Scandinavian Coast: Denmark Skagerrak 0.67 0.50<br />
NEA1/26e Western Iberian Coast upwelling, Western Cantabrian Coast 0.67 0.44<br />
NEA8 Denmark, Norway, Sweden: Kattegat + small area of Skagerrak 0.67 0.33<br />
NEA9 Sweden, Norway: Skagerrak (see map) 0.67 0.33<br />
NEA10 Sweden, Norway: Skagerrak (see map) 0.67 0.33<br />
Chlorophyll<br />
boundaries<br />
H/G (ug/L)<br />
Figure 2.4.3: Chlorophyll boundary<br />
conditions for NEA GIG types.<br />
(Needs updating in early Phase II).
Metric - Taxa Cell Counts (“frequency of phytoplankton cell counts above a predefined<br />
threshold, ranging approximately from 10 5 to 10 6 cells/l”) (Boundary Setting Procedure and<br />
Results (All Coastal <strong>Water</strong> Types: NEA 1/26a,b,c,d,e, NEA3/4, NEA7, NEA8, NEA9, NEA10))<br />
Frequent occurrences of phytoplankton taxa above bloom levels over the growing season are an<br />
indication of ecosystem disturbance. Natural blooms in the spring and autumn are to be expected but<br />
more frequent occurrences throughout the rest of the year are considered indicative of a degraded<br />
system.<br />
The sub metric is the frequency of blooms of any routinely identifiable phytoplankton taxa over a<br />
defined threshold from monthly sampling is calculated over a 6 year period.<br />
The definition of the index is based on:<br />
• Number of samples where a single taxa count is over a predefined threshold<br />
• Six years of routine monitoring data should be used from the whole year<br />
• A minimum of 12 sampling occasions (monthly) per year is recommended (but not essential).<br />
• CLASSIFICATION is based on the number of sampling times where the single taxa counts<br />
exceed a threshold and is calculated as a percentage of the total number of samples collected<br />
within one water type for the six year period.<br />
As the chlorophyll thresholds are region-specific, the cell-count threshold has been adapted for<br />
regions that present different trophic richness due to their natural (hydromorphological) features.<br />
Therefore, different cell-count thresholds will be used within the different types and regions. For<br />
example, the upwelling coast of NW Spain will have a higher threshold, as blooms there are of high<br />
magnitude due to natural processes of nutrient enrichment. As the upwelling intensity decreases<br />
gradually eastward, the Cantabrian Coast would present lower thresholds. The Canary Archipelago,<br />
the most oligotrophic area in Spain, would present the lowest threshold. As for the frequency of<br />
blooms, it should be noted that the Iberian upwelling zone is subject to a higher frequency of<br />
blooms than expected in other coastal waters due to the occurrence of blooms during the summer,<br />
which is a season of high upwelling intensity in that area. Therefore, the boundary classification<br />
should be adapted for this special region where blooms are not always related to anthropogenic<br />
eutrophication.<br />
It was accepted at GIG meeting in Mieres that member states will use different phytoplankton<br />
analytical levels. Two groups of routinely identified phytoplankton were determined. These are<br />
loosely termed “large” (mainly microphytoplankton, chain formers and other readily identified<br />
groups) and “small” (which includes, nanoplankton, microflagellates and the more difficult taxa).<br />
There tend to be fewer large taxa then small, so two thresholds of cell count are required. Where<br />
a member state identifies and counts phytoplankton from both groups the assessment requires a<br />
primary assessment against the “large” threshold, if the sample passes then it is assessed against the<br />
small threshold. The reference level is the frequency these local numbers are exceeded. These are<br />
presented in the table below:<br />
165
Table 2.4.10: Summary of final intercalibrated boundary thresholds grouped by NEA GIG geographic zones and types<br />
for taxa count metric. N/P = not participating.<br />
Member<br />
state<br />
166<br />
Typology Area<br />
Reference ( % Single<br />
Taxa counts exceeding<br />
thresholds)<br />
Large<br />
Phytoplankton<br />
Threshold<br />
Small<br />
Phytoplankton<br />
Threshold<br />
Reference = number of times a single taxa count exceeds the<br />
threshold. If we expect a spring and autumn bloom and only<br />
sample monthly then 2/12 = 16.7 %. High
Not all member states are participating in this metric. Participating countries include Portugal,<br />
Spain, France, Republic of Ireland, and UK. The associated typologies are: NEA 1/26a, 1/26b,<br />
1/26e, 3, and 4.<br />
All single taxa counts above the threshold are calculated as a percentage of the overall sampling<br />
count (over the six-year period). Percentages are calculated and scored as per Table 11(Borja et al,<br />
2004). The value of the percentage decides the boundary classification.<br />
Table 2.4.11: Agreed Percentage Boundaries NEA1/26a, b, NEA3/4.<br />
Phytoplankton Boundary Percentages Boundary classification<br />
90 % single taxa counts exceeding threshold BAD<br />
These boundaries equate to H/G and G/M EQRs of 0.84 and 0.43 calculated by dividing e.g. reference %, 16.7 by<br />
boundary % e.g. 20 = 0.84 at the High/Good boundary etc.<br />
Table 2.4.12: Agreed Percentage Boundaries NEA1/26e (Spain & Portugal) for coastal waters affected by upwelling.<br />
Phytoplankton Boundary Percentages Boundary classification<br />
< 30 % single taxa counts exceeding the threshold HIGH<br />
30 - 49 % single taxa counts exceeding the threshold GOOD<br />
50 - 69 % single taxa counts exceeding the threshold MODERATE<br />
70 - 90 % single taxa counts exceeding the threshold POOR<br />
>90 % single taxa counts exceeding the threshold BAD<br />
These boundaries equate to H/G and G/M EQRs of 0.83 and 0.51 calculated by dividing e.g. reference %, 25 by<br />
boundary % e.g. 30 = 0.83 at the High/Good boundary etc.<br />
Metric - Indicator Taxa (Frequency of Phaeocystis Cell counts above 10 6 Cells/l) (Boundary<br />
Setting Procedure and Results (All Coastal <strong>Water</strong> Types: NEA 1/26a,b,c,d,e, NEA3/4, NEA7,<br />
NEA8, NEA9, NEA10))<br />
Classification is based upon percentage of months with one or more occasions where the counts of<br />
Phaeocystis exceed the predetermined threshold. The definition of the metric is:<br />
• Number of months with samples where the Phaeocystis cell count is over a predefined<br />
threshold<br />
• Six years of routine monitoring data should be used from the whole year<br />
• A minimum of 12 sampling occasions (monthly) per year is recommended (but not essential).<br />
• CLASSIFICATION is based on the number of months with one or more sampling times where<br />
the Phaeocystis counts exceed a threshold and is calculated as a percentage of the total number<br />
of months collected within one water type for the six year period.<br />
167
Table 2.4.13: Agreed Thresholds and References for Phaeocystis threshold.<br />
Member<br />
state<br />
168<br />
Typology Reference (% Phaeocystis counts exceeding thresholds).<br />
N/P = not participating.<br />
Reference = number of times a single taxa count exceeds the<br />
threshold. If we expect only a spring bloom and only sample<br />
monthly then 1/12 = 8.33 %. High /Good=10 %,G/M=17 %<br />
Phaeocystis<br />
Threshold<br />
Cells/l<br />
Spain NEA1/26a N/P N/P<br />
Spain NEA1/26e N/P N/P<br />
Portugal NEA1/26e N/P N/P<br />
France NEA1/26a N/P N/P<br />
France NEA1/26b N/P N/P<br />
Belgium NEA1/26b 8.30 1000000<br />
Netherlands NEA1/26b 8.30 1000000<br />
Netherlands NEA3 8.30 1000000<br />
Netherlands NEA4 8.30 1000000<br />
Germany NEA1/26c 8.30 1000000<br />
Germany NEA3 8.30 1000000<br />
Germany NEA4 8.30 1000000<br />
Denmark NEA1/26c N/P N/P<br />
Denmark NEA1/26d N/P N/P<br />
Denmark NEA8 N/P N/P<br />
Sweden NEA8 N/P N/P<br />
Sweden NEA9 N/P N/P<br />
Sweden NEA10 N/P N/P<br />
Norway NEA1/26a N/P N/P<br />
Norway NEA8 N/P N/P<br />
Norway NEA9 N/P N/P<br />
Norway NEA10 N/P N/P<br />
RoI NEA1/26a N/P N/P<br />
UK NEA1/26a 8.30 1000000<br />
UK NEA1/26b 8.30 1000000<br />
Only the Netherlands, Germany, UK and Belgium, are participating in this tool. Classification is<br />
taken from the final percentage count of exceedances over the total sampling number. The present<br />
threshold percentages related to boundary classifications are presented in Table 14. There is still<br />
some discussion on the boundaries for moderate, poor and bad and further work is required on<br />
these boundaries. As all participating countries have agreed the same method in terms of reference<br />
conditions, boundary thresholds and EQRs within types then this <strong>intercalibration</strong> fulfils the criteria<br />
set out under Option 1 in the <strong>intercalibration</strong> process.
Table 2.4.14: Phaeocystis boundary thresholds.<br />
Phaeocystis Percentage exceedance boundaries Boundary classification<br />
17 % Phaeocystis exceeding threshold MODERATE<br />
>35 % Phaeocystis exceeding threshold Poor<br />
>80 % Phaeocystis exceeding threshold Bad<br />
These boundaries equate to H/G and G/M EQRs of 0.92 and 0.49 calculated by dividing e.g. reference %, 8.3 by<br />
boundary % e.g. 10 = 0.83 at the High/Good boundary etc.<br />
2.4.6<br />
Open issues and need for further work<br />
• Transitional <strong>Water</strong>s – all metrics need agreement. Need to normalize data to salinity values.<br />
At present there is only one ECO TW type, this will be a problem that we need to resolve.<br />
Flow regime also affects diversity; this is another issue that would require normalization for all<br />
countries in NEA GIG.<br />
• Sampling frequency – how can this affect the boundary thresholds.<br />
• Phytoplankton composition/community – requirement for further investigation.<br />
• Toxic species?<br />
• Cell carbon and biovolume methods for <strong>intercalibration</strong><br />
• UK and ROI are possibly looking to modify chl-a 90 %ile tool, cell counts and functional<br />
groups metrics to be applicable in transitional waters. NL and other countries are looking at<br />
chl-a in transitional waters as well. Turbidity/light will be another normalizing issue.<br />
• Risk of misclassification – share ideas.<br />
• Primary production – develop new, cheaper and more reliable methods.<br />
• Standardize size classes that phytoplankton taxa belong to. Start by country and construct a<br />
standard size class list at MS level.<br />
• A literature search needs to be carried out to find minimum and maximum size ranges for<br />
phytoplankton.<br />
• Indicator species for eutrophication – OSPAR list exists but the relation between<br />
eutrophication is not for all the species on the list. It is suggested we refine and develop a<br />
better list.<br />
• Diversity and Composition metric needs to be linked to nutrient enrichment and other<br />
pressures.<br />
• Rules for combining elements for classification need to be agreed (Possible output from CIS<br />
June Workshop in Paris).<br />
•<br />
Methods of chl a measurement need to be agreed/ intercalibrated<br />
169
3<br />
3.1<br />
170<br />
Discussion<br />
Comparability between GIGs<br />
Table 3.1.1: Summary of <strong>intercalibration</strong> topics per GIGs.<br />
NEA GIG MED GIG BAL GIG BLA GIG<br />
METRICS<br />
Chl α, Indicator<br />
Taxa, Taxa Cell<br />
Count<br />
Chl α Chl α Biomass<br />
N°. TYPES 8 3 8 1<br />
OPTION 2 2/3 2/3 2<br />
BOUNDARY<br />
SETTING<br />
PROCEDURE<br />
REFERENCE<br />
CONDITION<br />
OPEN ISSUES<br />
Experts, 90iles,<br />
H/G, G/M<br />
MS-specific, 90ile<br />
Improve doseresponse<br />
relationships<br />
Percentiles,<br />
H/G, G/M<br />
High status sites<br />
Missing metrics,<br />
species composition<br />
Percentiles,<br />
H/G, G/M<br />
Different<br />
approaches,<br />
empirical<br />
relationships<br />
between chl α and<br />
Secchi, mixed<br />
models, …<br />
Quantiles,<br />
All boundaries<br />
Historical data<br />
10th percentile<br />
Expert judgement<br />
… Missing metrics<br />
Metrics<br />
Intercalibration for the phytoplankton quality element has been successfully performed by all of the<br />
four Coastal <strong>Water</strong>s GIGs, using Chlorophyll-α as metric. Other metrics have been considered and<br />
tested by some GIGs (Indicator Taxa, Biomass).<br />
Types<br />
Not all types for each GIG have been covered, mainly because there were not shared by all MSs.<br />
Option<br />
Option 2 (MS agreed on the common metrics, created data sets relating MSs assessment methods<br />
to the common metrics, agreed on High/Good and Good/Moderate class boundaries and established<br />
relationships between common and national metrics) and a hybrid Option 2 and 3 (preliminary<br />
national boundaries were compared and harmonized with those obtained by using a common dataset<br />
for setting the final boundaries) approaches have been adopted for the <strong>intercalibration</strong>.<br />
Boundary Setting Procedure<br />
All Coastal <strong>Water</strong>s GIGs are providing results for the H/G and G/M boundaries (at least), applying<br />
similar approaches based on the expert supervised selection of appropriate percentiles as boundaries<br />
best fitting with evident changes in ecological status (90 th percentile is the favorite choice).<br />
Reference Condition<br />
There’s no clear common view among GIGs (but also among MSs) about how to fix Reference<br />
Conditions: in some cases the expert judgment has been the selected option, in some others a<br />
mixture of modeling, statistics on historical data and empirical relationships with other metrics (e.g.<br />
Secchi depth, see BALTIC GIG) has been applied.
3.2<br />
Open issues and need for further work<br />
The main task for the next <strong>intercalibration</strong> round is almost unanimously to include other metrics<br />
(blooms, species composition, toxic species, indicator species) in order to complete the analysis. It<br />
would be useful to focus on (strengthen) dose-response relationships in order to correlate pressures<br />
and ecological status.<br />
4<br />
References<br />
Agència Catalana de l’Aigua (ACA), 2005. Caracterisation of surface water bodies and analysis of the risk of<br />
failing the objectives of the water framework directive (2000/60/CE) in the catalonian basins of the Ebro, the<br />
Garona and the Senia, and revision of the internal basins of Catalonia. IMPRESS document. Departament de<br />
Medi Ambient i Habitatge. (http://mediambient.gencat.net/aca/ca//planificacio/directiva/impress.jsp).<br />
Álvarez–Salgado X. A., Rosón G., Pérez F. F. and Y. Pazos, 1993. Hydrographic variability off the Rías Baixas<br />
(NW Spain) during the upwelling season. Journal of Geophysical Research 98(C8): 14447-14455.<br />
Álvarez–Salgado X. A., Rosón G., Pérez F. F., Figueiras F. G. and Y. Pazos, 1996. Nitrogen cycling in an<br />
estuarine upwelling system, the Ría de Arousa (NW Spain). I. Short–time–scale patterns of hydrodynamic and<br />
biogeochemical circulation. Marine Ecology Progress Series 135: 259-273.<br />
Argyrou, M. 2005. Report of the National Monitoring Programme of Cyprus for the Year 2004. Programme<br />
for the Assessment and Control of Pollution in the Mediterranean Region (MEDPOL /UNEP). Department of<br />
Fisheries and Marine Research, pp. 32.<br />
Argyrou, M. 2006. Report of the National Monitoring Programme of Cyprus for the Year 2005. Programme<br />
for the Assessment and Control of Pollution in the Mediterranean Region (MEDPOL /UNEP). Department of<br />
Fisheries and Marine Research, pp. 41.<br />
Aristegui J. 1990. Distribution of chlorophyll “a” in the Canary Island waters. Boletin del Instituto Español de<br />
Oceanografia 6(2): 61-72.<br />
Arístegui J., Hernández–León S., Montero M.F. and M. Gómez, 2001. The seasonal planktonic cycle in coastal<br />
waters of the Canary Islands. Sci. Mar., 65 (Suppl. 1): 51-58.<br />
Artigas L. F. 1998. Seasonal variability in microplanktonic biomasses in the Gironde dilution plume (Bay of<br />
Biscay): Relative importance of bacteria. Oceanologica Acta 21: 563-580.<br />
Bald J. 2005. Proposal for the physico-chemical quality status assessment within the estuarine and coastal<br />
waters of the Basque Country (Northern Spain). PhD Thesis. University of Navarra (Spain) 262 p.<br />
Bald J. A., Borja I., Muxika J., Franco and V. Valencia 2005. Assessing reference conditions and physicochemical<br />
status according to the European <strong>Water</strong> <strong>Framework</strong> <strong>Directive</strong>: a case-study from the Basque Country<br />
(Northern Spain). Marine Pollution Bulletin, 50: 1508-1522.<br />
Barton E. D., Aristegui J., Tett P, Canton M., Garcia-Braun J., Hernandez-Leon S., Nykjaer L., Almeida C.,<br />
Almunia J., Ballesteros S., Basterretxea G., Escanez J., Garcia-Weill L., Hernandez-Guerra A., et al. 1998. The<br />
transition zone of the Canary Current upwelling region. Progress in Oceanography 41: 455-504.<br />
Berman, T., D.W. Townsend, S.Z. El-Sayed, G.C. Trees and Y. Azov. 1984. Optical transparency, chlorophyll<br />
and primary productivity in the Eastern Mediterranean near the Israeli Coast. Oceanol. Acta, 7: 367-372.<br />
Bianchi, T.S., A. Demetropoulos, M. Hadjichristophorou, M. Argyrou, M. Baskaran and C. Lambert. 1996.<br />
Plant Pigments as Biomarkers of Organic Matter Sources in Sediments and Coastal <strong>Water</strong>s of Cyprus (eastern<br />
Mediterranean). Estuarine, Coastal and Shelf Science, 42: 103-115.<br />
Bode A. and M. Varela, 1998. Primary production and phytoplankton in three Rias Altas (NW Spain): seasonal<br />
and spatial variability. Scientia Marina 62: 319-330.<br />
Bode A., Casas B,. Fernández E., Marañon E., Serret P. and M. Varela, 1996. Phytoplankton biomass and<br />
production in shelf waters off NW Spain: spatial and seasonal variability in relation to upwelling. Hydrobiologia<br />
341: 225-234.<br />
171
Borja A., Franco J., Valencia V., Bald J., Muxika I., Belzunce M. J., and O. Solaun. 2004. Implementation of the<br />
European water framework directive from the Basque country (northern Spain): a methodological approach.<br />
Marine Pollution Bulletin 48: 209-218.<br />
Botas J. A., Bode A., Fernández E. y R. Anadón. 1988. Descripción de una intrusión de agua de elevada<br />
salinidades el Cantábrico Central: distribución de los nutrientes inorgánicos y su relación con el fitoplancton.<br />
Investigación Pesquera 52: 561-573.<br />
Botas J. A., Fernández E. and R. Anadón. 1990. A persistent upwelling off the central Cantabrian coast (Bay of<br />
Biscay). Estuarine, Coastal & Shelf Science 30: 185-189.<br />
Boynton W.R., Kemp W. M. and C.W. Keefe, 1982. A comparative analysis of nutrients and other factors<br />
influencing estuarine phytoplankton production. In: Estuarine Comparisons. V.S. Kennedy (ed). Academic<br />
Press, New York, 69-90.<br />
Cadée, G.C. and J. Hegeman. 1991. Historical phytoplankton data of the Marsdiep. Hydrobiological Bulletin<br />
24: 111-188.<br />
Cermeño P., Marañón E., Pérez V., Serret P., Fernández E., and C. G. Castro, 2006. Phytoplankton size structure<br />
and primary production in a highly dynamic coastal ecosystem (Ría de Vigo NW-Spain): seasonal and shorttime<br />
scale variability. Estuarine Coastal and Shelf Science 67: 251-266.<br />
Diez I., Secilla A., Santolaria A., and Gorostiaga J. M. 2000. The north coast of Spain. In: Seas at the Millennium.<br />
An environmental evaluation. C. Sheppard (ed.). Pergamon, Amsterdam, Volume I, 135-150.<br />
European Environmental Agency. 2005. Source apportionment of nitrogen and phosphorus inputs into the<br />
aquatic environment. EEA Report No 7/2005.<br />
Figueiras F. G,. Niel F. X. and C. Mouriño, 1986. Nutrientes y oxígeno en la Ría de Pontevedra (NO de<br />
España). Investigación Pesquera 50: 97-115.<br />
Fraga F. 1976. Fotosíntesis en la Ría de Vigo. Investigación Pesquera 40 (1):151-167.<br />
Fraga F. 1981. Upwelling of the Galician coast. Northwest Spain. In: Coastal Upwelling. F. A. Richards (ed).<br />
American Geophysical Union, 176-182.<br />
Garcia C. M., Prieto L., Vargas M., Echevarria F., García-Lafuente J., Ruiz J., and J.P. Rubín. 2002.<br />
Hydrodynamics and the spatial distribution of plankton and TEP in the Gulf of Cadiz (SW Iberian Peninsula).<br />
Journal of Plankton Research 24: 817-833.<br />
Gil J. 2003. Changes in the pattern of water masses resulting from a poleward slope current in the Cantabrian<br />
Sea (Bay of Biscay). Estuarine, Coastal & Shelf Science 57: 1139-1149.<br />
Harding Jr., L. W. & E. S. Perry.1997. Long-term increase of phytoplankton biomass in Chesapeake Bay, 1950-<br />
1994. Mar. Ecol. Prog. Ser., 157: 39-52.<br />
Harris G. P. 1986. Phytoplankton Ecology: structure function and fluctuation. Chapman and Hall, London,<br />
384 pp.<br />
Ignatiades, l., Vounatsou, P., Karydis, M. (1992). A possible method for evaluating oligotrophy and eutrophication<br />
based on nutrient concentration scales. Mar. Poll. Bull., 24: 238-243.<br />
Karydis, Μ. (1999). Evaluation <strong>report</strong> on the eutrophication level in coastal greek areas. Univ. of Aegean,<br />
Mytilini, February 1999 (in greek).<br />
Krom, M.D., Kress, N., Brenner, S. Gordon, L.I. (1991). Phosphorus limitation of primary production in the<br />
eastern Mediterranean Sea. Limnol. Oceanogr., 36: 424-432.<br />
Krom, M.D., S. Brenner, N. Kress, A. Neori and L.I. Gordon. 1992. Nutrient dynamics and new production in<br />
a warm-core eddy from the Eastern Mediterranean Sea. Deep-Sea Research, 39: 467-480.<br />
Krom,D. M., N. Kress & S. Brenner. 1991. Phosphorus limitation of primary productivity in the eastern<br />
Mediterranean Sea. Limnol. Oceanogr., 36(3): 424-432.<br />
Lavin A., Valdes L., Sanchez F., Abaunza P., Forest A., Boucher J., Lazure P. and A. M. Jegou. 2006. The Bay<br />
of Biscay: The encountering of the ocean and the shelf (18 b, E). In: The Sea, Volume 14. A.R. Robinson &<br />
K.H. Brink (ed.). Harvard University Press, 933-1001.<br />
172
Lipej L., P. Mozetič, M. Orlando Bonaca, B. Mavrič, M. Šiško & N. Bettoso. 2006. Evaluation of the Ecological<br />
Status of Coastal <strong>Water</strong>s in accordance with the European <strong>Water</strong> <strong>Framework</strong> <strong>Directive</strong> (<strong>Water</strong> <strong>Framework</strong><br />
<strong>Directive</strong>, 2000/60/EC). Final national <strong>report</strong>. Marine Biology Station Piran, National Institute of Biology,<br />
October 2006, 180 pp. (in Slov.)<br />
Llope M. 2005. Variabilidad hidrográfica en un área costera del Mar Cantábrico. Modelado de plancton y<br />
efectos de cambio climático. Tesis Doctoral. Universidad de Oviedo. Ph D. dissertation.<br />
Lunven M., Guillaud J.F., Youénou A., Crassous M. P., Berric R., Le Gall E., Kérouel R., Labry C., and A.<br />
Aminot. 2005. Nutrient and phytoplankton distribution in the Loire River plume (Bay of Biscay, France)<br />
resolved by a new Fine Scale Sampler. Estuarine, Coastal & Shelf Science 65: 94-108.<br />
Margalef R. 1974. Ecología. Ediciones Omega, Barcelona, 951 pp.<br />
Margalef R., Durán M. and F. Sáiz. 1955. El fitoplancton en la Ría de Vigo de Enero de 1953 a Marzo de 1954.<br />
Investigación Pesquera 2: 85-129.<br />
Mason E., Coombs S., and P. B. Oliveira. 2005. An overview of the literature concerning the oceanography of<br />
the Eastern North Atlantic region. Relat. Cient. Téc. IPIMAR, Série digital (http://ipimar-iniap.ipimar.pt) nº<br />
33, 58 pp.<br />
Moncoiffe G., Álvarez–Salgado X. A., Figueiras F. G. and G. Savidge. 2000. Seasonal and short–time–scale<br />
dynamics of microplankton community production and respiration in an inshore upwelling system. Marine<br />
Ecology Progress Series 196: 111-126.<br />
Mozetič, P., J. Francé, M. Šiško & O. Bajt. 2005. Spatial and temporal patterns of phytoplankton assemblages<br />
in a shallow coastal sea (Gulf of Trieste). In: Wassmann, P. & B. Ćosović (eds.): Eutrophication in the coastal<br />
zone of the eastern Adriatic Sea. South-eastern Europe Programme Symposium. April 27-May 1, 2005, Hvar,<br />
Croatia.<br />
Nogueira E., Pérez F. F. and A. F. Ríos. 1997. Seasonal patterns and long–term trends in an estuarine upwelling<br />
ecosystem (Ría de Vigo NW Spain). Estuarine Coastal and Shelf Science 44: 285-300.<br />
OJEC (Official Journal of the European Communities). 2000. <strong>Directive</strong> 2000/60/EC of the European Parliament<br />
and of the Council. L327/1 - L327/72.<br />
Ojeda A. 2004. Biomasa fitoplanctónica y clorofila–a en las Islas Canarias occidentales (Mayo 1986).<br />
Universidad de Las Palmas de Gran Canaria. Biblioteca digital.<br />
Orive E., Franco J., Madariaga I., and M. Revilla. 2004. Bacterioplankton and phytoplankton communities.<br />
In: Oceanography and Marine Environment of the Basque Country. A. Borja and M. Collins (ed.). Elsevier<br />
Oceanography Series nº 70, Elsevier, Amsterdam, 367-393.<br />
OSPAR Commission. 2000. Quality Status Report 2000. Region IV- Bay of Biscay and Iberian coast. OSPAR<br />
Commission, London. 134 + xiii pp.<br />
OSPAR Commission. 2003. OSPAR Integrated Report 2003 on the Eutrophication Status of the OSPAR<br />
Maritime Area Based Upon the First Application of the Comprehensive Procedure.<br />
Pagou, K. (2000). Assessment of the trophic conditions in the Inner Thermaikos Gulf. Technical Report for the<br />
Ministry of Environment, Planning and Public Works, NCMR, Athens, December 2000, 11pp.<br />
Prego R. 1994. Nitrogen interchanges generated by biogeochemical processes in a Galician Ría. Marine<br />
Chemistry 45: 167-176.<br />
Prego R. and F. Fraga, 1992. A simple model to calculate the residual flows in a Spanish Ria. Hydrographic<br />
consequences in the Ría of Vigo. Estuarine Coastal and Shelf Science 34: 603-615.<br />
Prego R., Barciela M. C. and M. Varela, 1999. Nutrient dynamics in the Galician coastal area (Northwestern<br />
Iberian Peninsula): do the Rias Bajas receive more nutrient salts than the Rias Altas? Continental Self Researc<br />
19: 317-334.<br />
Rousseau, V., Mathot, S. and C. Lancelot. 1990. Calculating carbon biomass of Phaeocystis sp. from microscopic<br />
observations. Marine Biology 107: 305-314.<br />
Siokou-Frangou, I. & Pagou, K. (2000). Assessment of the trophic conditions and ecological status in the<br />
Inner Saronikos Gulf. Technical Report for the Ministry of Environment, Planning and Public Works, NCMR,<br />
Athens, March 2000,43pp. (in greek and english edition).<br />
173
Smayda T. J., 1980. Phytoplankton species succession. In: The physiological ecology of phytoplankton.<br />
I. Morris (ed.). Blackwell Science Publications, Oxford, 489 pp.<br />
Uthermöhl H., 1958. Zur vervollkommnung der quantitative phytoplankton methodik. Mitteilungen<br />
Internationale Vereinigung fuer theoretische und angewandtelimnologie. 91-38.<br />
Valencia V., Franco J., Borja A., and A. Fontán. 2004. Hydrography of the Southeastern Bay of Biscay. In:<br />
Oceanography and Marine Environment of the Basque Country. A. Borja and M. Collins (ed.). Elsevier<br />
Oceanography Series nº 70, Elsevier, Amsterdam, 159-194.<br />
Varela M., Prego R., Belzunce M. J. and F. M. Salas. 2001. Inshore–offshore differences in seasonal variations<br />
of phytoplankton assemblages: the case of a Galician Ría Alta (Ría de A Coruña) and its adjacent shelf (NW of<br />
Spain). Continental Shelf Research 21: 1815-1838.<br />
Vergara et al. 2005. (Eds. Vergara Martín, J.M., Haroun Tabraue, R. y González Henríquez, N.) Evaluación<br />
de Impacto Ambiental de Acuicultura en Jaulas en Canarias. Oceanográfica, Telde. ISBN: 84-609-4073-X.<br />
Depósito Legal: GC 422-2005.<br />
Vives F. and F. Fraga. 1961. Producción básica en la Ría de Vigo. Investigación Pesquera 19: 129-137.<br />
Vollenweider,R. A., A. Rinaldi & G. Montanari. 1992. Eutrophication, structure and dynamics of a marine<br />
coastal system: results of ten-year monitoring along the Emilia-Romagna coast (Northwest Adriatic Sea). Sci.<br />
Tot. Environ. [Vollenweider, R. A., R. Marchetti & R. Viviani (eds.)],. Suppl.: 63-106.<br />
WFD CIS Guidance Document No. 14: Guidance on the <strong>intercalibration</strong> process 2004-2006<br />
Wiltshire, K. H. & C. D. Durselen. 2004. Revision and quality analyses of the Helgoland Reede long-term<br />
phytoplankton data archive. Helogol. Mar. Res., 58(4): 252-268.<br />
5<br />
174<br />
Annexes<br />
Annexes can be downloaded from the following address:<br />
http://circa.europa.eu/Public/irc/jrc/jrc_eewai/library?l=/<strong>intercalibration</strong>_2&vm=detailed&sb=Title<br />
Section 3 – Phytoplankton – Overview of Annexes<br />
A – Baltic GIG<br />
Annex 3.1: Development of chlorophyll a reference conditions in Danish coastal waters<br />
Annex 3.2: Boundary setting for chlorophyll a in Danish coastal waters<br />
Annex 3.3: Chlorophyll a reference values and boundary setting in Estonian coastal waters<br />
Annex 3.4: Chlorophyll a reference values and boundary setting in Finnish coastal waters<br />
Annex 3.5: Chlorophyll a reference values and boundary setting in Polish coastal waters<br />
Annex 3.6: Chlorophyll a reference values and boundary setting in Swedish coastal waters<br />
Annex 3.7: Chlorophyll a reference values and boundary setting in German coastal waters<br />
B – Mediterranean GIG<br />
Annex 3.8 – National methods included in the <strong>intercalibration</strong>
Section 4 – Macroalgae<br />
1<br />
Introduction<br />
Two of the four coastal water GIGs have been able to produce results for the macroalgae quality<br />
element (Mediterranean and North-East Atlantic). Each GIG has several typologies that are found<br />
in these waters. Not all countries within each GIG have all the types within its borders. Information<br />
about the types and countries with each type in each GIG is described in the sections below.<br />
Both GIGs have chosen Option 2 in this phase of the <strong>intercalibration</strong> process. Member States have<br />
developed metrics as part of their own classification schemes. Selected metrics have been chosen by<br />
each GIG for assessment and agreement of boundaries in this phase of the <strong>intercalibration</strong> process.<br />
At this stage not all the metrics that make up Member States’ schemes can be intercalibrated, so it is<br />
not possible to produce EQRs for the whole quality element. Boundaries have been agreed for the<br />
selected metrics.<br />
2<br />
2.1<br />
2.1.1<br />
Methodology and results<br />
Mediterranean GIG<br />
Intercalibration Approach<br />
Two classification methods were developed by two countries: EEI by Greece and CARLIT by Spain.<br />
Intercalibration Option2 (ECOSTAT WG Guidance) was adopted. The InterCalibration Common<br />
Metric (ICCM) used was the method “BENTHOS” developed by Spain.<br />
Six different Mediterranean countries participated in the subgroup of macroalgae:<br />
• Cyprus<br />
• France<br />
• Greece<br />
• Italy<br />
• Slovenia<br />
• Spain<br />
Macroalgae <strong>intercalibration</strong> has been carried out between Spain, Greece, Slovenia. Other countries<br />
that could not provide data for the IC exercise or do not have data yet (Italy, France and Malta) or<br />
provided data but shortly before the finalization of the <strong>report</strong> (Cyprus), approved the results.<br />
Typology<br />
During the early stages of the CIS the Mediterranean working group agreed in using only 2<br />
parameters to distinguish water types, namely substrate composition and depth. Most of other<br />
geomorphological parameters, described in <strong>Directive</strong> Annex II (1.2.4), were not relevant (i.e. tidal<br />
regime) to distinguish different water types in relation to their ecological “significance” for the<br />
175
Mediterranean Sea. Four main Types were then defined (Table 2.1.1). However, throughout the CIS,<br />
following data analyses for the different BQEs, these types did not actually proved to be relevant for<br />
the IC exercise, for some BQEs, as Mediterranean ecosystem is quite homogeneous in comparison<br />
to Northern Seas (some ecological differences do exist but within the Mediterranean scale).<br />
For Macroalgae Intercalibration the methods used are applied to macroalgal communities (species<br />
composition and abundance) of the upper infralittoral zone (3.5 to 0.2 m depth) in rocky coasts,<br />
with no types distinction.<br />
Table 2.1.1: Main water body types of coastal waters within the Mediterranean Sea.<br />
Type Name of Type Substratum 1 Depth 2<br />
CW - M1 Rocky shallow coast rocky shallow<br />
CW - M2 Rocky deep coast rocky deep<br />
CW - M3 Sedimentary shallow coast sedimentary shallow<br />
CW - M4 Sedimentary deep coast sedimentary deep<br />
1) Since in many cases different seabed substrata will occur within one water body type, the dominant substratum<br />
should be taken under consideration.<br />
2) Depth division is based on 40 m. depth, at 1 mile distance from the coastline.<br />
2.1.2 National methods that were intercalibrated<br />
The methods intercalibrated were: EEI and CARLIT. EEI was elaborated by Greece, while CARLIT<br />
by Spain. Another method, BENTHOS, that was adopted as Intercalibration Common Metric<br />
(ICCM), has also been developed by Spain in parallel with CARLIT. All these methods share a<br />
common view for reference conditions.<br />
The other Mediterranean countries that participated in the Macroalgae subgroup have decided<br />
which methods they already applied or are on the way to apply on their country data on macroalgae<br />
(Table 2.1.2).<br />
Table 2.1.2: Countries decisions for macroalgal methodologies.<br />
QE 3: Macroalgae Assessment Method Status<br />
Cyprus EEI Officially accepted<br />
France CARLIT Officially accepted<br />
Greece EEI Officially accepted<br />
Italy CARLIT Under consideration<br />
Slovenia EEI Officially accepted<br />
Spain CARLIT, BENTHOS Officially accepted<br />
176
Metric: Ecological Evaluation Index (EEI)<br />
Ecological Evaluation Index (EEI) was designed to estimate the ecological status classes (ESC) of<br />
transitional and coastal waters using benthic macrophyte communities as bioindicator 26 (Orfanidis et<br />
al., 2001, 2003; Panayotidis et al., 2004; Orfanidis, 2007). It is based on the well-known pattern that<br />
anthropogenic stress, e.g. eutrophication, heavy metal pollution, shifts the ecosystem from pristine<br />
state, where late-successional species is dominant, to degraded state, where opportunistic species<br />
through rapid growth and recruitment is dominant. This pattern can be explained from the species<br />
competition abilities under abundant and limiting nutrient conditions and is in accordance to r- and<br />
K-selection theory.<br />
In order to evaluate the spatial scale-dependent ESC of the studied coast (EEI EGR ), the area-weighted<br />
value was calculated. For this purpose, the score of each site was multiplied by the percentage of the<br />
coast area for which is considered to be representative and the products were summed. EEI values<br />
higher than 0.5 indicate sustainable ecosystems of good or high ESC, whereas EEI values lower<br />
than 0.5 indicate that the ecosystems should be restored to a higher ESC (Table 2.1.3). These values<br />
should be regarded as provisional that have to be further verified in the future.<br />
Figure 2.1.1: Ecological State Groups (ESG) I, II of marine benthic macrophytes (macrophyte graphs are based on<br />
diverse sources).<br />
26 A readily measured component or metric of the biota that are used to provide long-term ecologically relevant<br />
information about the state and trends of ecosystem. Such an approach effectively distinguishes responses of<br />
human impact from natural variability, when supported by predictive modelling and sound ecological theory.<br />
177
Table 2.1.3: Classification scheme of transitional and coastal waters based on the Ecological Evaluation Index (EEI).<br />
Metrics: BENTHOS, CARLIT<br />
Both methodologies have been published recently and described in detail. The references of the<br />
papers where methodologies have been described are the following:<br />
BENTHOS: Pinedo, S. García, M., Satta, M.P., de Torres, M. and Ballesteros, E., 2007. Rockyshore<br />
communities as indicators of water quality: A case study in the Northwestern Mediterranean.<br />
Marine Pollution Bulletin. 55, 126-135.<br />
CARLIT: Ballesteros, E., Torras, X., Pinedo, S., García, M., Mangialajo and L., de Torres, M.,<br />
2007. A new methodology based on littoral community cartography dominated by macroalgae for<br />
the implementation of the European <strong>Water</strong> <strong>Framework</strong> <strong>Directive</strong>. Marine Pollution Bulletin. 55,<br />
172-180.<br />
2.1.3 Reference conditions and class boundary setting<br />
Reference condition is the expression of high quality structure and function of aquatic ecosystems,<br />
that should have not suffered any impact on their natural state because of human activities and<br />
there is none or only very minor evidence of disturbance on each of the general physico-chemical,<br />
hydromorphological and biological quality elements. Reference sites have been identified according<br />
to the low pressures and impacts they receive in accordance with Annex V of WFD. In all methods<br />
(EEI, BENTHOS, CARLIT) the reference sites are real sites (existing) and this allows the<br />
application of the tested methodologies in these places.<br />
Ecological Evaluation Index (EEI)<br />
The reference conditions have to be presented by values of relevant biological quality elements<br />
indicating high ecological status. For the description of macroalgal community of the rocky upper<br />
infralittoral zone reference conditions in Greek coastal waters 62 samples from 26 putatively<br />
pristine Aegean sites (Figure 2.1.2) dominated by Cystoseira cf. crinita community as part of the<br />
Hellenic “NATURA 2000” data-base (see Panayotidis et al., 2001) in combination with the biotic<br />
index Ecological Evaluation-EEI Index (Orfanidis et al., 2001; 2003) were used. The aim was (1)<br />
to develop an objective and statistically valid “virtual” list of the most common algal species in the<br />
Aegean under undisturbed conditions, and (2) to test the conceptual model and the EEI recently<br />
developed by Orfanidis et al. (2001, 2003) for the implementation of <strong>Water</strong> <strong>Framework</strong> <strong>Directive</strong><br />
(2000/60/EC) in Greek coasts.<br />
In total 113 taxa (73 Rhodophyceae, 25 Phaeophyceae, 15 Chlorophyceae) were identified in<br />
Cystoseira cf. crinita community of the Aegean Sea (Panayotidis et al., 2007). Nine (9) major taxa<br />
178
(except C. cf. crinita) contributed cumulatively by 90 % in the community: Haliptilon virgatum,<br />
Cystoseira compressa, Jania rubens, Padina pavonica, Herposiphonia secunda, Corallina<br />
elongata, Cladophora spp., Sphacelaria cirrosa and Titanoderma cystoseirae. Moreover, 34 taxa<br />
contributed cumulatively by 99 %. Under-storey layer considerably dominated to the community<br />
with most common representatives the red coralligenous algae Haliptilon virgatum, Corallina<br />
elongata and Jania rubens, and the brown alga Padina pavonica. It was followed by C. crinita<br />
epiphytes distinguished in: 1) filamentous green (Cladophora spp.), brown (Sphacelaria cirrosa)<br />
and red (Herposiphonia secunda) algae, and 2) in encrusting red algae (Titanoderma cystoseirae<br />
and Hydrolithon spp.). Cystoseira compressa contributed significantly (23.08 %) to C. crinita<br />
community indicating that these species share common habitat resources in the Aegean Sea.<br />
Within the common Cystoseira cf. crinita taxa 21 (62 %) belong to opportunistic ESG II, whereas<br />
13 (38 %) taxa belong to late-successional ESG I (Table 2.1.1). By contrast the ESG I taxa<br />
dominated quantitatively (111 %; including C. cf. crinita) the ESG II (21.9 %) taxa in the C. cf.<br />
crinita community (Figure 2.1.5). This result did not change when naturally eutrophic North Aegean<br />
sites (ESG I=128 %, ESG II=21 %) were differentiated form naturally oligotrophic sites of South<br />
Aegean (ESG I=101 %, ESG II=22 %). This result is in accordance both: a) to the conceptual model<br />
of Orfanidis et al. (2001, 2003) that “in less anthropogenic stressed coastal areas (pristine) the latesuccessional<br />
species dominate” and b) to the basic assumption of the EEI that ESG I, II average<br />
contribution in undisturbed areas is higher than 60 % and less than 30 %, respectively. Data from<br />
tentatively pristine sites of Slovenian (Orlando-Bonaca et al., 2008) and Cyprus (pers. comm. M.<br />
Argyrou) coasts as well as from less anthropogenic impacted sites of Catalan coasts (Arévalo et al.,<br />
2007) have also verified the above hypotheses.<br />
Since macroalgae and especially long lived genera like Fucales also follow long-term periodicity,<br />
it is important to notice that their absence from a site should be regarded as indicative of<br />
environmental degradation only if it is correlated with key abiotic parameters, e.g. water and<br />
sediment nutrient concentrations, light attenuation.<br />
Figure 2.1.2: Map of putatively<br />
pristine sites in the Aegean Sea,<br />
Greece.<br />
179
180<br />
Coverage (%)<br />
150<br />
120<br />
90<br />
60<br />
30<br />
Figure 2.1.3: Average coverage ( %) of ESG I, II in undisturbed Aegean Sites.<br />
BENTHOS, CARLIT<br />
0<br />
Aegean Sea<br />
(n=62)<br />
North Aegean Sea<br />
(n=23)<br />
South Aegean Sea<br />
(n=39)<br />
ESG I ESG II ESG I ESG II ESG I ESG II<br />
Mean<br />
Mean±SE<br />
Mean±1,96*SE<br />
Based on expert judgment and on historical data and information we used as RC for BENTHOS<br />
and CARLIT existing undisturbed sites or with only very minor disturbance. A problem in deriving<br />
reference conditions in the Catalan coast sites is the absence of unimpacted areas. Therefore, we<br />
have chosen three reference zones outside Catalonia: Façade maritime du Parc Naturel Régional<br />
de Corse (France), Parc Natural de Ses Salines (Balearic Islands, Spain) and Reserva Marina del<br />
Nord de Menorca (Balearic Islands, Spain) (Figure 2.1.3). All these places have in common a<br />
very low human influence with physico-chemical and hydrogeomorphological conditions similar<br />
to the Catalan coast. We have also historical data for benthic communities in the Catalan coast<br />
before 1980’s (Gibert, 1918; Seoane-Camba, 1975; Polo, 1978) and in the adjacent Albères coast<br />
(Sauvageau, 1912; Feldmann, 1937; Gros, 1978; Thibaut et al., 2005) showing that previous littoral<br />
vegetation in the Catalan coast was very similar to that currently observed in the selected reference<br />
areas.<br />
These sites, in rocky shores exposed to high irradiance levels, are characterized by dense<br />
communities of several Cystoseira species: C. mediterranea/amentacea var. stricta, C. crinita, C.<br />
brachycarpa var. balearica, C. foeniculacea/barbata/spinosa var. tenuior/compressa var. pustulata.<br />
Alternatively, in shadow zones (steep vertical cliffs, high hydrodynamic conditions) Lithophyllum<br />
byssoides develops, forming important organogenic structures (trottoir).<br />
In order to obtain reference conditions’ data for Benthos and Carlit methods we have sampled using<br />
both methodologies at the same period of time, from May to June (2001). For Benthos, reference<br />
conditions were assessed by sampling 11 stations situated within reference sites (4 in Corsica, 4 in<br />
Menorca and 3 in Freus) and to obtain CARLIT’s reference conditions the whole coastline in these<br />
three reference sites was cartographied.
Figure 2.1.3: Location of study area and sites (Northwestern Mediterranean Sea). Reference sites are included in the map.<br />
Common biological criteria of EEI, BENTHOS, CARLIT approaches for reference<br />
conditions<br />
EEI, BENTHOS, CARLIT approaches share common views for reference conditions within<br />
Mediterranean Sea summarized as follows.<br />
1.<br />
2.<br />
Macroalgal communities of high diversity should be dominated quantitatively by brown<br />
algae mainly of the order Fucales in high irradiance sites and red algal Corallinales in<br />
vertical cliffs.<br />
Dense well-developed macroalgal communities thriving in the upper infralittoral zone with<br />
most characteristic species belonging to the genera Cystoseira, Sargassum, Lithophyllum,<br />
Peyssonnelia, Corallina and Padina. Other common species belong to the genera<br />
Halopteris, Stypocaulon, Dictyota, Dictyopteris, Laurencia, Cladophora and Jania.<br />
3. In shadow zones (exposed steep vertical cliffs) Lithophyllum byssoides develops, forming<br />
important organogenic structures (trottoir). In marine caves with scarce light conditions a<br />
sciaphilic vegetation of red and green algae dominant.<br />
4.<br />
Spatio-temporal variability of the community’s composition and abundance affected by hard<br />
substrata availability, intense and frequency of natural disturbances, e.g. hydrodynamism,<br />
grazing, by seasonal cycle of light period and intense, and by limiting factors like nutrients.<br />
Boundary setting (national level)<br />
Boundaries are set according to biotic index and/or combined with the results of or multivariate<br />
analysis. No statistical analysis exclusively to set boundaries. No discontinuities. Continuum of<br />
possibilities with gradual disappearance/appearance of different indicator species.<br />
Ecological Evaluation Index (EEI)<br />
The conceptual model proposed by Orfanidis et al. (2001, 2003) used the functional differences of<br />
benthic macrophytes related to their life-cycle strategy (r-, K-selected species) as a tool to evaluate<br />
the ecological status of transitional and coastal waters (Figure 2.1.4). This scheme evidences the<br />
181
existence of a gradient between two states, which represent the pristine (high-good) and the degraded<br />
(low-bad) conditions. The dominance of the late-successional species of the genera Cystoseira form<br />
communities indicative of pristine state, which is characterized, for example, by low nutrient and<br />
clear water conditions, whilst the dominance of opportunistic seaweeds as Ulva and Gracilaria,<br />
and Cyanobacteria form communities indicative of degraded state, which is characterized by<br />
high nutrients, heavy metals and turbid conditions. The coexistence of the late-successional like<br />
Cystoseira, Sargassum, Corallina species with opportunistic like Ulva, Cladophora, Gracilaria,<br />
Cyanobacteria species form communities that are indicative intermediate (moderate) conditions.<br />
In this successional model the ecological role of Corallina elongata and its community should be<br />
discussed in more details. Corallina is a slow growing calcified perennial red alga (ESG I) can be<br />
found in the infralittoral zone of most rocky Mediterranean coasts subjected to different kinds of<br />
natural, e.g. grazing, low irradiance, hydrodynamism or anthropogenic disturbance, e.g. pollution.<br />
Therefore, C. elongata alone could not be relevant metric of ecosystem state and trends. For EEI,<br />
which investigates anthropogenic stress at community level, C. elongata community is regarded as<br />
indicative of both high to good or of moderate to bad conditions depending on high quantitative<br />
contribution of ESG I or ESG II species, respectively. To estimate accurately community’s<br />
contribution of small sized and delicately constructed ESG II species being very sensitive to adverse<br />
hydrological conditions which predominate in open coasts, especially during the winter season,<br />
seasonal and destructive sampling protocols are needed.<br />
High status (10 ≥ EEI > 8). The composition of macroalgal taxa is consistent with undisturbed<br />
conditions. There are no detectable changes in macroalgal cover due to anthropogenic activities.<br />
This condition corresponds with unpolluted sites, where the late successionals taxa, especially<br />
species of Cystoseira genus, represented by the ecological group ESG I account for more than 60<br />
% of the mean macroalgae abundance-coverage and the early successionals taxa represented by the<br />
groups ESG II account for 0-30 % of the macroalgae coverage.<br />
Good status (8 ≥ EEI > 6). There are slight changes in the composition and abundance of macroalgal<br />
taxa compared to the type-specific communities. Such changes do not indicate any accelerated<br />
growth of phytobenthos or higher forms of plant life resulting in undesirable disturbance to the<br />
balance of organisms present in the water body or to the physicochemical quality of the water. This<br />
condition corresponds with slightly polluted sites (unbalanced). At the good status as is indicated<br />
by the EEI, the ESG I group may range from 30 to 60 % while the ESG II from 0 to 30 % of the<br />
macroalgae coverage, or the combination may thus that ESG I accounts for over 60 % and ESG II<br />
between 30 and 60 % of the total macroalgae coverage.<br />
Moderate status (6 ≥ EEI > 4). The composition of macroalgae taxa differs moderately from typespecific<br />
conditions and is significantly more distorted from a good quality. Moderate changes in<br />
the coverage macroalgal disturbance are evident and may be such as to result in an undesirable<br />
disturbance to the balance of organisms present in the water body. This condition corresponds with<br />
moderate polluted sites. At the moderate status as is indicated by the EEI, the two groups may<br />
equally share the macroalgae coverage accounting for equally low, moderate or high percentages.<br />
Poor status (4 ≥ EEI > 2). At the poor status as is indicated by the EEI, the late successional group<br />
ESG I may account for 0-30 % and the early successional group ESG II for 30-60 % or the late<br />
successional group may represent a coverage among 30 % and 60 % while the early successional<br />
group may account for over 60 %.<br />
Bad status (EEI=2): At the bad status the sensitive group ESG I accounts for 0-30 % and the early<br />
successional group ESG II represents over 60 % of the total macroalgae coverage.<br />
EEI application was also tested across nutrient gradients of different Mediterranean coasts of<br />
Greece (Orfanidis et al., 2001; Panayotidis et al., 2004; Orfanidis and Panayotidis, 2005) and<br />
Spain (Arévalo et al., 2007; see also Orfanidis, 2007) with available consistent seasonal data<br />
(Figure 2.1.5). The result seems to be very promising indicating clear gradients between degraded<br />
182
Figure 2.1.4: Conceptual model of two alternative stable states of macroalgal communities<br />
across an ecological status gradient in coastal waters. A conventional (A) and dynamic (B)<br />
view of successional changes.<br />
and pristine sites. A disagreement appeared in Site 2 of Tossa de Mar coasts located very close<br />
to sewage outfall (Arévalo et al., 2007). In that site ESG I species, mainly Corallina elongata,<br />
dominated (ESG I=251 % mean annual coverage) to ESG II (12.2 %) species indicating a high<br />
ESC. The very low coverage of ESG II species of green and red algae, as well as the absence of<br />
Cyanobacteria (X. Torras correspondence) seems to be an interesting case that needs further<br />
consideration. Figure 2.1.6 shows an exponential relationship between total dissolved inorganic<br />
nitrogen (TDIN) and phosphorus mean concentrations and EEI values.<br />
CARLIT/BENTHOS<br />
Species of the genus Cystoseira (Fucales, Cystoseiraceae) dominate Mediterranean upper<br />
infralittoral communities (Feldmann, 1937; Boudouresque, 1971) and are particularly sensitive to<br />
any natural (Gros, 1978; Verlaque, 1987) or anthropogenic stress (Bellan-Santini, 1966; Ballesteros<br />
et al., 1984; Hoffmann et al., 1988; Soltan et al., 2001) and, therefore, have experienced profound<br />
changes and decline over extensive areas (Thibaut et al., 2005). The highly structured and productive<br />
Cystoseira mediterranea/stricta/crinita communities are observed in hydrodynamic environments<br />
and non-polluted waters along the Northwestern Mediterranean coasts (Boudouresque, 1969;<br />
Ballesteros, 1988). Increasing concentrations of organic matter and nutrients drives Cystoseiradominated<br />
communities to be replaced by the red alga Corallina elongata (Bellan-Santini, 1965,<br />
1968; Ballesteros et al., 1984; Giaccone, 1993) and the mussel Mytilus galloprovincialis (Bellan-<br />
Santini, 1965, 1968; Bellan and Bellan-Santini, 1972). Green ephemeral algae begin to dominate<br />
in highly disturbed environments and near freshwater discharges: Ulva (Golubic, 1970; Bellan<br />
and Bellan-Santini, 1972; Rodríguez-Prieto and Polo, 1996), Cladophora (Belsher, 1977) or<br />
Enteromorpha (Ballesteros et al., 1984; Kadari- Meziane, 1994). Finally, the dominance of bluegreen<br />
algae (Oscillatoria, Lyngbya, Phormidium) indicates very degraded environments (Golubic,<br />
1970; Littler and Murray, 1975; Murray and Littler, 1978).<br />
183
Based on these ecological changes along pollution gradients the boundary between High and Good<br />
conditions when Cystoseira communities occur in patches and do not make extensive-continuous<br />
assemblages and the Lithophyllum byssoides belt displays symptoms of degradation. Samples<br />
of Cystoseira assemblages indicate lower biomass of Cystoseira spp. and the substitution of the<br />
sciaphilic species inhabiting the underlayer dense Cystoseira assemblages by Corallina elongata or<br />
Mytilus galloprovincialis. The disappearance of these sensitive species and its replacement by stress<br />
tolerant species such as C. elongata and M. galloprovincialis defines the boundary between Good<br />
and Moderate situations.<br />
In Italy, Carlit method has been tested at Regional scale, in the Ligurian Sea, applying it in a<br />
moderate urban gradient (figure 2.1.7) and in four Marine Protected Areas (MPAs), proposed as<br />
hypothetical reference sites at a regional scale (Mangialajo et al., 2007). This study shows that Carlit<br />
index is suitable to detect different kinds of anthropogenic pressures obtaining a good correlation<br />
with different water column variables.<br />
184<br />
Figure 2.1.5: Implementation of<br />
EEI across water quality gradients<br />
in different Mediterranean coastal<br />
waters: Kavala and Maliakos Gulfs<br />
(Orfanidis and Panayotidis 2005),<br />
Saronikos Gulf (Panayotidis et al.,<br />
2004), Tossa de Mar coasts (Arévalo<br />
et al., 2007).
N-NO 3 ( µ mol/l)<br />
35<br />
30<br />
25<br />
20<br />
15<br />
10<br />
5<br />
0<br />
TDIN=37.07*exp (-3.2*EEI) , r=-0.9, p
2.1.4<br />
186<br />
Intercalibration<br />
Material & Methods<br />
Data sampled along Greek (Figure 2.1.8), Catalan (Figure 2.1.9), and Slovenian locations were<br />
exchanged for <strong>intercalibration</strong>.<br />
Data from Greek coasts were sampled from 11 sites (96 samples in total): Saronikos (6 sites, 6<br />
sampling periods, 36 samples in total) and Maliakos (5 sites, 4 sampling periods, 60 samples in total)<br />
Gulfs. Fifty one sites (1 sampling period, 151 samples in total) were sampled along the Slovenian<br />
coasts (Lipej et al., 2006). All samples were destructive (1 to 3 random sample from a permanent<br />
site-square 5 x 5 m per sampling period) on a quadrate 20cm x 20cm, which is considered to be the<br />
minimal sampling area in the case of the Mediterranean infralittoral communities. In the laboratory<br />
each sample was sorted carefully and the surface covered by each species in vertical projection<br />
was quantified as % of cover (4 cm 2 = 1 % sampling surface). The total coverage usually exceeded<br />
100 % due to the presence of different layers in the vegetation (canopy, under storey layer, crusts<br />
and epiphytes). A nominal coverage value (0.1 %) was allocated to species showing insignificant<br />
abundance. Taxonomically difficult taxa were consistently sub summarized to genus level as spp.<br />
Data from Spain coasts were sampled from 48 sites (49 samples in total) Tossa-St. Feliu coast<br />
(6 sites, High-Good <strong>Water</strong> Body) and Hospitalet-Ametlla coast (7 sites, Good-Moderate WB).<br />
Furthermore, 36 extra sites from different Catalan places with Moderate to Bad ES were included<br />
in the <strong>intercalibration</strong> exercise (Figure 2.1.9). The samples were collected in springtime in the upper<br />
Figure 2.1.8: Map of sampling sites of Maliakos and<br />
Saronikos Gulfs. Colours correspond to Ecological Status<br />
Classes in accordance to EEI.
!<br />
!<br />
!<br />
!<br />
!<br />
!<br />
! ! !<br />
!<br />
!<br />
!<br />
!<br />
!<br />
!<br />
!<br />
!<br />
!<br />
!<br />
Figure 2.1.9: Map of Catalonia sampling sites. Colours correspond to Ecological Status<br />
Classes in accordance to Benthos methodology.<br />
!<br />
High-Good Intercalibration site<br />
sublittoral zone on sub-horizontal rocky shores facing east, south or west. For each sample, the whole<br />
community was collected from a 15 x 15 cm surface, using a hammer and a chisel. This surface is<br />
large enough to quantitatively represent the littoral communities in the Northwestern Mediterranean<br />
(Coppejans, 1980; Verlaque, 1987; Ballesteros, 1992). Samples were preserved in formalin: seawater<br />
at 4 % and were subsequently sorted in the laboratory. Algae and invertebrates were identified<br />
to species level and quantified in terms of coverage (horizontal surface; Ballesteros, 1992).<br />
2.1.5 Results of the comparison<br />
EEI and BENTHOS were compared on 62 sites in Greece (11 sites) and Slovenia (51 sites), while<br />
BENTHOS and CARLIT on 48 sites in Spain.<br />
The relation between variable EQR-EEI and variable EQR-ICM (Benthos) is described by a linear<br />
equation:<br />
(1) EQR-ICM = 0.594 EQR-EEI + 0.3425, coefficient of determination R² = 0.85 (Figure 2.1.10).<br />
The relation between variable EQR-ICM and variable EQR-CARLIT is also described by a linear<br />
equation.<br />
(2) EQR-ICM = 0.8604 EQR-CARLIT + 0.0709, coefficient of determination R ² = 0.77<br />
(Figure 2.1.11).<br />
!<br />
Good-Moderate Intercalibration site<br />
!<br />
!<br />
!<br />
!<br />
!<br />
!<br />
!<br />
!<br />
!<br />
! !<br />
!<br />
! !<br />
!! !<br />
!<br />
!<br />
187
EQR-ICM<br />
EQR-ICM<br />
y = 0,8604x + 0,0709<br />
R 2 0,5<br />
1<br />
0,4<br />
0,9<br />
0,3<br />
0,8<br />
0,2<br />
0,7<br />
0,1<br />
0,6<br />
0<br />
0,5<br />
= 0,7739<br />
0,4 0 0,2 0,4 0,6 0,8 1<br />
0,3<br />
EQR -CARLIT<br />
Figure 0,22.1.11:<br />
Relation between EQR-ICM and EQR-CARLIT.<br />
EQR-ICM<br />
From the equations (1) and (2) we calculated new values of class boundaries while replacing in the<br />
0 0,2 0,4 0,6 0,8 1<br />
equation (1) EQR-EEI by the boundary values of EQR defined for method EEI (ICM-boundaries<br />
EQR -CARLIT<br />
EEI) and the same for the boundary values of EQR defined for CARLIT (ICM-boundaries CARLIT)<br />
by using the equation (2) (Tables 4 and 5). CARLIT and BENTHOS (ICM) have the same values of<br />
class boundaries.<br />
188<br />
1<br />
0,4<br />
0,8<br />
0,2<br />
0,6<br />
0<br />
0,4<br />
0,2<br />
0,1<br />
0<br />
0<br />
y = 0,594x + 0,3425<br />
R 2 = 0,8458<br />
0 0,2 0,4 0,6 0,8 1<br />
Figure 2.1.10: Relation between EQR-ICM and EQR-EEI.<br />
EQR-ICM<br />
0,8<br />
0,6<br />
0,9<br />
0,8<br />
0,7<br />
0,6<br />
1<br />
R 2 = 0,8458<br />
0 0,2 0,4 0,6 0,8 1<br />
y = 0,8604x + 0,0709<br />
R 2 = 0,7739<br />
EQR-EEI<br />
EQR-EEI<br />
Table 2.1.4: EQR of the class boundaries used for methods EEI and CARLIT.<br />
Boundaries EEI-Boundaries EQR<br />
CARLIT-Boundaries<br />
EQR<br />
H/G 0.75 0.75<br />
G/M 0.50 0.60
For each class boundary the new mean values of class boundaries between ICM-boundaries<br />
CARLIT and ICM-boundaries EEI were calculated as well as their acceptable range (average ±<br />
0.05; Table 5), defined as comparability acceptable range by the ECOSTAT group.<br />
Table 2.1.5: New EQR of the class boundaries calculated as mean values and their acceptable range (average + 0,05).<br />
Boundaries<br />
ICM-boundaries<br />
(CARLIT)<br />
ICM-boundaries (EEI) Average Acceptable range (average ± 0,05)<br />
H/G 0.72 0.79 0.75 0.70 - 0.80<br />
G/M 0.59 0.64 0.61 0.56 - 0.66<br />
ICM-boundaries (CARLIT) and ICM-boundaries (EEI) are in the acceptable range of variability,<br />
for their comparison, defined during the <strong>intercalibration</strong> process, in the ECOSTAT Working Group<br />
(Figure 2.1.12).<br />
ICM-EQR<br />
1<br />
0,9<br />
0,8<br />
0,7<br />
0,6<br />
0,5<br />
0,4<br />
0,3<br />
0,2<br />
0,1<br />
0<br />
Figure 2.1.12: Intercalibrated EQR within the confidence interval.<br />
SP<br />
GR-SI-CY<br />
2.1.6 Results of the harmonisation – Boundary EQR values<br />
The harmonization process between the methods indicated that some differences, in respect to<br />
the ecological meaning of certain species and communities, exist in the methods and, as a result,<br />
each method has its own EQR values; nevertheless values are very close in all countries in which<br />
methods have been applied.<br />
189
2.1.7<br />
190<br />
Open issues and need for further work<br />
Based on above described similarities and differences between the methods following topics were<br />
emerged that needs to be searched in future:<br />
1.<br />
2.<br />
3.<br />
4.<br />
5.<br />
To minimize differences between methods deeper knowledge in different aspects is needed:<br />
(a) clarification of scale based ecological role of species like Corallina elongata, Cystoseira<br />
compressa and their communities within the Mediterranean Sea, (b) method sensitivity to<br />
environmental stress.<br />
Study of species-specific sensitivity and tolerance of dominant macroalgal species to<br />
different disturbances.<br />
Development of type-specific reference conditions within rocky coasts, e.g. rocky shallow,<br />
rocky deep, using new or existing literature data.<br />
Application of common actions to describe different ecological status classes and test<br />
different method effectiveness. Such an action is planned for spring/summer 2008 in<br />
Slovenian coasts, where Slovenian and French experts will intercalibrate on a similar spatiotemporal<br />
scale the CARLIT and EEI indices. The campaign will promote, if needed, the<br />
development of local scales of sensitivity levels of species (CARLIT) or possible adjustment<br />
of ecological state groups (EEI). It will also provide information/data on the ecological value<br />
of the taxa under debate.<br />
Italy, after having tested the CARLIT method at Regional scale, has presently introduced<br />
its use, at the national level, in the new National Monitoring Programme (2008-2011) for<br />
coastal waters. A first training course for the Regional Agencies, that operate in the fields,<br />
has already been carried out.
2.2<br />
2.2.1<br />
NE Atlantic GIG<br />
Intercalibration approach<br />
In the NE Atlantic seven basic <strong>intercalibration</strong> types have been agreed. These are shown in table<br />
2.2.1 below:<br />
Table 2.2.1: NEA GIG Intercalibration types.<br />
New Type ID Name Salinity<br />
(PSU)<br />
CW<br />
–NEA1/26a,b,c,d,e<br />
Exposed or<br />
sheltered,<br />
euhaline,<br />
shallow<br />
CW – NEA3/4 Polyhaline,<br />
exposed or<br />
moderately<br />
exposed<br />
(Wadden Sea<br />
type)<br />
CW – NEA7 Deep, low<br />
current,<br />
sheltered<br />
CW – NEA8 Polyhaline,<br />
microtidal,<br />
sheltered,<br />
shallow<br />
(Skagerrak<br />
inner arc<br />
type)<br />
CW – NEA9 Fjord with<br />
a shallow<br />
sill at the<br />
mouth with<br />
a very deep<br />
maximum<br />
depth in the<br />
central basin<br />
with poor<br />
deepwater<br />
exchange.<br />
CW – NEA10 Polyhaline,<br />
microtidal<br />
exposed,<br />
deep<br />
(Skaggerak<br />
outer arc<br />
type)<br />
TW – NEA11<br />
(will be split into<br />
sub-types)<br />
Transitional<br />
waters<br />
Fully saline<br />
(> 30)<br />
Polyhaline<br />
(18 - 30)<br />
Fully saline<br />
(> 30)<br />
Polyhaline<br />
(18 - 30)<br />
Polyhaline<br />
(18 - 30)<br />
Polyhaline<br />
(18 - 30)<br />
Oligo-<br />
Euhaline<br />
(0 - 35)<br />
Tidal range<br />
(m)<br />
Mesotidal<br />
(1 - 5)<br />
Mesotidal<br />
(1 - 5)<br />
Mesotidal<br />
(1 - 5)<br />
Microtidal<br />
(< 1)<br />
Microtidal<br />
(< 1)<br />
Microtidal<br />
(< 1)<br />
Mesotidal<br />
(1 – 5 )<br />
Depth (m) Current<br />
velocity<br />
Shallow<br />
(< 30)<br />
Shallow<br />
(< 30)<br />
Deep<br />
(> 30)<br />
Shallow<br />
(< 30)<br />
Deep<br />
(> 30)<br />
Deep<br />
(> 30)<br />
Shallow<br />
(< 30)<br />
Medium<br />
(1 - 3 knots)<br />
Medium<br />
(1 - 3 knots)<br />
low<br />
(< 1 knot)<br />
low<br />
(< 1 knot)<br />
low<br />
(< 1 knot)<br />
low<br />
(< 1 knot)<br />
Exposure Mixing Residence<br />
time<br />
Exposed or<br />
sheltered<br />
Exposed or<br />
moderately<br />
exposed<br />
Medium Sheltered<br />
or<br />
moderately<br />
Exposed<br />
Fully mixed Days<br />
Fully mixed Days<br />
Sheltered Fully mixed Days<br />
Sheltered Partially<br />
Stratified<br />
Sheltered Permanently<br />
Stratified<br />
Exposed Permanently<br />
Stratified<br />
Partially- or<br />
Permanently<br />
Stratified<br />
Days-Weeks<br />
Weeks<br />
Days<br />
Days-Weeks<br />
191
The above types occur in Member State’s waters as detailed below in table 2.2.2:<br />
Table 2.2.2: Member States sharing the types.<br />
Type BE DK FR DE IE NL NO PT ES SE UK<br />
CW -<br />
NEA1/26a<br />
CW -<br />
NEA1/26b<br />
192<br />
X X X X X<br />
X X X X X<br />
CW- NEA1/26c X X<br />
CW- NEA1/26d X<br />
CW-<br />
NEA1/26e<br />
CW – NEA3/4 x x<br />
X X<br />
CW – NEA7 x x<br />
CW – NEA8 x x X<br />
CW – NEA9 x x<br />
CW – NEA10 x x<br />
TW – NEA11 x X X X X X X X<br />
Option 2 has been used in this phase of the <strong>intercalibration</strong> process. Three metrics have been<br />
selected, Perennial Intertidal Algae (in type NEA1/26a,b,e), Opportunistic Macroalgae (in types<br />
NEA1/26a,b,c/11) and Perennial Subtidal Algae (in types NEA8/9/10). Boundaries have been<br />
agreed for some countries for each metric where applicable. This is described below.<br />
2.2.2 National methods that were intercalibrated<br />
National methods are summarised in table 2.2.3 below. Further details can be found in the following<br />
sections and appendices<br />
Table 2.2.3: National Methods.<br />
Member State RSL CFR P-MarMAT MAB Subtidal algae<br />
BE<br />
DK<br />
FR<br />
Yes<br />
DE Yes<br />
IE<br />
NL<br />
Yes Yes<br />
NO Yes Yes<br />
PT Yes Only in TW’s<br />
ES Yes<br />
SE Yes<br />
UK Yes Yes
RSL (Reduced Species list) – Rocky shore tool<br />
(Perennial Intertidal Algae)<br />
A tool for ecological quality assessment of intertidal rocky shore macroalgae based on the species<br />
richness from a reduced species list (RSL tool) of between 68 and 70 species had been developed<br />
over the last 4 years by UK and has been adopted with slight local variation by Republic of Ireland<br />
and Norway. The metric is based on five components:<br />
• Numerical species richness which incorporates a deshoring factor to correct for the overall<br />
nature of the shore and its suitability for algal attachment.<br />
• The proportion of Rhodophyta species within the overall sample<br />
• The proportion of Chlorophyta species within the overall sample<br />
• The proportion of opportunistic species within the overall sample which includes the species<br />
Blidingia, Chaetomorpha, Enteromorpha, Ulva, Ectocarpus, Pilayella and Porphyra.<br />
• The ratio of perennial forms (ESG I) to annual or ephemeral forms (ESG II)<br />
CFR – Quality of Rocky Bottoms<br />
(Perennial Intertidal Algae & Opportunistic macroalgae)<br />
Composed of three indicators: percentage cover of characteristic macroalgae (Cover), characteristic<br />
macroalgae population richness (Richness) and percentage cover of opportunistic species<br />
(Opportunists) relative to the total vegetated surface.<br />
P-MarMAT – Portuguese Marine Macroalgae Assessment Tool<br />
(Perennial Intertidal Algae & Opportunistic macroalgae)<br />
This includes all components from the RSL (species richness, proportion of greens, proportion of<br />
reds, ESG ratio, proportion of opportunists and shore description) but in addition also includes<br />
coverage of opportunists (%).<br />
MAB – Macroalgae Blooming<br />
(Opportunistic macroalgae)<br />
This tool is based on 5 components:<br />
• % cover of algae over the available intertidal area (or the whole intertidal area for Germany)<br />
calculated as an average<br />
• The total extent of the algal blooms measured in hectares<br />
• The biomass of the algae taken as an average per squared meter over the available intertidal area<br />
• The Biomass of the algae taken as an average per squared meter over the affected bloom area only<br />
• Presence of entrained algae calculated as a % of the total quadrats in which it is recorded.<br />
Subtidal Algae<br />
(Perennial Subtidal Algae)<br />
This tool incorporates three metrics<br />
• Metric 1 describes the depth extension of selected perennial macroalgal species in<br />
Scandinavian coastal waters. The species selected for each type are all 1) perennial, 2)<br />
commonly occurring in the type and 3) easy to determine.<br />
193
2.2.3<br />
194<br />
• Metric 2 describes the cover of the macroalgal community along depth gradients. This is still<br />
under development.<br />
1) ‘Total cover’: overall cover of the community representing values up to 100 %, or<br />
2) ‘Cumulated algal cover’: summed cover of all individual species, representing values up to<br />
several 100 % as the algae may grow in several stories.<br />
• Metric 3 describes the macroalgal composition in rocky littoral and sublittoral zones. The<br />
metric includes species richness (or total number of species recorded), proportions of red,<br />
green and opportunist, ratio of ephemeral against perennial algae, ratio between Ecological<br />
Status Groups I and II (ESG ratio), lower depth extension of a few selected species and their<br />
abundance as well as the physical properties of the location. Again this metric is still under<br />
development.<br />
Reference conditions and class boundary setting<br />
Metrics -RSL (Reduced Species List) - Rocky Shore Tool, CFR & P-MarMAT<br />
CW - NEA1/26a,b,e<br />
Member states involved in <strong>intercalibration</strong> of rocky shore tools:<br />
Reduced Species List (RSL): (applied only to intertidal areas).<br />
NB: the RSL doesn’t incorporate cover:<br />
• UK<br />
• Republic of Ireland<br />
• Norway<br />
CFR: (Applied either for intertidal or subtidal areas).<br />
NB: the CFR incorporates cover:<br />
• Spain<br />
• Portugal<br />
P-MarMAT:<br />
NB: the P-MarMAT incorporates coverage of opportunists:<br />
• Portugal<br />
• Spain<br />
France is yet to decide which metric will be adopted, but this means they will ‘automatically’<br />
intercalibrate with whichever member state’s tool they adopt.<br />
Reference Conditions<br />
General reference conditions are based on the normative definition, which states, “All disturbancesensitive<br />
macroalgal and angiosperm taxa associated with undisturbed conditions should be present<br />
and the levels of macroalgal cover and angiosperm abundance should be consistent with undisturbed<br />
conditions”. The reference values indicated in the nominative definition are calculated as the<br />
maximum values possible for the selected indices comprising the macroalgae metric.<br />
The RSL (Reduced Species List) macroalgae metric indices include: Total numerical species<br />
richness based on a reduced species list which includes a correction factor based on the shore<br />
description, the proportion of red species within the sample, the proportion of green species,<br />
the proportion of opportunist species listed as Blidingia, Chaetomorpha, Enteromorpha, Ulva,<br />
Ectocarpus, Pilayella and Porphyra, and the ratio of ESG I/ESG II (ESG 1 – late successionals or<br />
perennials and ESG 2 – ephemerals or annuals)
This translates into the following definition (table 2.2.4):<br />
Table 2.2.4: RSL reference values.<br />
Biological element Reference value<br />
Marine benthic<br />
macroalgae<br />
Optimal Metric<br />
Scores<br />
Diverse community of red, green and brown seaweeds with high levels of species richness.<br />
Cover variable depending on local physical conditions but species richness relatively constant<br />
temporally. Red species present as richest group along with a high proportion of long-lived<br />
spp. Opportunist and green species should constitute a lower proportion of the algal present.<br />
Species Richness % Green Species % Red Species ESG Ratio % Opportunists<br />
Scotland ≥35 ≤12 ≥55 ≥1.0 ≤10<br />
England/Wales/RoI ≥35 ≤15 ≥55 ≥1.0 ≤10<br />
NI ≥34 ≤20 ≥45 ≥0.8 ≤15<br />
Norway ≥33 ≤20 ≥40 ≥0.8 ≤15<br />
The reduced species list has a maximum of 70 Species that should be present for UK& IE shores,<br />
and 68 for Norway. The actual species within these lists vary to represent regional differences in<br />
species composition. These are the reference species numbers for the ‘reduced species list’ from<br />
which species richness is derived.<br />
In terms of the indices agreed for this metric then a reference site should score the maximum<br />
possible i.e. 24 points, giving an EQR of 1.0 (or 20points if no shore description is available). The<br />
tool now works on an EQR sliding scale and no longer equates to a point system as previously<br />
described, the new method is much more accurate and is easier to see when a site is sitting on, or<br />
close to, a class boundary.<br />
For UK, IE, and Norway bodies reference values were established using historic data, historic<br />
<strong>report</strong>s and publications and expert judgement. Expert judgement was then used to refine<br />
recommended levels of macroalgae species richness to correspond to desired reference conditions<br />
of maximum species richness and desirable community composition within natural and undisturbed<br />
water bodies.<br />
Spain and Portugal have tested the RSL and found that it was not appropriate for their coasts.<br />
Spain has developed the CFR (Quality of Rocky Bottoms) Index (Juanes et al., 2008), which is<br />
composed of three indicators: percentage cover of characteristic macroalgae (Cover), characteristic<br />
macroalgae population richness (Richness) and percentage cover of opportunistic species<br />
(Opportunists) relative to the total vegetated surface. The reference conditions for this metric are as<br />
follows (table 2.2.5):<br />
Table 2.2.5: CFR reference values<br />
Metric Ref. Cond.<br />
Characteristic Macroalgae Cover 70 %<br />
Populations Richness 6<br />
Relative Coverage of Opportunists 9 %<br />
195
Portugal has developed de P-MarMAT (Portuguese Marine Macroalgae Assessment Tool). Which<br />
includes all metrics from RSL (species richness, proportion of greens, proportion of reds, ESG ratio,<br />
proportion of opportunists and shore description) and coverage of opportunists ( %). The reference<br />
conditions for this metric are as follows (table 2.2.6):<br />
196<br />
Table 2.2.6: P-MarMAT reference values.<br />
Metric Ref. Cond.<br />
Species richness 25<br />
Proportion of greens 10<br />
Proportion of reds 70<br />
ESG ratio 2.5<br />
Proportion of opportunists 10<br />
Shore description 7<br />
Coverage of opportunists 10<br />
France is yet to decide which metric will be adopted, but this means they will ‘automatically’<br />
intercalibrate with whichever member state’s tool they adopt.<br />
Boundary Setting Protocol<br />
UK, Ireland, Norway:<br />
The Reduced Species List Index has been tested using UK, Irish, Norwegian, Portuguese and<br />
Spanish Data. Boundaries have been agreed through data testing and common consensus (expert<br />
judgement). As no direct relationship with a pressure gradient could be established, step 8 in the<br />
boundary setting procedure was invoked (see Annex C of Milestone 6 <strong>report</strong>).<br />
The full boundary setting protocol is laid out in the Milestone 6 <strong>report</strong> Annex C. At present only<br />
UK, Ireland, and Norway are fully intercalibrated and have accepted the boundaries agreed for the<br />
RSL index.<br />
Spain:<br />
The CFR index was developed in Cantabria (Juanes et al., 2008), region where it has been<br />
extensively applied to intertidal and subtidal macroalgae communities (Guinda et al, 2008).<br />
This method has been tested as an alternative method to that of the UK, in order to test a more<br />
quantitative approach that may reflect, in a homogeneous way, the ecological condition of our<br />
hard substrate habitats all through the extent of the water bodies (intertidal+subtidal). Based on<br />
independent assessments of the status at different bathymetric levels (intertidal/ depth ranges), the<br />
index provides a tool for the consideration of all the possible “coastal reef habitats” that, according<br />
to the normative (e.g. Habitat <strong>Directive</strong>) or the expert judgements, are important in each water body.<br />
Furthermore, the initial formulation of the index (indicators, boundary values) has been intensively<br />
discussed by experts before the last version has been adopted.<br />
The last version of the CFR index provides a quantitative approach for reflecting, in a homogeneous<br />
way, the ecological condition of hard substrate habitats throughout the extent of the water bodies<br />
in the North coast of Spain, based on independent assessment of the quality status at different<br />
bathymetric levels (intertidal/subtidal). This metric integrates those features suggested by the WFD
for the assessment of seaweed communities, including the composition (Richness, R; presence<br />
of Opportunistic species, O) and the abundance (Cover, C). The Richness value (R) evaluates the<br />
number of different “characteristic macroalgae” populations that present a significant coverage<br />
(ca. >1 %), according to a previously established list for each biogeographic region. Moreover, the<br />
Cover score (C) assesses the extent that is occupied by those assemblages, considered all together.<br />
The third indicator quantifies the abundance of Opportunistic species (O) in relation to the total<br />
vegetated surface, as one of the first symptoms of several anthropogenic disturbances, mainly<br />
related to nutrient enrichment.<br />
Further details about theoretical basis and application procedures may be obtained from the<br />
previous version of this index (Juanes et al., 2008), which included additional assessments of the<br />
physiological status.<br />
Different quality thresholds were considered for diverse degrees of exposure (slope) of intertidal sites<br />
and depth ranges of subtidal stations. Table 2.2.7 shows the boundaries adopted for each metric.<br />
Table 2.2.7: Value boundaries and scores assigned to each of the three metrics of the CFR index, for its<br />
application at different intertidal and subtidal zones.<br />
Score Semiexp. Int. Exposed Int. 5 - 15 m 15 - 25 m<br />
45 70-100% 50-100% 70-100% 50-100%<br />
35 40-69% 30-49% 40-69% 30-49%<br />
20 20-39% 10-29% 20-39% 10-29%<br />
10 10-19% 5-9% 10-19% 5-9%<br />
0 3<br />
15 4 - 5 3 4 - 5 4 - 5<br />
10 2 - 3 2 2 - 3 2 - 3<br />
5<br />
1<br />
1<br />
1<br />
1<br />
0<br />
0<br />
0<br />
0<br />
0<br />
CFR: Quality of Rocky Bottoms Index<br />
Cover (1)<br />
Populations Richness (2)<br />
(2) Characteristic macroalgae populations richness.<br />
Score Intertidal<br />
5 - 15 m 15 - 25 m<br />
35
The final CFR value is calculated by adding the scores obtained for each of the three metrics<br />
(C+R+O). To obtain the corresponding EQR value ranging between 0 and 1, the CFR/100 value is<br />
calculated and the corresponding status is assigned according to the ranges of the next table 2.2.8<br />
(based on REFCOND 2003):<br />
198<br />
Table 2.2.8: CFR ranges.<br />
CFR Scores EQR Status<br />
83-100 0.83-1 High<br />
62-82 0.62-0.82 Good<br />
41-61 0.41-0.61 Moderate<br />
20-40 0.2-0.4 Poor<br />
0-19 0-0.19 Bad<br />
Portugal:<br />
The metrics selected for the Portuguese marine macroalgae assessment tool (P-MarMAT) include<br />
the ones from the RSL methodology proposed by UK, Norway and RoI (species richness, proportion<br />
of greens, proportion of reds, ESG ratio, proportion of opportunists and shore description), and<br />
the coverage of opportunists. A reduced species list was developed to Portugal (keeping the same<br />
number of algae from green -8-, red -20- and brown -24- groups initially proposed by other MS),<br />
and a new metric was included on the assessment method (coverage of opportunists). The scores<br />
for the species richness, proportion of greens, proportion of reds, ESG ratio, and the proportion of<br />
opportunists were calculated from the RSL adapted to Portugal (PT-RSL), and the shore description<br />
followed the same procedures of the ones proposed earlier by the above mentioned MSs. The<br />
coverage of opportunists represents the percentage cover of opportunists (defined from the PT-RSL)<br />
on the total area covered by marine macroalgae in the assessed shore. The metrics species richness<br />
and % coverage of opportunists have a factor of 2 on the contribution to the total score. The sum of<br />
scores is converted in a 0 to 1 scale (EQR according to the WFD definitions), that afterwards allows<br />
the determination of the EQS of the shore (according to WFD normative definitions). Table 2.2.9<br />
shows the candidate metrics, the boundaries adopted for each of them to Portugal on this stage of<br />
the IC exercise, and provides the way to go from the sum of scores to the EQS.<br />
Table 2.2.9: Candidate metrics comprising the P-MarMAT, their boundaries, and conversion of sum of scores in EQR<br />
and EQS classes.<br />
Quality Bad Poor Moderate Good High<br />
Species Richness (*) 0 - 5 5 - 8 9 - 16 17 - 24 > 24<br />
Proportion of Greens 40 - 100 30 - 40 20 - 30 10 - 20 0 - 10<br />
Proportion of Reds 0 - 30 30 - 45 45 - 55 55 - 70 70 - 100<br />
ESG Ratio 0 - 1 1 - 1.5 1.5 - 2 2 - 2.5 > 2.5<br />
Proportion of Opportunists 40 - 100 30 - 40 20 - 30 10 - 20 0 - 10<br />
Shore Descriptions - 15 - 18 12 - 14 8 - 11 1 - 7<br />
Coverage of Opportunists<br />
(%) (*)<br />
70 - 100 30 - 70 20 - 30 10 - 20 0 - 10<br />
Sum of scores 0 - 7 8 - 14 15 - 21 22 - 28 29 - 36<br />
EQR 0 - 0.2 0.2 - 0.4 0.4 - 0.6 0.6 - 0.8 0.8 - 1<br />
EQS Bad Poor Moderate Good High<br />
(*) factor of 2
Metric - MAB (Macroalgal Blooms) - Opportunistic Macroalgae (NEA1/26/11)<br />
Reference Conditions<br />
General reference conditions should fulfil the criteria for high status as defined by the <strong>Water</strong><br />
<strong>Framework</strong> <strong>Directive</strong>: There should be no or only very minor anthropogenic alterations to the values<br />
of the physico-chemical and hydromorphological quality element relative to those associated with<br />
undisturbed conditions. Specifically reference sites should also fulfil the criteria for high status of<br />
the quality element ‘macroalgae and angiosperms’ as defined by the WFD: All disturbance-sensitive<br />
macroalgal and angiosperm taxa associated with undisturbed conditions should be present and<br />
the levels of macroalgal cover and angiosperm abundance should be consistent with undisturbed<br />
conditions. The proposed metrics/indices are % cover and total area of opportunist macroalgae over<br />
the available intertidal habitat (AIH – UK/IE), or % cover over the total intertidal (DE), biomass of<br />
opportunist macroalgae and presence of entrained algae within the sediment definitions of which are<br />
given below in table 2.2.10 (UK/IE):<br />
Table 2.2.10: UK/IE reference values.<br />
Measurement Definition<br />
% cover of AIH<br />
Total area (ha)<br />
Biomass (g m2) of AIH<br />
Biomass (g m2) of affected area<br />
Presence of entrained algae<br />
(% of Quadrats)<br />
% cover of total intertidal<br />
This translates into the following definition (table 2.2.11):<br />
Table 2.2.11: UK/IE reference value definitions.<br />
Biological element Reference value<br />
The % cover of algae is estimated as an average over the whole of the available<br />
intertidal habitat for the whole waterbody<br />
The total extent of algal bloom, measured in hectares and based on the external<br />
perimeter of the bloom<br />
This is the average biomass of algae per metre squared over the whole of the<br />
available intertidal habitat<br />
This is the average biomass of algae per metre squared over the affected area<br />
only<br />
This is where algae is seen to be growing > 3cm into the underlying sediment<br />
indicating the likelihood of regeneration<br />
The percentage cover of algae is estimated as an average over the whole<br />
intertidal for the waterbody<br />
Marine benthic macroalgae Opportunistic macroalgal blooms of anthropogenic origin should be absent<br />
or if present should cover less than 5 % of the available intertidal habitat and<br />
total biomass of macroalgae per square meter should be less than 100.<br />
Total area coverage of opportunist macroalgae should be less than 100<br />
hectares with no effect on quality status.<br />
Entrained algae should only present in less than 5 % of quadrats.<br />
DE – Opportunistic macroalgal blooms of anthropogenic origin should be<br />
absent or if present should cover less than 1 % of the total intertidal of the<br />
waterbody.<br />
Generally directed at intertidal sedimentary shores in both transitional and<br />
coastal waters.<br />
199
Agreed Indices, Scoring Criteria and Use in Classification<br />
The assessment system uses two metrics, firstly, % cover of opportunist macroalgae which<br />
responds directly to increased nutrients, turbidity and reduced salinity and refers to the total area<br />
covered by opportunist macroalgae calculated as a percent of the total available intertidal habitat<br />
consisting of sedimentary substrate (UK/IE) or to the total intertidal (DE). This metric responds<br />
to anthropogenic disturbance by an increased % cover of algae. Secondly, the extent of cover of<br />
opportunist macroalgae, which responds as above but is required to account for the total size of the<br />
macroalgae bloom with the water body. This metric responds to anthropogenic disturbance by an<br />
increased extent of opportunist macroalgae cover.<br />
As nutrient input increases there is often a corresponding increase in turbidity and resulting decrease<br />
in light attenuation subsequently providing a habitable environment for those species tolerant<br />
to such conditions, these opportunist species take advantage of the condition and dominate the<br />
community often to the detriment of other species. This is where macroalgae blooms occur. This<br />
biological metric does seem to respond over the whole potential gradient of impact whereby each<br />
quality status has defined levels of % cover and total extent of opportunist macroalgae, which<br />
correspond directly to the changes in quality. Each quality status has well defined and static class<br />
boundary and there is no overlap between classes.<br />
The above applies in full to the metrics developed in the UK and RoI. Portugal is considering using<br />
the metrics only in transitional waters. Germany has only extent data (based on 6 year median of<br />
maximum for year) referenced across the whole (as opposed to the available) intertidal habitat. (see<br />
later sections).<br />
Metric - Subtidal Algae (NEA8/9/10)<br />
Reference Conditions<br />
Conditions should fulfil the general criteria for high status as defined by the <strong>Water</strong> <strong>Framework</strong><br />
<strong>Directive</strong> (WFD): There should be no or only very minor anthropogenic alterations to the values<br />
of the physico-chemical and hydromorphological quality element relative to those associated with<br />
undisturbed conditions. Sites should also fulfil the criteria for high status of the quality element<br />
‘macroalgae and angiosperms’ as defined by the WFD: All disturbance-sensitive macroalgal<br />
and angiosperm taxa associated with undisturbed conditions should be present and the levels of<br />
macroalgal cover and angiosperm abundance should be consistent with undisturbed conditions.<br />
The best-explored benthic vegetation metric is ‘depth limits of selected macroalgal species’ and<br />
the present protocol analyses this metric for Scandinavia. Further metrics ‘macroalgal cover’ and<br />
‘multimetric macroalgal index’ are not yet developed to a state where we can use them in assessment<br />
according to the WFD as e.g. reference levels are not known, but the protocol provides an initial<br />
description of these metrics.<br />
Hydromorphological conditions<br />
Hydromorphological conditions corresponding to no or very minor anthropogenic alteration in<br />
coastal waters involve absence of digging and construction activity.<br />
Physico-chemical conditions<br />
Nutrient concentrations and water transparency are main physico-chemical variables determining<br />
the status of the benthic vegetation. We have attempted to identify reference levels for these<br />
200
variables within the NEA8, NEA9 and NEA10 areas, where vegetation data are available. At<br />
present, no Danish coastal areas are considered to represent reference conditions, so we attempt<br />
to define reference levels of total-nitrogen concentrations (TN) and water transparency based on<br />
historical data and modeling. Suggestions for reference conditions have recently been published for<br />
various Danish coastal areas. Reference TN-concentrations of 43 µM have been suggested for the<br />
inner parts and 11-19 µM for outer parts of Randers Fjord based on dynamic modeling (Nielsen et<br />
al. 2003), concentrations of 50-58 µM have been suggested for inner parts of Roskilde Fjord based<br />
on paleoecological reconstruction (Clarke et al. 2003, Andersen et al. 2004), and concentrations<br />
of 23-30 µM have been suggested for Limfjorden (Markager et al. in prep. Christensen et al. xx).<br />
For Øresund, concentrations in the range 5-19 µM have been suggested based on various sources<br />
(Øresundssamarbejdet 2004: Table 1 and references therein).<br />
Reference values for TN and levels of water transparency have been defined for Swedish coastal<br />
waters (Hansson och Håkansson 2006). However, too few data exist from the same area as we have<br />
no depth distribution data for the vegetation. At present no reference conditions for TN and water<br />
transparency exist for Norway within the different areas.<br />
Reference levels can also be defined through modeling. In order to define reference levels of<br />
benthic vegetation metrics through modeling there is a need for dose-response relationships<br />
between physico-chemical variables (nutrient concentration, transparency) and vegetation metrics.<br />
Then reference levels of nutrient concentration and/or transparency are entered in the model and<br />
corresponding levels of the vegetation metrics are calculated.<br />
It is also possible to run hind-cast models based on historical as well as today’s data for nutrient<br />
loads and transparency and adjusting the nutrient input into the model according to the time when<br />
one expected reference conditions. The model can then estimate the new transparency or light<br />
penetration depths. These can then be related to e.g. depth extension of macroalgae: Today’s lower<br />
depth extensions of selected macroalgal species as well as today’s percentage light penetration<br />
at these depths can be obtained from either measurements or the literature. Based on the species<br />
minimum requirement for light, new maximum depth extensions can then be calculated for a<br />
reference situation. However, at present the reference values for benthic vegetation metrics have<br />
been set by use of historical values as well as expert judgement.<br />
Metrics<br />
Metric 1: Depth limit of macroalgal species<br />
This metric describes the depth extension of selected perennial macroalgal species in Scandinavian<br />
coastal waters. The species selected for each type are all 1) perennial, 2) commonly occurring<br />
in the type and 3) easy to determine. The metric is affected by nutrient concentration and water<br />
transparency (Kautsky et al. 2004). Depth limits of macroalgae as a group (Nielsen et al. 2002b)<br />
and depth limits of selected macroalgal species (e.g. Kautsky et al. 1986, Kautsky et al. 2004, 2007)<br />
have been shown to respond to changes in nutrient concentration and water clarity.<br />
Salinity also affects competition among species and thereby the occurrence and depth distribution<br />
of the individual species (e.g. Nielsen et al. 1995. Pedersen and Snoeijs 2001, Torn et al. 2006).<br />
In areas containing large salinity gradients, relationships between depth limits and nutrient<br />
concentration/water clarity should therefore be developed for specific salinity regimes.<br />
201
The algae also demand hard substratum for attachment, so the metric is only applicable in areas<br />
where hard substratum occurs to the maximum water depth where light allows growth. Moreover,<br />
the metric should only be applied in relatively deep areas where water depth in itself does not limit<br />
depth penetration of the algae.<br />
We have selected the following macroalgal species for Norwegian and Swedish coastal waters<br />
of Skagerrak– Kattegat: The red algae Chondrus crispus, Furcellaria lumbricalis, Coccotylus<br />
truncatus/ Phyllophora pseudoceranoides, Delesseria sanguinea, Phycodrys rubens and Rhodomela<br />
confervoides and the brown algae: Halidrys siliquosa and Saccharina latissima. In Danish coastal<br />
waters we have focused on the same species, except for Delesseria sanguinea and Phycodrys<br />
rubens.<br />
Metric 2: Cover of the macroalgal community<br />
This metric describes the cover of the macroalgal community along depth gradients. Algal cover<br />
typically peaks at intermediate water depths while cover is lower in shallow and deep water.<br />
Physical exposure is likely to limit algal cover in shallow water, whereas light limitation is likely to<br />
be responsible for the reduction in algal cover from intermediate depths towards deeper water. With<br />
the purpose of increasing the sensitivity of the metric to changes in water quality we only included<br />
algal cover data from the ‘light regulated part’ of the depth gradient, and excluded data from shallow<br />
water in the analyses of dose-response relationships. We therefore expect the metric to be primarily<br />
regulated by nutrient concentration and water transparency though substratum and salinity also may<br />
play regulating roles (Carstensen et al.2005). The cover of the algal community can be expressed in<br />
two ways:<br />
202<br />
1) ‘Total cover’: overall cover of the community representing values up to 100 %, or<br />
2) ‘Cumulated algal cover’: summed cover of all individual species, representing values up to<br />
several 100 % as the algae may grow in several stories.<br />
Note: This metric is still under development and will be intercalibrated in Phase II.<br />
Metric3: Composite macroalgal index<br />
This metric describes the macroalgal composition in rocky littoral and sublittoral zones. The metric<br />
includes species richness (or total number of species recorded), proportions of red, green and<br />
opportunist, ratio of ephemeral against perennial algae, ratio between Ecological Status Groups I<br />
and II (ESG ratio), lower depth extension of a few selected species and their abundance as well<br />
as the physical properties of the location. It is based on many elements of the English metric but<br />
includes also sublittoral communities, which are more sensitive to impacts than littoral communities<br />
and abundance of a few key species. The littoral zone is usually inhabited by species with a rather<br />
high resilience toward all kinds of impact. It has been shown that along the Norwegian coast there<br />
has been a change in sublittoral communities within the last 5 years, which has yet to be detected<br />
in the littoral zone (Moy & Christie, in press). This emphasizes the importance of including a<br />
sublittoral element in the metrics.<br />
The metric is based on a combination of the United Kingdom metric for macroalgae (in NEA1 and<br />
NEA26) and the Scandinavian depth limit metric (in NEA8, 9, and 10) and some aspects of the<br />
Danish percentage algal cover. This index is still under development.<br />
Note: As still under development <strong>intercalibration</strong> will be finalized in Phase II.
Boundary Setting<br />
Metrics 1: ‘Depth limit of macroalgal species’<br />
Regarding the metric ‘depth limit of macroalgal species’, the dose-response relationships developed<br />
so far seem to show no discontinuities/thresholds, which can be used to define e.g. the good/<br />
moderate boundary. The only distinct theoretical threshold is at a very deteriorated stage (e.g. poor/<br />
bad boundary) when the benthic vegetation has disappeared and no depth limit exists. No distinct<br />
boundaries have been identified based on paired metric assessment. So, for this indicator we should<br />
follow the above example approach for defining boundaries. However, in general the dose-response<br />
relationships on present-time data do not include a range of nutrient concentrations representing<br />
reference levels or high/good boundaries. Reference levels for the benthic vegetation indicators<br />
therefore have to be set using historical data, hind-cast modeling and/or expert judgement as<br />
discussed in Step 1. As reference levels are likely to vary between areas, we suggest that the levels<br />
are defined for each area and that class boundary limits are defined as specified deviations from<br />
reference levels.<br />
Depth limits of macroalgal species<br />
Swedish historical data on depth distribution of individual macroalgal species are available for only<br />
one waterbody i.e. NEA 9. This data set is from the inner Gullmar Fjorden, in 1941, at the Swedish<br />
Skagerrak coast (Eriksson et al. 2002 and references therein). However, Norwegian historical data<br />
for lower depth limits were available for the two other water types e.g. NEA 8 and 10. The Swedish<br />
dataset is limited both in aerial cover and time but can be used to estimate the maximum historical<br />
depth distribution of some commonly occurring, easily recognizable perennial macroalgal species<br />
and thereby to define approximate reference depth limits for the type area represented by the data.<br />
The historical Norwegian datasets are, however, mainly based on dredging and caution must be<br />
exercised. Hence, the historical data were used in combination with modeling (based on Secchi<br />
depths), present depth occurrence of the selected species in areas with low nutrient enrichment,<br />
and expert judgement to estimate reference depth limits for other water body types. The result is<br />
presented in the table 2.2.12, 2.2.13 and 2.2.14. The High/Good boundary for depth limits of nine<br />
selected macroalgal species in each salinity regime is <strong>report</strong>ed within the Swedish coastal water<br />
types. Information can be found at www.naturvardsverket.se/sv/Lagar-och-andra-styrmedel/Lagoch-ratt/Foreskrifter-och-allmanna-rad/Foreskrifter-utgivningsordning/.<br />
In Table 12 depth limits in NEA9 areas are represented by the only area for which historical data is<br />
available, i.e. Gullmar Fjorden, one profile in 1941 and two recent Norwegian surveys. The highgood<br />
boundary (= reference condition) for depth limits of nine selected macroalgal species has<br />
been defined as a 17-33 % deviation from the estimated reference levels. All depth limits are set<br />
by expert judgement for each of the nine selected macroalgal species since the few available data<br />
do not allow any good statistical treatment. Similarly, good-moderate boundaries have been set by<br />
expert judgement and represent a 42 to 50 % deviation from reference levels.<br />
In table 2.2.13 the lower depth limits have been estimated based on Sundenes historical data<br />
sets (Sundene 1953) and several recent data sets. As for NEA9 both the reference values and the<br />
boundaries are based on expert judgements. The historical values from Sundene (1953) are based<br />
on dredging and are therefore not as reliable as recent surveys carried out by use of diving. Hence,<br />
the new estimated reference values are estimated somewhere between Sundenes findings and recent<br />
observations. For some species the recent findings of lower depth limits exceeds those found by<br />
Sundene. In these cases the recent finding has been used in estimating a new reference value. The<br />
High/Good boundaries vary between 18 and 37 % of the estimated reference value and the Good/<br />
Moderate boundaries vary between 44 and 58 % of the estimated reference values (Table 2.2.13).<br />
203
Table 2.2.13. Estimated depth limits for NEA8- Skagerrak inner archipelago - in Norwegian and Swedish waters.<br />
(Walday et al. 2001 is from Grenlandsfjord 1998-1999, Magunsson et al. 1992 is from Oslofjord 1990, Pedersen et<br />
al., is from Chysochromulina surveys in 1988 and 1989, Moy et al. 2005 is from the Norwegian Coastal Monitoring<br />
Program from 1990-2005, Karlsson 1994 -1998 is from the Swedish coastal monitoring program from 1994-1998 and<br />
Sundene 1953 is from surveys in outer Oslofjord in 1947 to 1952. New reference is based on expert judgement and all<br />
these <strong>report</strong>s mentioned. * uncertainty of viability as dredging was used in collection the seaweeds.)<br />
Within NEA10 there are several extensive monitoring programs both in Norway and in Sweden<br />
that have made it possible to determine a lower depth limits for the same species as in NEA8 and<br />
9. Fredriksen and Rueness (1990) compared the data sets collected at the same stations examined<br />
by Sundene in 1947-1952, and used both dredging and diving. The conclusions were that the lower<br />
depth limits have been reduced since Sundenes explorations. Both these <strong>report</strong>s have been compared<br />
with recent registrations and new reference levels have been estimated for all species. Within the<br />
Coastal Monitoring Program (1990-) some scattered individuals are found even deeper than the new<br />
reference values, however, these lower depth limits represent individuals that may not survive the<br />
over wintering, hence not a reference level for healthy and reproductive species. The High/Good<br />
boundaries vary between 24 and 29 % of estimated reference level and the boundary level of Good/<br />
Moderate between 40 and 50 % of reference levels (Table 2.2.14)<br />
204<br />
Table 2.2.12: Estimated depth limits for NEA 9 – Skagerrak fjords – in Norwegian and Swedish<br />
waters. Historical data by M. Waern 1941 in Eriksson et al. 2002, recent data from Walday et al.<br />
2001ref missing is from Grenlandsfjord 1998-1999, Magnusson et al. 1992 is from Oslofjord<br />
1990.<br />
al. 2001 et<br />
NEA 9<br />
'Skagerrak fjords Walday<br />
Species<br />
Survey nr: 1<br />
Magnusson et al. 1992<br />
2<br />
Eriksson et al 2002<br />
3<br />
NEW ref.<br />
High / Good<br />
CHOCR512. 5 12 >10 7<br />
FURLU31515 >12 8<br />
HALSI12. 5 12 >10 7<br />
LAMSA 7 12 10 12 >8 6<br />
PHYP+COCTR 17 13 11 14 >10 8<br />
RHOCO 12 10 15 15 >12 8<br />
DELSA 17 1116.6 17 >13 9<br />
PHYRU 14 9 16 16 >13 8<br />
Good / Moderate
2.2.4<br />
Table 2.2.14: Estimated depth limits for NEA10- Skagerrak exposed - in Norwegian and Swedish waters.<br />
(Moy et al. 2005 is from the Norwegian Coastal Monitoring Program from 1990-2005, Fredriksen &<br />
Rueness 1990 is from surveys on Sundenes (1953) location in 1989. Karlsson 1994 is from the Swedish<br />
coastal monitoring program from 1994-1998 and Sundene 1953 is from surveys in outer Oslofjord in 1947<br />
to 1952. New reference is based on expert judgement and all these <strong>report</strong>s mentioned. * uncertainty of<br />
viability as dredging was used in collection the seaweeds).<br />
al. 2005 et<br />
NEA10 Skagerrak<br />
exposed Moy<br />
Species<br />
Survey nr: 9<br />
4<br />
Results of the comparison<br />
Sundene 1953 *<br />
Fredriksen & Rueness, 1990<br />
NEW ref.<br />
Karlsson 1994-98<br />
High / Good<br />
CHOCR 18 18 16 18 >13 9<br />
FURLU 13 14 20 14 16 >12 9<br />
HALSI 14 8 10 14 >10 8<br />
LAMSA 20 13 16 14 16 >12 9<br />
PHYP+COCTR 30 18 35 16 30 >22 18<br />
RHOCO 24 12 16 16 >12 9<br />
DELSA 30 15 32 30 >22 18<br />
PHYRU 29 27 27 29 >22 17<br />
8<br />
Good / Moderate<br />
As option 2 has been used the boundaries have been agreed by experts representing all countries in<br />
the GIG macroalgae sub-group. Therefore the final agreed results presented below are the results of<br />
comparing expert views on what the boundaries should be.<br />
Separate MS data were used (option 3) from Portuguese and Spanish rocky shores representing<br />
pressure gradients. Portuguese shores were surveyed on the north coast of Portugal, sites under<br />
pressure from the Douro river, and surveyed after Mieres meeting. Data from Spain were collected<br />
also from rocky shores under different gradient pressures at Liñera, Usgo and Ontón (for details see<br />
earlier <strong>report</strong>s). To set boundaries, Portugal and Spain used national data from their own pressure<br />
sites, and afterwards both assessed data from the other MS to evaluate the output correspondence of<br />
different assessment methods. Although not very extent, data from both MSs were used to compare<br />
assessment methods and to best fit boundaries to improve EQS classifications.<br />
The Portuguese Marine Macroalgae Assessment Tool (P-MarMAT) operates over a scale range from<br />
0 (impacted) to 1 (non-impacted). Initially, class boundaries were set as equidistant points along the<br />
scale (0.2, 0.4, 0.6 and 0.8).<br />
The CFR index operates over a scale range from 0 (impacted) to 100 (non-impacted), but can<br />
be easily converted to a 0-1 scale by calculating the CFR/100 value. Class boundaries are set as<br />
suggested in REFCOND (2003) 0.2-0.41-0.62-0.83.<br />
These boundaries were then modified to ensure a commitment between the status characteristics<br />
as defined in the Normative Definitions and agreeing as much as possible to other MSs thresholds.<br />
The process of setting and testing the ecological status boundaries was already described in earlier<br />
<strong>report</strong>s. Portugal and Spain assessed their own data, data from the other MS, and all together from<br />
the common dataset, in order to produce a classification result comparable between each other<br />
7<br />
205
and compliant with the expected to study sites. Figure 2.2.1 illustrates the correlations existent<br />
between the compared methods, derived from the process of setting and testing the ecological status<br />
boundaries.<br />
Portugal and Spain assessed data from both MSs in order to produce a classification result<br />
comparable between each other. From this exercise, a weighted Kappa value of 0.84 was reached,<br />
meaning a “very good” correlation between results (Monserud & Leemans, 1992). Table 2.2.15<br />
shows the assessment results from this exercise.<br />
After boundaries optimization, methods showed “excellent” agreement between each other, with a<br />
weighted kappa value of 0.89. Table 2.2.16 shows the assessment results from this second part of<br />
the IC exercise.<br />
CFR/100<br />
CFR/100<br />
CFR/100<br />
206<br />
1<br />
0,9<br />
0,8<br />
0,7<br />
0,6<br />
0,5<br />
0,4<br />
0,3<br />
0,2<br />
0,1<br />
y = 1,5453x - 0,3378<br />
R 2 = 0,8852<br />
Spain<br />
0<br />
0,00 0,10 0,20 0,30 0,40 0,50 0,60 0,70 0,80 0,90<br />
1<br />
0,9<br />
0,8<br />
0,7<br />
0,6<br />
0,5<br />
0,4<br />
0,3<br />
0,2<br />
y = 1,254x - 0,32<br />
R 2 = 0,9615<br />
P-MarMAT<br />
Portugal<br />
0,1<br />
0<br />
0,00 0,10 0,20 0,30 0,40 0,50 0,60 0,70 0,80 0,90 1,00<br />
1<br />
0,9<br />
0,8<br />
0,7<br />
0,6<br />
0,5<br />
0,4<br />
0,3<br />
0,2<br />
0,1<br />
y = 1,3472x - 0,2914<br />
R 2 = 0,8547<br />
P-MarMAT<br />
Total<br />
0<br />
0,00 0,10 0,20 0,30 0,40 0,50 0,60 0,70 0,80 0,90 1,00<br />
P-MarMAT<br />
Figure 2.2.1: Correlations between<br />
EQR resulted from SP and PT<br />
methods.
Table 2.2.15: P-MarMAT and CFR assessment results<br />
from data collected in intertidal rocky shores in Portugal<br />
and Spain.<br />
Although the small number of data available and the possibility of further developments in near<br />
future, after running the IC exercise and the procedure of setting boundaries the best threshold<br />
values for Portugal and Spain are shown in the following table:<br />
From this exercise, it was possible to improve agreement between SP and PT classification methods,<br />
resulting a value of 0.89 (“excellent”) from Kappa analysis.<br />
Although future improvements and updates surely arise, the class boundaries achieved at the<br />
moment to Portugal and Spain are shown in the following table, 2.2.17:<br />
Table 2.2.17: Class boundaries.<br />
P-MarMAT CFR<br />
H/G 0,816 0,808<br />
G/M 0,638 0,568<br />
M/P 0,460 0,329<br />
P/B 0,282 0,089<br />
Table 2.2.16: P-MarMAT and CFR assessment results<br />
from data collected in intertidal rocky shores in Portugal<br />
and Spain, after boundaries optimization.<br />
207
2.2.5<br />
208<br />
Results of the harmonisation – Boundary thresholds and EQR values<br />
Metric - Rocky Shore Macroalgae<br />
CW - NEA1/26a,b,e<br />
UK, Republic of Ireland and Norway<br />
At this time, June 2007, the scoring system for the common indices below have been agreed by<br />
Ireland, Norway, and the UK. These common indices for this <strong>intercalibration</strong> metric describe species<br />
richness and composition based on a reduced species list devised specifically for the boundary<br />
setting protocol and classification tool development process. There are slightly different between<br />
regions due to the varying levels of diversity and composition as shown in table 2.2.18 below.<br />
Table 2.2.18: EQRs.<br />
EQR<br />
Quality Class<br />
RSL Scotland<br />
England/Wales/RoI<br />
NI<br />
Norway<br />
Greens Scotland<br />
England/Wales/RoI<br />
NI<br />
Norway<br />
Reds Scotland<br />
England/Wales/RoI<br />
NI<br />
Norway<br />
ESG Scotland<br />
England/Wales/RoI<br />
NI<br />
Norway<br />
Opportunist Scotland<br />
England/Wales/RoI<br />
NI<br />
Norway<br />
0.8 - 1.0<br />
High<br />
35-70<br />
35-69<br />
34-68<br />
33-68<br />
0-12<br />
0-15<br />
0-20<br />
0-20<br />
55-100<br />
55-100<br />
45-100<br />
40-100<br />
1.0-1.2<br />
1.0-1.2<br />
0.8-1.2<br />
0.8-1.2<br />
0-10<br />
0-10<br />
0-15<br />
0-15<br />
0.6 - 0.8<br />
Good<br />
25-35<br />
25-35<br />
20-34<br />
20-33<br />
12-20<br />
15-20<br />
20-30<br />
20-30<br />
45-55<br />
45-55<br />
35-45<br />
30-40<br />
0.8-1.0<br />
0.8-1.0<br />
0.6-0.8<br />
0.6-0.8<br />
10-15<br />
10-15<br />
15-25<br />
15-25<br />
0.4 - 0.6<br />
Moderate<br />
17-25<br />
15-25<br />
10-20<br />
10-20<br />
20-30<br />
20-25<br />
30-45<br />
30-45<br />
35-45<br />
40-45<br />
25-35<br />
22-30<br />
0.7-0.8<br />
0.55-0.8<br />
0.4-0.6<br />
0.4-0.6<br />
15-25<br />
15-25<br />
25-35<br />
25-35<br />
0.2 - 0.4<br />
Poor<br />
5-17<br />
5-15<br />
3-10<br />
4-10<br />
30-80<br />
25-80<br />
45-80<br />
45-80<br />
15-35<br />
15-40<br />
10-25<br />
10-22<br />
0.2-0.7<br />
0.2-0.55<br />
0.2-0.4<br />
0.2-0.4<br />
25-50<br />
25-50<br />
35-50<br />
35-50<br />
0 - 0.2<br />
Bad<br />
0-5<br />
0-5<br />
0-3<br />
0-4<br />
80-100<br />
80-100<br />
80-100<br />
80-100<br />
0-15<br />
0-15<br />
0-10<br />
0-10<br />
0-0.2<br />
0-0.2<br />
0-0.2<br />
0-0.2<br />
50-100<br />
50-100<br />
50-100<br />
50-100<br />
A ‘de-shoring factor’ has been incorporated to adjust the level of species richness according to the<br />
overall description of the shore. This uses an exponential-type model of the form:<br />
RICHNESS = a + b exp (cSHORE)<br />
where a, b and c are parameters to be estimated from the data. Using least squares, these parameters<br />
were estimated to be:<br />
a = 14.210<br />
b = 4.925<br />
c = 0.108<br />
The final metric system works on a sliding scale to enable an accurate EQR value to be calculated<br />
for each of the different parameters, an average of these values is then used to establish the final<br />
classification status.
Where a shore description is not available the uncorrected level of species richness is to be put into<br />
the final metric, although the level of confidence in the overall result may be reduced slightly.<br />
EQRs<br />
The above scoring system for the indices for this metric gives EQR boundaries of:<br />
H/G 0.80<br />
G/M 0.60<br />
M/P 0.40<br />
P/B 0.20<br />
The average EQR is used to classify this metric.<br />
The overall scoring and EQR’s show above are currently under review.<br />
Spain have developed preliminary boundary classifications for their CFR metric, which are still to<br />
be fully tested before they are accepted. Details of which can be found in the detailed Milestone 6<br />
Report.<br />
Spain and Portugal:<br />
As explained before, the class boundaries achieved at the moment to Portugal and Spain are shown<br />
in the following table, 2.2.19:<br />
Table 2.2.19: ES/PT EQRs.<br />
P-MarMAT CFR<br />
H/G 0,816 0,808<br />
G/M 0,638 0,568<br />
M/P 0,460 0,329<br />
P/B 0,282 0,089<br />
Metric - Opportunistic Macroalgae (NEA1/26a,b,c,e/11)<br />
The Opportunistic Macroalgal bloom tool shown below has been agreed if only by the UK and<br />
Ireland, table 2.2.20 below. Germany is also considering using this tool, full information on German<br />
macroalgae <strong>intercalibration</strong> can be found in: German Macroalgae & Angiosperm Annex-IC-Report<br />
Macroalgae and Angiosperms NEA GIG - Germany_05-2007.doc (Kolbe, 2007). Portugal is only<br />
considering opportunistic macroalgae in transitional waters.<br />
Other countries are considering if this tool could be used in their waters. Denmark will intercalibrate<br />
at a later date, post June 2007.<br />
The tool is a combination of percent cover by opportunistic green algae, the density of growth with<br />
a defined area and the presence of entrained algae.<br />
The final metric system works on a sliding scale to enable an accurate EQR value to be calculated<br />
for each of the different parameters, an average of these values is then used to establish the final<br />
classification status.<br />
209
Table 2.2.20: EQRs.<br />
Quality Status High Good Moderate Poor Bad<br />
EQR 0.8 - 1.0 0.6 - 0.8 0.4 - 0.6 0.2 - 0.4 0.0 - 0.2<br />
% Cover of AIH 0 - 5 5 - 15 15 - 25 25 - 75 75 - 100<br />
Area (ha) 0 - 100 100 - 500 500 - 1000 1000 - 2500 >2500 (- 6000)<br />
Biomass (g m 2 ) of AIH 0 - 100 100 - 500 500 - 1000 1000 - 3000 >3000 (- 6000)<br />
Biomass (g m 2 ) of affected area 0 - 100 100 - 500 500 - 1000 1000 - 3000 >3000 (- 6000)<br />
Presence of entrained algae<br />
(% of Quadrats)<br />
The above scoring system for the indices for this metric gives EQR boundaries of:<br />
H/G 0.80<br />
G/M 0.60<br />
M/P 0.40<br />
P/B 0.20<br />
Portugal has a long time series of data for one particular estuary and tested the metrics of total area,<br />
percentage and biomass in different combinations. The results are very comparable and comply with<br />
the expert judgement of Portuguese scientists<br />
Currently Germany only has data for the areal cover of opportunistic macroalgal growth on soft<br />
sediments in the intertidal. A recent <strong>report</strong> has tried to compare this metric to part of the UK/RoI<br />
tool (see below). (Classification tools for biomass and for taxonomic composition might be designed<br />
after further investigations in the field).<br />
A recent German <strong>report</strong> considered that “UK <strong>intercalibration</strong> tool on the whole cannot be applied<br />
to the German dataset. Moreover model calculations already show that the class boundaries of the<br />
UK proposal do not reflect the heavy disturbances in algal growth that have been <strong>report</strong>ed from the<br />
German water bodies in the 1990s (ADOLPH 2007).” Therefore, Germany are still in the process of<br />
intercalibrating their data, the progress of which is detailed below.<br />
Currently Germany have described their references conditions as:<br />
Opportunistic macroalgae blooms of anthropogenic origin should be absent or if present should<br />
cover less than 1 % of the total intertidal of the water body.<br />
Coverages with densities ≥1 % rarely ever exceed 15 % of the intertidal; normalised to 100 %<br />
density they stay below 5 % in most of the cases. It is very likely, that differences in morphological<br />
and hydrodynamic conditions between the British and the German water bodies are the underlying<br />
reason for these mismatches.<br />
The class boundaries proposed by Germany are based on the 6 year median of the annual<br />
maximum, defined as the acreage of algal cover (monitored in km²; area with green algal density<br />
≥1 %) as a percent of the total intertidal in a water body at the time of maximal extent. This was<br />
monitored along the entire coast in the respective year. Currently the class boundaries are calculated<br />
separately for each waterbody (based on historical reference values and recent information from<br />
problem areas). The EQRs that match the percentage cover data are calculated by means of linear<br />
interpolation within the respective equidistant EQR class ranges (KOLBE 2007). Germany’s EQRs<br />
were not downgraded if total acreage exceeded a certain total patch size. See below table 2.2.21.<br />
210<br />
0 - 5 5 - 20 20 - 50 50 - 75 75 - 100
Table 2.2.21: DE EQRs.<br />
Metric High Good Moderate Poor Bad<br />
Percentage intertidal<br />
area overgrown with<br />
opportunistic macroalgae<br />
(green algae) (density ≥1 %)<br />
0 - 1 %<br />
EQR<br />
1 – 0.8<br />
1.1 - 1.5 %<br />
EQR<br />
0.799 – 0.6<br />
1.6 - 5 %<br />
EQR<br />
0.599 – 0.4<br />
5.1 -20 %<br />
EQR<br />
0.399 – 0.2<br />
> 20 %<br />
EQR<br />
0.199 – 0<br />
In an attempt to compare with parts of the UK/RoI method, a “normalization” process to 100 %<br />
density, and a downgrading option have been applied to German data. After normalization these data<br />
were classified using the German class boundaries. The resulting EQRs were downgraded according<br />
to the UK-method if the total acreage exceeded a certain total patch size.<br />
The results of this analysis were compared with the results of the German method. It was shown that<br />
the use of the UK density basis but DE-class boundaries can, if downgraded, may lead to the same<br />
outcome as the DE-tool. This only holds true for 6 (NEA 26 and 4) of the 13 German water bodies<br />
tested (46 %).<br />
For 7 (NEA 1, 3, 11) of the 13 water bodies (54 %) the classification lead to a status rank which is<br />
still one or two classes higher than the De-tool and does not reflect the eutrophication status in those<br />
water bodies (KOLBE 2007).<br />
Future information and work will assist in completing the <strong>intercalibration</strong>. The <strong>intercalibration</strong><br />
therefore has been completed only for the sub-types 1/26a, b, e.<br />
Metric - Subtidal Algae (NEA8/9/10)<br />
Metric 1: ‘Depth limit of macroalgal species’<br />
After the <strong>intercalibration</strong> procedure where new values for references conditions, and the depth limit<br />
between High/Good and Good/Moderate ecological status for the selected number of macroalgal<br />
species was agreed upon the following EQR –calculations for area NEA 8, 9 and 10 and the<br />
following scoring system was used.<br />
For the depth limit of the selected set of easily determined species the following expert EQR-scale<br />
was decided on the areas intercalibrated as well as nationally:<br />
1.0 - 0.81 = High status<br />
0.80 - 0.61 = Good status<br />
0.60 - 0.41 = Moderate status<br />
To calculate and intercalibrate the ecological status, i.e. the EQR values in NEA 8, 9 and 10 we have<br />
agreed to use the intercalibrated depth limits given in tables 12, 13 and 14 respectively.<br />
An EQR-value is calculated by transforming the depth value (in meter) to a classification value<br />
(score) for each of the included species, ( i.e. 5, 4 or 3. where 5 corresponds to reference/high status<br />
, 4 to a depth distribution above Good status and 3 to a depth distribution in the studied transect<br />
above Moderate status. After giving each of the occurring species the appropriate score the mean<br />
value is calculated and divided by 5, i.e. the reference condition. For example, if 3 species score<br />
5, 2 species score 4 and 2 species score 3; the total is 32 giving an average score of 4; which when<br />
divided by 5 gives an EQR of 0.8; thus equating to Good Status.<br />
211
Table 2.2.2: Depth limits (m) for a set of selected macroalgal species used in the <strong>intercalibration</strong> and Calculation of<br />
EQR for NEA 8, 9 and 10.<br />
NEA 8 Species<br />
NEA 9<br />
NEA 10<br />
212<br />
Reference<br />
value<br />
Score 5<br />
if >than<br />
Score 4<br />
if >than<br />
Score 3<br />
if >than<br />
Furcellaria lumbricalis 16 10 7 4<br />
Phyllophora pseudoceranoides 22 18 12 6<br />
Rhodomela confervoides 16 12 7 4<br />
Chondrus crispus 12 8 5 3<br />
Delesseria sanguinea 25 18 12 6<br />
Halidrys siliquosa 10 8 5 3<br />
Saccharina latissima 16 10 7 4<br />
Phycodrys rubens 22 15 10 5<br />
Furcellaria lumbricalis 15 12 8 4<br />
Phyllophora pseudoceranoides 14 10 8 4<br />
Rhodomela confervoides 15 12 8 4<br />
Chondrus crispus 12 10 7 4<br />
Delesseria sanguinea 17 13 9 5<br />
Halidrys siliquosa 12 10 7 4<br />
Saccharina latissima 12 8 6 3<br />
Phycodrys rubens 16 13 8 4<br />
Furcellaria lumbricalis 16 12 9 5<br />
Phyllophora pseudoceranoides 30 22 18 9<br />
Rhodomela confervoides 16 12 9 5<br />
Chondrus crispus 18 13 9 5<br />
Delesseria sanguinea 30 22 18 9<br />
Halidrys siliquosa 14 10 8 4<br />
Saccharina latissima 16 12 9 5<br />
Phycodrys rubens 29 22 17 9<br />
An EQR-value is calculated by transforming the depth value (in meter) to a classification value<br />
(score) for each of the included species, ( i.e. 5, 4 or 3. where 5 corresponds to reference/high status,<br />
4 to a depth distribution above Good status and 3 to a depth distribution in the studied transect<br />
above Moderate status. After giving each of the occurring species the appropriate score the mean<br />
value is calculated and divided by 5, i.e. the reference condition. For example, if 3 species score<br />
5, 2 species score 4 and 2 species score 3; the total is 32 giving an average score of 4; which when<br />
divided by 5 gives an EQR of 0.8; thus equating to Good Status.
2.2.6<br />
Open issues and need for further work<br />
Gaps for the future:<br />
3<br />
3.1<br />
• Subtidal macroalgae tools are to be developed<br />
• Spain will attempt to separate macroalgae and seagrass from their macrophyte tool, for<br />
<strong>intercalibration</strong> purposes<br />
• Questions of how to combine different sub-metrics into a higher level overall EQR.<br />
• Development of macroalgae tool for transitional waters (or use of the existing Spanish tool)<br />
and <strong>intercalibration</strong><br />
• Completion of the <strong>intercalibration</strong> process for subtype 1/26c.<br />
Discussion<br />
Comparability between GIGs<br />
Metrics<br />
Intercalibration for the macroalgae quality element has been successfully performed by all of<br />
the four Coastal <strong>Water</strong>s GIGs, using indices (MEDGIG) or a selection of unaggregated metrics<br />
(NEAGIG).<br />
Types<br />
Almost all types for each GIG have been covered.<br />
Option<br />
Option 2 (MS agreed on the common metrics, created data sets relating MSs assessment<br />
methods to the common metrics, agreed on High/Good and Good/Moderate class boundaries and<br />
established relationships between common and national metrics) approach has been adopted for the<br />
<strong>intercalibration</strong>.<br />
Boundary Setting Procedure<br />
All Coastal <strong>Water</strong>s GIGs are providing results for the H/G and G/M boundaries (at least), applying<br />
similar approaches based on the expert supervised selection of appropriate percentiles as boundaries<br />
best fitting with evident changes in ecological status (90 th percentile is the favorite choice).<br />
Reference Condition<br />
There’s no shared view among GIGs (but also among MSs) on how to fix Reference Conditions: in<br />
some cases real reference sites have been identified and selected as a reference, in some others the<br />
maximum possible values for the selected indices/metrics have been used.<br />
3.2 Open issues and need for further work<br />
A shared task for the next <strong>intercalibration</strong> round is to refine typology (or include types non<br />
considered at this stage) in order to maximize the representativeness towards different waterbodies<br />
and ecological status of the Quality Element.<br />
213
4<br />
214<br />
References<br />
Adolph, W., 2007. Classification of opportunistic Macroalgae blooming in Germany compared to the UK-<br />
Intercalibration proposal. Report for Intercalibration, Mieres, 2007.<br />
Andersen JH, Conley DJ, Hedal S. 2004. Paleoecology, reference conditions and classification of ecological<br />
status: the EU <strong>Water</strong> <strong>Framework</strong> <strong>Directive</strong> in practice. Marine Pollution Bulletin 49: 283-290.<br />
Arévalo R., Pinedo S., Ballesteros E. 2007. Changes in the composition and structure of Mediterranean rockyshore<br />
communities following a gradient of nutrient enrichment: descriptive study and test of proposed methods<br />
to assess water quality regarding macroalgae. Marine Pollution Bulletin 55: 104-113.<br />
Ballesteros E. 1988. Estructura y dinámica de la comunidad de Cystoseira mediterranea Sauvageau en el<br />
Mediterráneo noroccidental.Investigación Pesquera 52: 313-334.<br />
Ballesteros E. 1992. Els vegetals i la zonació litoral: espècies, comunitats i factors que influeixen en la seva<br />
distribució. Arxius Secció Ciències I.E.C. 101, 1-616.<br />
Ballesteros E., Pérez M., Zabala M. 1984. Aproximación al conocimiento de las comunidades algales de la<br />
zona infralitoral superior en la costa catalana. Collect. Bot. 15: 69-100.<br />
Bellan G., Bellan-Santini D. 1972. Influence de la pollution sur les peuplements marins de la région de<br />
Marseille. In: Ruivo M. (Ed.) Marine Pollution and Sea Life, Fishing News Ltd. Survey, 396-401.<br />
Bellan-Santini D. 1965. Étude quantitative du peuplement à Mytilus galloprovincialis Lamarck en eau<br />
moyennement polluée. Rapports Commission International de la Mer Méditerranée 18: 85-89.<br />
Bellan-Santini D. 1966. Influence des eaux polluées sur la faune et la flora marines benthiques dans la région<br />
Marsellaise. Techniques et Sciences Municipales 61: 285-292<br />
Bellan-Santini D. 1968. Influence de la pollution sur les peuplements benthiques. Rev. Intern. Oceanogr. Med.<br />
10: 27-53.<br />
Belsher T. 1977. Analyse des répercussions de pollutions urbaines sur le macrophytobenthos de Méditerranée<br />
(Marseille, Port-Vendres, Port-Cros). Thèse Doctorat. Université d’Aix-Marseille II, Marseille, pp. 287.<br />
Boudouresque C.F. 1969. Étude qualitative et quantitative d’un peuplement algal à Cystoseira mediterranea<br />
dans la région de Banyuls sur Mer. Vie Milieu 20, 437-452.<br />
Boudouresque C.F. 1971. Contribution à l’étude phytosociologique des peuplements algaux des côtes varoises.<br />
Vegetatio 22: 83-184.<br />
Carstensen J, Krause-Jensen D, Dahl, K, Middelboe AL. 2005. Development of macroalgal indicators of<br />
water quality In Dahl, K., Andersen, J., Krause-Jensen, D., Josefson, A., Kjerulf-Petersen, J., Hansen, O.S.,<br />
Middelboe A.L. (Eds) Scientific and <strong>technical</strong> background for <strong>intercalibration</strong> of Danish coastal waters.<br />
National Environmental Research Institute, Denmark xx pp. – NERI Technical <strong>report</strong> no. 563. http://<strong>technical</strong><strong>report</strong>s.dmu.dk<br />
Clarke A, Juggins S, Conley DJ. 2003. A 150-year reconstruction of the history of coastal eutrophication in<br />
Roskilde Fjord, Denmark. Marine Pollution Bulletin 46: 1615-1629.<br />
Coppejans, E., 1980. Phytosociological studies on mediterranean algal vegetation: Rocky surfaces of the<br />
photophilic infralittoral zone. In:Price, J.H., Irvine, D.E.G., Franham, W.E. (Eds.), The shore environment,<br />
Ecosystems, Vol. 2. Academic, London, pp. 371-393.<br />
Cottalorda JM., Meinesz A., Thibaut T., Chiaverini D. 2004. Représentation cartographique de l’abondance de<br />
quelques algues et invertébrés sur le littoral des îlots du Rascas et de la Gabinière (Parc National de Port Cros,<br />
Var, France). Sci. Rep. Port-Cros Natl. Park, Fr. 20: 195-209.<br />
Edwards, P., 1975. An assessment of possible pollution effects over a century on the benthic marine algae of<br />
Co. Durham, England. Bot. J. Linn. Soc. 70, 269-305.<br />
Eriksson KB, Johansson G, Snoeijs P. 2002. Long–term changes in the macroalgal vegetation of the inner<br />
Gullmar fjord, Swedish Skagerrak coast. Journal of Phycol. 38: 284-296.<br />
Feldmann J. 1937. Recherches sur la ve´ge´tation marine de la Me´diterrane´e. La coˆ te des Albères. Revue<br />
Algologique 10: 73-254
Giaccone G. 1993. The vertical zonation along the phytal system in the Mediterranean sea and the effects of<br />
municipal and industrial wastewater disposal on phytobenthos communities. Fifth Optima Meeting, Istanbul<br />
5: 47-56.<br />
Gibert A. 1918. Flora algològica marina de les aigües i costes occidentals de Catalunya. Publicacions de<br />
l’Agrupacio´ Excursionista, pp. 65.<br />
Golubic S. 1970. Effect of organic pollution on benthic communities. Marine Pollution Bulletin 1: 56-57.<br />
Gros C. 1978. Le genre Cystoseira sur la côte des Albères. Répartition – Écologie–Morphogenèse. Thése<br />
Doctorat. Université P. et M. Curie, Paris VI, pp. 115.<br />
Guinda, X., Juanes, J.A., Puente, A., Revilla, J.A., 2008. Comparison of two methods for quality assessment of<br />
macroalgae assemblages, along different pollution gradients. Ecological Indicators 8 (5), 743-753.<br />
Hoffmann L., Clarisse S., Detienne X., Goffart A., Renard R., Demoulin V. 1988. Evolution of population of<br />
Cystoseira balearica (Phaeophyceae) and epiphytic Bangiophyceae in the Bay of Calvi (Corsica) in the last<br />
eight years. Bulletin de la Socie´te´ Royale de Liège 4-5: 263-273.<br />
Ja k l i n, S., Pe t e r S e n, B., ad o l P h, W., Pe t r i, G. & W. he i B e r (2006). Aufbau einer Matrix für die Gewässertypen<br />
nach EG-WRRL im Küstengebiet der Nordsee, Schwerpunkt Flussgebietseinheiten Weser und Elbe.<br />
Abschlussbericht Teil 1: Nährstoffe, Fische, Phytoplankton, Makroalgen und Seegras. Berichte des NLWKN<br />
2006.<br />
Juanes, J.A., Guinda, X., Puente, A., Revilla, J.A., 2008. Macroalgae, a suitable indicator of the ecological<br />
status of coastal rocky communities in the NE Atlantic. Ecological Indicators 8 (4), 351-359.).<br />
Kautsky L, Andersson C, Dahlgren S. 2004. Framtagning av nya bedömningsgrunder för kust och hav<br />
enligt ramdirektivets krav. Förslag till Ekologisk Kvalitetskvot (EQR) för den biologiska parametern –<br />
makrovegteation. Report to the Swedish EPA. In Swedish. 23pp.<br />
Kautsky N, Kautsky H, Kautsky U, Waern M. 1986. Decreased depth penetration of Fucus vesiculosus L. since<br />
the 1940s indicate eutrophication of the Baltic Sea. Mar. Ecol. Prog. Ser. 28: 1-8.<br />
Kautsky, L, Wibjörn, C, Kautsky, H. 2007. Bedömningsgrunder för kust och hav enligt krav i ramdirektivet<br />
vatten – makroalger och några gömfröiga växter. Report to the Swedish EPA, in Swedish, 50 pp.<br />
kolbe, k. (2006). Bewertungssystem nach WRRL für Makroalgen und Seegräser der Küsten- und<br />
Übergangsgewässer der FGE Weser und Küstengewässer der FGE Elbe. Studie im Auftrag des Niedersächsischen<br />
Landesbetriebs für Wasser-, Küsten- und Naturschutz, Oldenburg/Brake, 99 S.<br />
Kolbe, K., 2007. Assessment of German Coastal <strong>Water</strong>s (NEA 1/26, NEA 3/4) and Transitional <strong>Water</strong>s (NEA<br />
11) by Macroalgae and Angiosperms. Intercalibration Report (NEA GIG).- (postal to D. Coates, D. Jowett).<br />
Lipej L., Mozetič P., Orlando-Bonaca M., Mavrič B., Šiško M., Bettoso N. 2006. Evaluation of the Ecological<br />
Status of Coastal <strong>Water</strong>s in accordance with the European <strong>Water</strong> <strong>Framework</strong> <strong>Directive</strong> (<strong>Water</strong> <strong>Framework</strong><br />
<strong>Directive</strong>, 2000/60/EC). Final national <strong>report</strong> in Slovenian, Marine Biology Station Piran, National Institute<br />
of Biology, October 2006, 180 pp.<br />
Littler M.M., Littler D.S. 1980. The evolution of thallus form and survival strategies in benthic marine<br />
macroalgae: field and laboratory tests of a functional form model. American Naturalist 116: 25-44.<br />
Littler M.M., Murray S.N. 1975. Impact of sewage on the distribution, abundance and community structure of<br />
rocky intertidal macroorganisms. Marine Biology 30: 277-291<br />
MacArthur R.H, Wilson E.O. 1967. The theory of island biogeography. Princeton University Press,<br />
Princeton.<br />
Magnusson J, Johnsen T.M, Beyer F, Gjøsæter J, Lømsland E.R, Sollie, Aa, 1999. or 1992 som i tabellen<br />
vilket år skall det vara?? Pollution monitoring in the Inner Oslofjord in 1998. NIVA-<strong>report</strong>. OR-4058. 63pp. In<br />
Norwegian (http://www.niva.no/)<br />
Mangialajo, L., Ruggieri, N., Asnaghi, V., Chiantore, M., Povero, P., Cattaneo-Vietti, R., 2007. Ecological<br />
status in the Ligurian Sea: The effect of coastline urbanisation and the importance of proper reference sites.<br />
Marine Pollution Bulletin 55: 30-41.<br />
Meinesz A., Javel F., Cottalorda J.M., Susini M.L., Capiomont A., Levi F., Robert A. 2004. Cartographie des<br />
espèces médiolittorales et infralittorales supérieures des falaises de Bonifacio (Corse du Sud) – Mission 2003<br />
215
– Rapport intermédiaire. Contrat Office de l’Environnement de la Corse & Laboratoire Environnement Marin<br />
Littoral. Laboratoire Environnement Marin Littoral publ., Nice: 1-14.<br />
Meinsez A., Javel F., Chiavérini D., Cottalorda J.M., Giletta L. 2004. Représentation cartographique de<br />
l’abondance de quelques algues et invertébrés du littoral de la facez ouest du Parc National de Port-Cros.<br />
Laboratoire Environnement Marin Littoral publ., Nice: 1-26.<br />
Monserud, R., Leemans, R., 1992. Comparing global vegetation maps with the Kappa statistic. Ecological<br />
modelling 62, 275-293.<br />
Murray S.N., Littler M.M. 1978. Patterns of algal succession in a perturbated marine intertidal community.<br />
Journal of Phycology 14: 506-512.<br />
NFS: Information can be found at www.naturvardsverket.se/sv/Lagar-och-andra-styrmedel/Lag-och-ratt/<br />
Foreskrifter-och-allmanna-rad/Foreskrifter-utgivningsordning/.<br />
Nielsen R, Kristiansen A, Mathiesen L, Mathiesen H. 1995. Distributional index of the benthic macroalgae of<br />
the Baltic Sea area. Acta Bot Fenn 155: 1-51.<br />
Nielsen SL, Sand-Jensen K, Borum J, Geertz-Hansen O. 2002b. Depth colonization of eelgrass (Zostera<br />
marina) and macroalgae as determined by water transparency in Danish coastal waters. Estuaries 25: 1025-<br />
1032.<br />
Nielsen SL, Sand-Jensen K, Borum J, Geertz-Hansen,O. 2002a. Phytoplankton, nutrients and transparency in<br />
Danish coastal waters. Estuaries 25: 930-937.<br />
NIENBURG, W. (1927): Zur Ökologie der Flora des Wattenmeeres I. Teil. Der Königshafen bei List auf Sylt.<br />
- Wiss. Meeresunters. (Abteilung Kiel) Neue Folge, 20(2): 145-196.<br />
Opportunistic Green Macro algae References (Types NEA 1/26a,b,c, NEA11, NEA3/4).<br />
Orfanidis S. 2007. Comments on the development of new macroalgal indices to assess water quality within the<br />
Mediterranean Sea. Marine Pollution Bulletin (in press).<br />
Orfanidis S., Panayotidis P. 2005. Implementation of <strong>Water</strong> <strong>Framework</strong> <strong>Directive</strong> (WFD) for coastal waters<br />
by using the Ecological Evaluation Index-EEI: the case of Kavala’s and Maliakos Gulfs, Greece. Proceedings<br />
12th Panhellenic Congress Ichthyologists, Drama, Greece, pp. 237-240.<br />
Orfanidis S., Panayotidis P., Stamatis N. 2001. Ecological evaluation of transitional and coastal waters: a<br />
marine benthic macrophytes-based model. Mediterranean Marine Science 2: 45-65.<br />
Orfanidis S., Panayotidis P., Stamatis N. 2003. An insight to the ecological evaluation index (EEI). Ecological<br />
Indicators 3: 27-33.<br />
Orfanidis S., Stamatis N., Tsiagga E. 2005. Ecological status assessment of Delta Nestos Lagoons by using<br />
biological and chemical indicators in agreement to <strong>Water</strong> <strong>Framework</strong> <strong>Directive</strong> (WFD 2000/60). Proceedings<br />
12th Panhellenic Congress of Ichtyologists: 245-248 (In Greek with English summary).<br />
Orfanidis, S., Panayotidis, P. and Stamatis, N., 2001. Ecological evaluation of transitional and coastal waters:<br />
A marine benthic macrophytes-based model. Mediterranean Marine Science. 2/2, 45-65.<br />
Orlando-Bonaca M., Lipej L., Orfanidis S. 2008. Benthic macrophytes as a tool for delineating, monitoring<br />
and assessing ecological status: the case of Slovenian coastal waters. Marine Pollution Bulletin 56 (4): 666-<br />
676.<br />
Panayotidis P., Montesanto B., Orfanidis S. 2004. Use of low-budget monitoring of macroalgae to implement<br />
the European <strong>Water</strong> <strong>Framework</strong> <strong>Directive</strong>. Journal of Applied Phycology 16: 49-59.<br />
Panayotidis P., Orfanidis S., Tsiamis K. 2007. Cystoseira crinita community in the Aegean Sea. Rapp. Comm.<br />
int. Mer Médit., 38 (in press).<br />
Panayotidis P., Siakavara A., Orfanidis S., Haritonidis S. 2001. Identification and description of habitat types at<br />
sites of interest for conservation. Study 5: Marine habitats. Final Technical Report, Athens October 2001.<br />
Pedersen M, Snoeijs P. 2001. Patterns of macroalgal diversity, community composition and long-term changes<br />
along the Swedish west coast. Hydrobiol. 459: 83-102.<br />
Polo L. 1978. Estudio sobre las algas bentónicas de la costa catalana. Tesis Doctoral, Universidad de Barcelona,<br />
pp. 222<br />
216
REFCOND, 2003. Guidance on establishing reference conditions and ecological status class boundaries for<br />
inland surface waters. Working group 2.31 Reference conditions for inland surface (REFCOND), Common<br />
Implementation Strategy of the <strong>Water</strong> <strong>Framework</strong> <strong>Directive</strong>, European Commission.<br />
Rodríguez-Prieto C., Polo L. 1996. Effects of sewage pollution in the structure and dynamics of the community<br />
of Cystoseira mediterranea (Fucales, Phaeophyceae). Scientia Marina 60: 253-263.<br />
Sauvageau C. 1912. Á propos des Cystoseira de Banyuls et de Guéthary. Bulletin de la Station Biologique<br />
d’Arcachon 14: 133-556.<br />
Scanlan, C.M., Foden, J., Wells, E. and Best, M.A., 2007. The monitoring of opportunistic macroalgal blooms<br />
for the water framework directive. Marine Pollution Bulletin 55: (1-6): 162-171.<br />
Seoane-Camba J.A. 1975. Algas bentónicas españolas en los herbarios Thuret-Bornet y Sauvageau del Museum<br />
National d’Histoire Naturelle de Paris. II. Anales Instituto Botánico Cavanilles 32: 33-51.<br />
Soltan D., Verlaque M., Boudouresque C.F., Francour P., 2001. Changes in macroalgal communities in the<br />
vicinity of the Mediterranean sewage outfall after the setting up of a treatment plant. Marine Pollution Bulletin<br />
42: 59-70.<br />
Sundene O, 1953. The algal vegetation of Oslofjord. Mat. – Naturv. Klasse. No. 2 244 pp.<br />
Thibaut T., Hereu B., Susini M. L., Cottalorda J.M. 2005. Inventaire et cartographie des Fucales du Parc<br />
National de Port-Cros. Contrat Parc National de Port-Cros et Laboratoire Environnement Marin Littoral.<br />
Laboratoire Environnement Marin Littoral publ., Nice: 1-30.<br />
Thibaut T., Pinedo S., Torras X., Ballesteros E. 2005. Long term decline of the populations of Fucales<br />
(Cystoseira, Sargassum) in the Albères coast (northwestern Mediterranean). Marine Pollution Bulletin 50:<br />
1472-1489.<br />
Torn K, Krause-Jensen D, Martin G. 2006. Present and past depth distribution of bladderwrack (Fucus<br />
vesiculosus) in the Baltic Sea. Aquatic Botany 84: 53-62.<br />
Wells, E. and Wilkinson, M., 2002b. Intertidal seaweed biodiversity in relation to environmental factors –<br />
a case study from Northern Ireland. Marine Biodiversity in Ireland and Adjacent <strong>Water</strong>s, Ulster Museum,<br />
Belfast.<br />
Wells, E. and Wilkinson, M., 2003. Intertidal seaweed biodiversity of Orkney. Coastal Zone Topics. 5, 25-30<br />
Wells, E., 2002a. Seaweed Species Biodiversity on Rocky Intertidal Seashores in the British Isles. Ph.D. Thesis,<br />
Heriot-Watt University, Edinburgh.<br />
Verlaque, M., Tine, J., 1979. Végétation marine de la rade de Toulon (Var, France): la Rade-abri. Revue de<br />
Biologie et Ecologie Méditerrannée 5, 67-86.<br />
Wilkinson, M. and Tittley, I., 1979. The marine Algae of Elie: A reassessment. Botanica Marina. 22, 249-256.<br />
Wilkinson, M., Fuller, I.A., Telfer, T.C., Moore, C.G. and Kingston, P.F., 1988. A Conservation Oriented Survey<br />
of the Intertidal Seashore of Northern Ireland. Institute of Offshore Engineering, Heriot-Watt University,<br />
Edinburgh.<br />
Øresundsvandsamarbejdet - Öresundsvattensamarbetet. 2004. Jämförelse mellan ‘urtida’ och ‘nutida’<br />
näringsnivåer i Öresund – beräkningar utförda med MIKE3-modell. www.oresundsvand.dk<br />
217
Section 5 – Angiosperms<br />
1<br />
Introduction<br />
National classification tools for the angiosperms quality element have been intercalibrated in two<br />
coastal GIGs. Intercalibration of angiosperm-specific assessment tools was possible to carry out<br />
between Denmark and Germany in the Baltic Sea GIG, and between Germany, Ireland, Netherlands,<br />
and UK in the North East Atlantic in the North East Atlantic GIG. For these GIGs a sub-set of<br />
common types was selected where angiosperms were present. Information about the types and<br />
countries with each type in each GIG is described in the sections below.<br />
The <strong>intercalibration</strong> of the angiosperm quality element for the Mediterranean GIG was not finalised<br />
during the first phase and will be continued in the future.<br />
The Option 2 was chosen in this phase of the <strong>intercalibration</strong> process. Member States participating<br />
in the <strong>intercalibration</strong> have developed metrics as part of their own classification schemes. Selected<br />
metrics have been chosen for assessment and agreement of boundaries in this phase of the<br />
<strong>intercalibration</strong> process. At this stage not all the metrics that make up Member States’ schemes can<br />
be intercalibrated, so it is not possible to produce EQRs for the whole quality element. Therefore<br />
boundaries have been agreed for the selected metrics.<br />
2<br />
2.1<br />
Methodology and Results<br />
Baltic GIG<br />
2.1.1 Intercalibration approach<br />
The Baltic Sea Geographical Intercalibration Group (GIG) includes the whole or parts of the<br />
coastline of the following countries: Germany, Denmark, Estonia, Finland, Latvia, Lithuania, Poland<br />
and Sweden (Table 2.1.1).<br />
The common coastal water types are characterised by the descriptors of the System B typology.<br />
The typology factors are based on the common typology framework presented in the guidance<br />
on the typology for the coastal and transitional waters 27 . In the Baltic Sea GIG, the common<br />
<strong>intercalibration</strong> types were characterized using basic salinity and exposure with further delineation<br />
based on depth and number of ice cover days (Table 2.1.1). One transitional water type (TW B 13)<br />
was identified. All countries agreed to focus the <strong>intercalibration</strong> on the quality elements that are<br />
sensitive to eutrophication pressures.<br />
The common <strong>intercalibration</strong> types were characterized by the following descriptors:<br />
• Salinity (using practical salinity scale): low (0,5-3) and high (3-6) oligohaline, mesohaline (6-22)<br />
27 Guidance document No. 5 ‘Transitional and Coastal <strong>Water</strong>s - Typology, Reference conditions, and Classification systems’.<br />
Common Implementation Strategy of the <strong>Water</strong> <strong>Framework</strong> <strong>Directive</strong>, Available at: http://forum.europa.eu.int/Public/irc/env/wfd/library<br />
219
220<br />
• Depth: all shallow (150 days/ year, 90-150 days/ year, no or very short ice cover<br />
Table 2.1.1: Description of Baltic Sea Common <strong>intercalibration</strong> types that are included in the <strong>intercalibration</strong> exercise.<br />
Type Salinity psu Exposure Depth Ice days Other Characteristics<br />
CW B0 0.5- 3 Sheltered Shallow > 150 Sites in Botnian Bay (Northern Quark)<br />
CW B2 3-6 Sheltered Shallow > 150 Sites in Bothnian Sea<br />
CW B3 a 3-6 Sheltered Shallow 90-150 Sites in the area extending from the<br />
southern Bothinian Sea to the Archipelago<br />
CW B3 b 3-6 Exposed Shallow 90 -150 Sea and the western Gulf of Finland<br />
CW B12 a<br />
Eastern Baltic<br />
Sea<br />
CW B12 b<br />
Western Baltic<br />
Sea<br />
5-8 Sheltered Shallow - Sites in the Gulf of Riga<br />
8 - 22 Sheltered Shallow -<br />
CW B13 6-22 Exposed Shallow -<br />
CW B 14 6-22 Sheltered Shallow - Lagoons<br />
TW B 13 6-22 Exposed Shallow<br />
Countries sharing types that have been intercalibrated:<br />
Types CWB0, CWB2, CWB3a, CWB3b: Finland, Sweden.<br />
Type CWB12a: Estonia<br />
Type CWB12b: Germany, Denmark, Sweden.<br />
Type CWB13: Denmark, Estonia, Lithuania, Latvia, Poland.<br />
Type CWB14: Denmark, Poland<br />
Type TWB13: Lithuania, Poland.<br />
Sites at the Southern Swedish coast and<br />
the South western Baltic Sea open coast<br />
along Denmark and Germany<br />
Sites along the coast of the Estonia, Latvia<br />
and Lithuania, the Polish coast and the<br />
Danish island “Bornholm”<br />
Transitional water. Sites along the coast of<br />
Lithuania and Poland<br />
Angiosperms were only intercalibrated between Denmark and Germany for the type B12b.<br />
Angiosperms are not intercalibrated in the other types, because the vegetation is scarce and<br />
distribution scattered. For the angiosperms quality element a hybrid approach between option 2 and<br />
3 was agreed bilaterally between Denmark and Germany. Reference levels are based on historical<br />
data, expert judgment and modeling. Two approaches have been used for classification: 1) percent<br />
deviation from reference conditions (3 scenarios) and 2) modeling. Denmark used the maximum<br />
depth of 5 % eelgrass (Zostera marina) cover to define the depth limit. Germany used historical<br />
records of Zostera marina depth limit to define reference and light modeling to define depth limits<br />
28 According to the definitions of the common European exposure categories; Guidance document No. 5
2.1.2<br />
National methods that were intercalibrated<br />
Increased nutrient concentrations stimulate the growth of phytoplankton and opportunistic<br />
macroalgae which cause light attenuation in the water column to increase. Angiosperms like<br />
seagrasses but also perennial macroalgae and eventually the entire benthic vegetation become<br />
shaded and vegetation cover, biomass and depth distribution decline (Duarte 1991, Nielsen et al<br />
2002, Valiela et al. 1997). Moreover, increased nutrient load is expected to increase the abundance<br />
of opportunistic algae, which may further shade seagrasses. A reduction in the vertical and<br />
horisontal distribution of eelgrass beds vegetation is likely to cause increased resuspension of<br />
bottom sediments, which may further shade the remaining benthic vegetation. Increased nutrient<br />
load also tends to increase the risk of anoxic events, which may further harm the benthic vegetation<br />
(e.g. Duarte 1995).<br />
The selected metric is ‘depth limit of eelgrass’. It describes the depth extension of eelgrass (Zostera<br />
marina), which is the dominant seagrass in Scandinavian coastal waters. The metric is affected by<br />
nutrient concentration and water transparency (Nielsen et al. 2002, Krause-Jensen et al. 2005).<br />
A large compilation of environmental data on eelgrass distribution from Danish coastal waters<br />
demonstrated that eelgrass depth limits increase significantly as nitrogen concentrations decline and<br />
water clarity increases (Nielsen et al 2002, Boström et al. 2003). Similar trends have been shown for<br />
other sea grass species in a worldwide compilation (Duarte 1991). Examples of these relationships<br />
are illustrated by Nielsen et al. 2002 (see Figures 3 and 4, in Nielsen et al. 2002). It should be noted<br />
that in order to illustrate the relationship between depth limit and nitrogen concentration a double<br />
logarithmic scale was used denoting that depth limits vary considerably for given levels of nutrients<br />
or Secchi depths (Nielsen et al. 2002). This means that the models may be useful to describe general<br />
relationships but cannot be used to predict depth limits precisely in specific areas.<br />
2.1.3<br />
Reference conditions and class boundary setting<br />
Reference conditions<br />
Modelling<br />
At present, no Danish and German coastal water bodies are considered to represent reference<br />
conditions, so we attempt to define reference levels of total-nitrogen concentrations (TN) and water<br />
transparency based on historical data and modeling.<br />
In order to define reference levels of benthic vegetation metrics by modeling there is a need for doseresponse<br />
relationships between physico-chemical variables (nutrient concentration, transparency)<br />
and vegetation metrics. The reference levels of nutrient concentration and/or transparency are<br />
entered in the model and corresponding levels of the vegetation metrics are calculated. In this<br />
approach the reference levels of nutrient concentration and transparency has been identified within<br />
Danish waters, where vegetation data are available i.e. Øresund.<br />
The model by Nielsen et al. (2002) was used to hind-cast reference depth limits based on reference<br />
TN levels. If reference TN levels are defined as e.g. 14 µM along open Danish coasts, then the<br />
corresponding reference eelgrass (Zostera marina) depth limits are 7.7 m. If the high-good boundary<br />
is defined as 25 % of reference levels, then the high/good boundary for eelgrass is 5.8 m.<br />
However, historical data suggest differences in reference depth limits between various coastal<br />
waters/estuaries so it may be an advantage to use historical information on reference depth limits or<br />
to use area-specific values of reference total-N to model reference depth limits.<br />
221
Historical data<br />
The reference depth limit is defined as the values >90 % of the historical values. Furthermore, it is<br />
assumed that the depth limit represents the eelgrass (Zostera marina) main distribution rather than<br />
the maximum depth limit.<br />
The most extensive historical data set of eelgrass depth distribution was <strong>report</strong>ed by Ostenfeld<br />
(1908) around year 1900. This dataset contains raw data on eelgrass depth distribution in Danish<br />
coastal waters representing samples taken from a ship with information on location, water depth<br />
and whether or not eelgrass was present. Based on these raw data Ostenfeld assessed the depth limit<br />
of eelgrass in various Danish coastal waters (e.g. Kattegat, Øresund, Little Belt) as the maximum<br />
depth where eelgrass was observed. We defined the reference depth limit for eelgrass as equaling the<br />
high-good boundary and defined this to represent 90 % of the historical maximum. This definition<br />
thus assumes that values above 90 % of the historical maximum represent a high ecological status/<br />
reference situation.<br />
It is observed that for the reference conditions there is a reasonable compliance between the<br />
historically-based and the modeled values, but there is a tendency that the modeled values are a bit<br />
lower than the data based on history (Table 2.1.2).<br />
German data show reference values of a “closed Zostera vegetation” at depth of 8.0-10.0 m<br />
Table 2.1.2: Historical level and the high/good boundary of the eelgrass (Zostera marina) depth limits defined as<br />
reference condition in Danish and German <strong>Water</strong>s in the Baltic Sea. The historical depth limits are based on Ostenfeld<br />
(1908) - for the western part of the Baltic Sea it is assumed that the depth limit is the same as for Kattegat, and we have<br />
excluded the Ostenfelds data from the Bøgestrømmen as the depth limit as it seems to be determined by the maximal<br />
limit of the area. The reference depth limits are defined as the values >90 % of the historical values.<br />
German values are after Schories et al. (2006)<br />
Zostera marina depth limit (m)<br />
Danish and German water areas<br />
In the Baltic Sea GIG<br />
Historical level<br />
Class boundary High/good<br />
(Reference)<br />
Storebælt and Langelandsbælt 10,4 9,4<br />
Lillebælt 8,5 7,7<br />
Smålandshavet – open part 8,5 7,7<br />
Østersøen, Fakse Bay 7,5 6,7<br />
Hjelm Bay 10,4 9,4<br />
German coast (German type B3) 10,0 8,0<br />
Boundary setting<br />
Denmark:<br />
The good-moderate boundary for eelgrass depth limits in Danish coastal waters has been calculated<br />
in three scenarios representing a 15 %, a 20 % and a 25 % deviation from reference levels (Krause-<br />
Jensen 2005). Based on an expert judgment the 15 % and the 20 % deviations are the best scenarios<br />
to comply with the normative definition of good ecological state (Krause-Jensen 2006). Populations<br />
of eelgrass growing at depths of 4.4 – 4.0 m in Limfjorden and a population of eelgrass in Kattegat<br />
growing at 8.1-7.6 m depth are examples of good growing conditions. Accordingly, it was<br />
concluded that 25 % deviation from the reference condition is not congruent with “slight changes of<br />
disturbance”.<br />
222
To underpin which of the 3 scenarios describing the boundary between good and moderate is most<br />
appropriate, a comparison with a model scenario was carried out. The model scenario enters the<br />
total nitrogen concentration, believed to represent the boundary between good and moderate into the<br />
empirical relationship between nutrient concentration and eelgrass depth limit (Nielsen et al. 2002).<br />
Jacob Carstensen (NERI) estimated the total nitrogen concentrations (TN) describing the reference<br />
condition and the good/moderate boundary for a number of Danish coastal waters. Similar values have<br />
been calculated for the German coast. The empirical relationship (Nielsen et al. 2002) is based on<br />
average TN-concentrations for the period March-October, while the Carstensen’s TN-concentrations<br />
are from the period January-June. Therefore, to correct the period a reduction is made (reducing the<br />
January-June data with 22.5 % compared to the March-October concentrations, Table 2.1.3).<br />
Table 2.1.4 compares the reference depth limits and the depth limits for good/moderate state<br />
calculated partly by the historical data and the modeled TN-concentrations. The empirical model<br />
used is not area-specific, but a general relationship for all Danish coastal waters, i.e. it does not take<br />
into account differences in the relationship between TN and depth limit between areas.<br />
Table 2.1.3: Total nitrogen concentrations, which define respectively, reference condition and the boundary between<br />
high/good and the good/moderate state. Danish data: Average values for the period January-June from Carstensen et al.<br />
(2006). German data from sub-working group “Physico-chemical quality elements” of Bund-Länder-Messprogramm<br />
(BLMP) Working group “WFD”. The good status was estimated as 50 % increase of reference.<br />
Baltic Sea GIG –<br />
Type B 12<br />
Total Nitrogen concentrations (μM)<br />
<strong>Water</strong> Reference Class boundary (high/good) Class boundary (good/moderate)<br />
Fakse Bay 16.6 17.6 19.6<br />
Hjelm Bay 16.6 17.7 19.8<br />
German coast 9 12 16<br />
Table 2.1.4: Eelgrass (Zostera marina) reference depth limit and depth limit for good/moderate state. Calculations based<br />
on historical eelgrass-data and modeled values derived from TN-concentrations. The empirical relation origins from<br />
Nielsen et al. (2002): lnZ c =6.039-0.755*lnTN, where Z c is the eelgrass depth limit and TN represent the period March-<br />
October. TN-values are calculated by Carstensen et al. (2006) – corrected by 22.5 % to adjust to March-October level.<br />
Baltic Sea GIG – Type B 12<br />
Danish Coastal waters Ref.<br />
Zostera marina depth limit (m)<br />
based on historical data<br />
Good/moderate (% of ref)<br />
15 % 20 % 25 %<br />
Zostera marina depth limit (m)<br />
modeled based on TN-concentration<br />
Ref. High/good Good/moderate<br />
Fakse Bay >6.7 5.7 5.4 5.0 8.3 8.0 7.3<br />
Østersøen Falster/Hjelm Bay >9.4 8.0 7.5 7.1 8.3 7.9 7.3<br />
German coast (German type B3) 10.0 8.0 7.0<br />
In Danish and German coastal waters, the dose-response relationships on present-time data do not<br />
include a range of nutrient concentrations representing reference levels or high/good boundaries.<br />
Reference levels for the benthic vegetation indicators therefore have to be set using historical data,<br />
hind-cast modeling and/or expert judgment. Reference levels have been shown to vary between<br />
areas in Denmark (Table 2.1.5), so we suggest that reference levels are defined for each area and<br />
that class boundary limits are defined as specified deviations from reference levels.<br />
The good/moderate boundary representing a 25-30 % deviation from reference levels and the<br />
resulting depth limits are shown in Table 2.1.6.<br />
223
Table 2.1.5: Eelgrass depth limit in the Danish coastal waters in the Baltic Sea: The historical depth limits are based on<br />
Ostenfeld (1908) - for the western part of the Baltic Sea it is assumed that the depth limit is the same as for Kattegat,<br />
and we have excluded the Ostenfelds data from the Bøgestrømmen as the depth limit as it seems to be determined by<br />
the maximal limit of the area. The reference depth limits are defined as the values >90 % of the historical values.<br />
For the Danish data the class boundary between good and moderate is described in 3 scenarios: 15 %, 20 % and 25 %<br />
of the reference value (reference Krause-Jensen (2005)) corresponding to EQR values = 0.85, 0.80 and 0.75.<br />
In addition a fourth scenario representing 30 % deviation was included.<br />
Danish water areas<br />
In the Baltic Sea GIG<br />
224<br />
Historical<br />
level<br />
Class boundary<br />
High/good<br />
(Reference)<br />
Zostera marina depth limit (m)<br />
15 % of<br />
ref.<br />
Class boundary good/moderate<br />
20 %<br />
Of ref.<br />
25 %<br />
of ref.<br />
Storebælt and Langelandsbælt 10,4 9,4 8,0 7,5 7,1 6,6<br />
Lillebælt 8,5 7,7 6,5 6,2 5,8 5,4<br />
Smålandshavet – open part 8,5 7,7 6,5 6,2 5,8 5,4<br />
Østersøen, Fakse Bay 7,5 6,7 5,7 5,4 5 4,7<br />
Hjelm Bay 10,4 9,4 8,0 7,5 7,1 6,6<br />
30 %<br />
of ref.<br />
Table 2.1.6: Eelgrass (Zostera marina) depth limits (m) for the reference conditions and for the good-moderate<br />
boundary in the Danish Baltic Sea <strong>intercalibration</strong> sites. The good-moderate boundary is defined as a 25-30 % deviation<br />
from reference conditions.<br />
Coastal area Reference Good/moderate boundary<br />
Baltic Sea GIG- Type B 12b<br />
Danish <strong>intercalibration</strong> sites<br />
Depth limit (m) Depth limit (m)<br />
Baltic Sea – Fakse Bay 6,7 5 – 4,7<br />
Baltic Sea – Hjelm Bay 9,4 7,1 – 6,6<br />
Germany<br />
In Germany from historical records eelgrass “stands” were defined as >50 shoots/m², which is<br />
the minimum end of a range of 50->2500 shoots/m² for the Baltic Sea (Schories et al. 2006). The<br />
historical depth limit of Zostera marina was assessed as 10 m for stands, while for single plants<br />
few records of deeper occurrence exist (down to 17 m). However, it has to be noted that seeds of<br />
Zostera may germinate at depths where germination is possible due to stored energy, but persisting<br />
occurrence of adult plants is not. Also, as in Denmark, the genuine historical depth limit of single<br />
plants remains unclear, since data were obtained with historical techniques.10 m is thus assumed as<br />
the historical depth limit.<br />
Through light-modelling (compare Blümel et al. 2002) and under the assumption that 10 % of the<br />
incident light is necessary to maintain Zostera stands, Schories et al. (2006) calculated depth limit<br />
for the WFD classes. Here they arbitrarily set certain percentages of light reduction (compared to<br />
pristine conditions) by enhanced attenuation and calculated border depth limits for Zostera stands<br />
and single plants (see Table 2.1.7).<br />
Schories et al. 2006 have for the German coast defined the eelgrass depth limit for good status to 7.0<br />
– 8.0 m and moderate status to 4.5 – 7.0 m for the intercalibrated type B12 (German type B3) with<br />
an application of the Danish 90 % rule to historical data, these values show a good fit to the Danish<br />
boundaries.
For the German coastal waters, <strong>intercalibration</strong> type B12b, TN concentrations representing High<br />
status were estimated to vary between 9 and 12 µM, and for Good status between 11 and16 µM<br />
(sub-working group “Physico-chemical quality elements” of Bund-Länder-Messprogramm (BLMP)<br />
Working group “WFD”). The good status was estimated as 50 % increase of reference.<br />
Table 2.1.7: German depth limits of Zostera marina from Schories et al. (2006) under the assumption of 10 % incident<br />
light necessary to maintain Zostera. As basis attenuation coefficient, K = 0.23025 was used.<br />
Classes Reduction of light,<br />
single plants<br />
Depth limits of<br />
single Zostera plants<br />
Tolerance reduction<br />
of Zostera stands<br />
Depth limits of<br />
stands<br />
High 0 – 1 % 9.63 – 10.00 0 – 6 % 8.12 – 10.00<br />
Good 1 – 5 % 8.39 – 9.62 6 – 10 % 7.21 – 8.11<br />
Moderate 5 – 25 % 4.89 – 8.38 10 – 30 % 4.32 – 7,20<br />
Poor 25 – 75 % 1.11 – 4.88 30 – 80 % 0.63 – 4.31<br />
Bad 75 – 100 % 0.00 – 1.10 80 – 100 % 0.00 – 0.63<br />
4.1.4<br />
Results of the comparison<br />
Comparison of Danish and German values based on experts’ opinions:<br />
Eelgrass depth limits for reference status and good-moderate boundary in the Danish and German<br />
<strong>Water</strong>s in the Baltic Sea.<br />
Coastal area Reference<br />
Danish Baltic 12b- GIG areas<br />
Good/moderate<br />
boundary<br />
Preliminar<br />
EQR values<br />
Baltic Sea – Fakse Bay 6,7 m 5 – 4,7 m 0.75 – 0.70<br />
Baltic Sea – facing Falster 9,4 m 7,1 – 6,6 m 0.75 – 0.70<br />
German Baltic 12b- GIG areas<br />
Geltinger Birk 8-10* m 7* m 0.88<br />
Darß-Zingst-Außenküste 8-10* m 7* m 0.88<br />
* These values represent the recommended thresholds for field monitoring, where the estimation of depth to the first or<br />
second decimal is futile. They are rounded and thus slightly different from those in Table 7.<br />
225
4.1.5<br />
226<br />
Results of the harmonisation – Boundary EQR values<br />
INTERCALIBRATION RESULTS<br />
Biological Quality Element Angiosperms<br />
Results<br />
BALTIC SEA GIG: Angiosperms <strong>intercalibration</strong> results.<br />
Depth limit eelgrass Zostera marina<br />
Type B12 Denmark<br />
Germany Open coast<br />
Final Results<br />
Reference<br />
conditions m<br />
Boundary<br />
H/G m<br />
Boundary<br />
G/M M<br />
EQR H/G EQR G/M<br />
9.4 (8 – 10.4) 8,5 (8 – 9.4) 7 (6.6 – 7.1) 0.90 0.74<br />
Biological Quality Element Angiosperms<br />
Angiosperms: parameter indicative of abundance (Depth limit of eelgrass Zostera marina)<br />
Results: Ecological quality ratios and parameter values<br />
Type and country Ecological Quality Ratios for the national<br />
classification systems<br />
CW B 12 b Denmark<br />
and Germany Open<br />
coast<br />
4.1.6<br />
High-Good boundary Good-Moderate<br />
boundary<br />
Parameter values/ranges Depth limit (m)<br />
eelgrass Zostera marina<br />
High/-Good<br />
boundary<br />
Good-Moderate<br />
boundary<br />
0.90 0.74 8.5 (8.0 – 9.4) 7 (6.6 – 7.1)<br />
Open issues and need for further work<br />
• Results have been achieved at parameter level ( depth limit of eelgrass, Zostera marina) for<br />
coverage and density by two countries (DK and DE) covering one type.<br />
• The metric used for angiosperms is not relevant for other countries in the GIG<br />
• More widely usable methods for coverage and density should be explored in most types.<br />
•<br />
The need for assessment methods related to taxonomic composition should be analysed.
2.2<br />
2.2.1<br />
NE Atlantic GIG<br />
Intercalibration approach<br />
In the NE Atlantic seven basic <strong>intercalibration</strong> types have been agreed. These are shown in table 1<br />
below:<br />
Table 2.2.1: NEA GIG typology.<br />
New Type ID Name Salinity<br />
(PSU)<br />
CW –NEA<br />
1/26a,b,c,d,e<br />
Exposed or sheltered,<br />
euhaline, shallow<br />
CW – NEA3/4 Polyhaline, exposed or<br />
moderately exposed<br />
(Wadden Sea type)<br />
CW – NEA7 Deep, low current,<br />
sheltered<br />
CW – NEA8 Polyhaline, microtidal,<br />
sheltered, shallow<br />
(Skagerrak inner arc type)<br />
CW – NEA9 Fjord with a shallow sill<br />
at the mouth with a very<br />
deep maximum depth<br />
in the central basin with<br />
poor deepwater exchange.<br />
CW – NEA10 Polyhaline, microtidal<br />
exposed, deep (Skaggerak<br />
outer arc type)<br />
TW – NEA11<br />
(will be split<br />
into subtypes)<br />
Fully saline<br />
(> 30)<br />
Polyhaline<br />
(18 - 30)<br />
Fully saline<br />
(> 30)<br />
Polyhaline<br />
(18 - 30)<br />
Polyhaline<br />
(18 - 30)<br />
Polyhaline<br />
(18 - 30)<br />
Transitional waters Oligo-<br />
Euhaline<br />
(0 - 35)<br />
Tidal range<br />
(m)<br />
Mesotidal<br />
(1 - 5)<br />
Mesotidal<br />
(1 - 5)<br />
Mesotidal<br />
(1 - 5)<br />
Microtidal<br />
(< 1)<br />
Microtidal<br />
(< 1)<br />
Microtidal<br />
(< 1)<br />
Mesotidal<br />
(1 – 5 )<br />
Depth<br />
(m)<br />
Shallow<br />
(< 30)<br />
Shallow<br />
(< 30)<br />
Deep<br />
(> 30)<br />
Shallow<br />
(< 30)<br />
Deep<br />
(> 30)<br />
Deep<br />
(> 30)<br />
Shallow<br />
(< 30)<br />
Current<br />
velocity<br />
Medium<br />
(1 - 3<br />
knots)<br />
Medium<br />
(1 - 3<br />
knots)<br />
low<br />
(< 1 knot)<br />
low<br />
(< 1 knot)<br />
low<br />
(< 1 knot)<br />
low<br />
(< 1 knot)<br />
Exposure Mixing Residence<br />
time<br />
Exposed or<br />
sheltered<br />
Fully mixed Days<br />
Exposed or<br />
moderately<br />
exposed<br />
Fully mixed Days<br />
Sheltered Fully mixed Days<br />
Medium Sheltered<br />
or<br />
moderately<br />
Exposed<br />
Sheltered Partially<br />
Stratified<br />
Sheltered Permanently<br />
Stratified<br />
Exposed Permanently<br />
Stratified<br />
The above types occur in Member State’s waters as detailed below in table 2.2.2:<br />
Table 2.2.2: Member States sharing types.<br />
Partially- or<br />
Permanently<br />
Stratified<br />
Days-<br />
Weeks<br />
Weeks<br />
Days<br />
Days-<br />
Weeks<br />
Type BE DK FR DE IE NL NO PT ES SE UK<br />
CW - NEA1/26a X X X X X<br />
CW - NEA1/26b X X X X<br />
CW- NEA1/26c X X<br />
CW- NEA1/26d X<br />
CW-NEA1/26e X X<br />
CW – NEA3/4 x x<br />
CW – NEA7 x x<br />
CW – NEA8 x x X<br />
CW – NEA9 x x<br />
CW – NEA10 x x<br />
TW – NEA11 x X X X X X X X<br />
Option 2 has been used in this phase of the <strong>intercalibration</strong> process. Two metrics have been selected, Intertidal Seagrass:<br />
Abundance (Areal extent and density) and species composition (in types NEA1/26a,b,c/3/4/11) and Subtidal Seagrass:<br />
Abundance (Areal extent and density) and species composition (in type NEA8). Boundaries have been agreed for some<br />
countries for each metric where applicable. This is described below.<br />
227
2.2.2<br />
228<br />
National methods that were intercalibrated<br />
Table 2.2.3 below indicates the components of the national methods that were considered for<br />
<strong>intercalibration</strong> for intertidal seagrass.<br />
It is important to note that:<br />
• Member states have different seagrass species and different numbers of species. Member states<br />
are considering standardising their percentage loss descriptors.<br />
• The Netherlands considers waterbody types 1 and 26 separately. Type 26 represents saline<br />
lakes.<br />
• Spain might only able to intercalibrate on taxonomic composition (from the three metrics<br />
proposed) because the Spanish area and density (% cover) metrics incorporate actual data (for<br />
seagrass, saltmarsh and macroalgae) not potential or historical data.<br />
• German seagrass data are derived from aerial monitoring and ground truth investigations.<br />
At present no differentiated data are available concerning species composition and coverage/<br />
density (per species). Accordingly only the bed extent of intertidal seagrass is ready to be<br />
classified. Future monitoring programs will help to close this gap.<br />
Table 2.2.3: National Methods.<br />
Member<br />
states<br />
Change in<br />
taxonomic<br />
composition<br />
Angiosperm metric<br />
Change in<br />
density<br />
Change in<br />
bed extent<br />
UK Yes Yes Yes<br />
Republic of<br />
Ireland<br />
Yes Yes Yes<br />
Netherlands Yes Yes Yes<br />
Germany Yes<br />
Spain<br />
Portugal<br />
France<br />
Under<br />
consideration<br />
Under<br />
consideration<br />
Under<br />
consideration<br />
Notes<br />
Intertidal seagrass Zostera noltii and<br />
Z. angustifolia & Ruppia sp.<br />
Intertidal seagrass Zostera noltii and<br />
Z. angustifolia & Ruppia sp.<br />
Intertidal seagrass beds; Zostera noltii<br />
& intertidal Z. marina<br />
Intertidal seagrass beds; Zostera noltii<br />
& intertidal Z. marina<br />
Habitat code 1110-A, 1110-B & 1140<br />
Below is a summary, table 4, of member states and waterbody types for intertidal seagrass<br />
<strong>intercalibration</strong>.<br />
Denmark and Sweden have assessed subtidal seagrass bed depth limits in the NEA8 typology (see<br />
below).
Table 2.2.4: Member States sharing types relevant to intertidal seagrass<br />
<strong>Water</strong>body<br />
types<br />
2.2.3<br />
UK<br />
Republic of<br />
Ireland<br />
Netherlands Germany Spain<br />
Portugal (for future<br />
<strong>intercalibration</strong>)<br />
CW-NEA1/26a, b CW-NEA1/26a, b CW-NEA1/26b CW-NEA1/26c CW-NEA1/26e<br />
CW-NEA7<br />
CW-NEA4 CW NEA 4<br />
TW-NEA11 TW-NEA11 TW-NEA11 TW-NEA11 TW-NEA11 TW-NEA11<br />
Reference conditions and class boundary setting<br />
The following <strong>intercalibration</strong> work between Netherlands, Ireland and the UK has been published<br />
by Foden and de Jong (2007).<br />
Metric - Intertidal Seagrass: Abundance (Areal extent and density) and species composition<br />
(NEA1/26a,b,c/3/4/11)<br />
This metric is only being fully intercalibrated between the Netherlands, Ireland, and UK. Germany<br />
currently only has bed extent data and is currently only intercalibrating on Metric 2 (Seagrass<br />
Abundance: acreage/bed extent), however when species data is available Germany should be able<br />
to participate in all the metrics. Spain have developed a separate metric which has not yet been<br />
intercalibrated, this will be completed Phase II of Intercalibration (see end of section for more<br />
details). This metric has been declared as not applicable by the other GIG Member States.<br />
Reference Conditions<br />
The reference conditions for seagrass for each of the chosen sub-metrics in the co-operating<br />
countries are defined as below. The assumption is made that these occur in unimpacted areas with<br />
unpolluted water quality and no hydromorphological alterations to the shore or seabed. Dutch<br />
waterbodies are embanked and may be classed as heavily modified. Although the waterbodies<br />
are managed and protected by engineering works, habitats such as seagrass beds have established<br />
naturally within them. Potential Reference Conditions (P-REF) and Potential Good Ecological<br />
Status (P-GES) are the highest two classes heavily modified waterbodies can attain, and scientists<br />
in the Netherlands have set values for these by focusing on the current situation in the waterbodies<br />
concerned (de Jong, 2004).<br />
German Reference conditions can be found in German Macroalgae & Angiosperm Annex: IC-<br />
Report Macroalgae and Angiosperms NEA GIG - Germany_05-2007.doc (Kolbe, 2007)<br />
Metric 1. Species Composition (NL, UK, IE)<br />
Table 2.2.5: NL species composition.<br />
Number of seagrass species<br />
REF GES Moderate Poor Bad<br />
2 species 1 species - - -<br />
229
Table 2.2.6: UK and IE species composition.<br />
Number of seagrass<br />
species<br />
230<br />
High/Ref Good Moderate Poor Bad<br />
No loss of<br />
species<br />
¼ to 1 /3 loss<br />
of species<br />
Loss of ½ of<br />
species.<br />
Loss of 2 /3 to<br />
¾ of species<br />
Metric 2. Seagrass Abundance: acreage/bed extent Composition (NL, UK, IE, DE)<br />
Table 2.2.7: NL seagrass acreage (hectares).<br />
<strong>Water</strong> type <strong>Water</strong>body REF GES<br />
Loss of all<br />
species<br />
Moderate Poor Bad<br />
50 % below GES<br />
CW-NEA4 Wadden Sea total 250 150 >112.5 112.5- 75 < 75<br />
CW-NEA4 Oosterschelde 1000 750 >563 563-375 < 375<br />
TW-NEA11 Ems-Dollard 100 50 >37.5 37.5-25.0 < 25.0<br />
TW-NEA11 Westerschelde 3 2 >1.5 1.5-1.0 < 1.0<br />
Table 2.2.8: UK AND IE seagrass bed extent: historical data and expert judgement establish the reference conditions<br />
for a seagrass bed to be compared with its current extent.<br />
High/Ref Good Moderate Poor Bad<br />
No loss in seagrass bed extent<br />
– at maximum potential and<br />
in equilibrium (within natural<br />
variability)<br />
Extent < 30 %<br />
loss from highest<br />
recorded<br />
30 – 50 % loss of<br />
bed extent<br />
50 – 70 % loss of<br />
bed extent<br />
Metric 3. Seagrass Abundance: coverage/density Composition (NL, UK, IE)<br />
> 70 % loss of<br />
bed extent<br />
Table 2.2.9: NL seagrass coverage as mean % cover per species. The present positions of the waterbodies are indicated<br />
(WZ = Wadden Sea, OS = Oosterschelde, ED = Ems-Dollard, WS = Westerschelde)<br />
REF GES Moderate Poor Bad<br />
Common Eelgrass (Zostera marina) >/= 30 >/= 20 >/= 10 >/= 5 < 5<br />
Dwarf grass-wrack (Zostera noltii) >/= 60 >/= 40 >/= 30 >/= 20 < 20<br />
<strong>Water</strong> WS OS, ED WZ<br />
Table 2.2.10: UK and IE seagrass density (% cover).<br />
High/Ref Good Moderate Poor Bad<br />
Bed density at or above ~highest<br />
previously recorded<br />
Density
Sub-metric to support Metrics 2 & 3 Trends in seagrass abundance<br />
Table 2.2.11: NL trends in seagrass acreage (bed extent) and coverage ( % density). The present trends of the<br />
waterbodies are indicated (WZ = Wadden Sea, OS = Oosterschelde, ED = Ems-Dollard, WS = Westerschelde).<br />
REF/GES Moderate<br />
Trend Positive/neutral Negative<br />
<strong>Water</strong> ED WZ WS<br />
UK (Foden & Brazier, 2007)<br />
Classification status for density is determined by the underlying trend over a period of 5-6 years,<br />
where data exist, to coincide with the WFD’s <strong>report</strong>ing cycle. The trend for an individual bed and<br />
the loss or gain, as compared with a maximum recorded density, can be used to identify whether the<br />
seagrass bed is in a state of degradation or recovery.<br />
Boundary Criteria<br />
Metric 1. Species Composition<br />
Most seagrass beds in the UK will comprise 1 or 2 species. Consequently, the NL and UK metrics<br />
are similar. The main difference is that no distinction can be made between High/Ref and Good<br />
for the UK metric because, for example, there are sublittoral beds of Z. marina that are naturally<br />
mono-specific and are at High status. The NL’s metric is not able to define conditions less than GES,<br />
whereas the UK metric has boundaries between Good and Moderate, and between Moderate and<br />
Poor/Bad. As the tool testing examples show (below) in most cases the outcomes of the NL metric<br />
and UK metric are generally the same.<br />
Metric 2. Seagrass Abundance: acreage/bed extent<br />
There are significant similarities between the NL and UK metric boundary conditions between each<br />
ecological status class for seagrass acreage/bed extent. With only four waterbodies the NL have been<br />
able to use modeling and expert judgement to set precise bed areas for REF and GES for each of<br />
those waterbodies. The average difference between REF and GES is ~30 % which is broadly in line<br />
with the UK’s more generalised boundary of a 30 % decrease in bed extent between High/Ref and<br />
Good. The mean difference between the NL’s Moderate and REF for all four waterbodies is ~50 %,<br />
between Poor and REF is ~70-75 % and between Bad and REF is >70 %. All of these boundaries are<br />
broadly in common with the UK/IE and Germany metric’s boundary conditions (see section 5.3.5).<br />
Metric 3. Seagrass Abundance: coverage/density<br />
As with bed extent, there are significant similarities between the NL and UK metric boundary<br />
conditions between each ecological status class for seagrass coverage/density. With only four<br />
waterbodies the NL have been able to use modeling and expert judgement to set precise density<br />
ranges for Z. noltii and Z. angustifolia, for REF and GES. The difference between NL’s REF and<br />
GES for both species is ~30 % which is broadly in line with the UK boundary of a 30 % difference<br />
between High/Ref and Good. For Z. noltii the difference between The NL’s Moderate and REF is 50<br />
%, which corresponds with the 50 % difference between Moderate and High for the UK metric. For<br />
Z. angustifolia there is a greater difference between The NL’s Moderate and REF (⅔) than between<br />
Moderate and High for the UK metric. However, only the Ems-Dollard waterbody will be assessed<br />
against this criterion because the other 3 waterbodies either comprise solely of Z. noltii or Z. noltii<br />
is the dominant species present.<br />
231
There is a difference of ⅔ between NL’s Poor and REF and >⅔ between Bad and REF, for Z. noltii.<br />
These boundaries are broadly in common with the UK metric’s boundary conditions of 70 % loss for Bad.<br />
Sub-metric to support Metrics 2 & 3 Trends in seagrass abundance<br />
Both NL and UK agree that the underlying trend in seagrass abundance should show a stable<br />
seagrass bed (at the maximum potential identified for that site/waterbody). If abundance is less<br />
than would be expected for High/Reference conditions then abundance should show a positive<br />
underlying trend, indicative of recovery. Conversely, a negative trend in seagrass abundance is<br />
undesirable, indicative of degradation, and would signal a potential deterioration in ecological class.<br />
Furthermore, the Member States agree that the ideal period over which to consider the trend in<br />
abundance is ~6 year, designed to coincide with the WFD <strong>report</strong>ing cycles.<br />
Testing Dutch waterbody data against NL and UK metrics; data for 2004<br />
NB. The analysis of German metric against NL and UK metrics information can be found in<br />
German Macroalgae & Angiosperm Annex: IC-Report Macroalgae and Angiosperms NEA GIG -<br />
Germany_05-2007.doc<br />
Wadden Sea, NL<br />
Table 2.2.12: Wadden Sea CW-NEA4.<br />
232<br />
1 – species composition 2 – acreage/bed extent 3 – coverage/bed density ( %)<br />
NL REF 2 species 250 ha.<br />
NL GES 1 species 150 ha.<br />
Current situation 2 species 47 ha. Z. noltii ≈40 %<br />
NL outcome REF Bad GES<br />
UK outcome No species lost = High<br />
19 % of reference<br />
conditions = Bad<br />
Z. marina var. angustifolia = ≥30<br />
Z. noltii = ≥60<br />
Z. marina var. angustifolia = ≥20<br />
Z. noltii = ≥40<br />
Previous highest recorded density was<br />
58 % in 1997. = Good<br />
The outcomes for the NL and UK metrics are comparable (Table 12). The only difference is for<br />
species composition where the loss of Z. angustifolia (littoral eelgrass) indicates a Moderate<br />
outcome for the UK metric rather than a GES outcome. The underlying trends in both seagrass bed<br />
extent (acreage) and density could be described as positive or neutral (Figure 1); so although the<br />
size of the bed is very small compared with the REF of 250 ha. It is possibly in a recovery phase.
Figure2.2.1: Temporal trends in<br />
Wadden Sea seagrass acreage<br />
(bed extent) and coverage (% density).<br />
Oosterschelde, NL<br />
Table 2.2.13: Oosterschelde CW-NEA4.<br />
Species composition Acreage/bed extent Coverage/bed density (%)<br />
NL REF 2 species 1000 ha.<br />
NL GES 1 species 750 ha.<br />
Current<br />
situation<br />
2 species 94 ha.<br />
Z. marina var. angustifolia = ≥30<br />
Z. noltii = ≥60<br />
Z. marina var. angustifolia = ≥20<br />
Z. noltii = ≥40<br />
Z. marina var. angustifolia = ≥30 in<br />
Roggenplaat, 5% cover) and coverage (%<br />
density)<br />
900<br />
800<br />
700<br />
600<br />
500<br />
400<br />
300<br />
200<br />
100<br />
0<br />
1973-77<br />
Seagrass area (ha. @ >5% cover) and<br />
coverage (% density)<br />
y = -60.187x + 653.32<br />
R 2 = 0.7284<br />
1975-79<br />
1979-83<br />
70<br />
60<br />
50<br />
40<br />
30<br />
20<br />
10<br />
y = 1.1408x - 2250.5<br />
R 2 = 0.0838<br />
~10 % of reference<br />
conditions = Bad<br />
1982-86<br />
Wadden Sea seagrass<br />
y = 0.6435x - 1243.3<br />
R 2 = 0.0216<br />
Area (ha.) Coverage (% density)<br />
0<br />
1990 1992 1994 1996 1998 2000 2002 2004 2006<br />
Year<br />
1984-88<br />
Oosterschelde seagrass<br />
1986-90<br />
1988-92<br />
Previous highest density was 50 % in 1979-<br />
1983; decline of ~35 % = Moderate<br />
Area (ha.) Coverage (% density)<br />
1991-95<br />
1993-97<br />
y = -0.9649x + 46.448<br />
1995-99<br />
R 2 = 0.2138<br />
1997-01<br />
1999-03<br />
Year ranges<br />
Figure 2.2.2: Temporal trends in Oosterschelde seagrass acreage (bed extent) and coverage<br />
(% density).<br />
233
The outcomes for the NL and UK metrics are broadly the same for the three metrics (Table 13).<br />
Both Z. noltii and Z. angustifolia are present. The underlying trend in seagrass bed extent (acreage)<br />
is strongly negative between 1973 and the beginning of the 1990s (Figure 2). Since then it has<br />
become neutral, with possibly a very slight increase in recent year. Z. noltii is the species considered<br />
for the density metric as it dominates the species composition; Z. angustifolia (littoral eelgrass)<br />
constitutes a very small proportion of the overall seagrass area at very low density therein. The most<br />
recent mean density calculation (62 %) lies on the boundary between the NL’s GES and Moderate.<br />
The trend in density could be described as neutral as there has been consistently low percentage<br />
cover (Figure 2).<br />
Ems-Dollard, NL<br />
Table 2.2.14: Ems-Dollard TW-NEA11.<br />
234<br />
Species composition Acreage/bed extent Coverage/bed density (%)<br />
NL REF 2 species 100 ha. Z. marina var. angustifolia = ≥30<br />
NL GES 1 species 50 ha. Z. marina var. angustifolia = ≥20<br />
Current situation 1 species 14 ha. Z. marina var. angustifolia ≈ 13 %<br />
NL outcome GES Bad Moderate<br />
UK outcome (No record of Z. noltii) = High<br />
~15 % of reference<br />
conditions = Bad<br />
Previous highest density was 30 % in<br />
1988; decline of ~55 % = Moderate<br />
The outcomes for the NL and UK metrics are the same in all three instances (Table 14). Z. noltii has<br />
not been recorded in this waterbody and the overall seagrass area is comprised of Z. angustifolia<br />
(littoral eelgrass) at low densities. The underlying trend in seagrass bed extent (acreage) is positive<br />
from 1986 to 2003, but drops sharply in 2004. The trend in density could be described as negative<br />
with the 2004 figure being one of the lowest since 1988.<br />
Area (ha. @>5% cover) and coverage<br />
(% density)<br />
100<br />
90<br />
80<br />
70<br />
60<br />
50<br />
40<br />
30<br />
20<br />
Area (ha.) Coverage (% density)<br />
Ems_Dollard seagrass<br />
y = 2.8547x - 5655.3<br />
R 2 = 0.215<br />
y = -0.7837x + 1583.7<br />
R 2 10<br />
= 0.4825<br />
0<br />
1986 1988 1990 1992 1994 1996 1998 2000 2002 2004 2006<br />
Year<br />
Figure 2.2.3: Temporal trends in Ems-Dollard seagrass acreage (bed extent) and coverage<br />
(% density).
Westerschelde, NL<br />
The Z. noltii bed is a small bed, situated in the harbour of Flushing-east, with an uncertain history.<br />
It might be that Z. noltii was present in the past (before the construction of the harbour) in the inlet<br />
(Sloe) between the two islands Walcheren (western side) and South Beveland (eastern side), but no<br />
records are available. Equally it might that it appeared there after the construction of the harbour.<br />
It is only mapped when a vegetation map is made of the small salt marsh that is present there. The<br />
cover is low, as it is a patchy bed in between the Spartina tussocks on the seaward side of the marsh.<br />
Estimated mean cover is between 5 and 20 %.<br />
Table 2.2.15: Westerschelde TW-NEA11.<br />
Species composition Acreage/bed extent Coverage/bed density ( %)<br />
NL REF 2 species 3 ha.<br />
NL GES 1 species 2 ha.<br />
Z. marina var. angustifolia = ≥30<br />
Z. noltii = ≥60<br />
Z. marina var. angustifolia = ≥20<br />
Z. noltii = ≥40<br />
Current situation 1 species 2 ha. Z. noltii ≈ 5-20 %<br />
NL outcome GES GES Poor (possibly Bad)<br />
UK outcome<br />
(No record of Z. marina<br />
var. angustifolia) = High<br />
~66 % of reference<br />
conditions = Good<br />
Previous highest density data<br />
unavailable, but cover is patchy.<br />
Therefore less than ‘Good’ –<br />
precautionary Moderate or Poor<br />
Moderate or Poor<br />
The outcomes for the NL and UK metrics are the same for species composition and acreage (bed<br />
extent), but differ for bed density (Table 15). In fact this latter difference is of minor significance<br />
because; (a) there is a lack of raw data to allow a more confident setting of class, and (b) both The<br />
NL and UK outcomes are less than Good, meaning a programme of investigative measures would<br />
be undertaken. The absence of raw data prevents a temporal trend plot over recent years for the<br />
Westerschelde.<br />
Testing UK waterbody data against NL and UK metrics<br />
Strangford Lough, UK (Portig, 2004)<br />
Historical data are scarce, but there has clearly been a marked decline in the distribution of<br />
seagrasses in Northern Ireland since 1930s. This has been coupled with a change in the dominant<br />
Zostera spp. present in the intertidal areas with Z. marina in its perennial form dominant in the<br />
1930s being replaced by Z. noltii and Z. angustifolia by 1970.<br />
There has been a general improvement in the status of Zostera spp. in the northern end of Strangford<br />
Lough during the last 10 years. The necessary data are lacking, however, to determine whether these<br />
changes are part of ongoing cyclical processes or longer term changes. The mean seagrass density<br />
for all N.I. (Northern Ireland) loughs is 52 %<br />
235
Table 2.2.16: Strangford Lough CW-NEA26 (CW8).<br />
Cover (% density)<br />
Current situation<br />
60<br />
50<br />
40<br />
30<br />
20<br />
10<br />
The outcomes for the NL and UK metrics are the same in all three instances (Table 16). The lack of<br />
raw data makes precise statements regarding seagrass acreage (bed extent) and coverage (density)<br />
difficult. The underlying trend in seagrass density is positive over the 4 survey years, confirming the<br />
judgement of the seagrass being in a ‘recovery’ phase.<br />
Fleet lagoon, UK (Bunker et al., 2004)<br />
Distribution changes in seagrass species of Fleet Lagoon, as surveyed in 2002 (Bunker et al., 2004):<br />
236<br />
Species composition Acreage/bed extent Coverage/bed density ( %)<br />
Z. marina var.<br />
angustifolia,<br />
Z. noltii,<br />
Z. marina,<br />
Ruppia spp.<br />
Strangford Lough seagrass<br />
924 ha. Literature and qualitative<br />
sources suggest the beds are in a<br />
‘recovery’ phase; i.e. expanding,<br />
but at less than maximum<br />
potential; assume >50 % and
2.2.4<br />
2. Power analysis shows a high % change in density (>50 % at the majority of stations) would<br />
have to occur to detect a statistically significant change; analysed for Type I and Type II errors<br />
(percentage change in mean density required in order to be 95 % confident that a statistically<br />
significant change has occurred).<br />
3. Previous surveys do not provide raw quadrat data so statistical comparison between data sets<br />
is not possible.<br />
Z. noltii density (% cover)<br />
100<br />
90<br />
80<br />
70<br />
60<br />
50<br />
40<br />
30<br />
20<br />
10<br />
0<br />
0 5 10 15 20 25 30 35 40 45 50<br />
Station number<br />
Figure 2.2.5: Standard deviation examples.<br />
Results of the comparison<br />
As option 2 has been used the boundaries have been agreed by experts representing all countries in<br />
the GIG angiosperms sub-group. Therefore the final agreed results presented below are the results<br />
of comparing expert views on what the boundaries should be.<br />
2.2.5 Results of the harmonisation – Boundary thresholds and EQR values<br />
Metric - Intertidal Seagrass: Abundance (Areal extent and density) and species composition<br />
(NEA1/26a,b/3/4/11)<br />
The Netherlands, Ireland and the UK have agreed a common matrix for allocating status to intertidal<br />
seagrass assessments on the basis of the table below. This matrix combines both loss of species and<br />
degradation in the % cover (measured as the number of seagrass shoots in a quadrat or % cover<br />
of seagrass within a quadrat). The matrix covers both situations where naturally either two or three<br />
species of seagrass are found within either a type or where there are differences within types in<br />
specified geographic areas. The appropriate selection from the matrix is made at the waterbody level.<br />
237
Table 2.2.17: Intertidal Seagrass: Abundance and Species composition classification boundary matrix.<br />
Density (% cover) 0 - 10 % lost 10 - 30 % lost 30 - 50 % lost 50 - 70 % lost >70 % lost<br />
Species<br />
238<br />
No spp. lost High Good Moderate Poor Bad<br />
1 spp. lost, 2 remain Good Good Moderate Poor Bad<br />
1 spp. lost, 1 remains Good Moderate Poor Bad Bad<br />
2 spp. lost, 1 remains Moderate Moderate Poor Bad Bad<br />
All spp. lost, therefore<br />
0 % cover<br />
The above matrix does not allow the true mathematical derivation of EQRs so the generic approach<br />
of allocating equal EQR ranges for status classes (as allowed by the boundary setting protocol) will<br />
apply; the EQR boundaries and ranges are shown below.<br />
Status EQR<br />
High 0.9 (0.8 – 1.0)<br />
Good 0.7 (0.6 – 0.8)<br />
Moderate 0.5 (0.4 – 0.6)<br />
Poor 0.3 (0.2 – 0.4)<br />
Bad 0.1 (0.0 – 0.2)<br />
France and Portugal are to consider using the above matrix and hope to decide by June 2007.<br />
Germany’s seagrass data are derived from aerial monitoring and ground truth investigations. At<br />
present no differentiated data are available concerning species composition and coverage/density<br />
(per species). Consequently Germany cannot yet participate in the species composition component.<br />
Future monitoring programs will help to close this gap.<br />
Metric - Intertidal seagrass area (acreage/bed extent) (NEA1/26a,b,c/3/4/11)<br />
This scheme has been agreed by UK, IE, NL and DE and is tabulated below:<br />
Table 2.2.18: Intertidal seagrass area (acreage/bed extent) classification boundary values.<br />
Member<br />
states<br />
UK<br />
Republic of<br />
Ireland<br />
Netherlands<br />
Germany<br />
Description of seagrass<br />
Intertidal<br />
seagrass beds<br />
Intertidal<br />
seagrass beds<br />
Z. noltii and<br />
mixed beds<br />
Z. noltii and<br />
mixed beds<br />
Change<br />
in area<br />
Change<br />
in area<br />
Change<br />
in area<br />
Change<br />
in area<br />
High<br />
(REF in NL)<br />
Good<br />
(GES in NL)<br />
Bad<br />
Moderate Poor Bad<br />
0 - 10 % loss 11 - 30 % loss 31 - 50 % loss 51 - 70 % loss >70 % loss<br />
0 - 10 % loss 11 - 30 % loss 31 - 50 % loss 51 - 70 % loss >70 % loss<br />
0-10 % loss<br />
(allowing for<br />
natural variation)<br />
11-30 % loss<br />
31 - 50 % loss<br />
from REF<br />
51 - 70 % loss<br />
from REF<br />
>70 % loss<br />
from REF<br />
0 - 10 % loss 11 - 30 % loss 31 - 50 % loss 51 - 70 % loss >70 % loss
The values in table 17 translate into the EQR boundary values and ranges shown below.<br />
Status EQR<br />
High 0.9 (0.8 – 1.0)<br />
Good 0.7 (0.6 – 0.8)<br />
Moderate 0.5 (0.4 – 0.6)<br />
Poor 0.3 (0.2 – 0.4)<br />
Bad 0.1 (0.0 – 0.2)<br />
Spain:<br />
Have developed an Angiosperm Intertidal/Subtidal Quality Index for their NEA Type 11 waters.<br />
Other countries have not yet tested the Spanish Angiosperm quality index and no comparison<br />
between the developed metrics has been made. Therefore the <strong>intercalibration</strong> for Spain will not be<br />
complete until testing has been carried and boundaries agreed for June 2007. Details of the metric<br />
proposed can be found in the detailed Milestone 6 Report.<br />
2.2.6 Open issues and need for further work<br />
Gaps for the future:<br />
• Spain will attempt to separate macroalgae and seagrass from their macrophyte tool, for<br />
<strong>intercalibration</strong> purposes<br />
• Development of saltmarsh tools is needed for most member states.<br />
• Questions of how to combine different sub-metrics into a higher level overall EQR.<br />
• Spain has to decide the metric to use for seagrass and improve it<br />
• Germany has to test and to decide using the combined metric intertidal seagrass abundance<br />
(density)/species composition<br />
Intercalibration for Saltmarsh will need to be undertaken at a future date.<br />
239
3<br />
240<br />
References<br />
Blümel C, Domin A, Krause J, Schubert M, Schiewer U, Schubert H (2002). Der historische Makrophytenbewuchs<br />
der inneren Gewässer der deutschen Ostseeküste. Rostock. Meeresbiol. Beitr. 10:5-111.<br />
Boström C, Baden SP, Krause-Jensen D. 2003 The seagrasses of Scandinavia and the Baltic Sea. In Green EP,<br />
Short FT (Eds) World atlas of seagrasses. California University Press. 310 pp.<br />
Bunker, F., T. Mercer & C. Howson, 2004. Fleet lagoon and tidal rapids survey 15th–22nd July 2002. Report<br />
to English Nature, 80 pp.<br />
Carstensen, J., Conley, D. J., Andersen, J., Ærtebjerg, G. (2006) Coastal eutrophication and trend reversal: a<br />
Danish case study. Limnology and Oceanography 51, pp. 398-408<br />
de Jong, D.J., 2004. <strong>Water</strong> <strong>Framework</strong> <strong>Directive</strong>: determination of the reference condition and Potential-<br />
REF/Potential-GES and formulation of indices for plants in the coastal waters CW-NEA3 (K1), CWNEA4<br />
(K2), CW-NEA1 (K3), transitional water, TW-NEA11 (O2), and large saline lakes, NEA26 (M32), in The<br />
Netherlands. (Working document RIKZ/OS/2004.832.x; final draft).<br />
Duarte CM. 1991. Seagrass depth limits. Aquat. Bot. 40: 363-377.<br />
Duarte CM. 1995. Submerged Aquatic Vegetation in Relation to Different Nutrient Regimes. Ophelia 41: 87-112.<br />
Foden, J. and Brazier, D.P., 2007. Angiosperms (seagrass) within the EU water framework directive: A UK<br />
perspective. Marine Pollution Bulletin 55: 181–195.<br />
Foden, J. and de Jong, D.J., 2007. Assessment metrics for littoral seagrass under the European <strong>Water</strong> <strong>Framework</strong><br />
<strong>Directive</strong>; outcomes of UK <strong>intercalibration</strong> with the Netherlands. Hydrobiologia 583(1): 383-383<br />
Hansson M, Håkansson B. 2006 Förslag till Vattendirektivets bedömningsgrunder för pelagiala vintertida<br />
näringsämnen och sommartida effektrelaterade i kust- och övergångsvatten<br />
Krause-Jensen D. 2005. Scenarier for klassifikation af kystvande vha. ålegræssets dybdegrænse<br />
Chapter 3.4 in Dahl K, Andersen JH, Riemann B (Eds) Carstensen J, Christiansen T, Krause-Jensen D,<br />
Josefson AB, Larsen MM, Petersen JK, Rasmussen MB, Stand J 2005: Redskaber til vurdering af miljøog<br />
naturkvalitet i de danske farvande. Typeinddeling, udvalgte indikatorer og eksempler på klassifikation.<br />
Danmarks Miljøundersøgelser. 158 p. – Technical <strong>report</strong> from NERI no. 535. (In Danish) http://<strong>technical</strong><strong>report</strong>s.dmu.dk<br />
Kolbe, K., 2007. Assessment of German Coastal <strong>Water</strong>s (NEA 1/26, NEA 3/4) and Transitional <strong>Water</strong>s (NEA<br />
11) by Macroalgae and Angiosperms. Intercalibration Report (NEA GIG).- (postal to D. Coates, D. Jowett).<br />
Krause-Jensen D, Greve TM, Nielsen K. 2005. Eelgrass as a bioindicator under the <strong>Water</strong> <strong>Framework</strong> <strong>Directive</strong>.<br />
<strong>Water</strong> Resources Management 19: 63-75.<br />
Magnusson J, Johnsen T.M, Beyer F, Gjøsæter J, Lømsland E.R, Sollie, Aa, 1999. Pollution monitoring in the<br />
Inner Oslofjord in 1998. NIVA-<strong>report</strong>. OR-4058. 63pp. In Norwegian (http://www.niva.no/).<br />
Nielsen SL, Sand-Jensen K, Borum J, Geertz-Hansen O. 2002. Depth colonization of eelgrass (Zostera marina)<br />
and macroalgae as determined by water transparency in Danish coastal waters. Estuaries 25: 1025-1032.<br />
Ostenfeld DH 1908.’Ålegræssets (Zostera marina) udbredelse I vore farvande’, in CGJ Petersen (ed), Beretning<br />
til landbrugsminiteriet fra den danske biologiske station XVI, Copenhagen, Centraltrykkeriet.<br />
Portig, A.A., 2004. The distribution of intertidal Zostera spp. in Northern Ireland, 2003. Report for Environment<br />
and Heritage Service p. 84.<br />
Schories D, Selig U, Schubert H. 2006. Testung des Klassifizierungsansatzes Mecklenburg-Vorpommern<br />
(innere Küstengewässer) unter den Bedingungen Schleswig-Holsteins und Ausdehnung des Ansatzes<br />
auf die Außenküste. Küstengewässer-Klassifizierung deutsche Ostsee nach EU-WRRL. Teil A: Äußere<br />
Küstengewässer.<br />
Valiela I, McClelland J, Hauxwell J, Behr PJ, Hersh D, Foreman K. 1997. Macroalgal blooms in shallow<br />
estuaries: Controls and ecophysiological and ecosystem consequences. Limnol. Oceanogr. 42:1105-1118.<br />
Øresundsvandsamarbejdet - Öresundsvattensamarbetet. 2004. Jämförelse mellan ‘urtida’ och ‘nutida’<br />
näringsnivåer i Öresund – beräkningar utförda med MIKE3-modell. www.oresundsvand.dk
European Commission<br />
EUR 23838 EN/3 – Joint Research Centre – Institute for Environment and Sustainability<br />
<strong>Water</strong> <strong>Framework</strong> <strong>Directive</strong> <strong>intercalibration</strong> <strong>technical</strong> <strong>report</strong> - Part 3: Coastal and Transitional waters<br />
Alessandro Carletti, Anna-Stiina Heiskanen<br />
Luxembourg: Office for Official Publications of the European Communities<br />
2009 – 240 pp. – 21 x 29,7 cm<br />
EUR – Scientific and Technical Research series – ISSN 1018-5593<br />
ISBN 978-92-79-12568-3<br />
DOI 10.2788/19561<br />
Abstract<br />
This Technical Report gives an overview of the <strong>technical</strong> and scientific work that has been carried out in<br />
the <strong>intercalibration</strong> of coastal and transitional waters ecological classification systems across the European<br />
Union as required by the <strong>Water</strong> <strong>Framework</strong> <strong>Directive</strong> (WFD). The results of this exercise were published in the<br />
Official Journal of the European Union as Commission Decision 2008/915/EC of 30 October 2008.
The mission of the <strong>JRC</strong> is to provide customer-driven scientific and <strong>technical</strong> support<br />
for the conception, development, implementation and monitoring of EU policies. As<br />
a service of the European Commission, the <strong>JRC</strong> functions as a reference centre of<br />
science and technology for the Union. Close to the policy-making process, it serves<br />
the common interest of the Member States, while being independent of special<br />
interests, whether private or national.<br />
14<br />
LB-NB-23838 EN/3-C