IRON OXIDE FILMS FOR in-situ MODEL CATALYSIS - PubMan
IRON OXIDE FILMS FOR in-situ MODEL CATALYSIS - PubMan
IRON OXIDE FILMS FOR in-situ MODEL CATALYSIS - PubMan

Create successful ePaper yourself
Turn your PDF publications into a flip-book with our unique Google optimized e-Paper software.
Post-reaction AES analysis showed always that the samples were at least partially covered by<br />
carbonaceous deposits (‘coke’) and LEED showed only diffuse background <strong>in</strong>tensity which<br />
<strong>in</strong>dicates disorder. In order to analyse the substrate phase, the coke was removed by one or<br />
several mild thermal programmed oxidation (TPO) cycles. The sample was heated <strong>in</strong> 10 -6<br />
mbar O2 at a rate of 5 K s -1 to 1000 K [33]. At this low pressure, reoxidation is k<strong>in</strong>etically<br />
h<strong>in</strong>dered so that the oxidation state of the substrate is not changed [18].<br />
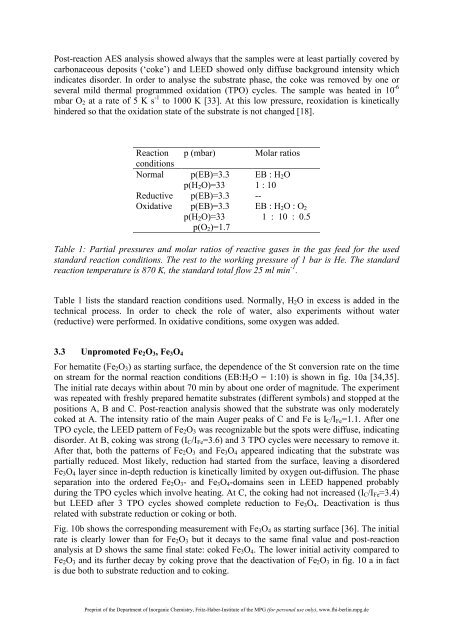
Reaction<br />
conditions<br />
p (mbar) Molar ratios<br />
Normal p(EB)=3.3 EB : H2O<br />
p(H2O)=33 1 : 10<br />
Reductive p(EB)=3.3 --<br />
Oxidative p(EB)=3.3 EB : H2O : O2<br />
p(H2O)=33<br />
p(O2)=1.7<br />
1 : 10 : 0.5<br />
Table 1: Partial pressures and molar ratios of reactive gases <strong>in</strong> the gas feed for the used<br />
standard reaction conditions. The rest to the work<strong>in</strong>g pressure of 1 bar is He. The standard<br />
reaction temperature is 870 K, the standard total flow 25 ml m<strong>in</strong> -1 .<br />
Table 1 lists the standard reaction conditions used. Normally, H2O <strong>in</strong> excess is added <strong>in</strong> the<br />
technical process. In order to check the role of water, also experiments without water<br />
(reductive) were performed. In oxidative conditions, some oxygen was added.<br />
3.3 Unpromoted Fe2O3, Fe3O4<br />
For hematite (Fe2O3) as start<strong>in</strong>g surface, the dependence of the St conversion rate on the time<br />
on stream for the normal reaction conditions (EB:H2O = 1:10) is shown <strong>in</strong> fig. 10a [34,35].<br />
The <strong>in</strong>itial rate decays with<strong>in</strong> about 70 m<strong>in</strong> by about one order of magnitude. The experiment<br />
was repeated with freshly prepared hematite substrates (different symbols) and stopped at the<br />
positions A, B and C. Post-reaction analysis showed that the substrate was only moderately<br />
coked at A. The <strong>in</strong>tensity ratio of the ma<strong>in</strong> Auger peaks of C and Fe is IC/IFe=1.1. After one<br />
TPO cycle, the LEED pattern of Fe2O3 was recognizable but the spots were diffuse, <strong>in</strong>dicat<strong>in</strong>g<br />
disorder. At B, cok<strong>in</strong>g was strong (IC/IFe=3.6) and 3 TPO cycles were necessary to remove it.<br />
After that, both the patterns of Fe2O3 and Fe3O4 appeared <strong>in</strong>dicat<strong>in</strong>g that the substrate was<br />
partially reduced. Most likely, reduction had started from the surface, leav<strong>in</strong>g a disordered<br />
Fe3O4 layer s<strong>in</strong>ce <strong>in</strong>-depth reduction is k<strong>in</strong>etically limited by oxygen out-diffusion. The phase<br />
separation <strong>in</strong>to the ordered Fe2O3- and Fe3O4-doma<strong>in</strong>s seen <strong>in</strong> LEED happened probably<br />
dur<strong>in</strong>g the TPO cycles which <strong>in</strong>volve heat<strong>in</strong>g. At C, the cok<strong>in</strong>g had not <strong>in</strong>creased (IC/IFe=3.4)<br />
but LEED after 3 TPO cycles showed complete reduction to Fe3O4. Deactivation is thus<br />
related with substrate reduction or cok<strong>in</strong>g or both.<br />
Fig. 10b shows the correspond<strong>in</strong>g measurement with Fe3O4 as start<strong>in</strong>g surface [36]. The <strong>in</strong>itial<br />
rate is clearly lower than for Fe2O3 but it decays to the same f<strong>in</strong>al value and post-reaction<br />
analysis at D shows the same f<strong>in</strong>al state: coked Fe3O4. The lower <strong>in</strong>itial activity compared to<br />
Fe2O3 and its further decay by cok<strong>in</strong>g prove that the deactivation of Fe2O3 <strong>in</strong> fig. 10 a <strong>in</strong> fact<br />
is due both to substrate reduction and to cok<strong>in</strong>g.<br />
Prepr<strong>in</strong>t of the Department of Inorganic Chemistry, Fritz-Haber-Institute of the MPG (for personal use only), www.fhi-berl<strong>in</strong>.mpg.de