CNPA BASIC PETROLEUM GEOLOGY TRAINING - CCOP
CNPA BASIC PETROLEUM GEOLOGY TRAINING - CCOP
CNPA BASIC PETROLEUM GEOLOGY TRAINING - CCOP

You also want an ePaper? Increase the reach of your titles
YUMPU automatically turns print PDFs into web optimized ePapers that Google loves.
5.0 WELL LOG ANALYSIS<br />
MODULE 5<br />
5.1 Wireline Geophysical Well Log<br />
– continuous recording of a geophysical parameter along a borehole.<br />
Table 5-1. Common wireline geophysical well measurements (Rider, 1996)<br />
Measurement Log Type Parameter Measured<br />
Mechanical Caliper Hole diameter<br />
Spontaneous Temperature Borehole temperature<br />
Self-Potential (SP) Spontaneous electrical currents<br />
Gamma Ray (GR) Natural radioactivity<br />
Induced Resistivity Resistance to electric current<br />
Induction Conductivity of electric current<br />
Sonic Velocity of sound propagation<br />
Density Reaction to gamma ray bombardment<br />
Photoelectric Reaction to gamma ray bombardment<br />
Neutron Reaction to neutron bombardment<br />
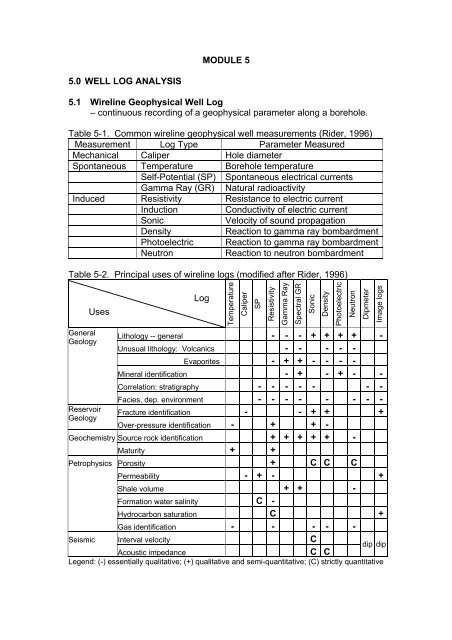
Table 5-2. Principal uses of wireline logs (modified after Rider, 1996)<br />
General<br />
Geology<br />
Uses<br />
Log<br />
Temperature<br />
Caliper<br />
Lithology -- general - - - + + + + -<br />
Unusual lithology: Volcanics - - - - -<br />
Evaporites - + + - - - -<br />
Mineral identification - + - + - -<br />
Correlation: stratigraphy - - - - - - -<br />
Facies, dep. environment - - - - - - - -<br />
Fracture identification - - + + +<br />
Reservoir<br />
Geology<br />
Over-pressure identification - + + -<br />
Geochemistry Source rock identification + + + + + -<br />
Maturity + +<br />
Petrophysics Porosity + C C C<br />
Permeability - + - +<br />
Shale volume + + -<br />
Formation water salinity C -<br />
Hydrocarbon saturation C +<br />
Gas identification - - - - -<br />
Seismic Interval velocity<br />
Acoustic impedance<br />
C<br />
C C<br />
dip dip<br />
Legend: (-) essentially qualitative; (+) qualitative and semi-quantitative; (C) strictly quantitative<br />
SP<br />
Resistivity<br />
Gamma Ray<br />
Spectral GR<br />
Sonic<br />
Density<br />
Photoelectric<br />
Neutron<br />
Dipmeter<br />
Image logs
5.1.1 Log Presentation<br />
The values of the parameter measured are plotted continuously against depth<br />
in the well. Hard copies of well logs are in standard API (American Petroleum<br />
Institute) log format. The overall log width is 8.25 in., with three tracks of 2.5<br />
in. wide each. A column 0.75 in. wide separates tracks 1 and 2 where the<br />
depths are indicated. Track 1 is always linear, with ten division of 0.25 in.<br />
while tracks 2 and 3 may have a linear scale similar to track1, a 4-cycle<br />
logarithmic scale, or a combination of logarithmic scale in track 2 and linear<br />
scale in track 3.<br />
For most well logs, the common vertical scales used are l:200 and 1:500 but<br />
for image logs (microresistivity) it is usually 1:20 and 1:40.<br />
Every log is preceded by a header. It shows pertinent information for proper<br />
interpretation of the log and in addition, some details of the well and the log<br />
run.<br />
5.1.2 The Logging Environment<br />
Pressure<br />
Formation pressure – the pressure under which the subsurface<br />
formation fluids and gases are confined.<br />
Hydrostatic pressure – the pressure exerted by a column of fluid. In<br />
the borehole, it is due to the column of drilling mud and is:<br />
Ph (psi) = 0.052 x height of fluid column (ft.) x density (ppg)<br />
Overpressure – any pressure above the hydrostatic (or normal)<br />
pressure<br />
Temperature<br />
Geothermal gradient<br />
G = 100 ( Tf −Ts)<br />
/ D<br />
Formation temperature<br />
Tf = Ts + G(D/100)<br />
G = geothermal gradient, °F/100 ft.<br />
Tf = formation temperature, °F<br />
Ts = surface temperature (80°F)<br />
D = depth of formation, ft.<br />
Graphical solution of formation temperature is provided by Schlumberger<br />
Gen-6 chart.
Borehole Geometry<br />
From caliper<br />
Gauged hole – diameter of hole is about equal to the bit size<br />
Increased borehole diameter<br />
Washout – general drilling wear, esp. in shaly zones and dipping beds,<br />
both caliper larger than bit size, considerable vertical extent<br />
Keyseat – asymmetric oval holes, formed by wear against the drill<br />
string at points where the borehole inclination changes<br />
(doglegs)<br />
Breakout – similar to keyseat but not due to doglegs, small brittle<br />
fractures (spalling) due to existing stress regime of the country<br />
rock<br />
Decreased borehole diameter<br />
- generally due to formation of mud cake<br />
Mud cake thickness = (bit size diameter – caliper diameter reading)/2<br />
- mud cake formation indicates permeability and involves loss of mud<br />
filtrate into a permeable formation – invasion.<br />
Invasion Profile<br />
Figure 5-1 (Gen-3, Schlumberger Charts) shows invasion by mud filtrate of a<br />
permeable bed in a borehole. Also shown are the nomenclature of the<br />
corresponding resistivities and saturations in each zone.
5.1.3 Process of Interpretation<br />
• Identify potential reservoir intervals; distinguish non-permeable, nonreservoir<br />
intervals from porous potential intervals.<br />
• Estimate thickness of the potential reservoirs.<br />
• Determine lithology (rock type) of the potential reservoirs.<br />
• Calculate porosity (Φ).<br />
• Determine resistivity of formation water (Rw).<br />
• Calculate water saturations (Sw, Sxo) using resistivity (Rt, Rxo).<br />
• Estimate in-place and movable hydrocarbons.<br />
Figure here (Flow chart for log interpretation, Asquith, p.104-5)<br />
5.2 Resistivity Logs<br />
Resistance is the opposition offered by a substance to the passage of electric<br />
current. Resistivity is the resistance measured between opposite faces of a<br />
unit cube of the substance at specified temperature. Resistivity is measured<br />
in ohm-meter 2 /meter, more commonly shortened to just ohm-meter.<br />
Resistivity logs do not always measure resistivity directly. Some resistivity<br />
logs (actually induction logs) measures conductivity instead which is the<br />
reciprocal of resistivity.<br />
resistivity (ohms m 2 /m)<br />
1× 1000<br />
= (millimhos/m)<br />
conductivity<br />
Induction logs are used in wells drilled with a relatively fresh-water mud (low<br />
salinity) to obtain more accurate value of true resistivity.<br />
Table 5-3. Principal uses of the resistivity and induction logs<br />
Used for Knowing<br />
Quantitative Fluid saturation:<br />
Formation water resistivity (Rw)<br />
Formation<br />
Mud filtrate resistivity (Rmf)<br />
Invaded zone<br />
Porosity (φ) [and F]<br />
(detect hydrocarbons) Temperature<br />
Semi- Texture Calibration with cores<br />
quantitative Lithology Mineral resistivities<br />
and Correlation<br />
qualitative Facies, bedding<br />
characteristics<br />
Gross lithologies<br />
Compaction, overpressure Normal pressure trends<br />
and shale porosity<br />
Source rock identification Sonic and density log values<br />
Source rock maturation Formation temperature
Figure 5-2. Idealized resistivity log.<br />
5.3 Spontaneous Potential and Gamma Ray<br />
The SP and GR logs measures naturally occurring physical phenomena in insitu<br />
rocks.<br />
5.3.1 Spontaneous Potential<br />
The SP log is a measurement of the natural potential difference or self<br />
potential between an electrode in the borehole and a reference electrode at<br />
the surface (problem with offshore wells, no ground). No artificial currents are<br />
applied.<br />
Three factors are necessary to produce an SP current:<br />
1. a conductive fluid in the borehole,<br />
2. a porous and permeable bed surrounded by an impermeable<br />
formation, and<br />
3. a difference in salinity (or pressure) between the borehole fluid<br />
and the formation fluid.
Figure 5-3. Idealized SP log.<br />
Table 5-3. Principal uses of the SP log<br />
Used for Knowing<br />
Quantitative Formation-water resistivity Mud filtrate resistivity and<br />
formation temperature<br />
Shale volume SSP (static SP) and shale line<br />
Qualitative Permeability indicator Shale line<br />
Facies (shaliness) Clay/Grain size relationships<br />
Correlation<br />
Bed Boundary Definition and Bed Resolution<br />
Sharpness of a bed boundary depends on the shape and extent of the SPO<br />
current patterns. When there is considerable difference between mud and<br />
formation water resistivity, currents will spread widely and the SP will deflect<br />
slowly: definition is poor. When the resistivities are similar, boundaries are<br />
sharper. In general, SP should not be used to determine bed boundaries. If it<br />
has to be used, place the bed boundary at the point of maximum curve slope.<br />
(GR defines bed boundaries better.)<br />
Shale Baseline and SSP<br />
SP has no absolute values and thus treated quantitatively and qualitatively in<br />
terms of deflection, which is the amount the curve moves to the left or to the<br />
right of a defined zero. The definition of the SP zero, called shale baseline, is<br />
made on thick shale intervals where the SP curve does not move. All values<br />
are related to the shale baseline.
The theoretical maximum deflection of the SP opposite permeable beds is<br />
called the static SP or SSP. It represents the SP value that would be<br />
measured in an ideal case with the permeable bed isolated electrically. It is<br />
the maximum possible SP opposite a permeable, water-bearing formation<br />
with no shale. The SSP is used to calculate formation-water resistivity (Rw).<br />
Formation-water Resistivity (Rw)<br />
(S)SP =<br />
( Rmf ) e<br />
− K log<br />
( Rw)<br />
e<br />
S(SP) = SP value: this should be the SSP<br />
(Rmf)e = equivalent mud filtrate resistivity: closely related to Rmf<br />
(Rw)e = equivalent formation water resistivity: closely related to Rw<br />
K = temperature-dependent coefficient<br />
K = 61+ (0.133 x T°F)<br />
K = 65 + (0.24 x T°C)<br />
Shale Volume<br />
PSP<br />
Vsh (%) = ( 1.<br />
0 − ) × 100<br />
SSP<br />
PSP (Pseudo-static SP) – the SP value in the water–bearing shaly sand zone<br />
read from the SP log.<br />
SSP (Static SP)– the maximum SP value in a clean sand zone.<br />
The formula simply assumes that the SP deflection between the shale base<br />
line (100% shale) and the static SP in a clean sand (0% shale) is proportional<br />
to the shale volume. This is qualitatively true but quantitatively there is no<br />
theoretical basis. Shale content from SP is subject to complications due to<br />
SP noise, Rw/Rmf contrast, HC content, and high salinity drilling fluids.
5.3.2 Gamma Ray<br />
Volume of Shale from GR<br />
Figure 5-4. Idealized GR and SGR log.<br />
Vsh = 0.33 [2 (2 x I )<br />
GR - 1.0]<br />
Vsh = 0.083 [2 (3.7 x I )<br />
GR - 1.0]<br />
I GR<br />
GR<br />
=<br />
GR<br />
log<br />
max<br />
− GR<br />
− GR<br />
min<br />
min
5.4 Porosity Calculations – sonic, density, and neutron logs<br />
5.4.1 Sonic<br />
Wyllie’s Time Average Equation<br />
Figure 5-5. Idealized Sonic log.<br />
∆t = Φ ∆tf + (1- Φ) ∆tma<br />
Φ = porosity<br />
∆t = log reading in microseconds/foot (µs/ft.)<br />
∆tf = transit time for the liquid filling the pore (usually 189 µs/ft.)<br />
∆tma = transit time for the rock type (matrix) comprising the formation<br />
Φ =<br />
∆t<br />
− ∆t<br />
∆t<br />
− ∆t<br />
f<br />
ma<br />
ma
5.4.2 Density<br />
Figure 5-6. Idealized Density log.<br />
ρb = Φ ρf + (1- Φ) ρma<br />
Φ = porosity<br />
ρ = log reading in microseconds/foot (µs/ft.)<br />
ρ f = transit time for the liquid filling the pore (usually 189 µs/ft.)<br />
ρ ma = transit time for the rock type (matrix) comprising the formation<br />
Φ =<br />
ρ<br />
ρ<br />
ma<br />
ma<br />
−<br />
ρb<br />
− ρ<br />
f
5.4.3 Neutron<br />
Read directly from logs<br />
May need matrix correction<br />
Φ =<br />
Figure 5-7. Idealized Neutron log.<br />
φ D + φN<br />
Φ =<br />
2<br />
φ D + φN<br />
2<br />
if no light hydrocarbons<br />
if light hydrocarbons as present
5.5 Water Saturation (Sw) Calculations<br />
Archie’s Equation<br />
F = Ro/Rw<br />
F = formation resistivity factor or simply formation factor<br />
Ro = resistivity of rock when water saturation is 1<br />
(100% saturated)<br />
Rw = resistivity of saturating water<br />
a<br />
F = m<br />
φ<br />
Φ =porosity<br />
a = cementation factor<br />
m = cementation exponent<br />
Figure 5-8. Schematic illustration of three formations with same porosity but<br />
different values of F (formation factor).<br />
Formation factor equations have been approximated through the years by<br />
various workers and the following are the commonly used.<br />
0.<br />
62<br />
F = 2.<br />
15<br />
φ<br />
best average for sands (Humble)<br />
0.<br />
81<br />
F = 2<br />
φ<br />
simplified Humble<br />
1<br />
F = 2<br />
φ<br />
compacted formations
Sw n = Ro/Rt<br />
Sw = water saturation<br />
Rt = resistivity of rock when Sw < 1<br />
Combining the above equations gives Archie’s equation, the most<br />
fundamental equation in well logging.<br />
Sw n =<br />
aRw<br />
m<br />
φ Rt<br />
Rw<br />
= F<br />
Rt<br />
Practical average Archie’s Equation – general equation for finding water<br />
saturation.<br />
Sw =<br />
0.<br />
62×<br />
Rw<br />
2.<br />
15<br />
φ × Rt<br />
Symbol Character Derived from<br />
Φ Porosity Porosity logs (sonic, neutron,<br />
0.<br />
62<br />
2.<br />
15<br />
φ<br />
density), cross-plots, etc.<br />
F (formation factor) Calculated using empirical formulae<br />
(e.g. Humble formula) and porosity as<br />
above<br />
Rw Formation water resistivity SP or laboratory measurements of<br />
resistivities of formation water<br />
Ro Rock resistivity saturated<br />
samples<br />
Ro = F x Rw (can only be calculated,<br />
100% with water<br />
cannot be measured with logs)<br />
Rt True formation resistivity Induction Logs and Laterologs (deep<br />
resistivity)<br />
Sw Water saturation of pores Sw hydrocarbons<br />
Ro<br />
=<br />
Sw100%<br />
water Rt<br />
Sw Calculations<br />
Conventional<br />
Quick look<br />
Rwa<br />
“F” overlay<br />
SP Quick Look<br />
Clean Formation<br />
Shaly