Heart Rate Analysis and Telemedicine: New Concepts & Maths
Heart Rate Analysis and Telemedicine: New Concepts & Maths
Heart Rate Analysis and Telemedicine: New Concepts & Maths

Create successful ePaper yourself
Turn your PDF publications into a flip-book with our unique Google optimized e-Paper software.
Acta Polytechnica Hungarica Vol. 5, No. 1, 2008<br />
<strong>Heart</strong> <strong>Rate</strong> <strong>Analysis</strong> <strong>and</strong> <strong>Telemedicine</strong>: <strong>New</strong><br />
<strong>Concepts</strong> & <strong>Maths</strong><br />
Sándor Khoór 1 , István Kecskés 2 , Ilona Kovács 3 , Dániel Verner 4 ,<br />
Arnold Remete 5 , Péter Jankovich 6 , Rudolf Bartus 7 , Nándor<br />
Stanko 8 , Norbert Schramm 9 , Michael Domijan 10 , Erika<br />
Domijan 11<br />
1, 3 Szent István Hospital, Budapest, Hungary<br />
3 BION Ltd2, Budapest, Hungary<br />
2, 4, 5, 6, 7, 8, 9 UVA, Subotica, Serbia<br />
10, 11 UVA, Toronto, Canada<br />
s<strong>and</strong>or.khoor@uva.ca, istvan.kecskes@uva.ca, ilona.kovacs@uva.ca,<br />
vernerd@gmail.com, rarnold83@gmail.com, fanatick@gmail.com,<br />
bartusr@gmail.com, n<strong>and</strong>or.stanko@gmail.com, norbert.schramm@gmail.com,<br />
michael.domijan@uva.ca, erika.domijan@uva.ca<br />
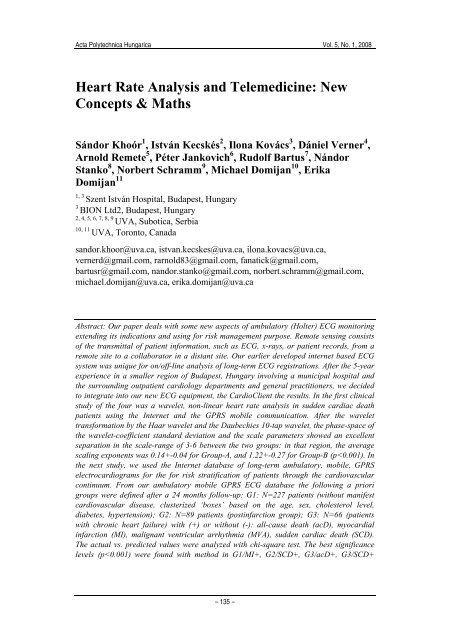
Abstract: Our paper deals with some new aspects of ambulatory (Holter) ECG monitoring<br />
extending its indications <strong>and</strong> using for risk management purpose. Remote sensing consists<br />
of the transmittal of patient information, such as ECG, x-rays, or patient records, from a<br />
remote site to a collaborator in a distant site. Our earlier developed internet based ECG<br />
system was unique for on/off-line analysis of long-term ECG registrations. After the 5-year<br />
experience in a smaller region of Budapest, Hungary involving a municipal hospital <strong>and</strong><br />
the surrounding outpatient cardiology departments <strong>and</strong> general practitioners, we decided<br />
to integrate into our new ECG equipment, the CardioClient the results. In the first clinical<br />
study of the four was a wavelet, non-linear heart rate analysis in sudden cardiac death<br />
patients using the Internet <strong>and</strong> the GPRS mobile communication. After the wavelet<br />
transformation by the Haar wavelet <strong>and</strong> the Daubechies 10-tap wavelet, the phase-space of<br />
the wavelet-coefficient st<strong>and</strong>ard deviation <strong>and</strong> the scale parameters showed an excellent<br />
separation in the scale-range of 3-6 between the two groups: in that region, the average<br />
scaling exponents was 0.14+-0.04 for Group-A, <strong>and</strong> 1.22+-0.27 for Group-B (p
S. Khoór et al. <strong>Heart</strong> <strong>Rate</strong> <strong>Analysis</strong> <strong>and</strong> <strong>Telemedicine</strong>: <strong>New</strong> <strong>Concepts</strong> & <strong>Maths</strong><br />
groups. In the third study a wavelet analysis of late potentials based on long-term, highresolution,<br />
mobile, GPRS ECG data was performed. These pathological changes were also<br />
detected by the Haar <strong>and</strong> Daubechies_4 wavelets, but in a narrower space (110-128 ms<br />
<strong>and</strong> 180-240) <strong>and</strong> with lesser significance (p
Acta Polytechnica Hungarica Vol. 5, No. 1, 2008<br />
hours time-delay a message generate. In the case of significant changes of these<br />
non-invasive parameters, the pts get a message to attend the cardiologist. The less<br />
significant changes of the parameters elongate the monitoring for days (it means<br />
the ‘continuous’). During the on-line monitoring, the conventional pathologic ECG<br />
signs (arrhythmia, definitive morphological changes) send a warning massage to<br />
the patient, the GP <strong>and</strong> the cardiologist.<br />
3 Clinical Concerns<br />
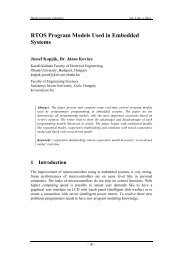
Figure 1<br />
The architecture of the mobile telemedicine system<br />
Up to now, the prediction of atrial fibrillation (AF) recurrence <strong>and</strong> of sudden<br />
cardiac death (SCD) is unsolved [2-5]. Sudden cardiac deaths occur >= 75% at<br />
home <strong>and</strong> the patients` chance of arriving the hospital alive is in the range of 3% to<br />
5%. How to do the prevention more effectively <strong>and</strong> economically - that is the<br />
important question. The arrhythmia risk stratification in CHF or other cardiac<br />
disease for the improvement of the prognosis <strong>and</strong> the prevention of SCD is<br />
essential. Using our mobile, internet, long-term ECG, the indications of the<br />
ambulatory (Holter) ECG could be extended to a larger population. Some works in<br />
these areas are presented in this paper, where more sophisticated math analysis was<br />
used on the long-term ECG recordings.<br />
– 137 –
S. Khoór et al. <strong>Heart</strong> <strong>Rate</strong> <strong>Analysis</strong> <strong>and</strong> <strong>Telemedicine</strong>: <strong>New</strong> <strong>Concepts</strong> & <strong>Maths</strong><br />
3.1 Wavelet, Non-Linear <strong>Heart</strong> <strong>Rate</strong> <strong>Analysis</strong> in Sudden<br />
Cardiac Death Patients Using the Internet <strong>and</strong> the GPRS<br />
Mobile Communication<br />
The first aim of our study was to develop an effective ECG surveillance system for<br />
the prevention of sudden cardiac death (SCD) <strong>and</strong> determine the most powerful<br />
beat-to-beat heart rate dynamic values as indicators for this monitoring. The second<br />
aim was to determine the role of non-linear heart rate variability indexes in a<br />
sudden cardiac death (SCD) population [6-8]. The analysis based on the data of 27<br />
chronic heart failure patients with SCD (Group-A) <strong>and</strong> 27 without (Group-B) it,<br />
which was selected from a 168 chronic heart failure patients population monitored<br />
for 24 hours two weekly. The inclusion criteria were Holter recordings at least 2<br />
weeks before the SCD (the patients were monitored weekly), absence of acute<br />
myocardial infarction in the previous 1 year. SCD was defined as death occurring<br />
within 15 minutes of a change in symptoms or during sleep. Clinical features of the<br />
two groups: male/female (Group-A: 14/13, Group-B 14/13; age: 62.4±7, 59.7±6;<br />
CAD: 22, 21; other cause: 5, 6; NYHA II. class: 18, 17; NYHA III. Class 9, 10;<br />
EF: 36.2±6, 36.9±5, respectively).<br />
We used multiresolution wavelet analysis for the 24 hour R-R interbeat time-series.<br />
After the wavelet transformation by the Haar wavelet <strong>and</strong> the Daubechies 10-tap<br />
wavelet, the phase-space of the wavelet-coefficient st<strong>and</strong>ard deviation <strong>and</strong> the scale<br />
parameters showed an excellent separation in the scale-range of 3-6 between the<br />
two groups: in that region, the average scaling exponents was 0.14±0.04 for Group-<br />
A, <strong>and</strong> 1.22±0.27 for Group-B (p
Acta Polytechnica Hungarica Vol. 5, No. 1, 2008<br />
3.2 Internet Database of Long-Term Ambulatory, Mobile,<br />
GPRS Electrocardiograms for the for Risk Stratification of<br />
Patients through the Cardiovascular Continuum<br />
In this work we present a telemedicine application using an internet ECG database<br />
for risk stratification of patients with various cardiovascular disease state. The data<br />
mining [9,10] serves for indexing (finding the most similar time series in the<br />
database given a query time series Q, <strong>and</strong> some similarity/dissimilarity measure<br />
D(Q,C). The PAA method was used in this study.<br />
From our ambulatory mobile GPRS ECG database the following a priori groups<br />
were defined after a 24 months follow-up: G1: N=227 patients (without manifest<br />
cardiovascular disease, clusterized ‘boxes’ based on the age, sex, cholesterol level,<br />
diabetes, hypertension); G2: N=89 patients (postinfarction group); G3: N=66<br />
(patients with chronic heart failure) with (+) or without (-): all-cause death (acD),<br />
myocardial infarction (MI), malignant ventricular arrhythmia (MVA), sudden<br />
cardiac death (SCD).<br />
The dimensionality reduction via PAA was used, where a time series C of length n<br />
can be represented in a w-dimensional space by a vector C¯=c1¯,… cw¯. The ith<br />
element of C¯ is calculated:<br />
Ci¯ = w/n j=n/w(i-1)+1Σ (n/w) I Cj<br />
The dimension of time series is reduced from n to w, the data is divided into w<br />
equal sized frames. The mean value of the data falling within a frame is calculated<br />
<strong>and</strong> a vector of these values becomes the data-reduced representation. The Haar<br />
wavelet approximation was used in our study – the principle was the same as in<br />
PAA. Each time series was normalized (a mean of zero <strong>and</strong> a st<strong>and</strong>ard deviation of<br />
one). A 128 length data segment was used for discretization, the lookup table<br />
contains the breakpoints calculated from the Gaussian distribution. The Euclidean<br />
distance of two time series Q <strong>and</strong> C of the same length n is:<br />
D(Q,C) = √¯ i=1Σ n (qi - ci) 2<br />
During the 18 months testing period an other 136 patients (the patient groups were<br />
identical: G1, G2, <strong>and</strong> G3) examined <strong>and</strong> the results (predicted four end-point: acD,<br />
MI, MVA, <strong>and</strong> SCD) formed the a posteriori groups. The actual vs. predicted<br />
values were analyzed with chi-square test. The best significance levels (p
S. Khoór et al. <strong>Heart</strong> <strong>Rate</strong> <strong>Analysis</strong> <strong>and</strong> <strong>Telemedicine</strong>: <strong>New</strong> <strong>Concepts</strong> & <strong>Maths</strong><br />
3.3 Wavelet <strong>Analysis</strong> of Late Potentials based on Long-Term,<br />
High-Resolution, Mobile, GPRS ECG Data<br />
The time-frequency analysis of left ventricular late potentials is a more<br />
sophisticated method than the commercial ones. Some authors used the wavelet<br />
method which would be the best solution for the analysis of this kind of data [11-<br />
14].<br />
The ECGs was recorded with 32-bit A/D converter <strong>and</strong> a sampling frequency of 1<br />
kHz, <strong>and</strong> a modified V1-V3 bipolar leads were used for the registrations. The<br />
analysis based on 10,000 (approximately 3 hours) QRS windows starting 100 ms<br />
before <strong>and</strong> 250 ms after the QRS onset. The Haar, the Daubechies_4 <strong>and</strong> the<br />
Morlet (frequency parameter (c) = 2*π*5.33) wavelets were used in the<br />
calculations. The Morlet wavelet HR-ECG analysis used a combined wavelet<br />
stratification method of Couderc <strong>and</strong> Selmaoui [10, 11]. In this case, the wavelet<br />
transform was applied on 512 (=2 9 ) points, from 128 ms before the beginning of<br />
the QRS to 384 ms after QRS onset. Ten different scales were calculated from the<br />
modified V1-V3 leads of our GPRS ECG. This single lead was used as the<br />
calculated magnitude vector (MV) of st<strong>and</strong>ard are differ from the XYZ leads<br />
analysis. Using the discrete wavelet transform for the Morlet wavelet, first it<br />
computed in the frequency domain <strong>and</strong> then in the time domain. Using a set of<br />
discrete scaling parameters each signal is decomposed into a set of 10 b<strong>and</strong>pass<br />
beat signal logarithmically equally spaced with a centre frequencies from 40 Hz to<br />
250 Hz. The scaling exponent (m) varying linearly between 1.96 <strong>and</strong> 4.20 by steps<br />
of 0.25. The energy was the third dimension of the time-scale plane (means of the<br />
wavelet coefficients values at scale s <strong>and</strong> sample n) which was plotted with a color<br />
scale.<br />
The discrete, dyadic wavelet calculations were used for the the Haar, <strong>and</strong> the<br />
Daubechies_4 wavelets. The 4 coefficients of Daub-4 waves: C0 = 0.6830127, C1 =<br />
1.1830127, C2 = 0.3169873, C3 = - 0.1830127. The DWT of Haar <strong>and</strong> Daub-4<br />
wavelet transform was applied on the same 512 (=2 9 ) points as in the Morlet<br />
transform.<br />
The study population consists of two postinfarction groups: Group-A: malignant<br />
ventricular arrhythmia or sudden cardiac death (N= 21; age: 60.3±11; male:13),<br />
Group-B: without them (N= 96; age:61.7±12; male 52). All patients were followed<br />
for 24 months, the GPRS 24 hour mobile ECG was repeated monthly.<br />
For the analysis of the two groups the wavelet energy was changed for the mean<br />
square of wavelet coefficients, <strong>and</strong> the statistical p-value of the ANOVA test<br />
between the two groups was used. Abnormal time-frequency components were<br />
found between 90 <strong>and</strong> 130 ms after QRS onset in the 55-106 <strong>and</strong> in the 155-250 Hz<br />
frequency range, the p-values were < 0.001 with the Morlet waves (Figure 3).<br />
– 140 –
Acta Polytechnica Hungarica Vol. 5, No. 1, 2008<br />
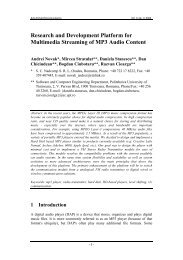
Figure 3<br />
The ellipse shows the Region-of-Interest (ROI) of late potentials in the scalogram. The colors represents<br />
the SD values in the time-scale map. Black line: part of the ECG, the time-window: 512 ms.<br />
These pathological changes were also detected by the Haar <strong>and</strong> Daubechies_4<br />
wavelets, but in a narrower space (110-128 ms <strong>and</strong> 180-240) <strong>and</strong> with lesser<br />
significance (p
S. Khoór et al. <strong>Heart</strong> <strong>Rate</strong> <strong>Analysis</strong> <strong>and</strong> <strong>Telemedicine</strong>: <strong>New</strong> <strong>Concepts</strong> & <strong>Maths</strong><br />
R-wave detection (smooth – first derivative – largest deflection), the signal<br />
averaging in all time windows around the detected R-waves, the determination of<br />
template QRS by averaging the deflections in the corresponding time. For the<br />
measurement of complexity [15-17], the Grassberger-Procaccia Algorithm (GPA)<br />
was used, its main principle is to determine the correlation dimension using the<br />
correlation integral.<br />
The CI of a (chaotic) deterministic system is given by<br />
Cm(r) = Ar D e -mldΔtK ,<br />
A is a constant, D the correlation dimension, K is the correlation entropy, m the<br />
embedding dimension, l the embedding delay <strong>and</strong> Δt the sample interval.<br />
Cm(N,r)= 1/Ndis Σi={i_ref} Σj= /i/ >=W Θ( r-|x(i)-x(j)| )<br />
where N = L-(m-1)l is the number of delay vectors resulting from the time series of<br />
length L in reconstructed phase space of embedding dimension m. The Heaviside Θ<br />
(theta) is 1 for positive arguments <strong>and</strong> 0 otherwise. The inner sum counts the<br />
number of delay vectors within a distance r from a reference vector. The outer sum<br />
adds the results over a set {iref} of reference vectors <strong>and</strong> the normalization factor<br />
Ndis is the total number of distance involved int he summations. We used 10000<br />
r<strong>and</strong>omly chosen reference vectors, which is equal to one third of the number of<br />
samples int he time series (sampled down to 30000 samples) as suggested Theiler.<br />
The steps of the GPA were:<br />
- The Correlation Integral (Cm(r)) dimension for different embedding<br />
(delayed) dimension (m) is calculated.<br />
- If (Cm(r)) shows scaling (=linear part on double logarithmic scale) the<br />
Correlation Dimension (D) <strong>and</strong> Correlation entropy (K) are estimated with<br />
coarse-grained Dcg <strong>and</strong> Kcg.<br />
- If (Cm(r)) shows no scaling a distance r <strong>and</strong> an embedding dimension m are<br />
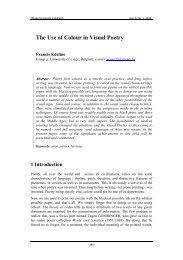
chosen at which the coarse-grained Dcg <strong>and</strong> Kcg are estimated. Figure 4<br />
shows the Correlation Integral (Cm(r)) dimension for different embedding<br />
(delayed) dimension (m); if (Cm(r)) shows scaling (=linear part on double<br />
logarithmic scale) the Correlation Dimension (D) <strong>and</strong> Correlation entropy<br />
(K) are estimated with coarse-grained Dcg <strong>and</strong> Kcg.<br />
The amplitude values of CI, CD, CE at various m were determined with their<br />
coarse-grained values. The DSC model selects the best parameters stepwise, the<br />
entry or removal based on the minimalization of the Wilks’ lambda. Three<br />
variables remained finally: x1=CI mean-value at log(r)=-1.0 (m9-14), x2=CI meanvalue<br />
at log(r)=-0.5 (m12-17), <strong>and</strong> x3=CD_cg. The Wilks’ lambda was 0.011, chisquare<br />
299.68, significancy: p
Acta Polytechnica Hungarica Vol. 5, No. 1, 2008<br />
log C_m(r)<br />
0<br />
-1<br />
-2<br />
-3<br />
-4<br />
-5<br />
-6<br />
Correlation integral<br />
-7<br />
scaling region<br />
-2 -1,5 -1 -0,5 0<br />
log r<br />
– 143 –<br />
coarsegrained<br />
resolution<br />
Figure 4<br />
The relation of Correlation Integral (Cm(r)) to r value with the scaling region<br />
Acknowledgment<br />
The internet based ECG system combines the advantages of online <strong>and</strong> offline<br />
monitoring. Using various risk scores as predictor values, the telemedicine ECG<br />
management would be designed. The worsening indicator parameters indicate<br />
immediate change of patient management (re-checking the clinical signs <strong>and</strong><br />
symptoms, change of therapy, hospital admission). In the case of borderline<br />
decision situation (mild change of the indicator values) the ambulatory registration<br />
will extend for longer time or repeat more frequently. The accessibility to the<br />
st<strong>and</strong>ard medical care of the moderate to high risk cardiovascular patients is<br />
markedly increased. The frequent <strong>and</strong> repeated ECG monitoring put the patient to<br />
the ‘good place in good time’ preventing from serious or lethal complications. The<br />
opinion of The Task Force Committee on <strong>Heart</strong> <strong>Rate</strong> Variability (in 1996!) was:<br />
‘At present, the nonlinear methods represent potential tool for HRV assessment.<br />
Advances in technology <strong>and</strong> the interpretation of the results of nonlinear methods<br />
are needed before these methods are ready for physiological <strong>and</strong> clinical studies.’<br />
Our studies show that more sophisticated math analysis of heart-rate variability,<br />
beat-to-beat analysis in atrial fibrillation would be real tools in cardiology. As<br />
repeating our question (Congress of ESC, 2002): ‘Internet-based continuous Holter<br />
monitoring for the prevention of sudden cardiac death: Is this the Rosetta stone <strong>and</strong><br />
Who will be Mr. Champollion?’.<br />
References<br />
[1] Khoór S, Nieberl J, Fügedi K, Kail E: Internet-based, GPRS, Long-Term<br />
ECG Monitoring <strong>and</strong> Non-Linear <strong>Heart</strong>-<strong>Rate</strong> <strong>Analysis</strong> for Cardiovascular<br />
<strong>Telemedicine</strong> Management. Computers in Cardiology, 2003; 28:209-212<br />
m_2<br />
m_4<br />
m_6<br />
m_8<br />
m_10<br />
m_12<br />
m_14<br />
m_16<br />
m_18<br />
m_20
S. Khoór et al. <strong>Heart</strong> <strong>Rate</strong> <strong>Analysis</strong> <strong>and</strong> <strong>Telemedicine</strong>: <strong>New</strong> <strong>Concepts</strong> & <strong>Maths</strong><br />
[2] Malik M et al: <strong>Heart</strong> <strong>Rate</strong> Variability. St<strong>and</strong>ards of Measurement,<br />
Physiological Interpretation <strong>and</strong> Clinical Use. Task Force of the European<br />
Society of Cardiology <strong>and</strong> the North American Society of Pacing <strong>and</strong><br />
Electrophysiology. Circulation, 93:1043-1065, 1996<br />
[3] Priori SG, Aliot E, Blomstrom-Lundqvist C, et al. Task Force on Sudden<br />
Cardiac Death of the European Society of Cardiology. Eur <strong>Heart</strong> J, 2001;<br />
22: 1374-450<br />
[4] Fuster V, Ryden LE, Asinger RW, et al. ACC/AHA/ESC Guidelines for<br />
the Management of Patients with Atrial Fibrillation. Circulation, 2001;<br />
104:2118-50<br />
[5] Grimm W, Glaveris C, Hoffmann J, et al: Arrhythmia Risk Stratification in<br />
Idiopathic Dilated Cardiomyopathy Based on Echocardiography <strong>and</strong> 12-<br />
Lead, Signal Averaged, <strong>and</strong> 24-Hour Holter Electrocardiography. Am H J,<br />
140:43-51, 2000<br />
[6] Huikuri HV, Seppänen T, Koistinen MJ, et al.: Abnormalities in Beat-to-<br />
Beat Dynamics of <strong>Heart</strong> <strong>Rate</strong> before the Spontaneous Onset of Life<br />
Threatening Ventricular Tachyarrhythmias in Patients with Prior<br />
Myocardial Infarction. Circulation, 1996; 93:1836-44<br />
[7] Thurner S, Feurstein MC, Teich MC. Multiresolution Wavelet <strong>Analysis</strong> of<br />
<strong>Heart</strong>beat Intervals Discriminates Healthy Patients from those with Cardiac<br />
Pathology. Phys Rev Lett, 1998; 80:1544-47<br />
[8] Ashkenazy Y, Lewkowicz M, Levitan J, et al.: Scale-Specific <strong>and</strong> Scale-<br />
Independent Measures of <strong>Heart</strong> <strong>Rate</strong> Variability as Risk Indicators.<br />
Europhys Lett, 2001; 53:709-15<br />
[9] Berry MJA, Linoff G: Data Mining Techniques. J Wiley <strong>and</strong> Sons, 1997<br />
[10] E Keogh, S Kasetty: On the Need for Time Series Data Mining<br />
Benchmarks: A Survey <strong>and</strong> Empirical Demonstration. Data Mining <strong>and</strong><br />
Knowledge Discovery, 2003; (7):349-371<br />
[11] Kennedy HL, Bavishi NS, Buckingham: Ambulatory (Holter)<br />
[12]<br />
Electrocardiography Signal-Averaging: a Current Perspective. Am <strong>Heart</strong> J<br />
124:1339-1346, 1992<br />
Morlet D, Couderc JP, Touboul P, Rubel P: Wavelet <strong>Analysis</strong> of the High-<br />
Resolution ECGs in Post-Infarction Patients: Role of the Basic Wavelet<br />
<strong>and</strong> of the Analyzed Lead. Int J Biomed Comp, 39:311, 1995<br />
[13] Couderc JP, Fareh S, Chevalier P, et al: Stratification of Time-Frequency<br />
Abnoralities in the Signal-Averaged High-Resolution ECG in<br />
Postinfarction Patients with <strong>and</strong> without Ventricular Tachycardia <strong>and</strong><br />
Congenital Long QT Syndrome. J Electrocardiol, 29(suppl):180-188, 1996<br />
– 144 –
Acta Polytechnica Hungarica Vol. 5, No. 1, 2008<br />
[14] Selmaoui N, Rubel P, Chevalier P, Frangin GA: Assessment of the Value<br />
of Wavelet <strong>Analysis</strong> of Holter Recordings for the Prediction of Sudden<br />
Cardiac Death. Computers in Cardiology, 28:81-84, 2001<br />
[15] Grassberger P, Procaccia I: Measuring the Strangeness of Strange<br />
Attractors. Physica D 9:189-208, 1983<br />
[16] F Takens: Detecting Strange Attractors in Turbulence, in Dynamical<br />
Systems <strong>and</strong> Turbulence (Warwick 1980), Lecture Notes in Mathematics,<br />
edited by DA R<strong>and</strong> <strong>and</strong> LS Young (Springer, Berlin,1981), Vol. 898, pp.<br />
366-381<br />
[17] Theiler J: Statistical Precision of Dimension Estimators. Phys Rev<br />
41:3038-3051, 1990<br />
– 145 –