VVER-1000 Coolant Transient Benchmark - OECD Nuclear Energy ...
VVER-1000 Coolant Transient Benchmark - OECD Nuclear Energy ...
VVER-1000 Coolant Transient Benchmark - OECD Nuclear Energy ...
You also want an ePaper? Increase the reach of your titles
YUMPU automatically turns print PDFs into web optimized ePapers that Google loves.
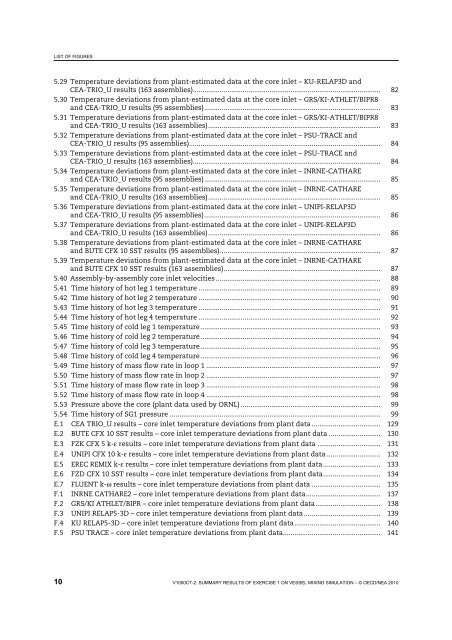
LIST OF FIGURES<br />
5.29 Temperature deviations from plant-estimated data at the core inlet – KU-RELAP3D and<br />
CEA-TRIO_U results (163 assemblies) ..................................................................................................<br />
5.30 Temperature deviations from plant-estimated data at the core inlet – GRS/KI-ATHLET/BIPR8<br />
82<br />
and CEA-TRIO_U results (95 assemblies) ............................................................................................<br />
5.31 Temperature deviations from plant-estimated data at the core inlet – GRS/KI-ATHLET/BIPR8<br />
83<br />
and CEA-TRIO_U results (163 assemblies) ..........................................................................................<br />
5.32 Temperature deviations from plant-estimated data at the core inlet – PSU-TRACE and<br />
83<br />
CEA-TRIO_U results (95 assemblies) ....................................................................................................<br />
5.33 Temperature deviations from plant-estimated data at the core inlet – PSU-TRACE and<br />
84<br />
CEA-TRIO_U results (163 assemblies) ..................................................................................................<br />
5.34 Temperature deviations from plant-estimated data at the core inlet – INRNE-CATHARE<br />
84<br />
and CEA-TRIO_U results (95 assemblies) ............................................................................................<br />
5.35 Temperature deviations from plant-estimated data at the core inlet – INRNE-CATHARE<br />
85<br />
and CEA-TRIO_U results (163 assemblies) ..........................................................................................<br />
5.36 Temperature deviations from plant-estimated data at the core inlet – UNIPI-RELAP3D<br />
85<br />
and CEA-TRIO_U results (95 assemblies) ............................................................................................<br />
5.37 Temperature deviations from plant-estimated data at the core inlet – UNIPI-RELAP3D<br />
86<br />
and CEA-TRIO_U results (163 assemblies) ..........................................................................................<br />
5.38 Temperature deviations from plant-estimated data at the core inlet – INRNE-CATHARE<br />
86<br />
and BUTE CFX 10 SST results (95 assemblies) ....................................................................................<br />
5.39 Temperature deviations from plant-estimated data at the core inlet – INRNE-CATHARE<br />
87<br />
and BUTE CFX 10 SST results (163 assemblies) .................................................................................. 87<br />
5.40 Assembly-by-assembly core inlet velocities ...................................................................................... 88<br />
5.41 Time history of hot leg 1 temperature ............................................................................................... 89<br />
5.42 Time history of hot leg 2 temperature ............................................................................................... 90<br />
5.43 Time history of hot leg 3 temperature ............................................................................................... 91<br />
5.44 Time history of hot leg 4 temperature ............................................................................................... 92<br />
5.45 Time history of cold leg 1 temperature .............................................................................................. 93<br />
5.46 Time history of cold leg 2 temperature .............................................................................................. 94<br />
5.47 Time history of cold leg 3 temperature .............................................................................................. 95<br />
5.48 Time history of cold leg 4 temperature .............................................................................................. 96<br />
5.49 Time history of mass flow rate in loop 1 ........................................................................................... 97<br />
5.50 Time history of mass flow rate in loop 2 ........................................................................................... 97<br />
5.51 Time history of mass flow rate in loop 3 ........................................................................................... 98<br />
5.52 Time history of mass flow rate in loop 4 ........................................................................................... 98<br />
5.53 Pressure above the core (plant data used by ORNL) ......................................................................... 99<br />
5.54 Time history of SG1 pressure .............................................................................................................. 99<br />
E.1 CEA TRIO_U results – core inlet temperature deviations from plant data .................................... 129<br />
E.2 BUTE CFX 10 SST results – core inlet temperature deviations from plant data ........................... 130<br />
E.3 FZK CFX 5 k-ε results – core inlet temperature deviations from plant data ................................. 131<br />
E.4 UNIPI CFX 10 k-ε results – core inlet temperature deviations from plant data ............................ 132<br />
E.5 EREC REMIX k-ε results – core inlet temperature deviations from plant data .............................. 133<br />
E.6 FZD CFX 10 SST results – core inlet temperature deviations from plant data .............................. 134<br />
E.7 FLUENT k-ω results – core inlet temperature deviations from plant data .................................... 135<br />
F.1 INRNE CATHARE2 – core inlet temperature deviations from plant data ....................................... 137<br />
F.2 GRS/KI ATHLET/BIPR – core inlet temperature deviations from plant data .................................. 138<br />
F.3 UNIPI RELAP5-3D – core inlet temperature deviations from plant data ........................................ 139<br />
F.4 KU RELAP5-3D – core inlet temperature deviations from plant data ............................................. 140<br />
F.5 PSU TRACE – core inlet temperature deviations from plant data................................................... 141<br />
10 V<strong>1000</strong>CT-2: SUMMARY RESULTS OF EXERCISE 1 ON VESSEL MIXING SIMULATION – © <strong>OECD</strong>/NEA 2010


