Quick Facts 2010 - Nestlé
Quick Facts 2010 - Nestlé
Quick Facts 2010 - Nestlé

Create successful ePaper yourself
Turn your PDF publications into a flip-book with our unique Google optimized e-Paper software.
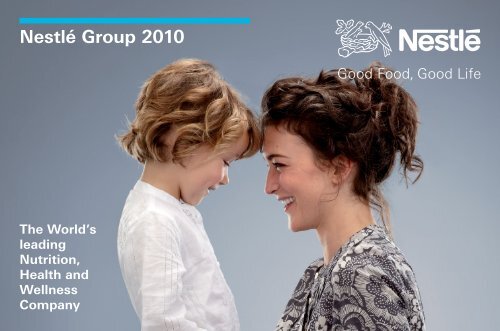
<strong>Nestlé</strong> Group <strong>2010</strong><br />
The World’s<br />
leading<br />
Nutrition,<br />
Health and<br />
Wellness<br />
Company
Key figures (consolidated)<br />
In millions of CHF<br />
Sales<br />
EBIT (Group) (a)<br />
as % of sales<br />
EBIT (Continuing operations) (a)<br />
as % of sales (Continuing operations)<br />
Profit for the year attributable to shareholders of the parent Net profit (b)<br />
as % of sales<br />
as % of average equity attributable to shareholders of the parent<br />
Capital expenditure<br />
as % of sales<br />
Equity attributable to shareholders of the parent (c)<br />
Market capitalisation, end December<br />
Operating cash flow<br />
Free cash flow (d)<br />
Net financial debt<br />
Ratio of net financial debt to equity (gearing)<br />
<strong>2010</strong><br />
109 722<br />
16 194<br />
14.8%<br />
14 038<br />
13.4%<br />
34 233<br />
31.2%<br />
61.8%<br />
4 576<br />
4.2%<br />
61 867<br />
178 316<br />
13 608<br />
7 761<br />
3 854<br />
6.2%
Per share<br />
Total basic earnings per share CHF<br />
Underlying (e) CHF<br />
Equity attributable to shareholders of the parent (c) CHF<br />
Dividend (f) CHF<br />
Stock exchange prices (high/low) CHF<br />
Yield (g) %<br />
10.16<br />
3.32<br />
18.35<br />
1.85<br />
56.90/48.18<br />
3.3/3.8<br />
(a) Earnings Before Interest, Taxes, restructuring and impairments.<br />
(b) <strong>2010</strong> includes a one-off gain on the disposal of the remaining interest in Alcon.<br />
(c) Before proposed appropriation of profit of <strong>Nestlé</strong> S.A.<br />
(d) Operating cash flow less capital expenditure, disposal of tangible assets, purchase and disposal of intangible assets,<br />
movement with associates as well as with non-controlling interests.<br />
(e) Profit per share for the year attributable to shareholders of the parent before impairments, restructuring costs, results<br />
on disposals and significant one-off items. The tax impact from the adjusted items is also adjusted for.<br />
(f) As proposed by the Board of Directors of <strong>Nestlé</strong> S.A.<br />
(g) Calculated on the basis of the dividend for the year concerned, which is paid in the following year, and on high/low<br />
stock prices.
Analysis of sales, EBIT and organic growth (OG)<br />
By operating segment<br />
In millions of CHF<br />
Zone Europe<br />
Zone Americas<br />
Zone Asia, Oceania and Africa<br />
<strong>Nestlé</strong> Waters<br />
<strong>Nestlé</strong> Nutrition<br />
Other Food and Beverages (a)<br />
Unallocated items (b)<br />
Pharma<br />
Total continuing operations<br />
Pharma discontinued operations<br />
Total Group<br />
Sales<br />
21 580<br />
34 301<br />
17 409<br />
9 095<br />
10 366<br />
10 971<br />
891<br />
104 613<br />
5 109<br />
109 722<br />
EBIT)<br />
2 723)<br />
5 651)<br />
2 941)<br />
669)<br />
1 873)<br />
1799)<br />
(1 783)<br />
165)<br />
14 038)<br />
2 156)<br />
16 194)<br />
OG<br />
2.5%<br />
5.9%<br />
8.7%<br />
4.4%<br />
6.7%<br />
9.8%<br />
6.0%<br />
9.5%<br />
6.2%
By product<br />
In millions of CHF<br />
Powdered and liquid beverages<br />
Water (c)<br />
Milk products and Ice cream<br />
Nutrition (c)<br />
Prepared dishes and cooking aids<br />
Confectionery<br />
PetCare<br />
Unallocated items (b)<br />
Sales EBIT) OG<br />
20 612 4 329) 8.5%<br />
9 101 670) 4.5%<br />
20 360 2 623) 6.6%<br />
10 368 1 874) 6.7%<br />
18 093 2 229) 2.6%<br />
12 097 1 667) 7.0%<br />
13 091 2 264) 4.9%<br />
(1 783)<br />
Pharmaceutical products<br />
891 165)<br />
Total continuing operations<br />
104 613 14 038) 6.0%<br />
Pharma discontinued operations<br />
5 109 2 156) 9.5%<br />
Total Group<br />
109 722<br />
16 194) 6.2%<br />
(a) Mainly Nespresso, <strong>Nestlé</strong> Professional and Food and Beverages Joint Ventures managed on a worldwide basis.<br />
(b) Mainly corporate expenses as well as research and development costs.<br />
(c) The figures between Operating segments and Products are slightly different due to the fact that some water<br />
and nutrition products are also sold by Operating segments other than <strong>Nestlé</strong> Waters and <strong>Nestlé</strong> Nutrition.
Company profile<br />
<strong>Nestlé</strong> has 443 factories in 81 countries around the world and 281 000 employees.<br />
Employees by geographic area<br />
Europe (a)<br />
Americas<br />
Asia, Oceania and Africa<br />
Total<br />
(a) 9395 employees in Switzerland in <strong>2010</strong>.<br />
Factories by geographic area<br />
Europe<br />
Americas<br />
Asia, Oceania and Africa<br />
Total<br />
<strong>2010</strong><br />
32.4%<br />
40.3%<br />
27.3%<br />
100%<br />
<strong>2010</strong><br />
150<br />
168<br />
125<br />
443
The <strong>Nestlé</strong> Story – all the way to Nutrition, Health and Wellness<br />
1866 Foundation of Anglo-Swiss Condensed Milk Co.<br />
1867 Henri <strong>Nestlé</strong>’s Infant cereal developed<br />
1905 <strong>Nestlé</strong> and Anglo-Swiss Condensed Milk Co. (new name after merger)<br />
1929 Merger with Peter, Cailler, Kohler Chocolats Suisses S.A.<br />
1934 Launch of Milo<br />
1938 Launch of Nescafé<br />
1947 <strong>Nestlé</strong> Alimentana S.A. (new name after merger with Maggi)<br />
1948 Launch of Nestea and Nesquik<br />
1969 Vittel (initially equity interest only)<br />
1971 Merger with Ursina-Franck<br />
1973 Stouffer (with Lean Cuisine)<br />
1974 L’Oréal (associate)<br />
1977 <strong>Nestlé</strong> S.A. (new name), Alcon (disposed in August <strong>2010</strong>)<br />
1981 Galderma (joint venture with L’Oréal)<br />
1985 Carnation (with Coffee-mate and Friskies)<br />
1986 Creation of <strong>Nestlé</strong> Nespresso S.A. and Herta<br />
1988 Buitoni-Perugina and Rowntree (with KitKat)
1990 Cereal Partners Worldwide (joint venture with General Mills)<br />
1991 Beverage Partners Worldwide (joint venture with Coca-Cola)<br />
1992 Perrier (with Poland Spring)<br />
1993 Creation of <strong>Nestlé</strong> Sources Internationales (2002: <strong>Nestlé</strong> Waters)<br />
1997 Creation of Nutrition Strategic Business Division (2006: <strong>Nestlé</strong> Nutrition)<br />
1998 Sanpellegrino and Spillers Petfoods, launch of <strong>Nestlé</strong> Pure Life<br />
2000 PowerBar<br />
2001 Ralston Purina<br />
2002 Schöller, Chef America and Dairy Partners Americas (joint venture with Fonterra)<br />
Laboratoires innéov (joint venture with L’Oréal)<br />
2003 Mövenpick and Dreyer’s<br />
2005 Wagner, Protéika and Musashi<br />
2006 Creation of FoodServices Strategic Business Division (2009: <strong>Nestlé</strong> Professional)<br />
Lactalis <strong>Nestlé</strong> Produits Frais (associate)<br />
Jenny Craig, Uncle Tobys and Delta Ice Cream<br />
2007 Novartis Medical Nutrition, Gerber and Henniez<br />
2008 Ruzanna<br />
<strong>2010</strong> Kraft Food’s frozen pizza, Waggin’Train, Malher, Technocom and Vitaflo
Our ambition<br />
As the leading Nutrition, Health and Wellness Company we enhance lives by offering<br />
tastier and healthier food and beverage choices at all stages of life and at any time of the day,<br />
helping consumers care for themselves and their families. This is the foundation of our<br />
promise of Good Food, Good Life and puts nutrition at the heart of everything we do.<br />
It is our firm belief that, for a company to be successful over time and create value for<br />
its shareholders, it must also create value for society. We call this “Creating Shared Value”.<br />
Built on strong foundations of compliance and sustainable business practices, this is our<br />
way to do business and to be the trusted leader in Nutrition, Health and Wellness.<br />
Our brands<br />
Our unrivalled portfolio of brands and high-quality products enables us to be present<br />
in the day-to-day life of our consumers, from morning to evening and at every stage<br />
in their lives. Around 70% of our total Food and Beverages sales come from brands that<br />
generate over CHF 1 billion each in sales.
Powdered and liquid beverages<br />
Milk products<br />
Prepared dishes and cooking aids
Confectionery<br />
Water<br />
PetCare<br />
Nutrition<br />
Ice cream<br />
Pharmaceutical products
www.nestle.com<br />
Contact<br />
Media<br />
<strong>Nestlé</strong> S.A.<br />
Corporate Media Relations<br />
Avenue <strong>Nestlé</strong> 55<br />
CH-1800 Vevey (Switzerland)<br />
Tel. +41 (0)21 924 22 00<br />
Fax +41 (0)21 922 63 34<br />
mediarelations@nestle.com<br />
Investors<br />
<strong>Nestlé</strong> S.A.<br />
Investor Relations<br />
Avenue <strong>Nestlé</strong> 55<br />
CH-1800 Vevey (Switzerland)<br />
Tel. +41 (0)21 924 35 09<br />
Fax +41 (0)21 924 28 13<br />
ir@nestle.com<br />
Shareholders<br />
Share register: registration,<br />
transfers, address changes,<br />
dividends, etc.<br />
<strong>Nestlé</strong> S.A.<br />
Share Transfer Office<br />
Zugerstrasse 8<br />
CH-6330 Cham (Switzerland)<br />
Tel. +41 (0)41 785 20 20<br />
Fax +41 (0)41 785 20 24<br />
shareregister@nestle.com