Nestlé Waters – Creating Shared Value report
Nestlé Waters – Creating Shared Value report
Nestlé Waters – Creating Shared Value report

Create successful ePaper yourself
Turn your PDF publications into a flip-book with our unique Google optimized e-Paper software.
4<br />
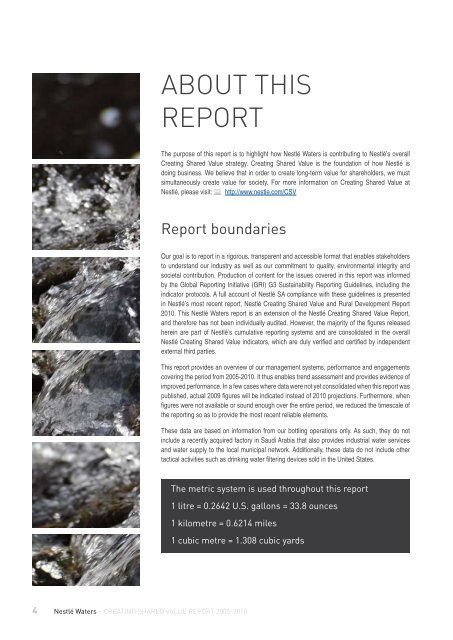
aBout thiS<br />
<strong>report</strong><br />
<strong>Nestlé</strong> <strong>Waters</strong> <strong>–</strong> <strong>Creating</strong> <strong>Shared</strong> <strong>Value</strong> <strong>report</strong> 2005-2010<br />
The purpose of this <strong>report</strong> is to highlight how <strong>Nestlé</strong> <strong>Waters</strong> is contributing to <strong>Nestlé</strong>’s overall<br />
<strong>Creating</strong> <strong>Shared</strong> <strong>Value</strong> strategy. <strong>Creating</strong> <strong>Shared</strong> <strong>Value</strong> is the foundation of how <strong>Nestlé</strong> is<br />
doing business. We believe that in order to create long-term value for shareholders, we must<br />
simultaneously create value for society. For more information on <strong>Creating</strong> <strong>Shared</strong> <strong>Value</strong> at<br />
<strong>Nestlé</strong>, please visit: http://www.nestle.com/CSV<br />
Report boundaries<br />
Our goal is to <strong>report</strong> in a rigorous, transparent and accessible format that enables stakeholders<br />
to understand our industry as well as our commitment to quality, environmental integrity and<br />
societal contribution. Production of content for the issues covered in this <strong>report</strong> was informed<br />
by the Global Reporting Initiative (GRI) G3 Sustainability Reporting Guidelines, including the<br />
indicator protocols. A full account of <strong>Nestlé</strong> SA compliance with these guidelines is presented<br />
in <strong>Nestlé</strong>’s most recent <strong>report</strong>, <strong>Nestlé</strong> <strong>Creating</strong> <strong>Shared</strong> <strong>Value</strong> and Rural Development Report<br />
2010. This <strong>Nestlé</strong> <strong>Waters</strong> <strong>report</strong> is an extension of the <strong>Nestlé</strong> <strong>Creating</strong> <strong>Shared</strong> <strong>Value</strong> Report,<br />
and therefore has not been individually audited. However, the majority of the figures released<br />
herein are part of <strong>Nestlé</strong>’s cumulative <strong>report</strong>ing systems and are consolidated in the overall<br />
<strong>Nestlé</strong> <strong>Creating</strong> <strong>Shared</strong> <strong>Value</strong> indicators, which are duly verified and certified by independent<br />
external third parties.<br />
This <strong>report</strong> provides an overview of our management systems, performance and engagements<br />
covering the period from 2005-2010. It thus enables trend assessment and provides evidence of<br />
improved performance. In a few cases where data were not yet consolidated when this <strong>report</strong> was<br />
published, actual 2009 figures will be indicated instead of 2010 projections. Furthermore, when<br />
figures were not available or sound enough over the entire period, we reduced the timescale of<br />
the <strong>report</strong>ing so as to provide the most recent reliable elements.<br />
These data are based on information from our bottling operations only. As such, they do not<br />
include a recently acquired factory in Saudi Arabia that also provides industrial water services<br />
and water supply to the local municipal network. Additionally, these data do not include other<br />
tactical activities such as drinking water filtering devices sold in the United States.<br />
The metric system is used throughout this <strong>report</strong><br />
1 litre = 0.2642 U.S. gallons = 33.8 ounces<br />
1 kilometre = 0.6214 miles<br />
1 cubic metre = 1.308 cubic yards