Item No. 5 - Halifax Regional Municipality
Item No. 5 - Halifax Regional Municipality
Item No. 5 - Halifax Regional Municipality
You also want an ePaper? Increase the reach of your titles
YUMPU automatically turns print PDFs into web optimized ePapers that Google loves.
Attachment #1<br />
Page 2 of 3<br />
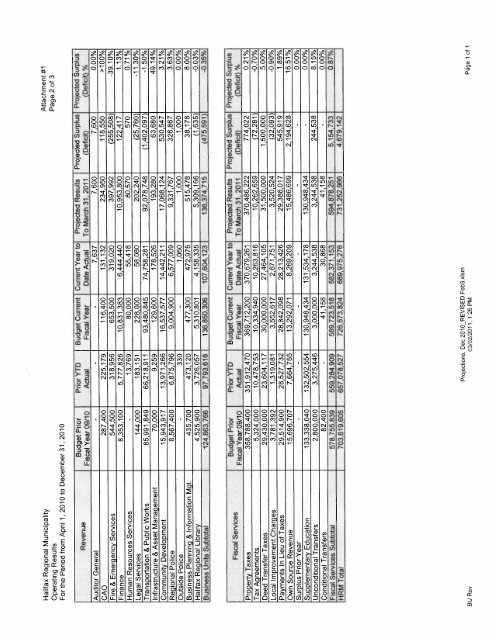
<strong>Halifax</strong> <strong>Regional</strong> <strong>Municipality</strong><br />
Operating Results<br />
For the Period from April 1,2010 to December31, 2010<br />
Budget Prior Prior YTD Budget Current Current Year to Projected Results Projected Surplus Projected Surplus<br />
Reven Ue<br />
Fiscal Year 09/10 Actual Fiscal Year Date Actual To March 31, 2011 (Deficit) - (Deficit) %<br />
Auditor General - - - 7,637 7,600 7,600 000%<br />
CAO 287,400 225,179 116,400 131,132 234,950 118,550 >100%<br />
Fire & Emergency Services 544,500 318,956 653,500 319,020 397,992 (255,508’) -39.10%<br />
Finance 8,353,100 5,777,826 10,831,383 6,444,440 10,953,800 122,417 1 13%<br />
Human Resources Services - 13,769 80,000 55,418 80,570 570 0.71%<br />
Legal Services 144,000 183,151 228,000 58,080 202,240 (25,760) -11.30%<br />
Transportation & Public Works 85,991,849 66,218,911 93,480,845 74,758,281 92078,748 (1,402,097) -1 50%<br />
Infrastructure & Asset Management 70,000 9,259 129,600 178,526 193,280 63,680 49.14%<br />
Community Development 15,943,917 13,971,266 16,537,577 14,442,211 17,068,124 530,547 3.21%<br />
<strong>Regional</strong> Police 8,567,400 6,875,796 9,004,900 6,577,009 9,331,767 326,867 3.63%<br />
Outside Police - 330 - 1,060 1,000 1,000 0.00°!<br />
Business Planning & Information Mgt. 435,700 473,120 477,300 472,975 515,478 38,178 8.00°!<br />
<strong>Halifax</strong> <strong>Regional</strong> Library 4,525,900 3,726,057 5,310,801 4,158,335 5,309,166 (1,635) -0,03%<br />
Business Units Subtotal 124,883,766 97,793,618 136,850,306 107,604,123 136,374,715 (475,591’i -0.35%<br />
Budget Prior Prior YTD Budget Current Current Year to Projected Results Projected Surplus Projected Surplus<br />
Fiscal Services<br />
Fiscal Year 09/10 Actual Fiscal Year Date Actual To March 31, 2011 (Deficit) (Deficit) %<br />
Property Taxes 358,788,400 351,912,470 369,712,200 370,679,261 370,486,222 774,022 0 21%<br />
Tax Agreements 5,324,000 10,478,753 10,334,940 10,263,816 10,262,659 (72,281) -0 70%<br />
Deed Transfer Taxes 29,430,000 23,604,117 30,000,000 27,464,105 31,500,000 1,500,000 5.00%<br />
Local Improvement Charges 3,781,392 1,319,081 3,552,617 2,671,751 3,520,524 (32,093) -0 90%<br />
Payments In Lieu of Taxes 29,514,900 28,527,732 28,842,098 28,213,426 29,388,017 545,919 1.89%<br />
Own Source Revenue 15,696,707 7,664,755 13,292,071 8,269,209 15,486,699 2,194,628 16.51%<br />
Surplus Prior Year -<br />
Supplementary Education 133,338,040 132,502,554 130,948434 131,534,178 130,948,434 - 0.00%<br />
Unconditional Transfers 2,800,000 3,275,446 3,000,000 3,244,538 3,244,538 244,538 8.15%<br />
Conditional Transfers 82,400 - 41,158 30,868 41,158 - 0 00%<br />
Fiscal Services Subtotal 578,755,839 559,284,909 589,723,518 582,371,153 594,878,251 5,154,733 0 87%<br />
HRM Total 703,619,605 657,078,527 726,573,824 689,975,276 731,252,966 4,679,142<br />
- - - - - 0.00%<br />
Projections. Dec 2010 REVISED Feb3.xism<br />
BU R€?V 03/02/2011, 1:25 PM PEI9C 1 of 1


