Brazilian Journal of Analytical Chemistry - BRJAC - Brazilian Journal ...
Brazilian Journal of Analytical Chemistry - BRJAC - Brazilian Journal ...
Brazilian Journal of Analytical Chemistry - BRJAC - Brazilian Journal ...

You also want an ePaper? Increase the reach of your titles
YUMPU automatically turns print PDFs into web optimized ePapers that Google loves.
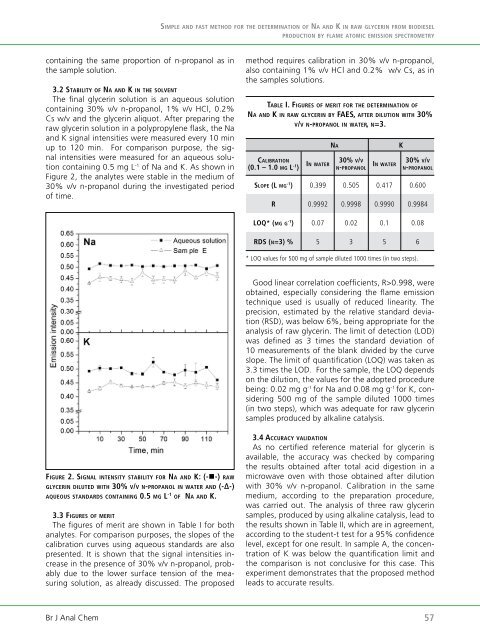
containing the same proportion <strong>of</strong> n-propanol as in<br />
the sample solution.<br />
3.2 sTabiliTy <strong>of</strong> na an d k in Th e so l v e n T<br />
The final glycerin solution is an aqueous solution<br />
containing 30% v/v n-propanol, 1% v/v HCl, 0.2%<br />
Cs w/v and the glycerin aliquot. After preparing the<br />
raw glycerin solution in a polypropylene flask, the Na<br />
and K signal intensities were measured every 10 min<br />
up to 120 min. For comparison purpose, the signal<br />
intensities were measured for an aqueous solution<br />
containing 0.5 mg L -1 <strong>of</strong> Na and K. As shown in<br />
Figure 2, the analytes were stable in the medium <strong>of</strong><br />
30% v/v n-propanol during the investigated period<br />
<strong>of</strong> time.<br />
fig u r e 2. si g n a l i n T e n s i T y sTabiliTy f o r na a n d k: (-n-) r a w<br />
g l y C e r i n d i l u T e d w iT h 30% v/v n-pr o p a n o l in w a T e r a n d (-Δ-)<br />
a q u e o u s sT a n d a r d s Co n T a i n i n g 0.5 m g l -1 <strong>of</strong> na an d k.<br />
3.3 fi g u r e s <strong>of</strong> me r iT<br />
The figures <strong>of</strong> merit are shown in Table I for both<br />
analytes. For comparison purposes, the slopes <strong>of</strong> the<br />
calibration curves using aqueous standards are also<br />
presented. It is shown that the signal intensities increase<br />
in the presence <strong>of</strong> 30% v/v n-propanol, probably<br />
due to the lower surface tension <strong>of</strong> the measuring<br />
solution, as already discussed. The proposed<br />
Br J Anal Chem<br />
sim p l e an d fa s T me T h o d fo r Th e de T e r m i n a T i o n <strong>of</strong> na an d k in r a w gl y C e r i n fr o m biodiesel<br />
method requires calibration in 30% v/v n-propanol,<br />
also containing 1% v/v HCl and 0.2% w/v Cs, as in<br />
the samples solutions.<br />
Ta b l e i. fi g u r e s <strong>of</strong> me r iT fo r Th e de T e r m i n a T i o n <strong>of</strong><br />
na an d k in r a w gl y C e r i n by faes, a f T e r diluTion wiT h 30%<br />
v/v n-pr o p a n o l in wa T e r, n=3.<br />
Cal i b r a T i o n<br />
(0.1 – 1.0 m g l -1 )<br />
slo p e (l m g -1 )<br />
r<br />
loq* (m g g -1 )<br />
rds (n=3) %<br />
p r o d u C T i o n by fl a m e aT o m iC emission speCTromeTry<br />
in wa T e r<br />
0.399<br />
0.9992<br />
0.07<br />
5<br />
na k<br />
30% v/v<br />
n-pr o p a n o l<br />
0.505<br />
0.9998<br />
0.02<br />
in wa T e r<br />
0.417<br />
0.9990<br />
0.1<br />
* LOQ values for 500 mg <strong>of</strong> sample diluted 1000 times (in two steps).<br />
3<br />
5<br />
30% v/v<br />
n-pr o p a n o l<br />
0.600<br />
0.9984<br />
0.08<br />
Good linear correlation coefficients, R>0.998, were<br />
obtained, especially considering the flame emission<br />
technique used is usually <strong>of</strong> reduced linearity. The<br />
precision, estimated by the relative standard deviation<br />
(RSD), was below 6%, being appropriate for the<br />
analysis <strong>of</strong> raw glycerin. The limit <strong>of</strong> detection (LOD)<br />
was defined as 3 times the standard deviation <strong>of</strong><br />
10 measurements <strong>of</strong> the blank divided by the curve<br />
slope. The limit <strong>of</strong> quantification (LOQ) was taken as<br />
3.3 times the LOD. For the sample, the LOQ depends<br />
on the dilution, the values for the adopted procedure<br />
being: 0.02 mg g -1 for Na and 0.08 mg g -1 for K, considering<br />
500 mg <strong>of</strong> the sample diluted 1000 times<br />
(in two steps), which was adequate for raw glycerin<br />
samples produced by alkaline catalysis.<br />
3.4 aC C u ra C y va l i d a T i o n<br />
As no certified reference material for glycerin is<br />
available, the accuracy was checked by comparing<br />
the results obtained after total acid digestion in a<br />
microwave oven with those obtained after dilution<br />
with 30% v/v n-propanol. Calibration in the same<br />
medium, according to the preparation procedure,<br />
was carried out. The analysis <strong>of</strong> three raw glycerin<br />
samples, produced by using alkaline catalysis, lead to<br />
the results shown in Table II, which are in agreement,<br />
according to the student-t test for a 95% confidence<br />
level, except for one result. In sample A, the concentration<br />
<strong>of</strong> K was below the quantification limit and<br />
the comparison is not conclusive for this case. This<br />
experiment demonstrates that the proposed method<br />
leads to accurate results.<br />
6<br />
57