View Report (PDF, 36 pages) - US Government Accountability Office
View Report (PDF, 36 pages) - US Government Accountability Office
View Report (PDF, 36 pages) - US Government Accountability Office

Create successful ePaper yourself
Turn your PDF publications into a flip-book with our unique Google optimized e-Paper software.
-<br />
-II ---~---- ---. --.--_-_..-~<br />
(;AO/PJSIAI)-!%2 1 X<br />
-_._---.<br />
NAVY CONTRACTING<br />
Cost Growth Continues<br />
on Ship Construction<br />
Contracts<br />
II Ill 11111<br />
147<strong>36</strong>1
GAO<br />
Background<br />
United States<br />
General Accounting <strong>Office</strong><br />
Washington, D.C. 20548<br />
National Security and<br />
International Affairs Division<br />
B-228619<br />
August 31,1992<br />
The Honorable Daniel K. Inouye<br />
Chairman, Subcommittee on Defense<br />
Committee on Appropriations<br />
United States Senate<br />
Dear Mr. Chairman:<br />
For the last several years, we have monitored cost growth on Navy ship<br />
construction contracts and have testified and issued several reports on the<br />
subject (see “Related GAO Products” at the end of this report). This report<br />
updates the status of the cost growth, describes trends in that growth, and<br />
discusses recent actions to finance additional costs and the implications of<br />
future cost growth.<br />
About 90 percent of the dollar value of the Navy ships under construction<br />
as of July 199 1 can be accounted for in fmed-price incentive contracts with<br />
commercial shipyards. A fured-price incentive contract establishes a target<br />
cost and profit, a ceiling price, and a share formula that is used to<br />
determine the cost to the Navy and the profit earned by the shipyard. The<br />
target cost-a negotiated estimate of the ship’s actual cost-and target<br />
profit-the profit the shipyard should earn if the contract is completed at<br />
the target cost-can be adjusted by mutual agreement as work progresses,<br />
in which case the Navy is responsible for any additional expense. The<br />
target price is the sum of the target cost and the target profit.’ The ceiling<br />
price-generally 120 to 135 percent of the target cost-is the maximum<br />
amount the Navy will pay on the contract. The Navy and the shipyard share<br />
any “over-target” costs that exceed current target costs up to the ceiling<br />
price based on a formula that is negotiated as part of the contract.<br />
Generally, the Navy and the shipyard share this increase equally. However,<br />
all costs above the ceiling price are borne by the shipyard. Thus, the<br />
shipyard’s profit is determined by how well it meets the target cost. Firm<br />
fixed-price or fixed-price with escalation contracts were used for the<br />
remaining 10 percent of the remaining ships under construction in July<br />
199 1, These contracts generally contain no provisions for adjusting the<br />
price after the award of the contracts. Contract types are discussed in more<br />
detail in appendix I.<br />
‘The target cost, target profit, and target price, if ac\justed, are referred to as the current target cost,<br />
current target profit, and current target price.<br />
Page 1 GAO/NSIALb92-218 Ship Construction Contracta<br />
a
Results in Brief<br />
B-228619<br />
The Navy conducts annual ship cost adjustment reviews to develop<br />
updated cost estimates for each ship under construction. The information<br />
is used to establish a financial baseline for managing ongoing shipbuilding<br />
programs and for budget preparation and is provided to all Navy<br />
management levels for those purposes. Unless otherwise noted, we used<br />
data from the ship cost adjustment review completed in July 1991 as the<br />
1991 current data.<br />
The potential total cost for completing construction of the 165 ships under<br />
the Navy’s 54 ship construction contracts that were open at the end of<br />
fiscal year 1991 was about $6.4 billion (24 percent) higher than the<br />
contracts’ initial target costs of about $27.1 billion.2 The Navy’s share of<br />
that increase is about $4 billion; the shipyards are liable for the remainder.<br />
Cost growth has increased over the years. When we last reported on cost<br />
growth in 1990, the potential total cost for completing the 62 ship<br />
construction contracts that were open at that time was about $5.5 billion<br />
(20 percent) higher than those contracts’ initial target costs of<br />
$27.3 billion.<br />
In the past, the Navy, with congressional approval, has made up funding<br />
shortages in individual ship construction accounts by transferring funds to<br />
those programs from other shipbuilding and procurement programs that<br />
were reduced, canceled, or were of a lower priority. However, for fiscal<br />
year 1992, in addition to the transfer of $1.5 billion among programs,<br />
Congress provided $463.6 million in new funding to make up existing<br />
funding shortages. The overall increasmg cost growth and a potential<br />
decline in the number of ships under construction will reduce the total<br />
funds available for shipbuilding. Thus, the Navy will find it increasingly<br />
difficult to make up shipbuilding funding shortfalls through transfers 6<br />
among programs as it has done in the past.3 As a result, it may have to<br />
request additional funds from Congress, as it did in fiscal year 1992.<br />
‘Navy Contracting: Ship Construction Contracts Could Cost Billions Over Initial Target Costs<br />
(GAO/MUD-9 l-1 8, Oct. 5,199O) discussed the reasons for cost growth on ship construction<br />
contracts. It also discussed the results of the Navy’s 1989 ship cost review.<br />
3Moreover, recent legislation makes it more difficult to use expired funds to pay additional costs.<br />
Page 2 GAO/NSLAD-92-218 Ship ConstructSon Contracts
Shipbuilding Costs<br />
Increasing<br />
Budgeting for Ship<br />
Acquisition<br />
B-228619<br />
We compared the July 199 1 cost growth on the Navy’s fixed-price<br />
incentive ship construction contracts to what we reported in 1990 and<br />
found that it had increased by several measures. Target costs and target<br />
profits increased from the 1989 levels discussed in our 1990 report to the<br />
July 1991 levels, and as a result, target prices also increased. While the<br />
1989 current target costs were about $0.8 billion, or 3.5 percent, higher<br />
than the initial target costs, by 199 1 they were about $1.1 billion, or<br />
4.4 percent, higher. The Navy is liable for these increases. Projected<br />
over-target costs also increased. In 1989, the aggregate completion<br />
estimates exceeded the aggregate current target costs by about<br />
$3.6 billion, a 14. l-percent increase. By 1991, the projected over-target<br />
increase totaled $4.4 billion, 17.2 percent higher than the current target<br />
costs. The Navy’s share and the shipyards’ share of the projected<br />
over-target costs grew from about $1.4 billion and $2.1 billion,<br />
respectively, in 1989 to about $2 billion and $2.4 billion, respectively, in<br />
199 1. Additional details on the cost growth in 1991 are included in<br />
appendix II. Trend data are discussed in appendix III.<br />
Because of increased costs, the Navy has had to provide substantially more<br />
funds to the shipbuilding programs than were originally appropriated.<br />
Generally, the programs funded in fiscal year 1987 and earlier received<br />
more appropriations than have been needed to date and thus have served<br />
as a source of funds for other ship construction programs experiencing<br />
cost growth. Programs begun since fiscal year 1988 originally received less<br />
appropriations than have been needed and have required additional<br />
funding. The fiscal year 1992 Defense Appropriations Act redressed<br />
shipbuilding funding shortfalls by providing $463.6 million in new budget<br />
authority for increased inflation on existing contracts and by approving the<br />
Navy’s proposal to transfer about $1,496.6 million from existing Navy and<br />
Marine Corps programs to shipbuilding programs to cover the remaining<br />
cost growth.<br />
As acknowledged by a Navy official in an April 1992 congressional<br />
testimony, the Navy will face increasing difficulty in completing its ship<br />
construction programs within the appropriated funding levels because<br />
costs continue to increase while the number of ships under construction is<br />
likely to decline. If fewer ships are built, the total available shipbuilding<br />
funds will be reduced, and funds potentially available for transfer to<br />
programs experiencing cost growth will be limited. Additional details on<br />
budgeting for ship acquisition are provided in appendix IV.<br />
Page 2 GAO/NSIAD-92-218 Ship Construction Contracts
B-228619<br />
In written comments (see app. VI) on a draft of this report, the Department<br />
Agency Comments and<br />
Our Evaluation<br />
of Defense agreed with the report’s findings and conclusions. However, the<br />
Department said that recent changes in its budgeting practices-budgeting<br />
to most likely cost-should minimize the future need for funding increases.<br />
It is true that larger initial appropriations could lessen the future need for<br />
additional funding for contract cost growth and that the additional funding<br />
required has declined from the fiscal year 1989 program to that required<br />
for the 1991 program. We have not reviewed the changes the Department<br />
told us it had made. However, we believe that, because of the long term of<br />
shipbuilding contracts, it will require several years to determine if any such<br />
change is successful in reducing the need for additional funds.<br />
Our objectives, scope, and methodology are provided in appendix V.<br />
We are sending copies of this report to the Chairmen, Senate Committees<br />
on <strong>Government</strong>al Affairs and on Appropriations, House Committees on<br />
<strong>Government</strong> Operations and on Appropriations, and Senate and House<br />
Committees on Armed Services; the Director, <strong>Office</strong> of Management and<br />
Budget; and the Secretaries of Defense and the Navy. Copies will also be<br />
made available to others on request.<br />
Please contact me at (202) 275-6504 if you or your staff have any<br />
questions concerning this report. Major contributors to this report are<br />
listed in appendix VII.<br />
Sincerely yours,<br />
Martin M Ferber<br />
Director, Navy Issues<br />
Page 4 GAO/NSIAD-92-218 Ship Construction Contracts
Page 6<br />
!“. ,( :<br />
GAO/NSIAD-92-218 Ship Construction ContracW
Contents<br />
Letter<br />
Appendix I<br />
Contracts and Total<br />
ship cost<br />
Fixed-Price Incentive Contracts<br />
Other Fixed-Price Contracts<br />
Total Ship Cost<br />
Appendix II 11<br />
Projected Cost Growth Cost Growth on FPI Contracts 11<br />
in 1991<br />
Other Contracts<br />
Adjustments and Claims<br />
13<br />
13<br />
Appendix III<br />
Shipbuilding Cost<br />
Growth Is Increasing<br />
Appendix IV<br />
Budgeting for Ship<br />
Acquisition<br />
Appendix V<br />
Objectives, Scope, and<br />
Methodology<br />
Appendix VI<br />
Comments From the<br />
Department of Defense<br />
Appendix VII<br />
Major Contributors to<br />
This <strong>Report</strong><br />
Total Cost Growth Trends<br />
IndividuaI Contract Trends<br />
Contracts Nearing Completion<br />
Funding Changes<br />
FiscaI Year 1992 Budget Actions<br />
Escalation on Shipbuilding Contracts<br />
Page 6 GAO/NSIAD-92-218 Ship Construction Contracts<br />
8<br />
8<br />
9<br />
10<br />
20<br />
20<br />
23<br />
24<br />
26<br />
28<br />
29<br />
b
Content.0<br />
Related GAO Products 32<br />
Tables<br />
Figures<br />
Table II. 1: Cost Growth on F’PI ship Construction Contracts<br />
Table 11.2: Cost Growth on F’F’P and F’P-E Ship Construction<br />
Contracts<br />
Table III. 1: Cost Comparisons (F’PI Contracts)<br />
Table III.2: FPI Contracts Whose Completion Estimates Did<br />
Not Exceed the Ceiling Price<br />
Table IV. 1: Selected Ship Construction Funding Changes<br />
Figure I. 1: Basic Construction as a Percentage of the Total<br />
ship cost<br />
Figure II. 1: U.&S. SUPPLY Under Construction<br />
Figure III. 1: Projected Over-Target Increases of F‘PI Contracts<br />
Abbreviations<br />
DOD Department of Defense<br />
FTP Firm fixed-price<br />
IT-E Fixed-price with escalation<br />
FPI Fixed-price incentive<br />
Page 7 GAO/NSLAD-92-218 Ship Conrrtruction Contracte<br />
12<br />
13<br />
16<br />
17<br />
22<br />
10<br />
14<br />
18
Appendix I<br />
Contracts and Total Ship Cost<br />
F’ixed-Price Incentive<br />
Contracts<br />
The Navy uses three types of fured-price contracts for ship construction:<br />
fuced-price incentive (FPI), fixed-price with escalation (FP-E), and firm<br />
fmed-price (FW) contracts. The contracts vary primarily in the degree to<br />
which the Navy and the shipyards share the financial risks associated with<br />
the contracts’ completion. Risks are shared on WI contracts but are borne<br />
entirely by the shipyards on FFP contracts. The risks to the shipyards are<br />
somewhat less on FP-E contracts than on FW contracts. The costs incurred<br />
by the Navy through these contracts are for the ships’ basic<br />
construction-fabricating the hull and installing government-furnished<br />
equipment-and are, therefore, only a portion of the total cost of the ships.<br />
Most Navy ships are built under F+PI contracts. About 90 percent of the total<br />
construction cost of the ships under construction at the time of our review<br />
could be accounted for in FPI contracts. The types of ships ranged from<br />
aircraft carriers and guided missile destroyers to ocean surveillance ships<br />
and mine hunters. According to a procurement regulation, FTI contracts are<br />
appropriate when the technical or cost uncertainties involved in a ship’s<br />
construction limit the contractor’s ability to reasonably estimate the cost of<br />
completing the contract.<br />
An FW contract establishes a target cost, a target profit, a ceiling price, and<br />
a share formula, which determine the cost to the Navy and the profit<br />
earned by the shipyard. In the contract, the Navy and the shipyard agree to<br />
a target cost-a negotiated estimate of the ship’s actual cost-and a target<br />
profit-the profit the shipyard should earn if the contract is completed at<br />
the target cost. The contract’s target price is the sum of the target cost and<br />
the target profit. The target cost, target profit, and target price can be<br />
adjusted as work progresses on the contract. If adjusted, they are referred<br />
to as the current target cost, current target profit, and current target price.<br />
According to a Navy official, the Navy is responsible for the increased costs<br />
when target costs and target profits are increased.<br />
The ceiling price is the maximum amount the Navy will pay on a contract.<br />
It is generally 120 to 135 percent of the target cost and is adjusted to<br />
reflect target cost changes. AI1 costs above the ceiling price are borne by<br />
the shipyard.<br />
A key feature of an FPI contract is that the Navy and the shipyard, based on<br />
a formula negotiated as part of the contract, share any increased costs<br />
above the target cost up to the’ceiling price. Generally, the Navy and the<br />
shipyard share these increases equally.<br />
Page 8 GAO/NSIALb92-218 Ship Construction Contracts<br />
6
Other Fixed-price<br />
Contracts<br />
Appendix I<br />
Contra&# and Total Ship Cost<br />
The Navy’s actual cost and the shipyard’s actual profit, which depends on<br />
how well the shipyard meets the target cost, are determined after all work<br />
is completed on the contract. During the course of the contract, the Navy<br />
periodically develops an estimated completion cost for the contract<br />
(estimate at completion, or MC) based on contractor-provided and<br />
Navy-developed information. These estimates are used to measure contract<br />
performance and are the basis of our discussion on cost growth.<br />
The following contract illustrates cost sharing on a current FYI contract.<br />
The original target price was $225.4 million (the target cost of<br />
$193.8 million plus the target profit of $3 1.6 million). Because of<br />
agreed-upon contract changes, the target price increased to $244.8<br />
million, which included a target cost of $2 10.5 million and a target profit of<br />
$34.3 million. The Navy is responsible for the $19.4 million<br />
increase-$16.7 million for the target cost and $2.7 million for the target<br />
profit.<br />
However, the July 1991 estimated cost to complete the contract was<br />
$22 1.7 million, an $11.2 million increase over the current target cost,<br />
which the Navy and contractor will share equally. The Navy and the<br />
contractor will share any additional cost increases up to the ceiling price of<br />
$263.1 million. At that point the contractor will absorb any additional<br />
costs.<br />
The Navy also contracts for some ships using either FIT or FP-E contracts.<br />
With a few exceptions, such as contract changes, an FFP contract generally<br />
contains no provision for adjusting the price of the original work,<br />
regardless of a shipyard’s actual cost after the contract is awarded. Its use<br />
is appropriate when both the Navy and the shipyard agree that the ship’s<br />
design is definite and the costs can be reasonably estimated. Coastal survey<br />
ships and dock-landing ships are examples of vessels currently being built<br />
under FFP contracts.<br />
An Fp-E contract contains provisions for adjusting payments to a shipyard<br />
because of some cost changes beyond the shipyard’s control, and it<br />
therefore represents less risk to the shipyard than an m contract. Wo<br />
classes of oilers are currently being constructed under FP-E contracts.<br />
Page 9 GAO/NSIAD-92.218 Ship Construction Contracts<br />
a
Total Ship Cost<br />
Appendix I<br />
Contracta and Total Ship Cost<br />
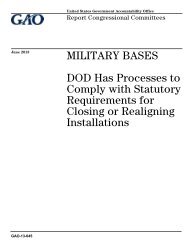
Figure 1.1: Bask Constructton as a<br />
Percentage of the Total Shlp Cost 100 Porcont of total ohlp rtlmrto<br />
The costs Incurred by the Navy through its contracts with the shipyards are<br />
for the ships’ basic construction and are only a portion of the total cost of<br />
those ships. Funds budgeted for basic construction provide for shipyard<br />
contract costs of (1) labor to construct the ships, (2) material obtained by<br />
the shipyards for the ships’ construction, (3) shipboard installation of<br />
government-furnished equipment such as guns, (4) allowable shipyard<br />
overhead costs, and (5) the shipyards’ profit. Overall, basic construction<br />
accounted for about 47 percent of the total budgeted estimated cost of<br />
$76.1 billion for the ships under construction in July 199 1.<br />
Additional costs may be incurred, for example, to (1) purchase electronics<br />
systems, weapon systems, and other government-furnished equipment<br />
installed on the ships; (2) conduct tests and provide various services<br />
related to the ships’ construction; and (3) reimburse the shipyards for<br />
subsequent changes made in the ship designs.<br />
The cost of basic construction varies significantly depending on the type of<br />
ship and its complexity. Figure I.1 illustrates the variation in the cost of<br />
basic construction for three types of vessels-fleet oilers (TAO),<br />
amphibious assault ships (LHD), and guided missile destroyers (DDG-51).<br />
60<br />
30 I<br />
70<br />
60<br />
SO<br />
40<br />
30<br />
20<br />
10<br />
0<br />
Page 10 GAO/NSIAD-92-218 Ship Construction Contra&a
Appendix II<br />
Projected Cost Growth in 1991<br />
Cost Growth on F’PI<br />
Contracts<br />
We reviewed data on the Navy’s 54 ship construction contracts that were<br />
open in July 199 1 and found that the potential total cost for completing the<br />
contracts was about $6.4 billion higher than their initial costs. Target cost<br />
increases on the F’PI contracts accounted for about $1.1 billion of the total<br />
cost growth. Projected over-target increases accounted for an additional<br />
$4.4 billion. Costs have also increased for the FFP and F’P-E contracts. The<br />
1991-reported current prices of those contracts are about $209.7 million<br />
over the contracts’ initial prices. The Navy has also agreed to settle<br />
contract acijustments and claims for about $309.8 million and is potentially<br />
liable for an additional $349.7 million for pending adjustments and claims.<br />
The Navy is potentially liable for about $4 billion of the increased<br />
costs-the increased target costs, about $2 billion of the projected<br />
over-target increases, the cost increases on the FFP and FP-E contracts, and<br />
the costs for the contract adjustments and claims. The shipyards are<br />
potentially liable for $2.4 billion of the projected over-target increases.<br />
We reviewed data from the Navy’s 199 1 Ship Cost Adjustment Review’ for<br />
the 45 open FPI construction contracts for 135 ships. The current target<br />
costs reported in that review-about $25.9 billion-were about $1.1 billion<br />
higher than the contracts’ initial target costs, as shown in table II. 1 .2<br />
‘The resultv of the 1991 review were presented to the Senate and House Appropriations Committees in<br />
July 1991.<br />
‘In addition to the target cost increase, profits increased $172.4 million.<br />
Page 11 GAO/NSIAD-92-218 Ship Construction Contracts
Appendix II<br />
Projected Cart Growth In 1991<br />
Table 11.1: Coat Qrowth on FPI Shlp<br />
Conlrtructlon Contract8 (as of July 1991) Dollars in millions<br />
Category __-.- .._____ - __--_ .__--__.-.-<br />
Number -._-~~ of ships<br />
Target cost<br />
initial<br />
Current<br />
Ceiling -.- -... ----.-.-.-..-~---.--.<br />
price<br />
--- Estimate ..-_ - . . at . -~--.- completion -.-.<br />
Target cost increase<br />
..___--.<br />
Proiected over-target cost’<br />
- -<br />
-<br />
-__<br />
Amount<br />
135<br />
$24.765.9<br />
25,864.8<br />
34,516.7<br />
-__-- 30,300.8<br />
1,098.9<br />
$4,4<strong>36</strong>.0<br />
‘The projected over-target cost is the estimate at completion mlnus the target cost as of July 1991.<br />
The total estimated completion costs of those contracts at the time of the<br />
review-$30.3 billion-exceeded the target costs by about $4.4 billion.<br />
Under the contracts’ sharing formulas, the Navy is liable for about<br />
$2 billion of the additional costs, while the shipyards are potentially liable<br />
for the remaining $2.4 billion. About $0.8 billion of the shipyards’ potential<br />
additional liability represents the amount that estimated completion costs<br />
exceed the contracts’ ceiling prices.<br />
Ten of the 45 contracts experienced no cost growth. The total completion<br />
estimates-$4.3 billion-on seven of these contracts equaled the current<br />
target costs. The completion estimates of the other three contracts-<br />
$1.1 billion-were about $102 million less than the current target prices.<br />
These 10 contracts represent a wide range of ship types and eight different<br />
shipyards.<br />
Large cost increases were generally limited to certain ship types. As in the<br />
past, SSN-688 class attack submarine contracts accounted for the largest<br />
portion of the projected over-target increases-about 4 1 percent of the b<br />
$4.4 billion total. However, that represented a decline from 1989 when the<br />
open SSN-688 contracts accounted for about 59 percent of the total<br />
projected over-target increases of about $3.6 billion.<br />
Appendix III discusses how aggregate cost growth levels have changed<br />
over the past several years.<br />
Page 12 GAO/NSIAD-92-218 Ship Construction Contracts
ppendlx II<br />
ProJected Coot Growth in 1991<br />
Other Contracts At the time of our review seven FFP and two W-E contracts were open.<br />
Table II.2 reflects the price increases on those contracts. The combined<br />
increases total about $209.7 million.<br />
Table 11.2: Coat Qrowth on FFP and FP-E<br />
Ship Conrtructlon<br />
1991)<br />
Contra- (as of May Dollars in millions<br />
Contract type<br />
-<br />
Number of<br />
shlpo<br />
Price<br />
lnltlal Current<br />
Price change<br />
Amount Percent<br />
FFP 18 $1,458.1 $1,663.4 $205.3 14.1<br />
FP-E 12 830.0 834.4 4.4 0.5<br />
A dil ~WHL..“I.l.w Mm~nt.c - SW<br />
i5laims<br />
td<br />
If a shipyard incurs additional costs, it can request that the Navy adjust the<br />
contract to recognize those costs. If the Navy agrees to an adjustment, it is<br />
liable for the additional costs. If the Navy does not agree to the request, the<br />
shipyard may file a claim against the Navy.<br />
Since July 199 1, the Navy has agreed to settle adjustments and claims of<br />
about $309.8 million. These settlements represent about 69 percent of the<br />
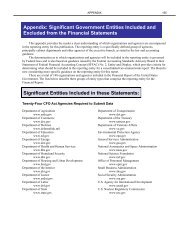
amounts originally submitted. The AOE-6 fast combat support ship (see<br />
fig. II. 1) program accounted for about $239 million of the total<br />
settlements. As of February 1992, about $349.7 mllhon in additional claims<br />
and adjustments were pending resolution.<br />
Page 13 GAO/NSIAD-92.218 Ship Construction Contra.&
Figure II.1 : U.S.S. SUPPLY Under Constructlon<br />
Appendix II<br />
Projected Coet Growth In 1991<br />
Source: National Steel and Shipbuilding Company.<br />
We compared the Navy’s current liability for adjustments and claims to that<br />
we reported in our 1990 report on cost growth. At that time the Navy had<br />
settled adjustments and claims of about $181.9 million-about 57 percent<br />
of the total amount originally submitted. We also reported that adjustments<br />
and claims totaling about $<strong>36</strong>7.9 million were pending resolution.<br />
Page 14 GAOMXAD-92-218 Ship Construction Contracts<br />
‘.
Appendix III<br />
Shipbuilding Cost Growth Is Increasing<br />
Total Cost Growth<br />
Trends<br />
Over the years, the costs of completing the Navy’s FPI ship construction<br />
contracts have continued to increase. When we reported on this issue in<br />
1989,’ total target costs had increased by $828.8 million, and the total<br />
completion cost estimates exceeded the current total target costs by about<br />
$3 billion. When we last reported on cost growth in 1990, target costs had<br />
increased by $847.2 million, and the projected over-target costs had<br />
increased by about $3.6 billion. Our current analysis, using July 1991<br />
data-the latest available-shows that the projected over-target increase is<br />
about $4.4 billion. Both the Navy’s and the shipyards’ share increased.<br />
When measured over the life of the FPI shipbuilding contracts, projected<br />
over-target costs generally increased early in the contracts’ life and then<br />
declined somewhat as the contracts approached completion.<br />
Navy officials cautioned that these observations reflect the numbers and<br />
types of ships under construction that were included in each of the reviews<br />
and that future shipbuilding programs could differ significantly.<br />
We compared data for the FPI contracts that were open in 199 1 to similar<br />
data for the contracts that were open in 198g2 and found that total cost<br />
growth was greater in both absolute (dollar value) and relative (as a<br />
percentage of target costs and ceiling prices) terms for the contracts<br />
reviewed in 1991 than for those reviewed in 1989. Also, four more<br />
199 1 -reviewed contracts had estimated completion costs that exceeded<br />
their current target costs than did the 1989~reviewed contracts. (See<br />
table III. 1 for a comparison of 1989 and 1991 costs on F’PI contracts.)<br />
Because work was completed on some contracts, options for additional<br />
ships were exercised on other contracts, and work started on new<br />
contracts, there were some differences between the ships making up the<br />
1989 data and those making up the 1991 data. However, similar numbers<br />
of ships were under construction at both points: 133 in 1989 and 135 in<br />
199 1. These ships involved 44 and 45 contracts in 1989 and 1991,<br />
respectively. A fuller comparison of ship types and numbers is discussed in<br />
appendix V.<br />
‘Navy Contracting: Cost Growth on Shipbuilding Contracts (GAO/NSIAD-89-189, Aug. 4,1989).<br />
‘Our 1990 report discussed the 1989 information.<br />
Page 15 GAO/NSIAD-92-218 Ship Construction Contracb<br />
4
Appendix III<br />
ShipbuildIng Cod Growth Ir Increadng<br />
Table 111.1: Coet Comparloona (FPI Contracts)<br />
-__--<br />
_._ Dollars . ..__. ._...-. in millions ._.-_ - ..- ~--<br />
Change<br />
Category for comparlron - September _ 1999 July 1991 Amount Percent<br />
_.__ Number ._.. .._ I of -. contracts . .._ ..~._ ~_.._ __.__.<br />
44 45 1 2.3<br />
Number .-._ _. of ships .._. -__. __ -_ -..-...<br />
133 135 2 1.5<br />
Target cost -._-___- --<br />
-_ ..-^ Initial .- _-__.<br />
..-.. Currenta ..__.......^<br />
..-.. --. ._-_-~ .__.<br />
__- $24,279.1<br />
~_ ._.... -.-.__ _._-___ __._______-_____ $25 I 126.3<br />
$24,765.9<br />
$25,864.8<br />
$486.8<br />
$738.5<br />
2.0<br />
2.9<br />
Target cost change<br />
-... Amount ..~_~-~_- ._... --- $847.2 $1,098.9 $251.7 29.7<br />
Percent<br />
_._.-- Estimate .._.” _.... at completion .-- .__ .._... --..- -.-___ -_<br />
-- 3.5<br />
$28,679.6<br />
4.4<br />
$30,300.8 $1,621.2 5.7<br />
-..-- Projected . _ .._. over-target .._ ._.... .-.. ._ increase -..-..---------.--_________<br />
Total<br />
. . . . ..__ Amount .--..-...- ..^ ---_ -..-_- -...___ --.-_-<br />
--..- ___---. Percent -..-..-. change --- _--- ~- -- ___-.<br />
--. <strong>Government</strong> ._ -I .._. ..__.... ____. share .~ ..-- .--_-.--__--<br />
---- $3,553.3<br />
14.1<br />
.--___ - $=8<br />
$4,4<strong>36</strong>.0<br />
17.2<br />
$2,011.7<br />
$882.7<br />
$579.9<br />
24.8<br />
40.5<br />
- _._..-___ Yard’s -..-_-.-.--... share<br />
Total growthb<br />
..-..-.<br />
$2,121.5 $2,424.3 $302.8 14.3<br />
Amount . ..-... ~-.--<br />
f§4,406.5 $5,534.9 $1,134.4 25.8<br />
.., ..- Percent _._ _ .._. -. _ ._ _ .^.. --_- ___<br />
18.1 22.3<br />
Ceilina or/c8 $33,242.8 $34,518.7 $1,275.9 3.8<br />
Comparison of Completion Under the terms of an F’PI<br />
Estimates to Ceiling Prices<br />
‘These are the current target costs reflected in the 1989 and 1991 ship cost adjustment reviews,<br />
respectively.<br />
?otal growth is the difference between the initial target costs and the completion estimates.<br />
contract, the shipyard is responsible for alI costs<br />
that exceed the contract’s ceiling price. Our comparison showed that,<br />
while the completion estimates exceeded the contracts’ ceiling prices of<br />
more contracts in 1991 than in 1989, the total costs that exceeded the<br />
ceiling prices decreased over the period. The number of contracts<br />
increased from 10 in 1989 to 14 in 199 1. However, the shipyards’ liability<br />
for over-ceiling costs decreased by about $144.5 miliion (from<br />
$964.3 miIIion to $819.8 million). The completion estimates on these<br />
contracts totaled 115 percent and 109 percent of the ceiling prices in 1989<br />
and 199 1, respectively.<br />
Table III.2 compares those contracts whose completion estimates did not<br />
exceed the ceiling prices at the time of our review.<br />
Page 16 GAO/NSIAD-92-218 Ship Construction Contra&
Table 111.2: FPI Contracta Whose<br />
Completion EstImatea Dld Not Exceed<br />
The Celling Price<br />
Individual Contract<br />
Trends<br />
Appendix III<br />
Shipbuilding Coot Growth b In-lug<br />
.-._--~ Dollars in . . millions -. -_. _._ ..__ -_-_I___<br />
Category _ _.. for ..- comparison ..- ~_. ..._~~<br />
Contracts<br />
Ships<br />
Ceiling price<br />
Estimate at completion<br />
Amount ~.. .~~. ~- . .._ ._._____<br />
Percent of ceiling price<br />
Amount below ceiling price<br />
-__<br />
19is 1991<br />
34 __--____--_-._ 31<br />
107<br />
$26,769.7 ~-...l!%L49s:~<br />
101<br />
$21,242.7<br />
$20,45&E<br />
79 80<br />
$5,527.5 $5,037.7<br />
We also compared the number of contracts whose estimated completion<br />
costs were equal to or less than the current target costs and found that the<br />
estimated completion costs of fewer of the 1991-reviewed FPI contracts<br />
were equal to or less than the current target costs than we reported in our<br />
1990 report. For the 199 1 -reviewed contracts, the estimated completion<br />
costs equaled the target costs of seven contracts and were lower than the<br />
target costs for three other contracts. In our 1990 report, we noted that the<br />
estimated completion costs equaled the target cost of 14 FPI contracts and<br />
were less than the target costs of 6 contracts.<br />
When measured over the life of the FPI shipbuilding contracts, over-target<br />
projections generally increased early in the contracts’ iife and then<br />
declined somewhat as they aged and approached completion. However, the<br />
decline in over-target projections did not match the increases.<br />
We analyzed projected over-target cost increases for three different FPI<br />
contract groups. One group consisted of those contracts we had first<br />
reported on in 1987.3 Seven of the original 22 contracts reviewed remained<br />
open at the time of this review. The other two groups consisted of<br />
contracts we had originaiIy reported on in our later reports. The number of<br />
ships included in each group varied somewhat as ships were completed<br />
and contract options for additional ships were exercised.<br />
Projected over-target costs initially increased for the 1987 and 1988<br />
contract groups, as shown in figure III. 1, and then declined somewhat as<br />
those contracts aged. In both cases, the number and types of ships under<br />
3Navy Contracting: Cost Overruns and Claima Potential on Navy ShIpbuilding Contracts<br />
(GAO/NSIADdB-16, Oct. 16, 1987).<br />
Page 17 GAOINSIAD-92-218 Ship Conetructlon Contracta
Figure III.1 : ProJoctod Over-Twgot<br />
Increaum of FPI Contracta<br />
Appendix III<br />
Shipbuilding Cost Growth Ia Incmudng<br />
construction remained unchanged as the decline occurred. The 1987<br />
contract group’s projected over-target cost increases peaked in 1990 at<br />
$1,946.8 milhon, approximately double its 1987 value. The total then<br />
declined to $1,889.8 million and $1,751.1 million in 1990 and 1991,<br />
respectively.<br />
#)o Dollrr~ In mllllonr<br />
1000<br />
1600<br />
1400<br />
1200<br />
loo0<br />
m<br />
600<br />
400<br />
200<br />
0<br />
Oala of data<br />
- 1987 contracts reviewed<br />
- 1988 contracts reviewed<br />
--- IQ88 contract8 reviewed<br />
The experience of the 1988 contract group was similar. Estimated<br />
over-target cost increases on those contracts reached a maximum of about<br />
$770.9 million in 1990-about 90 percent greater than their initial<br />
value-and then declined to about $749.1 mihion in 199 1, about a<br />
3-percent decrease.<br />
F’igure III. 1 shows a comparison of the contracts’ estimates at completion<br />
to the current target costs at several points over the contracts’ term. We<br />
also analyzed cost growth measured against the contracts’ original target<br />
Page 16 GAOINSIAD-92-218 Ship Construction Contract6<br />
. . ’
Contracts Nearing<br />
Completion<br />
Appendix III<br />
ShipbuildIng Cost Growth Is Increasing<br />
costs. Using this measure, the cost growth level for the 1987 contract<br />
group also declined from a peak of about $2,277.6 million in 1990 to about<br />
$2,220.1 million in 1991.<br />
Projected over-target costs increased for the 1989 contract group. Prom<br />
an initial level of about $658.2 million noted in our 1989 report, these<br />
costs increased approximately 90 percent to about $1,259.5 million in<br />
199 1. Over-target cost projections have not declined for this group.<br />
However, fewer years of data have been accumulated for this group than<br />
for the other two groups, and the ships have not reached the point where<br />
the other groups first exhibited the decline in cost growth.<br />
We analyzed data on 14 FPI contracts for which all ships had been delivered<br />
or were 90 percent or more complete as of 1991 and found that the<br />
completion cost estimates averaged 84 percent of the ceiling prices. Both<br />
ceiling prices and target costs on the contracts increased an average of<br />
9 percent from the initial contract award values to those reported when the<br />
contracts were over 90 percent complete. The group included contracts<br />
awarded between fiscal years 1981 and 1987.<br />
The target costs and ceiling prices for 10 of the contracts were less than<br />
10 percent above the original target costs and ceiling prices. The<br />
completion cost estimates for three of the contracts exceeded the current<br />
ceiling prices. The largest single target cost increase was about 35 percent,<br />
and the largest single ceiling price increase was about 47 percent.<br />
Page 19 GAOMXAD-92-218 Ship Construction Contra&
Appendix IV<br />
Budgeting for Ship Acquisition<br />
Funding Changes<br />
While its ship construction programs were adequately funded at the<br />
beginning of fiscal year 1992, the Navy may not be able to complete the<br />
programs within current funding levels because of continuing cost growth<br />
and the prospect of fewer future ship construction programs. The total<br />
estimated costs of the more recent ship construction programs’ (fiscal year<br />
1988 and later) have exceeded the amount that was originally appropriated<br />
for them. Moreover, costs for the ships’ basic constructior?-fabricating<br />
the hull and installing government-furnished equipment-are substantially<br />
higher than the original appropriations for all the years we reviewed. The<br />
Navy, with congressional approval, has in the past addressed funding<br />
shortfalls by redistributing funds among ship construction and other<br />
programs. To that end, the fiscal year 1992 Defense Appropriations Act<br />
transferred $1,496.6 million from existing Navy and Marine Corps<br />
programs. In addition, for the first time since fiscal year 1982, Congress<br />
provided $463.6 million in new funds to redress shipbuilding funding<br />
shortfalls. However, fewer funds may be available in the future for such<br />
transfers as the size of the fleet declines and fewer new ships are<br />
authorized.<br />
The combined total estimated costs of recent ship construction programs<br />
for fiscal years 1988 and later have exceeded the funds originally<br />
appropriated. Additionally, the combined estimated costs for the ships’<br />
basic construction have exceeded the funds originally appropriated for all<br />
the programs under way in July 199 1.<br />
According to Navy officials, sufficient funds must be appropriated for each<br />
ship construction program to cover the anticipated total cost of the<br />
program’s ships. If a program’s total cost estimate exceeds its budgeted<br />
funds as it progresses, the Navy and the Department of Defense (DOD)<br />
must request that Congress provide additional funds. They may request<br />
that Congress transfer or reprogram funds that have already been<br />
appropriated for other Navy or DOD programs to the affected ship<br />
construction program. The Navy has used this process extensively over the<br />
past several years to make up funding shortfalls in many individual ship<br />
construction programs. The Navy may also request that Congress provide<br />
‘A ship construction program includes those ships of a specific class for which construction is<br />
authorlzed and funds are appropriated in a specific year. For example, the flve guided missile<br />
destroyers for which funds were appropriated in fiscal year 1990 constitute one program.<br />
‘Our discussion of contract cost growth in appendixes II and III addresses this category.<br />
Page 20 GAO/NSIAD-92-218 Ship Construction Contrects<br />
b
Appendix lV<br />
Budgeting for Ship Acqubitlon<br />
additional funds. However, fiscal year 1992 was the first time the Navy had<br />
to do so since fiscal year 1982.<br />
Funds originally appropriated for existing ship construction programs can<br />
also be reduced for a variety of reasons. Funds may be transferred because<br />
actual costs were lower than budgeted for that program. In other instances,<br />
funds may be transferred because the program is considered to be a lower<br />
priority than another program needing additional funds. Additionally, ship<br />
construction funding levels have been reduced in the past in response to<br />
budget actions such as Gramm-Rudman-Hollings deficit reductions or<br />
other budget reductions.<br />
We compared the original appropriation levels for total estimated ship<br />
costs and basic ship construction costs to the levels supporting the fiscal<br />
year 1992 budget submission of the ship construction programs3 that were<br />
ongoing in July 199 1. As table IV. 1 shows, additional funds have been<br />
required for basic construction in each of the years-the fiscal year 1992<br />
total budget level is higher than the original total appropriation for each<br />
fiscal year program. The total increase over 9 years among the programs is<br />
about 10 percent.<br />
3These are ships under construction whose funds were appropriated in fiscal years 1983 through 199 1.<br />
Page 2 1 GAO/NSIAD-92-218 Ship Construction Contracts
Appendix Iv<br />
Budgeting for Ship Acquieltion<br />
Table<br />
---___-_---.___-<br />
IV.l: Selected Shlp Conrtructlon Funding Changes<br />
--_---<br />
__- Dollarsinthousands<br />
_...___ --..-..-----.- -.__ --. ~-_____~~~--__<br />
Change<br />
Category _-._-_ _.- by _.-. flrcal - year _.__--_-__---<br />
Baolc conrtructlon<br />
.__. Orlglnal ~.. approprlatlon .-__ --..-__--__ -..___. Aa of fiscal year 1992 Amount -___ Percent<br />
_l__.l 1963 _.-- .._." _._-... .~ __....._ --- ._._ -.--~----.-.--~-L. $2 965,100 .-__-.. $3,303,302 $338,202<br />
_- .._.. 1984 _. . -..-.-.^~_-.-.--- -- -- . 1,017,530 -...~-.~- ..-. --_-...-~-.. 1,197,234 .-. 179,704<br />
-___ 1965 -- __.. .._..__ - ..--- -.---..-.-._ .---... _. ..--_-...---~_-. 3,917,039 4,264,900 347,861<br />
..- _..... 191<strong>36</strong> __. _ -.. .-. .- ~~._.... ~. _~ 3950092 L.. ! .___ -- .._.. ~_~~- ~~..._________~ 4038,281 ____ ----..--~.I_---- 89,189<br />
1987 3,730,117 3,925,730 195,613<br />
~-.- 11.4<br />
__-- 17.7<br />
8.9<br />
2.3<br />
5.2<br />
_.. .._ 1988 .._.. -. 6,697,276 7475278 L ---.L-.<br />
_ '989 _- _- .._._ . . . . ..___.._ --- _....__ - ..__. -- _.._____ ..#!E!!!.16_9_- ._..._ ~~..___. ..___. !t~~--.--.~-~~L-<br />
__.... 1990 __ -...-- ._ _ -...-__ -.- ---.--...-_-_ __--.-_----- 3,<strong>36</strong>2,194 - ._... ---...--..--- ---- 3,614,687<br />
_.__, 1991 .__.._. . _.-..-__- _... - ._ -_--__-____-_---.-._.- ~___ 2,782282 --. L_. -...-_.-__-___. 2,939&'6<br />
TOMI $32.818.799 $35.998.592<br />
Total rhlp ootlmate<br />
776002 - --- _____<br />
841 265 ---_______--<br />
252,493 --__<br />
___. 157,!64_--_~-----<br />
$3,179,893<br />
11.6<br />
19.1<br />
-..-~ 7.5<br />
5.7<br />
9.7<br />
_-.- 1983 ^._._.._.. - ..__ .--.-_ ___--._ -__.- ____- .____ - .._-_ --.--_._-- $6,545,400 . .._~_~_.. __.... ~-.-.--___ $6,039,080 .-- --.-.__ ___-_..--_-.__----~ ($506,320)<br />
._.~ 1984 ..-..._" . ._ ._.-.. . . -..- -_-----_---.--- 2,155,065 -. ~~-.._--------- -----. 2,299,307 ---__I_--. 144242<br />
--.. 1985 ._-- _. _. __-..-... . .._.._. .^.__ _^.-.-_-.-- _.-_ ----.----.! 9 865,200 ..~ ____. 9,358,680 _-.----.- (506,520) ..--_.. ---<br />
--._- 1986 .-.. --~ . . . ~.~~. -. _--.--~ ~~-.-----~ -.-1.-- 8855742 _'.-..-.--..- _..-. --.-- .-.. .'---'- 8299784 ____. (555,958)<br />
i____..." 1987 I... _ _. . ..__-...--- . ..-. 9,443,688 9!3451~~~~-_(~,5301_-_--~~-~-<br />
--3E -~ . . -.--.-.-..-~ .-.... --.~-_----._.--- _... -.- _-.... 14~871,06'7 -- .--- - .-.----- 14,907,632_-- <strong>36</strong>,565 _______<br />
" -_.... 1989 -_--- -- .._ ._ ----. 10,256,138 L------- 11035,312 779,174 ~-<br />
_... -1990 _......____......._..._ _.- .._. .__--.-----...-___--_2,618,4_08 .-...-.- ~~.~/!Y!~go5 ---.I 328497<br />
1991 6,746,403 6,859,617 113,214 -__ --.__--<br />
-7.7 . ..--<br />
6.7<br />
-5.1<br />
-6.3<br />
-1.0<br />
0.2<br />
7.6<br />
4.3<br />
1.7<br />
Total $78,357,111 $78,091,475 ($285,835) -0.3<br />
The funds budgeted in fiscal year 1992 for the combined total estimated<br />
ship costs for the current programs were somewhat less (about 0.3<br />
percent) than the originally appropriated amounts. Fewer funds were used,<br />
for example, to procure government-furnished equipment. However, as<br />
table IV. 1 shows, the fiscal year 1988 and later programs have needed<br />
more funds than originally appropriated--the fiscal year 1992 total budget<br />
level is higher than the original total appropriation. This contrasts with the<br />
earlier program years (except fiscal year 1984), for which total funding<br />
levels of the ship construction programs have been lower than the original<br />
total appropriation.<br />
Ship construction cost increases are likely to continue. Acknowledging the<br />
recent funding shortfalls in April 1992 congressional testimony, a Navy<br />
official said that ship costs will continue to rise as the number of ships<br />
Page 22 GAO/NSIAD-92-218 Ship Conetruction Contra&m
Fiscal Year 1992<br />
Budget Actions<br />
Appendix N<br />
Budgeting for Ship Acquisition<br />
under construction decreases in the future and that the Navy’s flexibility to<br />
accommodate those cost increases has been eliminated.<br />
While shipbuilding funding shortfalls have been redressed through<br />
transfers among programs in the past, the Navy requested new funding<br />
authority as well as funding transfers for fiscal year 1992 to redress the<br />
current shortfalls. The fiscal year 1992 Defense Appropriations Act<br />
transferred $1,496.6 million from other Defense programs and provided<br />
$463.6 million in new budget authority for that purpose.<br />
Origin of Shortfall In the 1990 annual review of ship acquisition programs, the Navy identified<br />
a total shortfall of $1,22 1.7 million in its shipbuilding accounts. It noted<br />
that higher than projected inflation, cost growth on the contracts, and<br />
congressionally imposed reductions contributed to the shortfall. According<br />
to Navy officials, the Navy initially planned to request new funding<br />
authority for the entire $1.2 billion in its fiscal year 1992 budget<br />
submission. However, Navy officials told us that the Department of<br />
Defense believed it was inappropriate to request new funding authority for<br />
over-target cost growth since that growth was not totally due to factors<br />
beyond the Navy’s control. Nonetheless, DOD believed that it was<br />
appropriate to request new funding for the portion of the shortfall caused<br />
by higher than expected inflation rates as this factor is beyond the Navy’s<br />
and the shipyards’ control. As a result, the Navy requested $524.9 million<br />
in new funding for its ongoing shipbuilding programs in its fiscal year 1992<br />
budget submission.<br />
The Navy also requested that a total of $696.8 million be transferred<br />
among various shipbuilding programs or into the shipbuilding programs<br />
from other procurement programs. Shipbuilding accounts provided the<br />
majority of the funds ($585.1 million, or 84 percent), the bulk of which<br />
($398.2 million) was to be made available by canceling the construction of<br />
the fiscal year 199 1 AOE-6 class fast combat support ship.J About<br />
70 percent of the funds in the transfer request ($483.6 million) were to be<br />
designated for the SSN-688 attack and ballistic missile submarine<br />
programs-$274.6 million and $208.9 mihion, respectively.<br />
4Congress, in the Fiscal Year 1991 Dire Supplemental Appropriation Act, directed that $237 million of<br />
these funds be reserved to pay potential claima arising from the construction of three earlier ships of<br />
this class.<br />
Page 23 GAO/T<strong>US</strong>IAD-92-2lS Ship Conotruction Contracts
The F’iscal Year 1992<br />
Appropriations Act<br />
Escalation on<br />
Shipbuilding Contracts<br />
Appendix N<br />
Budgeting for Ship Acquisition<br />
The fiscal year 1992 Defense Appropriations Act provided $463.6 million<br />
for escalation on prior-year ship construction programs-$61.3 million less<br />
than the Navy originally requested. Navy officials said the escalation<br />
funding provided was reduced from the originally requested $524.9 million<br />
because some of the originally requested funds could not be used by the<br />
time the act was signed. After submitting its budget request, the Navy used<br />
other funds to pay the shipyards as escalation payments became due. Since<br />
the escalation funds in the budget request were requested and provided<br />
with the stipulation that they could be applied only to contract escalation,<br />
the full request was not needed. The SSN-688 attack submarine, ballistic<br />
missile submarine, and aircraft carrier programs received the bulk of the<br />
escalation funds appropriated-$378.2 million, or about 82 percent.<br />
The act also authorized the transfer of $1,496.6 million for other ship<br />
construction cost growth, an increase of $797.8 million from the Navy’s<br />
original request. The amount transferred was increased because additional<br />
funding shortfalls were identified during the 199 1 Ship Cost Adjustment<br />
Review. The DDG-51 program received the largest amount-$2<strong>36</strong>.9 million<br />
(16 percent)-of the total funds provided through transfers. That program<br />
and the SSN-688 attack and ballistic missile submarine programs received<br />
a combined total of $668.8 million, about 45 percent of the total funds<br />
transferred. Almost 60 percent ($893.5 million) of the funds transferred<br />
were made available by cancellation of the A-l 2 attack aircraft program.<br />
According to Navy officials, the $524.9 million requested for escalation<br />
was specifically to reimburse the shipyards, under provisions negotiated in<br />
each contract, for changes in labor and material costs over which the<br />
shipyards had little or no control. Because shipbuilding contracts have<br />
such long lives-at the time of our review ships were being built under<br />
contracts that had been awarded as long ago as fiscal year 1983-it can be 6<br />
difficult to accurately predict future costs when bidding on a contract.<br />
Escalation is a separate element in ship procurement budgets. The amount<br />
is determined for each ship using several factors. These include the ship’s<br />
delivery schedule, Bureau of Labor Statistics index values of actual<br />
inflation for labor and material, current target cost, the funds to be spent<br />
over the remaining life of the contract, and guidance from the <strong>Office</strong> of the<br />
Secretary of Defense and the <strong>Office</strong> of Management and Budget.<br />
A Navy official said that the additional escalation funds were needed<br />
because the 1990 inflation indices used to estimate escalation costs were<br />
Page 24 GAO/NSIAD-92-218 Ship Conetruction Contracts
Appendix N<br />
Budgeting for Ship Acquisltlon<br />
generally much higher than the 1989 indices. Because the indices were<br />
higher, the projected escalation costs for the contracts increased and<br />
additional funds were needed to keep the ship construction programs fully<br />
funded.<br />
Changes in the other factors also affect the total funds required for<br />
escalation. For example, escalation increases if a ship’s delivery is delayed<br />
because it accrues for a longer period of time. Increased target costs have<br />
a similar effect because escalation is then determined from a larger base.<br />
Increased payments to shipyard workers for fringe benefits may also<br />
increase escalation payments.<br />
Page 26 GAO/NSIAD-92-218 Ship Construction Contracts
Appendix V<br />
Objectives, Scope, and Methodology<br />
This review is the latest in a series to examine cost growth on the Navy’s<br />
open ship construction contracts. Our objectives were to update the status<br />
of the cost growth, identify trends in that growth, and review Navy<br />
practices for financing additional costs.<br />
To update the status of cost growth and identify any trends in that growth,<br />
we interviewed officials and obtained budget, financial, and other<br />
documents from Headquarters, Department of the Navy, and<br />
Headquarters, Naval Sea Systems Command. We obtained and analyzed<br />
data concerning contract cost growth that reflected the results of the<br />
Navy’s ship cost adjustment reviews for 1990 and 1991. We also compared<br />
this data to data from the 1989 review, which was the basis of our 1990<br />
report.<br />
Because work was completed on some contracts, options for additional<br />
ships were exercised on other contracts, and work started on new<br />
contracts, there were some differences among the ships making up the<br />
1989 ship cost adjustment data and those making up the 1991 data. The<br />
1989 data encompassed 44 F’PI contracts and 133 ships. The 1991 data<br />
encompassed 45 FPI contracts and 135 ships. The most significant changes<br />
in the ships considered occurred in attack submarines, cruisers, and<br />
guided missile destroyers. The 199 1 data included 2 1 SSN-688 class attack<br />
submarines-7 fewer than the 1989 data. Two SSN-21 submarines were in<br />
the 199 1 data but were not in the 1989 data. The number of cruisers<br />
decreased by 3, to 14. While actual work had started on 12 guided missile<br />
destroyers, 17 ships were included in the 1991 data compared to 8 in the<br />
1989 data.<br />
In analyzing funding changes among the ship construction programs, we<br />
obtained and analyzed data that showed the programs’ original<br />
appropriation levels and the funding levels reflected in the fiscal year 1992<br />
congressional budget submission. This analysis encompassed the same<br />
ship construction programs included in the 199 1 ship cost adjustment<br />
review.<br />
We analyzed cost growth for three different FPI contract groups to identify<br />
any long-term trends. One contract group consisted of the 7 of the original<br />
22 contracts that we had first reported on in 1987 and that remained open<br />
at the time of this review. The other two groups consisted of contracts<br />
whose growth we had originally reported on in our later reports. We did<br />
not include any contracts first included in our latest reports because the<br />
data accumulated on those contracts were not sufficient to analyze trends.<br />
Page 26 GAO/NSIAD-92-218 Ship Construction Contracts
Appendix V<br />
ObJectlver, Scope, and Methodology<br />
The 7 contracts in the 1987 group included from 19 to 21 ships under<br />
construction. The number of ships under construction under the 4<br />
contracts in the 1988 group ranged from 7 to 12. Twenty contracts were<br />
included in the 1989 group, with the ships in that group ranging from 62 to<br />
77. Air cushion landing craft comprise about half the ships in this group.<br />
The number of ships in each group varied as contract options for additional<br />
ships were exercised. Each group included a mix of ship types. The 1989<br />
group was the most diverse. We analyzed cost growth at up to six points<br />
for each group. These were, as appropriate, the cost growth reported in<br />
our 1987,1988,1989, and 1990 reports and the Navy’s 1990 and 1991<br />
cost reviews.<br />
For our analysis of completed contract costs, we reviewed cost growth data<br />
for 14 FPI contracts included in our previous reviews for which all ships<br />
were either delivered or were 90 percent or more complete as of the Navy’s<br />
199 1 review. Navy officials said that costs for these contracts usually<br />
remain stable. The group included contracts awarded between fiscal years<br />
198 1 through 1987 under which a variety of ships-submarines, aircraft<br />
carriers, cruisers, destroyers, oilers, and landing craft-were constructed.<br />
We analyzed the data to determine the magnitude of changes to target<br />
costs, ceiling prices, and completion estimates over the life of the<br />
contracts. We also compared each contract’s last reported completion<br />
estimate to its last reported ceiling price.<br />
In conducting our review, we used the same accounting systems, reports,<br />
records, and statistics that the Navy uses for ship construction to make<br />
decisions, establish program budgets, and monitor contracts. Since the<br />
contracts we reviewed were open, the information we obtained does not<br />
represent their completed costs but reflects cost data and estimates<br />
derived at various points in the contracts’ life. We did not independently<br />
determine the data’s reliability.<br />
Our review was performed from February 1991 through February 1992 in<br />
accordance with generally accepted government auditing standards.<br />
Page 27 GAO/NSLAD-92-218 Ship Construction Contracts
Appendix VI<br />
Comments From the Department of Defense<br />
ACPUI8ITION<br />
OFFICE OF THE UNDER SECRETARY OF DEFENSE<br />
WASHINGTON, DC 20301-3000<br />
Mr. Frank C. Conahan<br />
Assistant Comptroller General<br />
National Security and International<br />
Affairs Division<br />
United States General Accounting <strong>Office</strong><br />
Washington, DC 20548<br />
Dear Mr. Conahan:<br />
Jul 0 8 1992<br />
This is the Department of Defense (DOD) response to the<br />
General Accounting <strong>Office</strong> (GAO) draft report entitled "NAVY<br />
CONTRACTING: Cost Growth Continues on Ship Construction<br />
Contractsrw dated May 28, 1992 (GAO code 394419, OSD case<br />
9087). The DOD agrees with the report findings and<br />
conclusions.<br />
The GAO assertion that continuing cost growth above<br />
contract targets for shipbuilding programs cannot be absorbed<br />
within DOD'S budget due to a declining overall Defense budget<br />
needs to be clarified. In recent years the Department has<br />
attempted to budget to most likely cost. Much of the $6.4<br />
billion cost growth cited by GAO originated from contracts<br />
awarded in the early to middle 1980s. During that period,<br />
shipbuilders submitted very aggressive offers due to<br />
diminishing commercial work. As a result of reduced workload<br />
and overly optimistic offers, contract targets agreed upon in<br />
that time period became unachievable. Since then the<br />
Department has attempted to reserve funding within the budget<br />
to cover the most likely cost of shipbuilding contracts. The<br />
change should minimize the requirements for future funding<br />
increases.<br />
The Department appreciates the opportunity to comment on<br />
the draft.<br />
Sincerely,<br />
Eleanor R. Spector<br />
Director, Defense Procurement<br />
Page 28 GAO/TWIAD-92-218 Ship Construction Contracts<br />
4
Appendix VII<br />
Major Contributors to This <strong>Report</strong><br />
National Security and<br />
International Afhirs<br />
Division, Washington,<br />
DC.<br />
Norman J. Rabkin, Associate Director<br />
Richard J. Herley, Assistant Director<br />
Tim F. Stone, Evaluator-in-Charge<br />
James B. Do&d, Jr., Evaluator -<br />
Edna Thea Falk, Evaluator<br />
Page 29 GAO/NSIAD-92-218 Ship Construction Contracta<br />
4
Page SO<br />
GAO/NSIAD-92-218 Ship Construction Contracts
Page 3 1 GAO/NSIAD-92-218 Ship Construction Contracts
Related GAO Products<br />
Navy Contracting: Ship Construction Contracts Could Cost Billions Over<br />
Initial Target Costs (GAO/NSIAD-91-18, Oct. 5, 1990).<br />
Navy Shipbuilding: Cost and Schedule Problems on the DDG-51 AEGIS<br />
Destroyer Program (GAO/r-NSIAD-99-14, Jan. 24, 1990).<br />
Navy Shipbuilding: Cost and Schedule Problems on the DDG-5 1 AEGIS<br />
Destroyer Program (GAO/NSIAD-99-84, Jan. 17, 1990).<br />
Navy Contracting: Status of Cost Growth and Claims on Shipbuilding<br />
Contracts (GAO/NW089-189, Aug. 4, 1989).<br />
Navy Ship Construction Contracts (GAO/l’-NSIAD-88-27, Apr. 19, 1988).<br />
Navy Ship Construction Contracts (GAO/r-NSIAD-88-9, Dec. 8, 1987).<br />
Navy Contracting: Cost Overruns and Claims Potential on Navy<br />
Shipbuilding Contracts (GAO/NSIAD-88-15, Oct. 16, 1987).<br />
Navy Contracting: Fiscal Year 1986 Contract Award for Construction of<br />
SSN-688 Submarines (GAO/N&W-87-120, May 4, 1987).<br />
Navy Ship Construction Contracts (GAO/r-NSIAD-87-30, Apr. 23,1987).<br />
(saula) Page 82 GAO/NSIAD-92418 Ship Construction Contracts<br />
a
~-._~<br />
Ordering Information<br />
The first copy of each GAO report and testimony is free. Additional<br />
copies at-r $2 each. Orders should be sent to the following address,<br />
accompanied by a check or money order made out to the Superin-<br />
tendent. of Documents, when necessary. Orders for 100 or more<br />
copies to be mailed to a single address are discounted 25 percent.<br />
I T.S. Gt~nt*ral Accounting <strong>Office</strong><br />
P.O. hx 6015<br />
(;ait htlrsburg, MD 20877<br />
Ordt~rs may also be placed by calling (202) 2756241.