Macaca munzala - Nature Conservation Foundation
Macaca munzala - Nature Conservation Foundation
Macaca munzala - Nature Conservation Foundation

Create successful ePaper yourself
Turn your PDF publications into a flip-book with our unique Google optimized e-Paper software.
Abstract<br />
Phylogenetic relationships and morphometric affinities of the<br />
Arunachal macaque <strong>Macaca</strong> <strong>munzala</strong>, a newly described primate<br />
from Arunachal Pradesh, northeastern India<br />
Debapriyo Chakraborty a,b , Uma Ramakrishnan c , Jikom Panor d ,<br />
Charudutt Mishra b,e , Anindya Sinha a,b,f, *<br />
a National Institute of Advanced Studies, Indian Institute of Science Campus, Bangalore 560012, India<br />
b <strong>Nature</strong> <strong>Conservation</strong> <strong>Foundation</strong>, 3076/5, 4th Cross, Gokulam Park, Mysore 570002, India<br />
c National Centre for Biological Sciences, GKVK Campus, Bangalore 560065, India<br />
d Zoological Park, Itanagar 791113, India<br />
e International Snow Leopard Trust, 4649, N. Sunnyside Avenue, Suite 325, Seattle, Washington 98103, USA<br />
f Indian Association for Cultivation of Science, 2A-2B Raja S C Mullick Road, Jadavpur, Kolkata 700032, India<br />
Received 16 September 2006; revised 10 March 2007; accepted 5 April 2007<br />
Available online 20 April 2007<br />
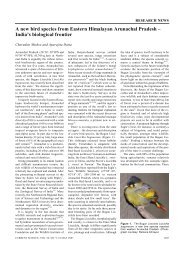
A new species of primate, the Arunachal macaque <strong>Macaca</strong> <strong>munzala</strong>, belonging to the sinica species-group of the genus, was described<br />
from northeastern India in 2005, and, based on its appearance and distribution, hypothesised to be closely related to M. assamensis and<br />
M. thibetana. We subsequently obtained an entire adult male specimen and tissue remains from two other M. <strong>munzala</strong> individuals.<br />
Molecular analyses establish the distinct identity of the species and indicate a time of origin of c. 0.48 mya for it. The species also shows<br />
close phylogenetic affinities with the allopatric M. radiata and with the geographically closer M. assamensis and M. thibetana, possibly<br />
mediated by male introgression from an ancestral M. assamensis–M. thibetana stock into an ancestral M. <strong>munzala</strong> stock. Morphometric<br />
analyses, on the other hand, reiterate its close similarity only with M. assamensis and M. thibetana, presumably resulting from convergent<br />
evolution under similar ecological conditions and along a latitudinal gradient, as predicted by Bergmann’s and Allen’s rules.<br />
Ó 2007 Elsevier Inc. All rights reserved.<br />
Keywords: Arunachal macaque; <strong>Macaca</strong> <strong>munzala</strong>; <strong>Macaca</strong> radiata; <strong>Macaca</strong> assamensis; <strong>Macaca</strong> thibetana; <strong>Macaca</strong> sinica; Cytochrome b; D-loop; TSPY;<br />
Molecular phylogeny; Morphometry; Convergent evolution<br />
1. Introduction<br />
Molecular Phylogenetics and Evolution 44 (2007) 838–849<br />
A previously undescribed species of primate belonging<br />
to the genus <strong>Macaca</strong> was recently discovered in the eastern<br />
Himalayan state of Arunachal Pradesh in north-east India,<br />
and described as a new species, the Arunachal macaque<br />
<strong>Macaca</strong> <strong>munzala</strong> (Sinha et al., 2005). The holotype and<br />
* Corresponding author. Address: National Institute of Advanced<br />
Studies, Indian Institute of Science Campus, Bangalore 560012, India.<br />
Fax: +91 80 22185024.<br />
E-mail addresses: asinha@nias.iisc.ernet.in, anindyaranasinha@<br />
yahoo.com (A. Sinha).<br />
1055-7903/$ - see front matter Ó 2007 Elsevier Inc. All rights reserved.<br />
doi:10.1016/j.ympev.2007.04.007<br />
www.elsevier.com/locate/ympev<br />
paratypes of the species were depicted by photographs,<br />
and the distinctive identity of M. <strong>munzala</strong> was diagnosed<br />
based on a combination of appearance and colouration,<br />
relative tail length, and geographical distribution (Sinha<br />
et al., 2005). The species, a member of the sinica speciesgroup<br />
of the genus <strong>Macaca</strong> (classified according to penis<br />
morphology), was thought to be closely related to the<br />
Tibetan macaque M. thibetana and the Assamese macaque<br />
M. assamensis based on their morphological similarities<br />
(Sinha et al., 2005).<br />
On March 7, 2005, we obtained an entire specimen of an<br />
adult male M. <strong>munzala</strong> in the Zemithang region of western<br />
Arunachal Pradesh, which had entered a house and had
een killed by the villagers in self-defense. The specimen<br />
was treated at the Itanagar Zoo, tissues collected for molecular<br />
analyses, and the skull, baculum, and caudal vertebrae<br />
measured and described. The skin, skull, and all retrieved<br />
bones and vertebrae were deposited with the Arunachal<br />
Pradesh Forest Department, for preservation at the State<br />
Forestry Research Institute in Itanagar (Accession Nos.:<br />
2005.01.01–2005.01.10). During our field surveys, two<br />
other tissue samples of M. <strong>munzala</strong> were also obtained<br />
from Gyamdong and Lhou, villages close to Zemithang,<br />
from where the species was originally reported.<br />
In addition to M. <strong>munzala</strong>, M. assamensis, and M. thibetana,<br />
the sinica species-group also includes the bonnet<br />
macaque M. radiata and the toque macaque M. sinica,<br />
which are endemic to peninsular India and Sri Lanka,<br />
respectively. Although the evolutionary history of <strong>Macaca</strong><br />
has been broadly studied using molecular phylogenetic<br />
approaches (Hayasaka et al., 1988; Morales and Melnick,<br />
1998; Tosi et al., 2000, 2003), specific phylogenetic relationships<br />
and the evolutionary history of the sinica speciesgroup<br />
of the macaques remain unknown. To test whether<br />
M. <strong>munzala</strong> is indeed closely related to M. thibetana and<br />
M. assamensis, and to determine its phylogenetic position<br />
within the sinica group, we conducted molecular analyses<br />
of mitochondrial (cytochrome b and D-loop) and nuclear<br />
(TSPY gene on the Y-chromosome) sequences of M. <strong>munzala</strong><br />
(three individuals) and M. radiata (four individuals),<br />
and compared them with available published sequences<br />
of M. thibetana, M. assamensis and M. sinica. In order to<br />
assess the role of ecology in the evolution of this group<br />
of primates, we also compared morphological (body mass,<br />
relative tail length) and anatomical (skull, caudal vertebrae,<br />
and baculum morphometrics) characteristics of these five<br />
species. Evolutionary trends within these morphological<br />
and anatomical traits were examined across a latitudinal<br />
gradient in accordance with the predictions made by Bergmann’s<br />
and Allen’s rules (Allen, 1877, see Meiri and<br />
Dayan, 2003 for a review of Bergmann’s rule).<br />
2. Methods<br />
2.1. DNA extraction and amplification<br />
D. Chakraborty et al. / Molecular Phylogenetics and Evolution 44 (2007) 838–849 839<br />
DNA was extracted from three M. <strong>munzala</strong> skin samples<br />
and four M. radiata blood samples using a DNeasy tissue<br />
kit (Qiagen, Hilden, Germany) following procedures recommended<br />
by the supplier, with the exception that DNA<br />
was incubated for 15 min in 100 ll elution buffer before<br />
elution. To study the evolutionary origin of M. <strong>munzala</strong><br />
and its relationship with other members of the sinica species-group,<br />
we used both maternally (mitochondrial) and<br />
paternally (Y-chromosomal) inherited markers. All the<br />
polymerase chain reactions (PCRs) were carried out in a<br />
reaction volume of 10 ll. The final concentration of the<br />
reaction mixture was: 1· Taq Buffer B without MgCl2,<br />
2 mM MgCl 2, 1.5 U Taq DNA Polymerase (Bangalore<br />
Genei, Bangalore, India), 0.25 mM dNTP mix (Eppendorf,<br />
Hamburg, Germany), 0.1 lM of each primer (Sigma–<br />
Aldrich Chemicals, Bangalore, India), and about 1–1.5 ll<br />
of DNA extract. All the reactions were carried out in two<br />
Eppendorf mastercylers (Eppendorf, Hamburg, Germany),<br />
one gradient and the other non-gradient.<br />
We chose two different segments of the mitochondrial<br />
DNA rather than a single large one in order to better represent<br />
its genetic variability. We amplified a 424-bp long<br />
tRNA Glu -cytochrome b segment of the coding region of<br />
the mitochondrial DNA using the L14724 (5 0 -CGAAGC<br />
TTGATATGAAAAACCATCGTTG-3 0 ) and H15149<br />
(5 0 -AAACTGCAGCCCCTCAGAATGATATTTGTCCT<br />
CA-3 0 ) primer set from Li and Zhang (2005). In order to<br />
also sample a non-coding region of the mitochondrial genome,<br />
we amplified a 534-bp long D-loop region using the<br />
LqqF (5 0 -TCCTAGGGCAATCAGAAAGAAAG-3 0 ) and<br />
TDKD (5 0 -CCTGAAGTAGGAACCAGATG-3 0 ) primer<br />
set from Li and Zhang (2004). We conducted a standard<br />
35-cycle PCR to amplify the target regions with a denaturation<br />
of 20 s at 94 °C, annealing of 30 s at 51 °C (cytochrome<br />
b) orat59°C (D-loop), and an extension of 20 s<br />
(cytochrome b) or 35 s (D-loop) at 72 °C. Finally, we<br />
amplified two segments of the TSPY (Testis-Specific Protein,<br />
Y-chromosome) gene, with a total length of<br />
1.4 kb, using the TSPY-A (5 0 -AGCCAGGAAGGCCT<br />
TTTCTCG-3 0 ) and 740R (5 0 -GATCATGTAGCTCAGC<br />
ATGTCT-3 0 ), and the E700F (5 0 -GTCCGTCTTATCCA<br />
TGYCGA-3 0 ) and TSPY5R (5 0 -CTGTGCATAAGACCA<br />
TGCTGAG-3 0 ) primer sets, respectively (Tosi et al.,<br />
2000). Each of the segments was separately amplified at<br />
an annealing temperature of 58 °C for 30 s and an extension<br />
temperature of 72 °C for 1 min keeping the other<br />
conditions as above.<br />
2.2. DNA sequencing<br />
All the PCR products were checked visually by running<br />
1 ll of the product in 1% Agarose gels (Bangalore Genei,<br />
Bangalore, India) and were purified using Qiagen PCR<br />
purification kit (Qiagen, Hilden, Germany). The concentrations<br />
were measured by loading 2 ll of the PCR products<br />
in a NanoDrop ND-1000 Spectrophotometer (Nanodrop<br />
Technologies, Delaware, USA). Sequencing was accomplished<br />
using an ABI 310 Genetic Analyzer, and the raw<br />
sequences analysed with the ABI 310 Genetic Analyzer<br />
Version 3.1 software (Applied Biosystems, Foster City,<br />
USA). Both forward and reverse sequencing reactions were<br />
analyzed.<br />
2.3. Phylogenetic analyses<br />
The M. <strong>munzala</strong> and M. radiata sequences were edited<br />
manually and assembled using the Mega 3.1 sequence editor<br />
(Kumar et al., 2004). They were multiple aligned<br />
together with M. assamensis, M. thibetana, and M. sinica<br />
sequences, downloaded from GenBank, using ClustalW<br />
in Mega 3.1 Alignment Explorer with default parameters.
840 D. Chakraborty et al. / Molecular Phylogenetics and Evolution 44 (2007) 838–849<br />
Appropriate sequences of Papio hamadryas, M. sylvanus<br />
and M. arctoides were also downloaded and used in the<br />
phylogenetic analysis to root the reconstructed trees. The<br />
origins, sources and abbreviations of all the individuals<br />
subjected to molecular phylogenetic analyses are listed in<br />
Tables 1a and 1b.<br />
Average genetic distances between and within the five<br />
species of the sinica group were calculated using the Kimura-2-parameter<br />
model in Mega 3.1 (Kumar et al., 2004).<br />
The nucleotide diversity of the mitochondrial and nuclear<br />
DNA sequences were calculated using DnaSP Version<br />
4.10 (Rozas et al., 2003). Phylogenetic analyses were conducted<br />
using the maximum likelihood (ML) and Bayesian<br />
inference (BI) methods in PAUP* (Swofford, 2002) and<br />
MrBayes Version 3.1 (Ronquist et al., 2005), respectively.<br />
In all cases, trees were built independently for the cytochrome<br />
b and D-loop sequences, the combined mitochondrial<br />
DNA data, and for the combined segments of the<br />
TSPY marker. Prior to phylogenetic analyses, ModelTest<br />
Version 3.8 (Posada, 2006) was used to determine the<br />
best-fit model (based on Akike Information Criterion) for<br />
the separate and combined datasets. These analyses<br />
revealed GTR+G+I to be the most appropriate evolutionary<br />
model for both cytochrome b and D-loop, TVM+I+G<br />
for the combined mitochondrial DNA data, and GTR for<br />
the TSPY marker. The ML trees were reconstructed using<br />
the above evolutionary models and tested with 500 bootstrap<br />
replicates each. The BI trees were reconstructed<br />
assuming only a GTR evolutionary model and by allowing<br />
the program to generate all the other parameters independently.<br />
The phylogenetic analyses were run for 10 6 generations<br />
for the mitochondrial data and 2 · 10 6 generations<br />
for the nuclear data to ensure convergence. Samples were<br />
collected every 1000 generations and 4 chains (1 cold and<br />
3 heated) were used for the Markov Chain Monte Carlo<br />
(MCMC) procedure in all cases. The first 25% of the collected<br />
posterior data were discarded to allow ‘burnin’<br />
(Ronquist et al., 2005).<br />
2.4. Estimation of divergence times<br />
The relative evolutionary rates of the different lineages<br />
within all the phylogenetic trees were calculated using the<br />
software RRTree (Robinson-Rechavi and Huchon, 2000).<br />
The null hypothesis, that the rate of evolution is homogeneous<br />
among all branches within each phylogeny, was<br />
rejected for many of the lineages and a strict molecular<br />
clock was thus considered inappropriate. Divergence times<br />
were calculated using the software r8s Version 1.71 (Sanderson,<br />
2003). The divergence times for the mitochondrial<br />
and Y-chromosomal trees were estimated separately. As<br />
many of the lineages exhibited heterogeneity in their<br />
Table 1a<br />
Origin, source and abbreviation of the individuals subjected to mitochondrial DNA analysis<br />
Species Origin GenBank Accession No. Abbreviation Reference<br />
Cytochrome b D-loop<br />
<strong>Macaca</strong> assamensis Myanmar AY685859 AY682619 Myanmar1 Cytochrome b: Li and Zhang (2005)<br />
Myanmar AY685861 AY682621 Myanmar2 D-loop: Li and Zhang (2004)<br />
Myanmar AY685860 AY682620 Myanmar3<br />
Myanmar AY685862 AY682622 Myanmar4<br />
Vietnam AY685852 AY682611 Vietnam1<br />
Vietnam AY685853 AY682613 Vietnam2<br />
Vietnam AY685857 AY682617 Vietnam3<br />
Yunnan, China AY685854 AY682614 Yunnan1<br />
Yunnan, China AY685855 AY682615 Yunnan2<br />
Yunnan, China AY685856 AY682616 Yunnan3<br />
Yunnan, China AY685863 AY682612 Yunnan4<br />
South China AY685858 AY682618 South China<br />
<strong>Macaca</strong> thibetana Sichuan, China AY685864 AY682610 Sichuan1 Cytochrome b: Li and Zhang (2005)<br />
Sichuan, China AY685865 AY682607 Sichuan2 D-loop: Li and Zhang (2004)<br />
Sichuan, China AY685866 AY682608 Sichuan3<br />
Sichuan, China AY685867 AY682609 Sichuan4<br />
Sichuan, China AY685868 AY682606 Sichuan5<br />
<strong>Macaca</strong> <strong>munzala</strong> Tawang, India DQ859977 DQ859982 Tawang1 Cytochrome b: This study<br />
Tawang, India DQ859975 DQ859980 Tawang2 D-loop: This study<br />
Tawang, India DQ859976 DQ859981 Tawang3<br />
<strong>Macaca</strong> radiata Karnataka, India DQ859973 DQ859978 Karnataka1 Cytochrome b: This study<br />
Karnataka, India DQ859974 DQ859979 Karnataka2 D-loop: This study<br />
<strong>Macaca</strong> sylvanus Unknown AJ309865 AJ309865 M. sylvanus1 Cytochrome b: Arnason et al. (2000)<br />
Unknown NC_002764 NC_002764 M. sylvanus2 D-loop: Arnason et al. (2000)<br />
Papio hamadryas Unknown NC_001992 NC_001992 P. hamadryas1 Cytochrome b: Arnason et al. (1998)<br />
Unknown Y18001 Y18001 P. hamadryas2 D-loop: Arnason et al. (1998)
Table 1b<br />
Origin, source and abbreviation of the individuals subjected to TSPY sequence analysis<br />
Species Origin GenBank Accession No. Abbreviation Reference<br />
<strong>Macaca</strong> assamensis Southern China AY224236 South China1 Tosi et al. (2003)<br />
Southern China AF284244 South China2 Tosi et al. (2000)<br />
<strong>Macaca</strong> thibetana Southeastern China AY224237 Southeast China1 Tosi et al. (2003)<br />
Southeastern China AF284276 Southeast China2 Tosi et al. (2003)<br />
<strong>Macaca</strong> <strong>munzala</strong> Tawang, India EF222279 Tawang1 This study<br />
Tawang, India EF222280 Tawang2 This study<br />
Tawang, India EF222281 Tawang3 This study<br />
<strong>Macaca</strong> radiata India AF284271 India1 Tosi et al. (2000)<br />
India AF284270 India2 Tosi et al. (2000)<br />
Karnataka, India EF222277 Karnataka1 This study<br />
Karnataka, India EF222278 Karnataka3 This study<br />
<strong>Macaca</strong> sinica Polonnaruwa, Sri Lanka AF284234 Sri Lanka1 Tosi et al. (2000)<br />
Polonnaruwa, Sri Lanka AF284273 Sri Lanka2 Tosi et al. (2000)<br />
AF284233 Sri Lanka3 Tosi et al. (2000)<br />
<strong>Macaca</strong> arctoides Malaysia AF284240 Malaysia1 Tosi et al. (2003)<br />
Unknown AF284241 Unknown Tosi et al. (2003)<br />
Thailand AF284242 Thailand1 Tosi et al. (2003)<br />
Vietnam AF284243 Vietnam1 Tosi et al. (2003)<br />
<strong>Macaca</strong> sylvanus Northwestern Africa AF284274 M. sylvanus3 Tosi et al. (2000)<br />
Northwestern Africa AF284275 M. sylvanus4 Tosi et al. (2000)<br />
Northwestern Africa AF425281 M. sylvanus5 Tosi et al. (2002)<br />
Papio hamadryas Eastern Africa AF284277 P. hamadryas3 Tosi et al. (2000)<br />
evolutionary rates, we used the NPRS method (Sanderson,<br />
1997) and the POWELL algorithm to reconstruct their<br />
divergence times. For the mitochondrial DNA trees, we<br />
have constrained the root (the Papio–<strong>Macaca</strong> split) to lie<br />
between 8.6 and 10.9 million years ago (mya), as determined<br />
by an analysis of the entire mitochondrial genome<br />
(Raaum et al., 2005). It should be noted that the palaeontologically<br />
determined date of 10 mya for this split (Delson,<br />
1980) falls within this range. Along with this constraint, we<br />
fixed the next split between M. sylvanus and the other taxa<br />
within the genus at 5.5 mya (Delson, 1996). We have, however,<br />
used only the palaeontologically determined dates of<br />
10 and 5.5 mya, respectively, to calibrate the TSPY gene<br />
tree.<br />
2.5. Morphological and anatomical comparisons<br />
D. Chakraborty et al. / Molecular Phylogenetics and Evolution 44 (2007) 838–849 841<br />
We evaluated the morphological and anatomical affinities<br />
of M. <strong>munzala</strong> by comparing 25 craniodental and four<br />
baculum measurements, and the centrum lengths of the<br />
caudal vertebrae of this species (Sinha et al., 2006) with<br />
those of M. assamensis, M. thibetana, M. radiata and<br />
M. sinica (craniodental measurements from Pan and<br />
Oxnard, 2004; baculum and caudal vertebrae measurements<br />
from Fooden, 1988). All craniodental measurements,<br />
the mean values for which are listed in Pan and<br />
Oxnard (2004), except OCCH and GLENOL, were used<br />
in this analysis. In the case of baculum, data were available<br />
for four M. assamensis, two M. thibetana, fiveM. radiata,<br />
and seven M. sinica adult males. One set of M. assamensis<br />
baculum data reported in Fooden (1988) was presumably<br />
from a subadult with significantly smaller dimensions,<br />
and was excluded from the final analysis. To assess the similarity<br />
in morphometric measurements across species,<br />
matrices of Euclidean distances were calculated, and cluster<br />
analyses performed separately for craniodental (mean values)<br />
and baculum (individual values) measurements. Joining-trees<br />
and single-linkage clustering algorithms were<br />
used, and the tree plots were standardised to a percent scale<br />
by expressing the linkage distance between any two cases as<br />
a percent of the maximum linkage distance.<br />
Available data on body mass and relative tail length of<br />
M. <strong>munzala</strong> (body mass from Sinha et al., 2006; relative tail<br />
length from Sinha et al., 2005) and each of the other four<br />
species (Fooden, 1988) were plotted against the latitudinal<br />
midpoints of their known distributions and examined visually<br />
for monotonic relationships, as predicted by Bergmann’s<br />
and Allen’s rules, respectively. We also used the<br />
greatest skull length of adult males as a surrogate for body<br />
mass (data on M. <strong>munzala</strong> from Sinha et al., 2006; on the<br />
other four species from Fooden, 1988), and tested for significant<br />
monotonic relationships with latitude, again as<br />
predicted by the Bergmann’s rule (James, 1970; Blackburn<br />
et al., 1999), using Pearson’s product-moment correlations.<br />
Similar tests were performed to examine whether relative<br />
tail lengths showed a significant negative monotonic relationship<br />
with latitude, as predicted by Allen’s rule (Allen,<br />
1877, reported in Ray, 1960). Differences in the relationship<br />
between the linear sequence and size (centrum lengths)<br />
of the caudal vertebrae of the five species were examined
842 D. Chakraborty et al. / Molecular Phylogenetics and Evolution 44 (2007) 838–849<br />
graphically. While investigating patterns in body size and<br />
relative tail length along latitudinal gradients, we used both<br />
community-level (individuals of all species pooled together)<br />
and species-level (each species analysed separately)<br />
approaches (Brehm and Fiedler, 2004). All statistical analyses<br />
were performed using Statistica 6 (StatSoft Inc., Tulsa,<br />
USA).<br />
3. Results<br />
3.1. Phylogenetic analyses<br />
Interspecific genetic distances for the cytochrome b–Dloop<br />
combined sequences and the TSPY sequence for all<br />
the species of the sinica group of the genus <strong>Macaca</strong> are<br />
greater than the respective intraspecific distances (Table<br />
2), indicating relatively long-term genetic separation of<br />
the species within this group. The only exception is the<br />
interspecific distance for the TSPY sequence between<br />
M. <strong>munzala</strong> and M. assamensis. It must be noted, however,<br />
that the genetic variability within the TSPY sequence is<br />
very low (nucleotide diversity per site, Pi = 0.00656), as<br />
compared to that for the mitochondrial cytochrome<br />
b–D-loop sequences (Pi = 0.10339). For the combined<br />
mitochondrial sequences, the interspecific distances of<br />
M. <strong>munzala</strong> from each of the other three species are greater<br />
than that between M. assamensis and M. thibetana (the species-pair<br />
with lowest average interspecific genetic distance).<br />
The intraspecific distance for M. <strong>munzala</strong>, in contrast, is<br />
rather small, comparable to those of M. radiata and<br />
M. thibetana, and almost an order of magnitude less than<br />
that of M. assamensis.<br />
All the phylogenetic trees that were constructed with the<br />
cytochrome b–D-loop combined sequences reveal<br />
M. <strong>munzala</strong> to be a distinct clade genetically closer to<br />
M. radiata than to M. assamensis or M. thibetana<br />
(Fig. 1a and b). Qualitatively similar tree topologies were<br />
also obtained for cytochrome b sequence data independently<br />
(data not shown). The distinction of the M. <strong>munzala</strong><br />
clade from the M. assamensis–M. thibetana clade is maintained<br />
for the D-loop sequence data as well, although, in<br />
this case, it appears to be paraphyletic with both the<br />
M. radiata and the M. assamensis–M. thibetana clades<br />
(data not shown). M. <strong>munzala</strong> and M. radiata display a<br />
deep genetic divergence from each other, which possibly<br />
occurred 3.20 million years ago (mya). Both these taxa nevertheless<br />
appear to be of fairly recent origin (at 0.48 and<br />
0.17 mya, respectively). In contrast to this, the older<br />
M. assamensis–M. thibetana paraphyletic clade appears to<br />
have originated 3.39 mya, with the nested M. thibetana<br />
clade separating out at 2.20 mya.<br />
The phylogenetic trees constructed with the TSPY<br />
sequence, on the other hand, show M. <strong>munzala</strong> to be monophyletic<br />
with the M. assamensis–M. thibetana clade (Fig. 1c<br />
and d). The principal evolutionary divide in the sinica species-group,<br />
according to the nuclear DNA analysis,<br />
occurred between the M. <strong>munzala</strong>–M. assamensis–M. thibetana<br />
and the M. radiata–M. sinica clades at 2.66 mya. As<br />
also observed with the mitochondrial DNA analysis, the<br />
M. assamensis–M. thibetana clade is older in its origin<br />
(1.57 mya) than the M. radiata–M. sinica clade (0.98 mya).<br />
3.2. Morphological and anatomical comparisons<br />
Cluster analysis of the baculum measures reveals a clear<br />
pattern separating out a group comprising the three northern<br />
species (M. <strong>munzala</strong>, M. assamensis, and M. thibetana)<br />
from the southern group, including M. radiata of peninsular<br />
India and M. sinica of Sri Lanka. Within the former<br />
group, there is considerable interspersion between<br />
M. thibetana and M. assamensis, while the M. <strong>munzala</strong><br />
stands out as the most distant species within this cluster<br />
(Fig. 2a). The pattern seen in the cluster analysis of the<br />
craniodental measures is qualitatively similar to that<br />
obtained with the baculum (Fig. 2b).<br />
Amongst the five species examined, the body mass of the<br />
relatively northern species appears to be greater than those<br />
occurring at lower latitudes, providing support for Bergman’s<br />
rule (Fig. 3). Furthermore, the community-level<br />
analyses of all species including M. <strong>munzala</strong> show a significant<br />
increase in greatest skull length (used as a surrogate<br />
for body mass) with latitude (Table 3). In the species-level<br />
analyses (excluding M. <strong>munzala</strong>), three of the four species<br />
(except M. sinica) again exhibit significant positive relationships<br />
between greatest skull length and latitude as<br />
predicted by the Bergmann’s rule (Table 3). There is also<br />
a significant negative correlation between relative tail<br />
length and latitude in the community-level analysis, thus<br />
Table 2<br />
Average genetic distances for cytochrome b–D-loop combined sequences (upper section of the matrix) and the TSPY sequence (lower section of the<br />
matrix) between and within the five species of the sinica species-group calculated using the Kimura-2-parameter model<br />
<strong>Macaca</strong><br />
<strong>munzala</strong><br />
<strong>Macaca</strong><br />
assamensis<br />
<strong>Macaca</strong><br />
thibetana<br />
<strong>Macaca</strong><br />
radiata<br />
<strong>Macaca</strong><br />
sinica<br />
<strong>Macaca</strong> <strong>munzala</strong> 0.109 0.114 0.100 — 0.007<br />
<strong>Macaca</strong> assamensis 0.000 0.064 0.135 — 0.046<br />
<strong>Macaca</strong> thibetana 0.002 0.002 0.124 — 0.004<br />
<strong>Macaca</strong> radiata 0.002 0.003 0.004 — 0.008<br />
<strong>Macaca</strong> sinica 0.003 0.003 0.005 0.001 —<br />
Intraspecific distances<br />
TSPY<br />
0.000 0.001 0.000 0.000 0.000<br />
Intraspecific distances cytochrome<br />
b–D-loop
D. Chakraborty et al. / Molecular Phylogenetics and Evolution 44 (2007) 838–849 843<br />
Fig. 1. Phylogenetic relationships among the five species of the sinica species-group revealed by (a) maximum likelihood and (b) Bayesian inference<br />
analyses of the combined cytochrome b–D-loop sequence data, and (c) maximum likelihood and (d) Bayesian inference analyses of the TSPY sequence<br />
data. In all cases, 50% majority rule consensus trees are shown. Numbers next to each node represent bootstrap values (a and c) and posterior probabilities<br />
(b and d). For details of the individuals analysed, see Tables 1a and 1b, respectively.
844 D. Chakraborty et al. / Molecular Phylogenetics and Evolution 44 (2007) 838–849<br />
Fig. 1 (continued )
D. Chakraborty et al. / Molecular Phylogenetics and Evolution 44 (2007) 838–849 845<br />
Fig. 2. (a) Cluster analysis (single-linkage Euclidean distances) of baculum measurements (four variables; Sinha et al., 2006) of the M. <strong>munzala</strong> adult male<br />
specimen, and seven adult M. sinica, five M. radiata, three M. assamensis and two M. thibetana males (obtained from Fooden, 1988). One M. assamensis<br />
individual (A2) was removed from the original analysis because it could have been a subadult given its significantly smaller dimensions (see Section 2). (b)<br />
Cluster analysis (single-linkage Euclidean distances) of skull morphometric measurements of the M. <strong>munzala</strong> adult male specimen (25 variables; Sinha<br />
et al., 2006) and mean values of measurements for adult males of M. sinica, M. radiata, M. assamensis and M. thibetana (obtained from Pan and Oxnard,<br />
2004).<br />
providing support for Allen’s rule (Table 3 and Fig. 3).<br />
However, in the species-level analysis, the relationship is<br />
significantly negative for M. assamensis and M. sinica but<br />
not for M. thibetana or M. radiata (Table 3). Analysis of<br />
the structure and linear arrangement of the caudal vertebrae<br />
nevertheless showed that both their numbers as well<br />
as their lengths seem to reduce with increasing latitude<br />
(Fig. 4). M. <strong>munzala</strong>, however, is an exception, which,<br />
although fitting the pattern well in terms of the total num-<br />
ber of vertebrae (intermediate between the immediately<br />
northern M. thibetana and southern M. assamensis), has<br />
relatively longer vertebrae (Fig. 4).<br />
4. Discussion<br />
<strong>Macaca</strong> <strong>munzala</strong> has recently been identified as a distinct<br />
species within the sinica species-group of the genus
846 D. Chakraborty et al. / Molecular Phylogenetics and Evolution 44 (2007) 838–849<br />
Fig. 3. Mean (±SD) body mass (solid line) and relative tail length (dashed<br />
line) of adult male macaques of the sinica species-group plotted against the<br />
latitudinal centre points of the known species distributions. The open<br />
circles and squares represent, from left to right, M. sinica, M. radiata, M.<br />
assamensis and M. thibetana (data derived from Fooden, 1988) while the<br />
closed circle and square represent the body mass and relative tail length<br />
for the single specimen of M. <strong>munzala</strong> available.<br />
Table 3<br />
Relationship between morphological attributes and latitudinal distribution<br />
among macaque species of the sinica species-group, showing<br />
Pearson’s correlation coefficients between (i) greatest skull length and<br />
latitude, and (ii) relative tail length (ratio of tail length to head and body<br />
length) and latitude for adult males<br />
Species Greatest skull length Relative tail length<br />
All species 0.941 (80) *** 0.931 (59) ***<br />
<strong>Macaca</strong> assamensis 0.485 (28) ** 0.646 (16) **<br />
<strong>Macaca</strong> thibetana 0.534 (18) * 0.177 (08)<br />
<strong>Macaca</strong> radiata 0.632 (12) ** 0.520 (12)<br />
<strong>Macaca</strong> sinica 0.111 (21) 0.684 (21) ***<br />
Significant monotonic and positive relationships in (i) would indicate<br />
agreement with Bergmann’s rule, while significant monotonic and negative<br />
relationships in (ii) would indicate agreement with Allen’s rule. The overall<br />
correlation in the top row represents a community-level analysis for all<br />
species combined including M. <strong>munzala</strong>, for which sample sizes were<br />
limited. The subsequent rows represent species-level analyses (see Section<br />
2). Data for all species other than M. <strong>munzala</strong> have been derived from<br />
Fooden (1988). Sample sizes are indicated in parentheses.<br />
* P < 0.05.<br />
** P < 0.01.<br />
*** P < 0.001.<br />
<strong>Macaca</strong> based on its unique morphology and geographical<br />
distribution (Sinha et al., 2005).<br />
Our molecular genetic analyses of the mitochondrial<br />
DNA sequences confirm this finding by placing it as a distinct,<br />
coherent clade, separate from the M. radiata and M.<br />
assamensis–M. thibetana clades, within the sinica speciesgroup.<br />
The M. <strong>munzala</strong> clade is also characterised by a<br />
low intraspecific genetic divergence of 0.7%, comparable<br />
to M. radiata and M. thibetana. This, together with the<br />
large interspecific genetic distances between M. <strong>munzala</strong><br />
and each of the other species within the group (varying<br />
from 10.0% to 11.4%), thus confirms its identity as a<br />
Fig. 4. Centrum lengths of the caudal vertebrae of the adult male M.<br />
<strong>munzala</strong> specimen (closed diamonds) compared with the mean centrum<br />
lengths of the four other species of the sinica species-group (obtained from<br />
Fooden, 1988), plotted against vertebra number. The species from top to<br />
bottom in the legend are ordered according to increasing latitudinal<br />
midpoints of their distribution (see Fig. 3).<br />
distinct species by the genetic species concept as well (Bradley<br />
and Baker, 2001). Additionally, these interspecific distances<br />
of M. <strong>munzala</strong> are also much greater than that of<br />
6.4% between M. assamensis and M. thibetana, which have<br />
long been recognised as distinct species within the sinica<br />
group on the basis of their morphological and anatomical<br />
features (reviewed in Fooden, 1988).<br />
The nuclear TSPY gene tree, on the other hand, places<br />
M. <strong>munzala</strong> within the M. assamensis–M. thibetana clade.<br />
It, however, fails to resolve the ‘soft’ polytomy between<br />
these three species adequately. This is due to the low nucleotide<br />
diversity of this sequence, possibly due to low evolutionary<br />
rates. This has also been noted in earlier studies of<br />
other macaques (Tosi et al., 2003; Ziegler et al., 2007). Furthermore,<br />
TSPY, being a protein-coding gene, is likely to<br />
be under strong selection and thus inappropriate for the<br />
reconstruction of recent phylogenetic relationships. These<br />
results, nevertheless, provide critical insights into the evolutionary<br />
origin of M. <strong>munzala</strong>, which is discussed below.<br />
Based on similarities in morphological characteristics<br />
and ecological distribution (in the Eastern Himalaya and<br />
adjoining areas of south China and southeast Asia)<br />
between M. <strong>munzala</strong>, M. assamensis, and M. thibetana,<br />
Sinha et al. (2005) had suggested the possibility of close<br />
phylogenetic relationships between these species. Although<br />
this is supported by our analysis of the TSPY gene tree, our<br />
mitochondrial DNA analyses, surprisingly, establish a<br />
much closer relationship of M. <strong>munzala</strong> with the geographically<br />
and ecologically more distant M. radiata of tropical<br />
peninsular India.<br />
Our morphometric analyses of the M. <strong>munzala</strong> adult<br />
male specimen and its comparison with the other four species<br />
also suggest affinities between this species and the<br />
M. assamensis–M. thibetana clade. Although structurally<br />
distinct, both the baculum and the skull of M. <strong>munzala</strong>
D. Chakraborty et al. / Molecular Phylogenetics and Evolution 44 (2007) 838–849 847<br />
bear greater similarity with those of M. assamensis and M.<br />
thibetana and cluster with them rather than with M. radiata<br />
and M. sinica. The relative tail length of M. <strong>munzala</strong> is also<br />
comparable to that of M. assamensis. The absolute tail<br />
length of M. assamensis (mean ± SD of 212 ± 18 mm,<br />
n = 22; Fooden, 1988) is, however, significantly smaller<br />
than that of M. <strong>munzala</strong> (252 ± 17 mm, n = 2; Mann–<br />
Whitney U-test, two-tailed, p < 0.025). Moreover, the<br />
detailed structural analysis of the caudal vertebrae of these<br />
taxa reveals that the M. <strong>munzala</strong> vertebrae stand out in<br />
their relatively large size. The caudal vertebral structures<br />
of the five species, in fact, shows that M. <strong>munzala</strong>, M. radiata<br />
and M. sinica are similar to each other in that their<br />
centrum lengths begin to increase from the second vertebra<br />
itself (although they subsequently decrease), while the first<br />
four vertebrae of M. assamensis and M. thibetana are comparable<br />
to each other in their centrum lengths. This similarity<br />
in caudal vertebral structure of M. <strong>munzala</strong> with that of<br />
M. radiata (and M. sinica), despite differences in their<br />
absolute tail lengths (where M. <strong>munzala</strong> is closer to<br />
M. assamensis), supports the results from our molecular<br />
phylogenetic analyses of the mitochondrial DNA<br />
sequences that establish the significant genetic divergence<br />
between the M. assamensis–M. thibetana and the M. <strong>munzala</strong>–<br />
M. radiata–M. sinica clades.<br />
Although this morphological convergence of M. <strong>munzala</strong><br />
with the M. assamensis–M. thibetana clade could be<br />
attributable to their common ancestry, as revealed by<br />
the TSPY gene tree, the differences in their caudal structure<br />
suggest that the morphological convergence is more<br />
likely due to similar selective forces in their comparable<br />
ecological environments. These three species have been<br />
reported from subtropical and temperate regions (with<br />
M. assamensis also occurring in some tropical forests),<br />
while M. radiata and M. sinica are largely confined to<br />
the warm tropical areas of peninsular India and Sri<br />
Lanka, respectively.<br />
Morphological patterns within and between closely<br />
related species have been described by Bergmann’s and<br />
Allen’s rules along temperature/latitudinal gradients (see<br />
Meiri and Dayan, 2003 for a review of Bergmann’s rule).<br />
Our analysis reveals a significant latitudinal increase in<br />
body mass and greatest skull length within the sinica species-group<br />
of macaques, both at the community- and the<br />
species-level, as predicted by the Bergmann’s rule (see Fooden,<br />
1988 for a similar species-level regression analysis).<br />
Furthermore, although a decline in relative tail lengths of<br />
these species along a latitudinal gradient, as predicted by<br />
Allen’s rule, was less pronounced (but see Fooden, 1988),<br />
analysis of their caudal vertebral structure and organisation<br />
again suggests a simultaneous decrease in both the<br />
number and size of these vertebrae with increasing latitude.<br />
The only exception in this regard was M. sinica, with caudal<br />
vertebrae consistently shorter in length than those of<br />
M. radiata; the origin of this southernmost species thus<br />
possibly involved a further reduction in vertebral length<br />
Fig. 5. Hypothetical reconstruction of principal stages in evolution and dispersal of the sinica species-group of macaques on the bases of both<br />
palaeontological evidence (Delson, 1980) and molecular phylogeny (this study). The dashed lines represent the tentative male introgression from the protoassamensis–thibetana<br />
stock into the proto-<strong>munzala</strong> stock culminating in the modern-day M. <strong>munzala</strong>. The numbers in parentheses represent the time in<br />
mya. Please note that the different evolutionary stages, being hypothetical entities, cannot be precisely located geographically in the absence of firm<br />
palaeontological evidence.
848 D. Chakraborty et al. / Molecular Phylogenetics and Evolution 44 (2007) 838–849<br />
from that of the ancestral M. radiata–M. sinica stock.<br />
These patterns thus point to the important role that ecology<br />
may have played in bringing about the adaptive morphological<br />
and anatomical convergence of M. <strong>munzala</strong><br />
with the two northern species of this group.<br />
Our genetic analyses permit us to explore the possible<br />
evolutionary origins of M. <strong>munzala</strong>. The mitochondrial<br />
DNA trees clearly indicate the common ancestry of<br />
M. <strong>munzala</strong> and M. radiata, while the Y-chromosomal<br />
analysis suggests a much closer evolutionary relationship<br />
between the M. <strong>munzala</strong> and the M. assamensis–M. thibetana<br />
lineages. Lineage sorting is expected to occur more<br />
rapidly for Y-chromosomes than for mitochondrial genes<br />
(Tosi et al., 2003). In our analyses, however, there appears<br />
to have been complete mitochondrial lineage sorting in this<br />
species-group, while the Y-chromosome lineages remain<br />
unresolved. This suggests that male introgression and<br />
hybridization may have played an important role in the<br />
ancestry of M. <strong>munzala</strong>.<br />
The phylogenetic patterns obtained in our study also<br />
allow us to address models of speciation within the sinica<br />
species-group (Fig. 5). Our results broadly support the evolutionary<br />
scenario proposed by Delson (1980) for this<br />
group of macaques based on fossil evidence. In his model,<br />
a long-tailed proto-sinica species arose in or west of present-day<br />
Myanmar, and moved west and south into peninsular<br />
India approximately at 1.5–2 million years ago<br />
(mya). Our molecular analysis suggests a date of origin<br />
of c. 3.2 (TSPY) to 4.5 (mitochondrial DNA) mya for such<br />
an ancestor. During the westward movement, a branch<br />
possibly emigrated north towards China, differentiating<br />
into a relatively large-bodied, short-tailed form represented<br />
by some of the earlier fossils of <strong>Macaca</strong> cf. anderssoni<br />
(c. 3 mya; Delson, 1980) and its present-day descendants,<br />
M. assamensis and M. thibetana.<br />
The ancestral sinica species that moved west might have<br />
colonised northeastern India approximately at 3–4 mya<br />
with a group (the proto-radiata–sinica stock) subsequently<br />
migrating southward into peninsular India. Our mitochondrial<br />
DNA analysis suggests that the immediate ancestor of<br />
M. <strong>munzala</strong> diverged from the proto-radiata stock at c.<br />
3.2 mya. The modern-day M. <strong>munzala</strong> stock seems to have<br />
subsequently originated at c. 1.5 mya (TSPY analysis)<br />
following male introgression from a proto-assamensis–<br />
thibetana stock, followed by the appearance of the species,<br />
as we know it today, at c. 0.48 mya. The present-day<br />
M. <strong>munzala</strong> also appears to have evolved heavier bodies<br />
and shorter tails in parallel, given its distribution in the<br />
northern latitudes, thus displaying a further morpho–<br />
anatomical convergence with the M. assamensis–M. thibetana<br />
stock that had diverged earlier.<br />
Additionally, the geological history of the river Brahmaputra<br />
indicates it to be a young river with its present configuration<br />
taking shape only during the late Pliocene to Early<br />
Pleistocene, at c. 1.8 mya (Barman, 1981). It is possible that<br />
the isolated forest refugia associated with Pleistocene glacials<br />
may have provided rich opportunity for the introgres-<br />
sion and hybridization, which led to the origin of<br />
M. <strong>munzala</strong>, to have occurred in this region ( Eudey, 1980;<br />
Jablonski, 1993). Today, the river is considered a geographical<br />
divide between the Indo-Burmese and Indian biogeographic<br />
regions serving as a physical barrier to secondary<br />
contact between the modern-day macaque species.<br />
Finally, the southern branch of the proto-sinica group<br />
may have given rise to M. radiata of southern India and<br />
M. sinica of Sri Lanka, possibly during the Middle Pleistocene<br />
(at 2.0–0.1 mya), a time of alternating climatic amelioration<br />
and decay when the modern-day populations of<br />
M. thibetana and M. <strong>munzala</strong> may have also evolved and<br />
occupied their present ranges. Such a scenario is strongly<br />
supported by (i) fossil evidence of ancestral <strong>Macaca</strong> populations<br />
(Delson, 1980), (ii) the apparently less-derived<br />
penile morphology and cranial hair-flow patterns of<br />
M. assamensis and M. thibetana relative to M. radiata or<br />
M. sinica (Hill and Bernstein, 1969), and (iii) our molecular<br />
clock estimates of the divergence times of these species.<br />
Further phylogenetic analyses with fast-evolving, neutral<br />
autosomal markers would provide a better understanding<br />
of the spatio-temporal aspects of speciation within the sinica<br />
species-group of the genus.<br />
Acknowledgments<br />
We wish to thank the Forest Department of Arunachal<br />
Pradesh for their support as well as research permissions.<br />
Special thanks are due to the Chief Wildlife Warden and<br />
Pekyom Ringu for their continued support for our<br />
research. We acknowledge grants from the Rufford Maurice<br />
Laing <strong>Foundation</strong>, the Whitley Fund for <strong>Nature</strong>, the Wildlife<br />
<strong>Conservation</strong> Society—India Program, the Department<br />
of Science and Technology—Government of India, and the<br />
National Centre for Biological Sciences—Tata Institute of<br />
Fundamental Research, which made this work possible.<br />
We also thank the Primate Research Laboratory, Indian<br />
Institute of Science for blood samples of bonnet macaques.<br />
We are extremely grateful to two anonymous referees<br />
whose valuable suggestions have significantly improved<br />
the quality of the paper. Finally, we express our gratitude<br />
to R. Suresh Kumar, Uttara Mendiratta, M.D. Madhusudan,<br />
Mayukh Chatterjee, Kakoli Mukhopadhyay, Aparajita<br />
Datta, Sonia Joseph, R. Raghunath, Sujoy Chaudhuri,<br />
members of the Uma Ramakrishnan laboratory, and V.L.<br />
Roth of Duke University for their help, support and<br />
encouragement in the field and in the laboratory.<br />
References<br />
Allen, J.A., 1877. The influence of physical conditions in the genesis of<br />
species. Radic. Rev. 1, 108–140.<br />
Arnason, U., Gullberg, A., Janke, A., 1998. Molecular timing of primate<br />
divergences as estimated by two nonprimate calibration points. J. Mol.<br />
Evol. 47, 718–727.<br />
Arnason, U., Gullberg, A., Burguete, A.S., Janke, A., 2000. Molecular<br />
estimates of primate divergences and new hypotheses for primate<br />
dispersal and the origin of modern humans. Hereditas 133, 217–228.
D. Chakraborty et al. / Molecular Phylogenetics and Evolution 44 (2007) 838–849 849<br />
Barman, G., 1981. Geomorphology of the Brahmaputra basin, its flood<br />
problems and their possible remedial measures. In: Proceedings of the<br />
Seminar on Fluvial Process and Geomorphology of the Brahmaputra<br />
Basin, Miscellaneous Publication No. 46, Geological Survey of India,<br />
Calcutta (now Kolkata), pp. 21–31.<br />
Blackburn, T.M., Gaston, K.J., Loder, N., 1999. Geographic gradients in<br />
body size: a clarification of Bergmann’s rule. Divers. Distrib. 5, 165–174.<br />
Bradley, R.D., Baker, R.J., 2001. A test of the genetic species concept:<br />
cytochrome-b sequences and mammals. J. Mamm. 82, 960–973.<br />
Brehm, G., Fiedler, K., 2004. Bergmann’s rule does not apply to<br />
geometrid moths along an elevational gradient in an Andean montane<br />
rainforest. Global Ecol. Biogeogr. 13, 7–14.<br />
Delson, E., 1980. Fossil macaques, phyletic relationships and a scenario of<br />
deployment. In: Lindburg, D.G. (Ed.), Macaques: Studies in Ecology,<br />
Behavior and Evolution. Van Nostrand Reinhold, New York, pp. 10–30.<br />
Delson, E., 1996. The oldest monkeys in Asia. In: Takenaka, O. (Ed.),<br />
Abstracts, International Symposium on Evolution of Asian Primates.<br />
Freude and Kyoto University, Primate Research Institute, Inuyama,<br />
Aichi, Japan, p. 40.<br />
Eudey, A.A., 1980. Pleistocene glacial phenomena and the evolution of<br />
Asian macaques. In: Lindburg, D.G. (Ed.), The Macaques: Studies in<br />
Ecology, Behavior, and Evolution. Van Nostrand Reinhold, Amsterdam,<br />
pp. 52–83.<br />
Fooden, J., 1988. Taxonomy and evolution of the sinica group of<br />
macaques: 6. Interspecific comparisons and synthesis. Fieldiana Zool.<br />
(N.S.) 45, 1–44.<br />
Hayasaka, K., Gojobori, T., Horai, S., 1988. Molecular phylogeny and<br />
evolution of primate mitochondrial DNA. Mol. Biol. Evol. 5, 626–644.<br />
Hill, W.C.O., Bernstein, I., 1969. On the morphology, behaviour and<br />
systematic status of the Assam macaque (<strong>Macaca</strong> assamensis McClelland,<br />
1839). Primates 10, 1–17.<br />
Jablonski, N.G., 1993. Quaternary environments and the evolution of<br />
primates in East Asia, with notes on two new specimens of fossil<br />
Cercopithecidae from China. Folia Primatol. 60, 118–132.<br />
James, F.C., 1970. Geographic size variation in birds and its relationship<br />
to climate. Ecology 51, 365–390.<br />
Kumar, S., Tamura, K., Nei, M., 2004. MEGA 3: integrated software for<br />
molecular evolutionary genetics analysis and sequence alignment.<br />
Brief. Bioinform. 5, 150–163.<br />
Li, Q., Zhang, Y., 2004. A molecular phylogeny of <strong>Macaca</strong> based on<br />
mitochondrial control region sequences. Zool. Res. 25, 385–390.<br />
Li, Q., Zhang, Y., 2005. Phylogenetic relationships of the macaques<br />
(Cercopithecidae: <strong>Macaca</strong>), inferred from mitochondrial DNA<br />
sequences. Biochem. Genet. 43, 375–386.<br />
Meiri, S., Dayan, T., 2003. On the validity of Bergmann’s rule. J.<br />
Biogeogr. 30, 331–351.<br />
Morales, J.C., Melnick, D.J., 1998. Phylogenetic relationships of the<br />
macaques (Cercopithecidae: <strong>Macaca</strong>), as revealed by high resolution<br />
restriction site mapping of mitochondrial ribosomal genes. J. Hum.<br />
Evol. 34, 1–23.<br />
Pan, R., Oxnard, C., 2004. Craniodental variation in the African<br />
macaque, with reference to various Asian species. Folia Primatol. 75,<br />
355–375.<br />
Posada, D., 2006. ModelTest Server: a web-based tool for the statistical<br />
selection of models of nucleotide substitution online. Nucleic Acids<br />
Res. 34, W700–W703.<br />
Raaum, R.L., Sterner, K.N., Noviello, C.M., Stewart, C.B., Disotell,<br />
T.R., 2005. Catarrhine primate divergence dates estimated from<br />
complete mitochondrial genomes: concordance with fossil and nuclear<br />
DNA evidence. J. Hum. Evol. 48, 237–257.<br />
Ray, C., 1960. The application of Bergmann’s rule and Allen’s rule to the<br />
poikilotherms. J. Morphol. 106, 85–108.<br />
Robinson-Rechavi, M., Huchon, D., 2000. RRTree: relative-rate tests<br />
between groups of sequences on a phylogenetic tree. Bioinformatics 16,<br />
296–297.<br />
Ronquist, F., Huelsenbeck, J.P., van der Mark, P., 2005. MrBayes 3.1<br />
Manual, Draft 5/26/2005. http://mrbayes.csit.fsu.edu/mb3.1_<br />
manual.pdf. Accessed on May 6, 2006.<br />
Rozas, J., Sánchez-Delbarrio, J.C., Messeguer, X., Rozas, R., 2003.<br />
DnaSP, DNA polymorphism analyses by the coalescent and other<br />
methods. Bioinformatics 19, 2496–2497.<br />
Sanderson, M.J., 1997. A nonparametric approach to estimating divergence<br />
times in the absence of rate constancy. Mol. Biol. Evol. 14,<br />
1218–1231.<br />
Sanderson, M.J., 2003. r8s: inferring absolute rates of molecular evolution<br />
and divergence times in the absence of a molecular clock. Bioinformatics<br />
19, 301–302.<br />
Sinha, A., Datta, A., Madhusudan, M.D., Mishra, C., 2005. <strong>Macaca</strong><br />
<strong>munzala</strong>: a new species from western Arunachal Pradesh, northeastern<br />
India. Int. J. Primatol. 26, 977–989.<br />
Sinha, A., Kumar, R.S., Mishra, C., 2006. Ecology and <strong>Conservation</strong> of<br />
the Arunachal Macaque <strong>Macaca</strong> <strong>munzala</strong>. NCF Technical Report No.<br />
15. <strong>Nature</strong> <strong>Conservation</strong> <strong>Foundation</strong>, National Institute of Advanced<br />
Studies and International Snow Leopard Trust, Mysore, India.<br />
Swofford, D.L., 2002. PAUP*: phylogenetic analysis using parsimony<br />
(* and other methods). Version 4.0b10. Sinauer, Sunderland, MA, USA.<br />
Tosi, A.J., Morales, J.C., Melnick, D.J., 2000. Comparison of Y<br />
chromosome and mtDNA phylogenies lead to unique inferences of<br />
macaque evolutionary history. Mol. Phylogen. Evol. 17, 133–144.<br />
Tosi, A.J., Morales, J.C., Melnick, D.J., 2002. Y-chromosome and<br />
mitochondrial markers in <strong>Macaca</strong> fascicularis indicate introgression<br />
with Indochinese M. mulatta and a biogeographic barrier in the<br />
Isthmus of Kra. Int. J. Primatol. 23, 161–178.<br />
Tosi, A.J., Morales, J.C., Melnick, D.J., 2003. Paternal, maternal and<br />
biparental molecular markers provide unique windows into the<br />
evolutionary history of macaque monkeys. Evolution 57, 1419–1435.<br />
Ziegler, T., Abegg, C., Meijaard, E., Perwitasari-Farajallah, D., Walter,<br />
L., Keith Hodges, J., Roos, C., 2007. Molecular phylogeny and<br />
evolutionary history of Southeast Asian macaques forming the M.<br />
silenus group. Mol. Phylogenet. Evol. 42, 807–816.