Absolute quantification of somatic DNA alterations in ... - Nature
Absolute quantification of somatic DNA alterations in ... - Nature
Absolute quantification of somatic DNA alterations in ... - Nature

You also want an ePaper? Increase the reach of your titles
YUMPU automatically turns print PDFs into web optimized ePapers that Google loves.
npg © 2012 <strong>Nature</strong> America, Inc. All rights reserved.<br />
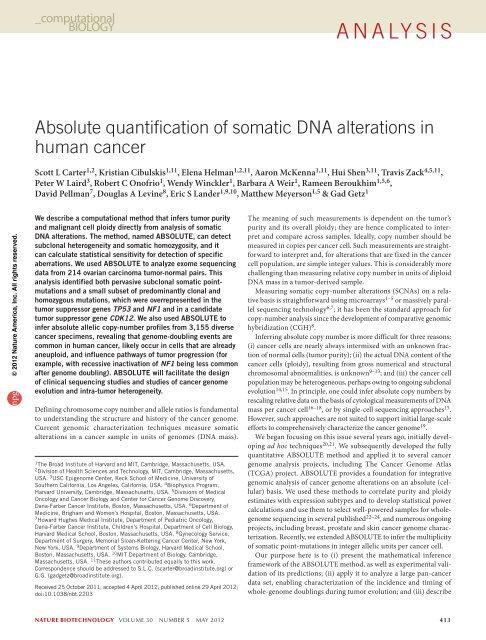
We describe a computational method that <strong>in</strong>fers tumor purity<br />
and malignant cell ploidy directly from analysis <strong>of</strong> <strong>somatic</strong><br />
<strong>DNA</strong> <strong>alterations</strong>. The method, named ABSOLUTE, can detect<br />
subclonal heterogeneity and <strong>somatic</strong> homozygosity, and it<br />
can calculate statistical sensitivity for detection <strong>of</strong> specific<br />
aberrations. We used ABSOLUTE to analyze exome sequenc<strong>in</strong>g<br />
data from 214 ovarian carc<strong>in</strong>oma tumor-normal pairs. This<br />
analysis identified both pervasive subclonal <strong>somatic</strong> po<strong>in</strong>tmutations<br />
and a small subset <strong>of</strong> predom<strong>in</strong>antly clonal and<br />
homozygous mutations, which were overrepresented <strong>in</strong> the<br />
tumor suppressor genes TP53 and NF1 and <strong>in</strong> a candidate<br />
tumor suppressor gene CDK12. We also used ABSOLUTE to<br />
<strong>in</strong>fer absolute allelic copy-number pr<strong>of</strong>iles from 3,155 diverse<br />
cancer specimens, reveal<strong>in</strong>g that genome-doubl<strong>in</strong>g events are<br />
common <strong>in</strong> human cancer, likely occur <strong>in</strong> cells that are already<br />
aneuploid, and <strong>in</strong>fluence pathways <strong>of</strong> tumor progression (for<br />
example, with recessive <strong>in</strong>activation <strong>of</strong> NF1 be<strong>in</strong>g less common<br />
after genome doubl<strong>in</strong>g). ABSOLUTE will facilitate the design<br />
<strong>of</strong> cl<strong>in</strong>ical sequenc<strong>in</strong>g studies and studies <strong>of</strong> cancer genome<br />
evolution and <strong>in</strong>tra-tumor heterogeneity.<br />
Def<strong>in</strong><strong>in</strong>g chromosome copy number and allele ratios is fundamental<br />
to understand<strong>in</strong>g the structure and history <strong>of</strong> the cancer genome.<br />
Current genomic characterization techniques measure <strong>somatic</strong><br />
<strong>alterations</strong> <strong>in</strong> a cancer sample <strong>in</strong> units <strong>of</strong> genomes (<strong>DNA</strong> mass).<br />
A n A ly s i s<br />
<strong>Absolute</strong> <strong>quantification</strong> <strong>of</strong> <strong>somatic</strong> DnA <strong>alterations</strong> <strong>in</strong><br />
human cancer<br />
Scott L Carter 1,2 , Kristian Cibulskis 1,11 , Elena Helman 1,2,11 , Aaron McKenna 1,11 , Hui Shen 3,11 , Travis Zack 4,5,11 ,<br />
Peter W Laird 3 , Robert C On<strong>of</strong>rio 1 , Wendy W<strong>in</strong>ckler 1 , Barbara A Weir 1 , Rameen Beroukhim 1,5,6 ,<br />
David Pellman 7 , Douglas A Lev<strong>in</strong>e 8 , Eric S Lander 1,9,10 , Matthew Meyerson 1,5 & Gad Getz 1<br />
1The Broad Institute <strong>of</strong> Harvard and MIT, Cambridge, Massachusetts, USA.<br />
2Division <strong>of</strong> Health Sciences and Technology, MIT, Cambridge, Massachusetts,<br />
USA. 3USC Epigenome Center, Keck School <strong>of</strong> Medic<strong>in</strong>e, University <strong>of</strong><br />
Southern California, Los Angeles, California, USA. 4Biophysics Program,<br />
Harvard University, Cambridge, Massachusetts, USA. 5Divisions <strong>of</strong> Medical<br />
Oncology and Cancer Biology and Center for Cancer Genome Discovery,<br />
Dana-Farber Cancer Institute, Boston, Massachusetts, USA. 6Department <strong>of</strong><br />
Medic<strong>in</strong>e, Brigham and Women’s Hospital, Boston, Massachusetts, USA.<br />
7Howard Hughes Medical Institute, Department <strong>of</strong> Pediatric Oncology,<br />
Dana-Farber Cancer Institute, Children’s Hospital, Department <strong>of</strong> Cell Biology,<br />
Harvard Medical School, Boston, Massachusetts, USA. 8Gynecology Service,<br />
Department <strong>of</strong> Surgery, Memorial Sloan-Ketter<strong>in</strong>g Cancer Center, New York,<br />
New York, USA. 9Department <strong>of</strong> Systems Biology, Harvard Medical School,<br />
Boston, Massachusetts, USA. 10MIT Department <strong>of</strong> Biology, Cambridge,<br />
Massachusetts, USA. 11These authors contributed equally to this work.<br />
Correspondence should be addressed to S.L.C. (scarter@broad<strong>in</strong>stitute.org) or<br />
G.G. (gadgetz@broad<strong>in</strong>stitute.org).<br />
Received 25 October 2011; accepted 4 April 2012; published onl<strong>in</strong>e 29 April 2012;<br />
doi:10.1038/nbt.2203<br />
The mean<strong>in</strong>g <strong>of</strong> such measurements is dependent on the tumor’s<br />
purity and its overall ploidy; they are hence complicated to <strong>in</strong>terpret<br />
and compare across samples. Ideally, copy number should be<br />
measured <strong>in</strong> copies per cancer cell. Such measurements are straightforward<br />
to <strong>in</strong>terpret and, for <strong>alterations</strong> that are fixed <strong>in</strong> the cancer<br />
cell population, are simple <strong>in</strong>teger values. This is considerably more<br />
challeng<strong>in</strong>g than measur<strong>in</strong>g relative copy number <strong>in</strong> units <strong>of</strong> diploid<br />
<strong>DNA</strong> mass <strong>in</strong> a tumor-derived sample.<br />
Measur<strong>in</strong>g <strong>somatic</strong> copy-number <strong>alterations</strong> (SCNAs) on a relative<br />
basis is straightforward us<strong>in</strong>g microarrays 1–5 or massively parallel<br />
sequenc<strong>in</strong>g technology 6,7 ; it has been the standard approach for<br />
copy-number analysis s<strong>in</strong>ce the development <strong>of</strong> comparative genomic<br />
hybridization (CGH) 8 .<br />
Inferr<strong>in</strong>g absolute copy number is more difficult for three reasons:<br />
(i) cancer cells are nearly always <strong>in</strong>termixed with an unknown fraction<br />
<strong>of</strong> normal cells (tumor purity); (ii) the actual <strong>DNA</strong> content <strong>of</strong> the<br />
cancer cells (ploidy), result<strong>in</strong>g from gross numerical and structural<br />
chromosomal abnormalities, is unknown 9–13 ; and (iii) the cancer cell<br />
population may be heterogeneous, perhaps ow<strong>in</strong>g to ongo<strong>in</strong>g subclonal<br />
evolution 14,15 . In pr<strong>in</strong>ciple, one could <strong>in</strong>fer absolute copy numbers by<br />
rescal<strong>in</strong>g relative data on the basis <strong>of</strong> cytological measurements <strong>of</strong> <strong>DNA</strong><br />
mass per cancer cell 16–18 , or by s<strong>in</strong>gle-cell sequenc<strong>in</strong>g approaches 15 .<br />
However, such approaches are not suited to support <strong>in</strong>itial large-scale<br />
efforts to comprehensively characterize the cancer genome 19 .<br />
We began focus<strong>in</strong>g on this issue several years ago, <strong>in</strong>itially develop<strong>in</strong>g<br />
ad hoc techniques 20,21 . We subsequently developed the fully<br />
quantitative ABSOLUTE method and applied it to several cancer<br />
genome analysis projects, <strong>in</strong>clud<strong>in</strong>g The Cancer Genome Atlas<br />
(TCGA) project. ABSOLUTE provides a foundation for <strong>in</strong>tegrative<br />
genomic analysis <strong>of</strong> cancer genome <strong>alterations</strong> on an absolute (cellular)<br />
basis. We used these methods to correlate purity and ploidy<br />
estimates with expression subtypes and to develop statistical power<br />
calculations and use them to select well-powered samples for wholegenome<br />
sequenc<strong>in</strong>g <strong>in</strong> several published 22–24 , and numerous ongo<strong>in</strong>g<br />
projects, <strong>in</strong>clud<strong>in</strong>g breast, prostate and sk<strong>in</strong> cancer genome characterization.<br />
Recently, we extended ABSOLUTE to <strong>in</strong>fer the multiplicity<br />
<strong>of</strong> <strong>somatic</strong> po<strong>in</strong>t-mutations <strong>in</strong> <strong>in</strong>teger allelic units per cancer cell.<br />
Our purpose here is to (i) present the mathematical <strong>in</strong>ference<br />
framework <strong>of</strong> the ABSOLUTE method, as well as experimental validation<br />
<strong>of</strong> its predictions; (ii) apply it to analyze a large pan-cancer<br />
data set, enabl<strong>in</strong>g characterization <strong>of</strong> the <strong>in</strong>cidence and tim<strong>in</strong>g <strong>of</strong><br />
whole-genome doubl<strong>in</strong>gs dur<strong>in</strong>g tumor evolution; and (iii) describe<br />
nature biotechnology VOLUME 30 NUMBER 5 MAY 2012 413
npg © 2012 <strong>Nature</strong> America, Inc. All rights reserved.<br />
A n A ly s i s<br />
a<br />
b<br />
Cancer and<br />
normal cells<br />
<strong>DNA</strong> extraction<br />
with loss <strong>of</strong> <strong>in</strong>formation<br />
regard<strong>in</strong>g <strong>DNA</strong> copies<br />
per cancer cell<br />
Segmentation<br />
and smooth<strong>in</strong>g<br />
<strong>of</strong> copy number<br />
data<br />
d<br />
e<br />
Local relative <strong>DNA</strong><br />
concentration<br />
Local relative <strong>DNA</strong><br />
concentration<br />
Precomputed<br />
models <strong>of</strong><br />
recurrent cancer<br />
karyotypes<br />
1.5<br />
1.0<br />
0.5<br />
0<br />
Genomic position<br />
Measurement<br />
<strong>of</strong> local relative<br />
<strong>DNA</strong> concentration<br />
0 0.2 0.4 0.6 0.8<br />
Allelic fraction<br />
Somatic<br />
po<strong>in</strong>t mutations<br />
(optional)<br />
Interpretation <strong>of</strong> <strong>somatic</strong> <strong>DNA</strong> <strong>alterations</strong> on an absolute scale<br />
Local relative <strong>DNA</strong><br />
concentration<br />
2.0 Summary histogram<br />
1.5<br />
1.0<br />
0.5<br />
0<br />
Subclonal<br />
copy <strong>alterations</strong><br />
4<br />
3<br />
2<br />
1<br />
0<br />
Subclonal mutations<br />
Clonal<br />
mutations<br />
0 1.0 2.0<br />
Po<strong>in</strong>t mutation multiplicity<br />
an <strong>in</strong>tegrated analysis <strong>of</strong> po<strong>in</strong>t-mutation and copy-number estimates<br />
and its application to ovarian carc<strong>in</strong>oma.<br />
We describe three key mathematical features <strong>of</strong> ABSOLUTE. First,<br />
it jo<strong>in</strong>tly estimates tumor purity and ploidy directly from observed<br />
relative copy pr<strong>of</strong>iles (po<strong>in</strong>t mutations may also be used, if available).<br />
Second, because jo<strong>in</strong>t estimation may not be fully determ<strong>in</strong>ed on a<br />
s<strong>in</strong>gle sample, it uses a large and diverse sample collection to help<br />
resolve ambiguous cases. Third, it attempts to account for subclonal<br />
copy-number <strong>alterations</strong> and po<strong>in</strong>t mutations, which are expected <strong>in</strong><br />
heterogeneous cancer samples.<br />
We apply ABSOLUTE to conduct the first, to our knowledge, largescale<br />
‘pan-cancer’ analysis <strong>of</strong> copy-number <strong>alterations</strong> on an absolute<br />
basis, across 3,155 cancer samples, represent<strong>in</strong>g 25 diseases with at least<br />
20 samples each. The analysis reveals that whole-genome doubl<strong>in</strong>g<br />
events occur frequently dur<strong>in</strong>g tumorigenesis, ultimately result<strong>in</strong>g <strong>in</strong><br />
mature cancers descended from doubled cells bear<strong>in</strong>g complex karyo-<br />
Percent<br />
Candidate <strong>in</strong>terpretations <strong>of</strong> copy pr<strong>of</strong>ile<br />
2.0<br />
f g<br />
Fraction<br />
cancer nuclei<br />
h<br />
Relationship to purity, ploidy<br />
1.0<br />
0.8<br />
0.6<br />
0.4<br />
0.2<br />
0<br />
4<br />
3<br />
2<br />
1<br />
0<br />
2n 4n 6n 8n 10n<br />
Ploidy<br />
<strong>Absolute</strong> <strong>somatic</strong><br />
copy numbers<br />
7<br />
6<br />
5<br />
4<br />
3<br />
2<br />
1<br />
0<br />
SCNAs<br />
Karyotype<br />
c<br />
3<br />
2<br />
1<br />
0<br />
Total<br />
<strong>Absolute</strong> <strong>somatic</strong><br />
copy numbers<br />
Log−likelihood Model-based evaluation<br />
Allelic copy<br />
High<br />
Balanced<br />
Low<br />
Figure 1 Overview <strong>of</strong> tumor <strong>DNA</strong> analysis us<strong>in</strong>g ABSOLUTE. (a) A constant<br />
mass <strong>of</strong> <strong>DNA</strong> is extracted from a heterogeneous cell population consist<strong>in</strong>g<br />
<strong>of</strong> cancer and normal cells. This <strong>DNA</strong> is pr<strong>of</strong>iled us<strong>in</strong>g either microarray or<br />
massively parallel sequenc<strong>in</strong>g technology, giv<strong>in</strong>g a genome-wide pr<strong>of</strong>ile <strong>of</strong><br />
<strong>DNA</strong> concentrations. (b) Genome-wide view <strong>of</strong> homologous copy ratios for<br />
a lung adenocarc<strong>in</strong>oma tumor sample processed us<strong>in</strong>g ABSOLUTE. The<br />
copy ratios for both homologous chromosomes are shown for each genomic<br />
segment with locally constant copy number. Color axis <strong>in</strong>dicates distance<br />
between low (blue) and high (red) homologue concentration; segments<br />
where these are similar (allelic balance) are purple. (c) Homologous copyratio<br />
histogram. Copy ratios shown <strong>in</strong> b were b<strong>in</strong>ned at 0.04 resolution<br />
(y axis); the length <strong>of</strong> each block corresponds to the (haploid) genomic<br />
fraction (x axis) <strong>of</strong> each correspond<strong>in</strong>g segment <strong>in</strong> b. Several discrete<br />
SCNA peaks are visible, each correspond<strong>in</strong>g either to an (unknown) <strong>in</strong>teger<br />
copy state <strong>in</strong> the <strong>somatic</strong> clone or to a subclonal alteration. (d) To aid <strong>in</strong><br />
the <strong>in</strong>terpretation <strong>of</strong> potentially ambiguous data, ABSOLUTE uses precomputed<br />
statistical models <strong>of</strong> recurrence cancer karyotypes (left, Onl<strong>in</strong>e<br />
Methods). Optionally, if <strong>somatic</strong> po<strong>in</strong>t mutation data are available (from<br />
sequenc<strong>in</strong>g <strong>of</strong> the <strong>DNA</strong>), then the allelic fractions (fraction <strong>of</strong> sequenc<strong>in</strong>g<br />
reads bear<strong>in</strong>g the nonreference allele) <strong>of</strong> these mutations may be used help<br />
to <strong>in</strong>terpret the <strong>DNA</strong> concentrations. (e) Three potential <strong>in</strong>terpretations <strong>of</strong><br />
the copy-ratio histogram (b) <strong>in</strong> terms <strong>of</strong> absolute copy numbers. Horizontal<br />
dotted l<strong>in</strong>es <strong>in</strong>dicate the copy ratios correspond<strong>in</strong>g to the <strong>in</strong>dicated<br />
absolute <strong>somatic</strong> copy-numbers. (f) Purity (fraction <strong>of</strong> tumor nuclei) and<br />
cancer-genome ploidy values correspond<strong>in</strong>g to each <strong>in</strong>terpretation <strong>in</strong> (e).<br />
Dotted l<strong>in</strong>es denote potential solutions that share either b, the copy ratio<br />
associated with zero <strong>somatic</strong> copies (from upper left to lower right), or δ τ ,<br />
the spac<strong>in</strong>g between consecutive <strong>in</strong>teger copy levels (from lower left<br />
to upper right). Candidate solutions lie on the <strong>in</strong>dicated grid <strong>of</strong><br />
b = 2(1 – α)/D and δ τ = α/D (equation (1)). (g) The log-likelihood (score) <strong>of</strong><br />
each solution <strong>in</strong> terms <strong>of</strong> the SCNA fit <strong>of</strong> the observed copy ratios to <strong>in</strong>teger<br />
absolute copy numbers and plausibility <strong>of</strong> the proposed karyotype. The<br />
highest-scor<strong>in</strong>g solution (green) is identified by the comb<strong>in</strong>ation <strong>of</strong> SCNA-fit<br />
and karyotype log-likelihood values. This <strong>in</strong>terpretation implies subclonal<br />
ga<strong>in</strong> <strong>of</strong> chromosome 2 (e, arrow). The SCNA score alone cannot dist<strong>in</strong>guish<br />
between this and an additional solution (blue), <strong>in</strong> which the arrowed region<br />
is closer to an <strong>in</strong>teger copy state, but the overall SCNA-fit score is equivalent<br />
to that <strong>of</strong> the first solution. (h) Interpretation <strong>of</strong> <strong>somatic</strong> <strong>DNA</strong> <strong>alterations</strong> on<br />
an absolute scale. Modeled SCNA copy states are shown (left). In addition,<br />
allelic fractions may be re<strong>in</strong>terpreted as average allelic copies per cancer cell<br />
(multiplicity), potentially reveal<strong>in</strong>g subclonal po<strong>in</strong>t mutations (right).<br />
types. Despite evidence that genome doubl<strong>in</strong>gs can result <strong>in</strong> genetic<br />
<strong>in</strong>stability and accelerate oncogenesis 13,25,26 , the <strong>in</strong>cidence and tim<strong>in</strong>g<br />
<strong>of</strong> such events had not been broadly characterized <strong>in</strong> human cancer.<br />
We then describe how estimates <strong>of</strong> tumor purity and absolute copy<br />
number allow us to analyze allelic-fraction values (the fraction <strong>of</strong><br />
non-reference sequenc<strong>in</strong>g reads support<strong>in</strong>g a mutation) to dist<strong>in</strong>guish<br />
clonal and subclonal po<strong>in</strong>t mutations, and to detect macroscopic<br />
subclonal structure <strong>in</strong> an ovarian cancer sample. Clonal events<br />
may be classified as homozygous or heterozygous <strong>in</strong> the cancer cells,<br />
guid<strong>in</strong>g <strong>in</strong>terpretation <strong>of</strong> their function. In addition, the ability to<br />
quantify <strong>in</strong>teger multiplicity <strong>of</strong> po<strong>in</strong>t mutations aids <strong>in</strong> the relative<br />
tim<strong>in</strong>g <strong>of</strong> segmental <strong>DNA</strong> copy-number ga<strong>in</strong>s, as multiplicity values<br />
<strong>of</strong> greater than one imply that the po<strong>in</strong>t mutation preceded copy ga<strong>in</strong><br />
<strong>of</strong> the locus. Controll<strong>in</strong>g for tumor purity and local copy-number<br />
allow such tim<strong>in</strong>gs to be calculated more generally than <strong>in</strong> the special<br />
case <strong>of</strong> copy-neutral loss <strong>of</strong> heterozygosity 27 . F<strong>in</strong>ally, our data allow<br />
characterization <strong>of</strong> <strong>somatic</strong> cancer evolution with respect to wholegenome<br />
doubl<strong>in</strong>g, which we demonstrate <strong>in</strong> ovarian carc<strong>in</strong>oma and<br />
associate with cl<strong>in</strong>icopathological values.<br />
RESULTS<br />
Inference <strong>of</strong> sample purity and ploidy <strong>in</strong> cancer-derived <strong>DNA</strong><br />
A conceptual overview <strong>of</strong> ABSOLUTE is shown <strong>in</strong> Figure 1. When <strong>DNA</strong><br />
is extracted from a mixed population <strong>of</strong> cancer and normal cells, the<br />
414 VOLUME 30 NUMBER 5 MAY 2012 nature biotechnology
npg © 2012 <strong>Nature</strong> America, Inc. All rights reserved.<br />
Figure 2 ABSOLUTE method validation and<br />
comparison. (a) FACS-based ploidy measurements<br />
versus <strong>in</strong>ferred ploidy estimates for 37 primary<br />
tumor samples. Dashed l<strong>in</strong>e <strong>in</strong>dicates y = x.<br />
RMSE: root mean squared error. P-values were<br />
calculated on the squared errors us<strong>in</strong>g the<br />
paired one-sided Wilcoxon test (*, P < 0.05;<br />
**, P < 0.001). (b) SKY-based ploidy measurements<br />
versus <strong>in</strong>ferred ploidy estimates<br />
for 33 cancer cell l<strong>in</strong>es. Data are displayed as<br />
<strong>in</strong> a. (c) Estimated purity <strong>of</strong> the 33 cell l<strong>in</strong>es<br />
shown <strong>in</strong> b. Dashed horizontal l<strong>in</strong>e <strong>in</strong>dicates<br />
the true purity (1.0). (d) Cancer-normal <strong>DNA</strong><br />
mix<strong>in</strong>g experiment results for two cell l<strong>in</strong>es.<br />
<strong>DNA</strong> from each cancer cell l<strong>in</strong>e was mixed with<br />
<strong>DNA</strong> from the matched B-lymphocyte <strong>in</strong> vary<strong>in</strong>g<br />
proportions (x axis). Top, predicted versus true<br />
<strong>DNA</strong> mix<strong>in</strong>g fractions compared to the y = x l<strong>in</strong>e<br />
(dashed). Bottom, predicted cancer cell l<strong>in</strong>e<br />
ploidy versus mixture purity. The copy pr<strong>of</strong>ile<br />
<strong>of</strong> several samples was mis<strong>in</strong>terpreted (x’s);<br />
these po<strong>in</strong>ts were not <strong>in</strong>cluded <strong>in</strong> the RMSE<br />
calculations. Ploidy estimates were generally<br />
consistent with previous SKY analysis <strong>of</strong> these<br />
cell l<strong>in</strong>es: http://www.path.cam.ac.uk/~pawefish/<br />
cell%20l<strong>in</strong>e%20catalogues/breast-cell-l<strong>in</strong>es.htm.<br />
(e) Leukocyte methylation signature enrichment<br />
<strong>in</strong> tumors <strong>of</strong> histologically underestimated purity.<br />
HGS-OvCa samples are shown grouped accord<strong>in</strong>g<br />
to the <strong>in</strong>dicated histological purity estimates<br />
(x axis) 34 . Black horizontal l<strong>in</strong>es <strong>in</strong>dicate the<br />
median purity <strong>of</strong> each group, as estimated by<br />
ABSOLUTE. The color <strong>of</strong> each po<strong>in</strong>t corresponds<br />
to the degree to which that sample’s methylation<br />
pr<strong>of</strong>ile resembled that <strong>of</strong> purified leukocytes.<br />
<strong>in</strong>formation on absolute copy number per cancer cell is lost. The purpose<br />
<strong>of</strong> ABSOLUTE is to <strong>in</strong>fer this <strong>in</strong>formation from the population<br />
<strong>of</strong> mixed <strong>DNA</strong>. This process beg<strong>in</strong>s with the generation <strong>of</strong> segmented<br />
copy-number data, which is <strong>in</strong>put to the ABSOLUTE algorithm together<br />
with precomputed models <strong>of</strong> recurrent cancer karyotypes and, optionally,<br />
allelic fraction values for <strong>somatic</strong> po<strong>in</strong>t mutations. The output <strong>of</strong><br />
ABSOLUTE then provides <strong>in</strong>ferred <strong>in</strong>formation on the absolute cellular<br />
copy number <strong>of</strong> local <strong>DNA</strong> segments and, for po<strong>in</strong>t mutations, the<br />
number <strong>of</strong> mutated alleles (Fig. 1).<br />
We beg<strong>in</strong> by describ<strong>in</strong>g the <strong>in</strong>ference framework used <strong>in</strong><br />
ABSOLUTE. Suppose a cancer-tissue sample consists <strong>of</strong> a mixture <strong>of</strong><br />
a proportion α <strong>of</strong> cancer cells (assumed to be monogenomic—that<br />
is, with homogenous SCNAs <strong>in</strong> the cancer cells) and a proportion<br />
(1 – α) <strong>of</strong> contam<strong>in</strong>at<strong>in</strong>g normal (diploid) cells. For each locus x <strong>in</strong> the<br />
genome, let q(x) denote the <strong>in</strong>teger copy number <strong>of</strong> the locus <strong>in</strong> the<br />
cancer cells. Let τ denote the mean ploidy <strong>of</strong> the cancer-cell fraction,<br />
def<strong>in</strong>ed as the average value <strong>of</strong> q(x) across the genome. In the mixed<br />
cancer sample, the average absolute copy number <strong>of</strong> locus x is α q(x) +<br />
2(1 − α) and the average ploidy (D) is ατ + 2(1 − α), measured <strong>in</strong> units<br />
<strong>of</strong> haploid genomes.<br />
The relative copy number (R) <strong>of</strong> locus x is therefore:<br />
R( x) = ( a q( x) + 2( 1 − a))/ D = ( a / D)<br />
q ( x) + ( 2( 1 − a)/<br />
D)<br />
(1)<br />
Because q(x) takes <strong>in</strong>teger values, R(x) takes discrete values. The<br />
smallest possible value is (2(1 − α)/D), which occurs at homozygously<br />
deleted loci and corresponds to the fraction <strong>of</strong> <strong>DNA</strong> from normal<br />
cells. The spac<strong>in</strong>g between values (α/D) corresponds to the<br />
concentration ratio <strong>of</strong> alleles present at one copy per cancer cell and<br />
zero copies per normal cell. Notably, if a cancer sample is not strictly<br />
a<br />
Estimated ploidy<br />
b<br />
Estimated ploidy<br />
c<br />
Estimated purity<br />
6<br />
5<br />
4<br />
3<br />
2<br />
1<br />
6<br />
5<br />
4<br />
3<br />
2<br />
1<br />
1.0<br />
0.9<br />
0.8<br />
0.7<br />
0.6<br />
ABSOLUTE<br />
ASCAT<br />
RMSE = 0.7<br />
RMSE = 1.026<br />
1 2 3 4 5 6<br />
Measured ploidy (FACS)<br />
RMSE = 0.537<br />
RMSE = 0.847 **<br />
1 2 3 4 5 6<br />
Measured ploidy (SKY)<br />
RMSE = 0.004<br />
RMSE = 0.203 **<br />
0 5 10 15<br />
Cell l<strong>in</strong>e<br />
20 25 30<br />
0.1 0.2 0.3 0.4<br />
Leukocyte methylation signature<br />
A n A ly s i s<br />
clonal, copy-number <strong>alterations</strong> occurr<strong>in</strong>g <strong>in</strong> substantial subclonal<br />
fractions will appear as outliers from this pattern (Fig. 1b,e, arrows).<br />
Similar considerations have formed the basis for algorithms to<br />
<strong>in</strong>fer purity and ploidy us<strong>in</strong>g allelic copy-ratios derived from s<strong>in</strong>glenucleotide<br />
polymorphisms (SNP) microarrays28–33 .<br />
We extend absolute copy <strong>in</strong>ference to encompass <strong>somatic</strong> po<strong>in</strong>t<br />
mutations as follows:<br />
F( x) = ( a sq( x))/ Ds = ( a / Ds)<br />
sq<br />
( x)<br />
(2)<br />
Here, sq represents the multiplicity <strong>of</strong> the po<strong>in</strong>t mutation, <strong>in</strong> <strong>in</strong>teger<br />
values per cancer cell (which cannot exceed q(x)), and Ds = αq(x) +<br />
2(1 − α). The values <strong>of</strong> F(x) correspond to the expected fraction<br />
<strong>of</strong> sequenc<strong>in</strong>g reads that support the mutation, which depend on<br />
the sample purity and absolute <strong>somatic</strong> copy number at the mutant<br />
locus, q(x).<br />
The ABSOLUTE algorithm exam<strong>in</strong>es possible mapp<strong>in</strong>gs from relative<br />
to <strong>in</strong>teger copy numbers by jo<strong>in</strong>tly optimiz<strong>in</strong>g the two parameters α<br />
and τ (Fig. 1e–g; Supplementary Fig. 1; Onl<strong>in</strong>e Methods equation (5)).<br />
In many cases, several such mapp<strong>in</strong>gs are possible, correspond<strong>in</strong>g to<br />
multiple optima.<br />
To help resolve ambiguous cases, we used recurrent cancerkaryotype<br />
models based on large data sets (Supplementary Fig. 2;<br />
Onl<strong>in</strong>e Methods equation (8) to identify the simplest (that is, most<br />
common) karyotype that can adequately expla<strong>in</strong> the data. This<br />
method favors simpler solutions, while preserv<strong>in</strong>g the flexibility<br />
to identify unexpected karyotypes given sufficient evidence from<br />
the copy pr<strong>of</strong>ile. Indeed, several unusual karyotypes, <strong>in</strong>clud<strong>in</strong>g<br />
near-haploid (6n) genomes,<br />
were identified us<strong>in</strong>g ABSOLUTE (Supplementary Fig. 3).<br />
nature biotechnology VOLUME 30 NUMBER 5 MAY 2012 415<br />
*<br />
d<br />
Estimated<br />
mix<strong>in</strong>g fraction<br />
Estimated ploidy<br />
1.0<br />
0.8<br />
0.6<br />
0.4<br />
0.2<br />
0<br />
5<br />
4<br />
3<br />
2<br />
e<br />
Estimated purity (ABSOLUTE)<br />
x<br />
1.0<br />
0.8<br />
0.6<br />
0.4<br />
0.2<br />
HCC38<br />
RMSE = 0.066<br />
RMSE = 0.16<br />
0.4 0.6 0.8 1.0<br />
Cancer mix<strong>in</strong>g fraction<br />
x x<br />
HCC1143<br />
RMSE = 0.051<br />
RMSE = 0.117<br />
* *<br />
0.4 0.6 0.8 1.0<br />
Cancer mix<strong>in</strong>g fraction<br />
0.7−0.8 0.8−0.9 0.9−0.95 0.95−1<br />
Histological purity estimate
npg © 2012 <strong>Nature</strong> America, Inc. All rights reserved.<br />
A n A ly s i s<br />
a<br />
Called (76.7%)<br />
Nonaberrant (9.1%)<br />
Insufficient purity (7.3%)<br />
Polygenomic (6.9%)<br />
TCGA-HGS-OvCa (485)<br />
RCC (87)<br />
Glioma (27)<br />
TCGA-GBM (192)<br />
Neuroblastoma (25)<br />
Cell l<strong>in</strong>es (364)<br />
HCC (108)<br />
Colorectal cancer (125)<br />
Medulloblastoma (96)<br />
ALL (235)<br />
MFH (36)<br />
Ovarian cancer (90)<br />
Prostate cancer (61)<br />
Esophageal adeno (69)<br />
Other sarcoma (66)<br />
Liposarcoma (93)<br />
Breast cancer (134)<br />
Lung squamous (46)<br />
Esophageal squamous (32)<br />
Lung adeno (543)<br />
GIST (36)<br />
MPD (205)<br />
Median called fraction = 0.79<br />
0 0.2 0.4 0.6 0.8 1.0<br />
Fraction <strong>of</strong> samples<br />
Our implementation supports copy-number <strong>in</strong>ference from either total<br />
or allelic copy-ratio data, such that array-CGH, SNP microarray or massively<br />
parallel sequenc<strong>in</strong>g data may be used. ABSOLUTE is available for<br />
download at http://www.broad<strong>in</strong>stitute.org/cancer/cga/ABSOLUTE.<br />
Validation<br />
We validated the purity and ploidy predictions made by ABSOLUTE<br />
on Affymetrix SNP microarray data us<strong>in</strong>g several approaches:<br />
(i) direct ploidy measurement <strong>of</strong> 37 TCGA ovarian carc<strong>in</strong>oma samples<br />
by fluorescence-activated cell sort<strong>in</strong>g 34 (Fig. 2a); (ii) measurement<br />
<strong>of</strong> ploidy for 33 NCI60 cell l<strong>in</strong>es based on spectral karyotyp<strong>in</strong>g 35<br />
(Fig. 2b,c); and (iii) <strong>DNA</strong>-mix<strong>in</strong>g experiments, <strong>in</strong> which cancer cell<br />
l<strong>in</strong>es were mixed with paired normal B lymphocyte–derived <strong>DNA</strong>s <strong>in</strong><br />
vary<strong>in</strong>g mass proportions (Fig. 2d, Onl<strong>in</strong>e Methods). We also evaluated<br />
a related computational method, ASCAT 31 , on these data (Fig. 2a–d<br />
and Supplementary Note). Although the results were broadly concordant<br />
with our estimates, ABSOLUTE achieved significantly more accurate<br />
results (Fig. 2a–d) on our validation data. Notably, we observed<br />
an apparent bias by ASCAT to underestimate the cancer cell fraction<br />
(Fig. 2 c,d), consistent with previous reports apply<strong>in</strong>g ASCAT <strong>in</strong> similar<br />
mix<strong>in</strong>g experiments us<strong>in</strong>g Illum<strong>in</strong>a SNP arrays 31 (Fig. S4 there<strong>in</strong>).<br />
Notably, the purity estimates produced by ABSOLUTE appeared<br />
to be more accurate for the bulk tumor than those derived from<br />
histological exam<strong>in</strong>ation <strong>of</strong> frozen tumor sections (Onl<strong>in</strong>e<br />
Methods, Fig. 2e). Estimates <strong>of</strong> the proportion <strong>of</strong> contam<strong>in</strong>at<strong>in</strong>g<br />
Fraction <strong>of</strong> samples<br />
b<br />
Fraction <strong>of</strong> samples c<br />
0.5<br />
0.4<br />
0.3<br />
0.2<br />
0.1<br />
0.5<br />
0.4<br />
0.3<br />
0<br />
0<br />
normal cells for 458 ovarian carc<strong>in</strong>oma samples 34 produced by<br />
ABSOLUTE were strongly correlated with a molecular signature<br />
<strong>of</strong> genomic methylation (Onl<strong>in</strong>e Methods) seen <strong>in</strong> leukocytes<br />
(r 2 = 0.59, P < 2.2 × 10 −16 , Fig. 2e), but only weakly correlated<br />
with estimates <strong>of</strong> contam<strong>in</strong>ation from histological exam<strong>in</strong>ation<br />
(r 2 = 0.1, P = 2.4 × 10 −12 ; Onl<strong>in</strong>e Methods; Fig. 2e x-axis scale,<br />
Supplementary Fig. 4).<br />
Estimation <strong>of</strong> tumor purity and ploidy across cancer types<br />
We used ABSOLUTE to analyze allelic copy-ratio pr<strong>of</strong>iles derived<br />
from SNP arrays from 3,155 cancer samples, compris<strong>in</strong>g 2,791 tissue<br />
specimens and 364 cancer cell l<strong>in</strong>es. This yielded predicted purity<br />
and ploidy values (Supplementary Table 1) and the segmented absolute<br />
allelic copy number <strong>of</strong> each tumor (Supplementary Table 2).<br />
The samples came from two TCGA pilot studies describ<strong>in</strong>g glioblastoma<br />
multiforme (GBM; 192 samples) 21 and ovarian carc<strong>in</strong>oma<br />
(488 samples) 34 , as well as 2,445 pr<strong>of</strong>iles <strong>in</strong>corporated from a<br />
previous pan-cancer copy-number analysis 36 (Onl<strong>in</strong>e Methods;<br />
see Supplementary Table 1 for characteristics <strong>of</strong> each tumor sample).<br />
A m<strong>in</strong>ority <strong>of</strong> these samples (519 or 16.4%) could not be analyzed<br />
because they lacked clearly identifiable SCNAs, either because they<br />
were nearly euploid (nonaberrant), or were excessively contam<strong>in</strong>ated<br />
with normal cells (<strong>in</strong>sufficient purity) (Fig. 3a). Although sequenc<strong>in</strong>g<br />
data for <strong>somatic</strong> po<strong>in</strong>t mutations may have resolved these cases, such<br />
data were not available for the majority <strong>of</strong> samples <strong>in</strong> this cohort 36 .<br />
416 VOLUME 30 NUMBER 5 MAY 2012 nature biotechnology<br />
0.2<br />
0.4<br />
0.6<br />
0.8<br />
Fraction <strong>of</strong> cancer nuclei<br />
1.0<br />
Medulloblastoma (79)<br />
ALL (191)<br />
TCGA-OV (469)<br />
TCGA-GBM (182)<br />
Colorectal cancer (104)<br />
HCC (94)<br />
RCC (84)<br />
Breast cancer (91)<br />
Esophageal adeno (52)<br />
Lung adeno (317)<br />
Figure 3 Pan-cancer application <strong>of</strong> ABSOLUTE. (a) ABSOLUTE<br />
0.2<br />
Cell l<strong>in</strong>es (317)<br />
Lung adeno (317)<br />
TCGA-OV (469)<br />
Esophageal adeno (52)<br />
result types: (i) called, unique purity/ploidy solution;<br />
(ii) nonaberrant, sample has no detectable <strong>somatic</strong> copy-<br />
0.1<br />
Breast cancer (91)<br />
Colorectal cancer (104)<br />
Prostate cancer (46)<br />
number <strong>alterations</strong>; (iii) <strong>in</strong>sufficient purity, <strong>in</strong>sufficient fraction<br />
0<br />
RCC (84)<br />
<strong>of</strong> cancer cells; (iv) polygenomic, discrete copy-ratio levels<br />
could not be determ<strong>in</strong>ed. (b) Distribution <strong>of</strong> estimated tumor<br />
1<br />
1.5 2 2.5 3<br />
3.5 4<br />
TCGA-GBM (182)<br />
ALL (191)<br />
purity for several data sets. We note that, because heavily<br />
Ploidy<br />
contam<strong>in</strong>ated tumors are difficult to call us<strong>in</strong>g ABSOLUTE, several <strong>of</strong> these distributions are biased toward higher purity samples. (c) Distribution <strong>of</strong><br />
estimated cancer genome ploidy for several datasets. Because tumors without SCNAs cannot be called us<strong>in</strong>g ABSOLUTE, these distributions do not<br />
<strong>in</strong>corporate the prevalence <strong>of</strong> such samples. (b,c) The number <strong>of</strong> called tumor samples is each group is shown <strong>in</strong> parentheses.
npg © 2012 <strong>Nature</strong> America, Inc. All rights reserved.<br />
Figure 4 Characterization <strong>of</strong> subclonal evolution<br />
<strong>in</strong> ovarian cancer by <strong>in</strong>tegrative analysis <strong>of</strong><br />
SNP array and whole-exome sequenc<strong>in</strong>g data.<br />
(a) Histogram <strong>of</strong> allelic fraction (alternate/<br />
total read-count) values for 29,628 <strong>somatic</strong><br />
po<strong>in</strong>t-mutations detected <strong>in</strong> 214 primary HGS-<br />
OvCa samples 34 . (b) Allelic fractions for the<br />
mutations shown <strong>in</strong> a were converted to po<strong>in</strong>t<br />
estimates <strong>of</strong> average allele-counts per cancer<br />
cell (cellular multiplicity; x axis) by correct<strong>in</strong>g<br />
for sample purity and local copy numbers.<br />
Subclonal mutations were identified us<strong>in</strong>g the<br />
model def<strong>in</strong>ed <strong>in</strong> equation (12). (c) The fraction<br />
<strong>of</strong> each <strong>of</strong> the six dist<strong>in</strong>guishable nucleotide<br />
substitutions for clonal versus subclonal po<strong>in</strong>tmutations.<br />
The solid gray l<strong>in</strong>e <strong>in</strong>dicates y = x.<br />
RMSE, root mean squared error. (d) Tumor SCNA<br />
pr<strong>of</strong>ile with modeled absolute copy numbers.<br />
Regions <strong>of</strong> normal homologous copy number = 1<br />
are grayed out, clonal SCNAs are brown.<br />
Subclonal SCNAs (light blue) appear <strong>in</strong> several<br />
clusters. Colored arrows <strong>in</strong>dicate subclonal<br />
For the 2,636 samples with detectable SCNAs, ABSOLUTE provided<br />
purity and ploidy calls for 92% <strong>of</strong> cases, and designated the rema<strong>in</strong><strong>in</strong>g<br />
samples as ‘polygenomic’ (genomically heterogeneous) (Fig. 3a),<br />
(Onl<strong>in</strong>e Methods and Supplementary Fig. 5). The fraction <strong>of</strong> called<br />
samples varied by disease type, from 34.6% (myeloproliferative disease;<br />
mostly nonaberrant genomes) to 96.7% (ovarian carc<strong>in</strong>oma;<br />
100% aberrant genomes), with a median call-rate <strong>of</strong> 79.2% (Fig. 3a).<br />
The distributions <strong>of</strong> estimated purity varied among cancer types,<br />
with the tested lung, esophageal and breast cancer samples be<strong>in</strong>g the<br />
least pure on average <strong>in</strong> our data set (Fig. 3b). The effect <strong>of</strong> contam<strong>in</strong>ation<br />
was readily visible <strong>in</strong> the copy ratios <strong>of</strong> impure tumor types<br />
(Supplementary Fig. 6). Distributions <strong>of</strong> estimated ploidy (Fig. 3c)<br />
were qualitatively consistent with those derived from previously<br />
obta<strong>in</strong>ed cytological data for each tumor type 13 .<br />
Power for detection <strong>of</strong> <strong>somatic</strong> po<strong>in</strong>t-mutations by sequenc<strong>in</strong>g<br />
Both tumor purity and ploidy affect the local depth <strong>of</strong> sequenc<strong>in</strong>g<br />
necessary to detect po<strong>in</strong>t mutations. For example, suppose that a<br />
region is present at six copies with only one copy carry<strong>in</strong>g a mutation<br />
<strong>in</strong> a sample that has 50% contam<strong>in</strong>ation with normal cells. In this<br />
case, only one <strong>of</strong> eight alleles at this locus (six from the cancer cells<br />
and two from the normal cells) carry the mutation (Supplementary<br />
Fig. 7a). We therefore expect that the mutation will be observed<br />
<strong>in</strong> only 12.5% <strong>of</strong> reads. Given this allelic fraction, local sequence<br />
coverage <strong>of</strong> 33-fold is required to detect the mutation with 80% sensitivity,<br />
assum<strong>in</strong>g a sequenc<strong>in</strong>g error rate <strong>of</strong> 10 −3 per base and a falsepositive<br />
rate controlled at 80% power <strong>in</strong> >80% <strong>of</strong> the genome).<br />
We then exam<strong>in</strong>ed whole-exome sequenc<strong>in</strong>g data (~150 × average<br />
coverage) from 214 TCGA ovarian carc<strong>in</strong>oma samples 34 to determ<strong>in</strong>e<br />
whether detection power was related to the number <strong>of</strong> mutations<br />
actually observed. For each sample, we calculated the proportion <strong>of</strong><br />
loci for which the local coverage provided at least 80% power to detect<br />
mutations present at s<strong>in</strong>gle copy <strong>in</strong> a subclone present at 0.05 cancercell<br />
fraction. Those samples with the lowest proportion <strong>of</strong> such wellpowered<br />
loci tended to be those <strong>in</strong> which the fewest such mutations<br />
were detected (r 2 = 0.24, P = 2.7 × 10 −13 ; Supplementary Fig. 7f),<br />
suggest<strong>in</strong>g that the failure to f<strong>in</strong>d such mutations was due to the lack<br />
<strong>of</strong> power. This result also demonstrates the importance <strong>of</strong> power calculations<br />
for characterization <strong>of</strong> the subclonal frequency spectrum.<br />
Multiplicity analysis <strong>of</strong> <strong>somatic</strong> po<strong>in</strong>t-mutations<br />
We next used ABSOLUTE to convert the allelic fraction <strong>of</strong> mutations<br />
to cellular multiplicity estimates. For this purpose, we exam<strong>in</strong>ed<br />
nature biotechnology VOLUME 30 NUMBER 5 MAY 2012 417<br />
b<br />
Frequency<br />
3,000 Clonal<br />
Subclonal<br />
2,000<br />
1,000<br />
0<br />
1.2<br />
1.0<br />
0.8<br />
0.6<br />
0.4<br />
0.2<br />
0<br />
0 0.5 1.0 1.5 2.0<br />
Cellular multiplicity<br />
0 0.2 0.4 0.6 0.8<br />
Allelic fraction<br />
1.0<br />
c<br />
Fraction <strong>of</strong> subclonal mutations<br />
Genomic fraction<br />
Density ef<br />
RMSE = 0.0392<br />
0.4<br />
0.3<br />
0.2<br />
0.1<br />
0<br />
0.08<br />
0.06<br />
0.04<br />
0.02<br />
0<br />
C>A<br />
A>G<br />
A>T<br />
C>G<br />
T>G<br />
C>T<br />
0 0.1 0.2 0.3 0.4<br />
Fraction <strong>of</strong> clonal mutations<br />
0 0.2 0.4 0.6 0.8 1.0<br />
Fraction <strong>of</strong> cancer cells with alteration
npg © 2012 <strong>Nature</strong> America, Inc. All rights reserved.<br />
A n A ly s i s<br />
a<br />
Reference allele concentration ratio<br />
2.0<br />
1.5<br />
1.0<br />
0.5<br />
0<br />
0 0.5 1.0 1.5 2.0<br />
Mutant allele concentration ratio<br />
29,268 <strong>somatic</strong> mutations identified <strong>in</strong> whole-exome hybrid capture<br />
Illum<strong>in</strong>a sequenc<strong>in</strong>g 37 data from 214 ovarian carc<strong>in</strong>oma tumor-<br />
normal pairs 34 (Fig. 4a). Tumor purity, ploidy and absolute copynumber<br />
values were obta<strong>in</strong>ed from Affymetrix SNP6.0 hybridization<br />
data on the same <strong>DNA</strong> aliquot that was sequenced, allow<strong>in</strong>g the<br />
rescal<strong>in</strong>g <strong>of</strong> allelic fractions to units <strong>of</strong> multiplicity (Fig. 4a,b; Onl<strong>in</strong>e<br />
Methods, equation (12)).<br />
This procedure identified pervasive subclonal po<strong>in</strong>t-mutations <strong>in</strong><br />
ovarian carc<strong>in</strong>oma samples. Although many <strong>of</strong> the mutations were<br />
clustered around <strong>in</strong>teger multiplicities, a substantial fraction occurred<br />
at multiplicities substantially less than one copy per average cancer<br />
cell, consistent with subclonal multiplicity (Fig. 4b)).<br />
Several l<strong>in</strong>es <strong>of</strong> evidence support the validity <strong>of</strong> these subclonal<br />
mutations, <strong>in</strong>clud<strong>in</strong>g Illum<strong>in</strong>a resequenc<strong>in</strong>g <strong>of</strong> an <strong>in</strong>dependent wholegenome<br />
amplification aliquot, which confirmed both their presence<br />
(Supplementary Fig. 8a,b), and that their allelic fractions corresponded<br />
to subclonal multiplicity values (Supplementary Fig. 8c,d).<br />
In addition, the mutation spectrum seen for clonal and subclonal mutations<br />
was similar (root mean squared error (RMSE) = 0.04, Fig. 4c),<br />
consistent with a common mechanism <strong>of</strong> orig<strong>in</strong>. Power calculations<br />
showed that these samples were at least 80% powered for detection <strong>of</strong><br />
subclonal mutations occurr<strong>in</strong>g <strong>in</strong> cancer-cell fractions rang<strong>in</strong>g from<br />
0.1 to 0.53, with a median <strong>of</strong> 0.19 (Supplementary Fig. 7e).<br />
The distribution <strong>of</strong> subclonal multiplicity was similar <strong>in</strong> the majority<br />
<strong>of</strong> samples (Fig. 4b); it rapidly <strong>in</strong>creased at the sample-specific<br />
detection limit and then decreased <strong>in</strong> a manner approximated by<br />
an exponential decay <strong>in</strong> the multiplicity range <strong>of</strong> 0.05 to 0.5 when<br />
pool<strong>in</strong>g across all samples. In contrast, the high-grade serous ovarian<br />
carc<strong>in</strong>oma (HGS-OvCa) sample TCGA-24-1603 (Fig. 4d–f) showed<br />
evidence for discrete ‘macroscopic subclones’. Rescal<strong>in</strong>g <strong>of</strong> subclonal<br />
SCNAs (Fig. 4d) and po<strong>in</strong>t mutations (Fig. 4e) to units <strong>of</strong> cancer cell<br />
fraction (Fig. 4f) revealed discrete clusters near fractions 0.2, 0.3<br />
and 0.6 (Fig. 4f), imply<strong>in</strong>g the <strong>alterations</strong> with<strong>in</strong> each cluster likely<br />
co-occurred <strong>in</strong> the same cancer cells. We note that this comb<strong>in</strong>ation<br />
<strong>of</strong> cell fractions sums to more than one, imply<strong>in</strong>g that at least one <strong>of</strong><br />
the detected subclones was nested <strong>in</strong>side another.<br />
b<br />
Reference allele multiplicity<br />
4<br />
3<br />
2<br />
1<br />
0<br />
Clonal hom.<br />
Subclonal hom.<br />
Subclonal het.<br />
Clonal het.<br />
0 1 2 3 4<br />
Mutant allele multiplicity<br />
We next used ABSOLUTE to analyze the multiplicity <strong>of</strong> both the<br />
reference and alternate alleles <strong>in</strong> order to classify po<strong>in</strong>t mutations<br />
as either heterozygous or homozygous <strong>in</strong> the affected cell fraction<br />
(Fig. 5a–c). We considered 15 genes with mutations recently identified<br />
<strong>in</strong> these data 34 , <strong>in</strong>clud<strong>in</strong>g five known tumor suppressor genes<br />
and five oncogenes (Fig. 5d). The frequency <strong>of</strong> homozygous mutations<br />
<strong>in</strong> known tumor suppressor genes and oncogenes was significantly<br />
different, with a significantly elevated fraction <strong>of</strong> homozygous<br />
mutations <strong>in</strong> the tumor suppressor genes (P = 0.006, Fig. 5d) and no<br />
homozygous mutations <strong>in</strong> the oncogenes (P = 0.012, Fig. 5d). This<br />
result provides evidence support<strong>in</strong>g CDK12 as a candidate tumor suppressor<br />
gene <strong>in</strong> ovarian carc<strong>in</strong>oma 34 , s<strong>in</strong>ce 7 <strong>of</strong> 12 CDK12 mutations<br />
were homozygous (P = 6.5 × 10 −5 ; Fig. 5d).<br />
Overall, TP53 had among the greatest fraction <strong>of</strong> clonal, homozygous<br />
and ‘multiplicity >1’ mutations <strong>of</strong> any gene <strong>in</strong> the cod<strong>in</strong>g exome<br />
(Fig. 5e), demonstrat<strong>in</strong>g the clear identification <strong>of</strong> a key <strong>in</strong>itiat<strong>in</strong>g event<br />
<strong>in</strong> HGS-OvCa carc<strong>in</strong>ogenesis 38 directly from multiplicity analysis.<br />
Whole-genome doubl<strong>in</strong>g occurs frequently <strong>in</strong> human cancer<br />
For many cancer types, the distribution <strong>of</strong> total copy number (ploidy)<br />
was markedly bi-modal (Fig. 3c), consistent with chromosome-count<br />
pr<strong>of</strong>iles derived from SKY 10,13 . Although these results are consistent<br />
with whole-genome doubl<strong>in</strong>g dur<strong>in</strong>g their <strong>somatic</strong> evolution, it has<br />
been difficult to rule out the alternative hypothesis that evolution<br />
<strong>of</strong> high-ploidy karyotypes results from a process <strong>of</strong> successive<br />
partial amplifications 12 .<br />
To study genome doubl<strong>in</strong>gs, we used homologous copy-number<br />
<strong>in</strong>formation—that is, the copy numbers, b i and c i , <strong>of</strong> the two homologous<br />
chromosome segments at each locus. By look<strong>in</strong>g at the distributions<br />
<strong>of</strong> b i and c i across the genome, we could draw <strong>in</strong>ferences<br />
regard<strong>in</strong>g genome doubl<strong>in</strong>g. Immediately follow<strong>in</strong>g genome doubl<strong>in</strong>g,<br />
both b i and c i would be even numbers. Follow<strong>in</strong>g the loss <strong>of</strong> a<br />
s<strong>in</strong>gle copy <strong>of</strong> a region, the larger <strong>of</strong> b i and c i will rema<strong>in</strong> even, but<br />
the smaller would become odd. In fact, when we looked at highploidy<br />
samples, we discerned that the higher <strong>of</strong> b i and c i was usually<br />
even throughout the genome, consistent with their hav<strong>in</strong>g arisen by<br />
418 VOLUME 30 NUMBER 5 MAY 2012 nature biotechnology<br />
c<br />
Reference allele concentration ratio<br />
2.0<br />
1.5<br />
1.0<br />
0.5<br />
0<br />
0 0.5 1.0 1.5 2.0<br />
Mutant allele concentration ratio<br />
Figure 5 Classification <strong>of</strong> <strong>somatic</strong> mutations by multiplicity analysis <strong>in</strong> 214 primary HGS-OvCa tumor<br />
samples. (a) Empirical density estimate <strong>of</strong> allelic concentration ratios, which are obta<strong>in</strong>ed by multiplication<br />
<strong>of</strong> the allelic fraction by the copy ratio at that locus. (b) Density estimate <strong>of</strong> allelic multiplicity estimates, as<br />
<strong>in</strong> Figure 4b, for reference versus mutant allele. Mutations were classified <strong>in</strong>to the four <strong>in</strong>dicated categories<br />
accord<strong>in</strong>g to their mutant and reference allele multiplicity. (c) The density estimates <strong>of</strong> allelic concentration<br />
ratios for each <strong>of</strong> the four mutation classes <strong>in</strong> b are shown superimposed. (d) Mutation classification<br />
pr<strong>of</strong>iles <strong>of</strong> genes identified as significantly recurrent <strong>in</strong> HGS-OvCa 34 , as well as several COSMIC genes with<br />
previously observed mutations <strong>in</strong> these data. Note that only <strong>in</strong>dividual po<strong>in</strong>t mutations were considered<br />
here; the possibility <strong>of</strong> recessive <strong>in</strong>activation through multiple mutations (compound heterozygosity) was<br />
not considered. (e) Histograms <strong>of</strong> gene classification fractions for 1,412 genes hav<strong>in</strong>g at least five recurrent<br />
mutations. Dotted vertical l<strong>in</strong>es denote the 5th (top) and 95th (other) percentiles <strong>of</strong> each distribution.<br />
No mutations occurr<strong>in</strong>g at multiplicity >1 were observed <strong>in</strong> NF1 (data not shown).<br />
e<br />
Number <strong>of</strong> genes<br />
d<br />
All genes<br />
TP53 (160)<br />
NF1 (15)<br />
BRCA2 (5)<br />
CDK12 (12)<br />
BRCA1 (6)<br />
GABRA6 (4)<br />
RB1 (7)<br />
FAT3 (19)<br />
CCNE1 (1)<br />
CSMD3 (32)<br />
BRAF (4)<br />
KRAS (4)<br />
PIK3CA (6)<br />
GLI2 (7)<br />
NRAS (1)<br />
Subclonal het.<br />
200 TP53<br />
150<br />
100<br />
50<br />
0<br />
Clonal hom.<br />
1,000<br />
800<br />
600<br />
400<br />
200<br />
0<br />
0 0.2 0.4 0.6 0.8 1.0<br />
Fraction <strong>of</strong> mutations<br />
Clonal multiplicity > 1<br />
800<br />
600<br />
TP53<br />
400<br />
200<br />
0<br />
NF1<br />
TP53<br />
0 0.2 0.4 0.6 0.8 1.0<br />
Fraction <strong>of</strong> mutations per gene (N = 1,412)
npg © 2012 <strong>Nature</strong> America, Inc. All rights reserved.<br />
Figure 6 Incidence and tim<strong>in</strong>g <strong>of</strong><br />
whole-genome doubl<strong>in</strong>g events <strong>in</strong> primary<br />
cancers. (a,b) Ploidy estimates were obta<strong>in</strong>ed<br />
from ABSOLUTE. Mean homolog imbalance<br />
was calculated as the average difference <strong>in</strong> the<br />
homologous copy numbers at every position<br />
<strong>in</strong> the genome. Genome doubl<strong>in</strong>g status was<br />
<strong>in</strong>ferred from the homologous copy numbers.<br />
(c) Frequency <strong>of</strong> genome doubl<strong>in</strong>g by cancer<br />
type. MPD, myeloproliferative disease;<br />
ALL, acute lymphoblastic leukemia; GBM,<br />
glioblastoma multiforme; RCC, renal cell<br />
carc<strong>in</strong>oma; HCC, hepatocellular carc<strong>in</strong>oma;<br />
HGS-OvCa, high-grade serous ovarian<br />
carc<strong>in</strong>oma. (d) LOH (loss <strong>of</strong> heterozygosity) was<br />
def<strong>in</strong>ed as 0 homologous copies. Amplification<br />
was def<strong>in</strong>ed as >1 homologous copy for samples<br />
with 0 genome doubl<strong>in</strong>gs, and as >2 homologous<br />
copies for those with 1 genome doubl<strong>in</strong>g. Calls<br />
were made based on the modal allelic copy<br />
numbers <strong>of</strong> each chromosome arm. Dashed<br />
l<strong>in</strong>es <strong>in</strong>dicate y = x. (e) SCNAs, def<strong>in</strong>ed as<br />
regions differ<strong>in</strong>g from the modal absolute<br />
copy number <strong>of</strong> each sample, were b<strong>in</strong>ned at<br />
adaptive resolution to ma<strong>in</strong>ta<strong>in</strong> 200 SCNAs per<br />
700 Genome doubl<strong>in</strong>gs<br />
600<br />
0<br />
1<br />
500<br />
400<br />
300<br />
200<br />
100<br />
0<br />
>1<br />
1n 2n 3n 4n 5n 6n<br />
Ploidy<br />
doubl<strong>in</strong>g <strong>of</strong> the entire genome (Supplementary Fig. 9). Us<strong>in</strong>g simulations,<br />
we found that the observed pr<strong>of</strong>iles were unlikely to arise<br />
ow<strong>in</strong>g to SCNAs occurr<strong>in</strong>g <strong>in</strong> serial fashion at multiple <strong>in</strong>dependent<br />
chromosomes (P < 10 –3 ).<br />
Us<strong>in</strong>g such <strong>in</strong>formation, we classified samples <strong>in</strong>to three groups,<br />
which we <strong>in</strong>terpreted as correspond<strong>in</strong>g to 0, 1 and >1 genome doubl<strong>in</strong>g<br />
events <strong>in</strong> the clonal evolution <strong>of</strong> the cancer. These three groups had<br />
modal ploidy values <strong>of</strong> 1.75, 2.75 and 4.0, respectively (Fig. 6a), and<br />
also segregated <strong>in</strong>to three clusters by ploidy and mean homologous<br />
copy-number imbalance (Fig. 6b). We <strong>in</strong>terpreted this as evidence<br />
<strong>of</strong> SNCAs occurr<strong>in</strong>g with net losses, <strong>in</strong>terspersed with the genome<br />
doubl<strong>in</strong>gs. This process resulted <strong>in</strong> <strong>in</strong>termediate ploidy values for the<br />
doubled clones (2.2–3.4n), with pervasive imbalance <strong>of</strong> homologous<br />
chromosomes (Fig. 6b).<br />
The frequency <strong>of</strong> genome doubl<strong>in</strong>g varied across tumor types<br />
(Fig. 6c), reflect<strong>in</strong>g differences <strong>in</strong> disease-specific biology and<br />
cl<strong>in</strong>ical progression status. Hematopoietic neoplasms (myeloproliferative<br />
disease, acute lymphoblastic leukemia) had nearly no<br />
doubl<strong>in</strong>g events, whereas glioblastoma multiforme, renal cell carc<strong>in</strong>oma,<br />
prostate cancer, various sarcomas, hepatocellular carc<strong>in</strong>oma<br />
and medulloblastoma all had ~25% <strong>in</strong>cidence <strong>of</strong> doubl<strong>in</strong>g.<br />
Genome doubl<strong>in</strong>g was more common <strong>in</strong> epithelial cancers,<br />
with colorectal, breast, lung, ovarian and esophageal cancers all<br />
hav<strong>in</strong>g >50% <strong>in</strong>cidence <strong>of</strong> doubl<strong>in</strong>g (Fig. 6c). Esophageal adenocarc<strong>in</strong>oma<br />
had the greatest doubl<strong>in</strong>g <strong>in</strong>cidence, consistent with previous<br />
reports <strong>of</strong> frequent 4n populations at various stages <strong>of</strong> Barrett’s<br />
esophagus progression 39,40 .<br />
Specific aneuploidies precede genome doubl<strong>in</strong>g<br />
We then used ABSOLUTE to <strong>in</strong>fer the temporal order <strong>of</strong> genome<br />
doubl<strong>in</strong>g <strong>in</strong> tumorigenesis, relative to SNCAs <strong>in</strong>volv<strong>in</strong>g specific<br />
chromosome arms. In many cancer types, the fixation <strong>of</strong> arm-level<br />
SCNAs was <strong>in</strong>ferred to occur before genome doubl<strong>in</strong>g, because both<br />
doubled and nondoubled samples had similar frequencies <strong>of</strong> specific<br />
arm-level SNCAs (Fig. 6d and Supplementary Fig. 10).<br />
a<br />
Number <strong>of</strong> samples<br />
d<br />
Frequency at 1 doubl<strong>in</strong>g<br />
1.0<br />
0.8<br />
9p<br />
0.6<br />
4q 4p<br />
5q<br />
8p<br />
0.4 6p 3p<br />
5p<br />
0.2 1p 2p 6q 10q 7q 9q<br />
11q 11p<br />
3q 1q<br />
2q7p<br />
8q 10p<br />
0<br />
12p<br />
17p<br />
18q<br />
19p 21q<br />
12q 13q 18p<br />
14q<br />
16q 20p 15q 19q<br />
17q 16p<br />
20q<br />
22q<br />
Esophageal adenocarc<strong>in</strong>oma<br />
1.0<br />
0.8<br />
0.6<br />
0.4<br />
0.2<br />
0<br />
0 0.2 0.4 0.6 0.8 1.0<br />
2p1q<br />
2q 1p<br />
3p<br />
8q<br />
5p<br />
7p<br />
6p 9p3q<br />
7q 9q<br />
11p11q 10q 6q 8p5q<br />
4q10p<br />
4p<br />
12p 12q 20q<br />
18p<br />
19p 17q 20p<br />
19q 17p 13q<br />
16p 16q 18q 21q 15q<br />
14q 22q<br />
A n A ly s i s<br />
b<strong>in</strong>, and renormalized by b<strong>in</strong> length. The value <strong>in</strong> each b<strong>in</strong> was further divided by the number <strong>of</strong> tumor samples <strong>in</strong> each genome doubl<strong>in</strong>g class, <strong>in</strong>dicated<br />
by color as <strong>in</strong> a. The black l<strong>in</strong>e <strong>in</strong>dicates slope = −1. L<strong>in</strong>ear regression models were fit <strong>in</strong>dependently for each class us<strong>in</strong>g SCNAs 0.5 < x < 20 Mb.<br />
This resulted <strong>in</strong> fitted slope values <strong>of</strong> −1.05, −0.96 and −0.88 for 0, 1 and >1 genome doubl<strong>in</strong>gs, respectively (data not shown).<br />
In glioblastoma multiforme samples, loss <strong>of</strong> heterozygosity <strong>in</strong>volv<strong>in</strong>g<br />
chromosomes 9 and 10, and ga<strong>in</strong>s <strong>of</strong> chromosome 7 occurred at<br />
equivalent frequencies (Fig. 6d), demonstrat<strong>in</strong>g that the most common<br />
broad SCNAs <strong>in</strong> glioblastoma multiforme occur before genome<br />
doubl<strong>in</strong>g. Ga<strong>in</strong> <strong>of</strong> chromosomes 19 and 20 was nearly exclusive to<br />
nondoubled samples, and several arms had greater frequency <strong>of</strong> loss<br />
<strong>of</strong> heterozygosity <strong>in</strong> doubled samples (Fig. 6d), suggest<strong>in</strong>g that additional<br />
biological differences underlie these samples.<br />
Because ABSOLUTE could not dist<strong>in</strong>guish between ploidy 2N and<br />
4N <strong>in</strong> cases with no observed SCNAs, we discarded such nonaberrant<br />
samples from our analysis (Fig. 3a). For many tumor types, such cases<br />
were rare, due to the tendency for chromosomal losses after doubl<strong>in</strong>g<br />
(Figs. 3c and 6a,b and Supplementary Fig. 9). The representation <strong>of</strong><br />
specific cancer subtypes may be biased by differences <strong>in</strong> ascerta<strong>in</strong>ment,<br />
however.<br />
In contrast to broad chromosomal <strong>alterations</strong>, focal SCNA events<br />
occurred at greater frequency <strong>in</strong> doubled genomes (Fig. 6e). Consistent<br />
with previous reports 36,41,42 , the observed frequency <strong>of</strong> focal SCNAs as<br />
a function <strong>of</strong> their length (L) followed power-law scal<strong>in</strong>g: P(L) ∝ L −α ,<br />
for L > 0.5 Mb (Fig. 6e). Genome doubl<strong>in</strong>g was associated with a larger<br />
overall number <strong>of</strong> SCNAs; however, we obta<strong>in</strong>ed estimates <strong>of</strong> α near<br />
1 for each group (Fig. 6e), suggest<strong>in</strong>g that the mechanism(s) by which<br />
they were generated did not greatly depend on ploidy.<br />
Genome doubl<strong>in</strong>g <strong>in</strong>fluences progression <strong>of</strong> ovarian carc<strong>in</strong>oma<br />
We next sought to correlate whole-genome doubl<strong>in</strong>g occurrence <strong>in</strong><br />
high-grade serous ovarian carc<strong>in</strong>oma with other genetic and cl<strong>in</strong>ical<br />
features. Genome-doubled samples showed a higher <strong>in</strong>cidence <strong>of</strong><br />
heterozygous mutations, but correct<strong>in</strong>g for sample ploidy removed<br />
this effect (Fig. 7a), suggest<strong>in</strong>g that the per-base mutation rates are<br />
equivalent. Clonal mutations at multiplicity >1 were approximately<br />
tenfold more prevalent <strong>in</strong> doubled samples; many <strong>of</strong> these events<br />
likely occurred before the doubl<strong>in</strong>g event. Genome-doubled samples<br />
had significantly lower frequencies <strong>of</strong> both <strong>of</strong> homozygous deletions<br />
(Fig. 7b) and <strong>of</strong> clonal homozygous mutations (Fig. 7c). We expect<br />
nature biotechnology VOLUME 30 NUMBER 5 MAY 2012 419<br />
HGS-OvCa<br />
b<br />
Mean homolog imbalance<br />
13q<br />
8p<br />
15q 4q<br />
5q 6q16q<br />
9q4p<br />
18q<br />
19p 11p19q<br />
11q 21q 12q<br />
10q 3p 7p 6p<br />
14q 18p<br />
16p 9p<br />
2q<br />
1q2p 3q<br />
1p 7q<br />
12p 5p 20q 20p 8q 10p<br />
4<br />
3<br />
2<br />
1<br />
0<br />
0 0.2 0.4 0.6 0.8 1.0<br />
3q<br />
1q 6p<br />
5p<br />
2p<br />
4p 6q 1p 2q<br />
4q3p<br />
5q<br />
7p<br />
17q<br />
8q<br />
12p<br />
10p13q7q<br />
17p 11q<br />
9p 12q<br />
11p 16p 18p 19p 19q<br />
8p 10q 9q 14q 15q<br />
16q 18q<br />
20p<br />
20q<br />
21q<br />
22q<br />
1n 2n 3n 4n 5n 6n<br />
Ploidy<br />
17q 17p<br />
0 0.2 0.4 0.6 0.8 1.0 0 0.2 0.4 0.6 0.8 1.0 0 0.2 0.4 0.6 0.8 1.0<br />
Amplification frequency <strong>in</strong> tumors with 0 genome doubl<strong>in</strong>gs<br />
22q<br />
GBM<br />
2q3p 5q 2p 4q 5p 4p 3q<br />
1q 1p<br />
6p6q<br />
14q<br />
17p13q<br />
9p<br />
17q 11q<br />
11p 8p<br />
8q9q<br />
22q<br />
15q 18p 12p 18q 19q<br />
21q 12q 16p 16q<br />
20q 19p 20p<br />
7p 7q<br />
10p10q<br />
0 0.2 0.4 0.6 0.8 1.0<br />
LOH frequency <strong>in</strong> tumors with 0 genome doubl<strong>in</strong>gs<br />
1p<br />
2p 1q<br />
2q<br />
3p<br />
3q 4p<br />
9q<br />
17p 9p<br />
21q<br />
16p 14q 10q 6p 4q 8p 17q 12p 10p<br />
16q 22q 8q 5p<br />
13q 11p 11q 15q 6q 18p 18q 12q 5q<br />
19q<br />
19p<br />
20q 20p<br />
7p7q<br />
e<br />
SCNAs per sample<br />
c<br />
MPD (55)<br />
ALL (173)<br />
GBM (168)<br />
RCC (82)<br />
Prostate cancer (42)<br />
Other sarcoma (45)<br />
HCC (92)<br />
Medulloblastoma (73)<br />
Liposarcoma (61)<br />
Colorectal cancer (100)<br />
Breast cancer (84)<br />
HGS-OvCa (412)<br />
Lung adeno (297)<br />
Esophageal adeno (50)<br />
1e+02<br />
1e+01<br />
1e+00<br />
1e−01<br />
1e−02<br />
0 0.4 0.8<br />
Fraction <strong>of</strong> called samples<br />
0.1 1.0 10.0 100.0<br />
SCNA length (Mb)
npg © 2012 <strong>Nature</strong> America, Inc. All rights reserved.<br />
A n A ly s i s<br />
HGS-OvCa<br />
genome doubl<strong>in</strong>gs<br />
0<br />
1<br />
>1<br />
a b c d e<br />
Clonal het.<br />
Clonal het./ploidy<br />
Clonal multiplicity > 1<br />
0 20 40 60 80 100<br />
Mutations per sample<br />
that many <strong>of</strong> the observed homozygous <strong>alterations</strong> <strong>in</strong> the doubled<br />
samples were fixed before genome doubl<strong>in</strong>g.<br />
The lower <strong>in</strong>cidence <strong>of</strong> homozygous mutations <strong>in</strong> genome-doubled<br />
samples may reflect the fact that more events are required to render<br />
a mutation homozygous <strong>in</strong> a genome-doubled sample (although the<br />
effect may be partially <strong>of</strong>fset by a possible <strong>in</strong>crease <strong>in</strong> genetic <strong>in</strong>stability<br />
follow<strong>in</strong>g doubl<strong>in</strong>g, for example, by centrosome duplication 43 ).<br />
These considerations suggest that genome-doubled samples evolve<br />
by means <strong>of</strong> dist<strong>in</strong>ct trajectories, because <strong>in</strong>activation <strong>of</strong> tumor suppressors<br />
may occur less frequently after doubl<strong>in</strong>g.<br />
We note that 13 <strong>of</strong> the 15 detected po<strong>in</strong>t mutations <strong>in</strong> the tumor<br />
suppressor NF1 occurred <strong>in</strong> the 93 ovarian samples that had not<br />
undergone genome doubl<strong>in</strong>g (P = 0.002; Fisher’s exact test), and<br />
these mutations were uniformly homozygous (data not shown). This<br />
is consistent with selection for recessive <strong>in</strong>activation <strong>of</strong> NF1, a typical<br />
pattern for a tumor suppressor gene. It also suggests that nongenomedoubled<br />
ovarian carc<strong>in</strong>oma samples evolved through a dist<strong>in</strong>ct trajectory,<br />
rather than be<strong>in</strong>g precursors to doubled samples. If not, many<br />
NF1 mutations would be homozygous with multiplicity >1 <strong>in</strong> doubled<br />
samples, as is seen for TP53.<br />
F<strong>in</strong>ally, we noted that genome-doubled samples were associated<br />
with a significant <strong>in</strong>crease <strong>in</strong> the age at pathological diagnosis<br />
(Fig. 7d) and with a significantly greater <strong>in</strong>cidence <strong>of</strong> cancer<br />
recurrence (Fig. 7e).<br />
DISCUSSION<br />
Here we report the development <strong>of</strong> a reliable, high-throughput<br />
method to <strong>in</strong>fer absolute homologous copy numbers from tumorderived<br />
<strong>DNA</strong> samples, as well as multiplicity values <strong>of</strong> po<strong>in</strong>t mutations<br />
(ABSOLUTE). It may be possible to extend ABSOLUTE to other types<br />
<strong>of</strong> genomic <strong>alterations</strong>, such as structural rearrangements and small<br />
<strong>in</strong>sertions and deletions, although this may require longer sequence<br />
reads to ensure accurate sequence alignment.<br />
ABSOLUTE analysis <strong>of</strong> SCNAs demonstrated that many <strong>of</strong> the<br />
copy-number <strong>alterations</strong> analyzed were fixed <strong>in</strong> the cancer l<strong>in</strong>eage<br />
represented <strong>in</strong> the sample (Fig. 3). This was recapitulated <strong>in</strong> ovarian<br />
cancer by <strong>somatic</strong> po<strong>in</strong>t-mutations, many <strong>of</strong> which were fixed at <strong>in</strong>teger<br />
multiplicity (Fig. 4b). Classification <strong>of</strong> po<strong>in</strong>t mutations based on their<br />
multiplicities may help dist<strong>in</strong>guish tumor suppressors and oncogenes<br />
(Fig. 5d). Knowledge <strong>of</strong> discrete tumor copy-states, subclonal structure<br />
and genome doubl<strong>in</strong>g status provides a foundation for further reconstruction<br />
<strong>of</strong> the phylogenetic relationships with<strong>in</strong> a cancer and the<br />
temporal sequence by which a given cancer genome arose 44–46 .<br />
ABSOLUTE provides a tool for the design <strong>of</strong> studies us<strong>in</strong>g genomic<br />
sequenc<strong>in</strong>g to detect variant alleles <strong>in</strong> cancer tissue samples, based on<br />
calculation <strong>of</strong> sensitivity to detect mutations as a function <strong>of</strong> sample<br />
purity, local copy number and sequenc<strong>in</strong>g depth (Supplementary Fig. 7).<br />
The high accuracy <strong>of</strong> tumor purity and ploidy estimates produced by<br />
**<br />
*<br />
NS<br />
NS<br />
**<br />
*<br />
0 1 2 3<br />
**<br />
*<br />
4<br />
Homozygous<br />
deletions per sample<br />
**<br />
**<br />
0 2 4 6 8 10<br />
Homozygous<br />
mutations per sample<br />
20 40 60 80<br />
Patient age at<br />
diagnosis (years)<br />
0 2 4 6 8 10 12 14<br />
ABSOLUTE, based on SNP microarray data (Fig. 2), makes it possible to<br />
determ<strong>in</strong>e the sequenc<strong>in</strong>g depth required for a given sample or to select<br />
suitable samples given a fixed sequenc<strong>in</strong>g depth. Such considerations are<br />
vital to the <strong>in</strong>terpretation <strong>of</strong> subclonal po<strong>in</strong>t-mutations (Supplementary<br />
Figs. 7f and 10).<br />
Analysis <strong>of</strong> the predicted absolute allelic copy-number pr<strong>of</strong>iles<br />
across human cancers produced by ABSOLUTE shed new light on cancer<br />
genome evolution. The observed SCNA pr<strong>of</strong>iles (Supplementary<br />
Fig. 9) were consistent with a common trajectory consist<strong>in</strong>g <strong>of</strong> an<br />
early period <strong>of</strong> chromosomal <strong>in</strong>stability followed by the emergence<br />
<strong>of</strong> a stable aneuploid clone, as previously described 11 . Our data further<br />
<strong>in</strong>dicate that genome doubl<strong>in</strong>gs occur <strong>in</strong> a subset <strong>of</strong> cancer cells<br />
already harbor<strong>in</strong>g arm-level SCNAs characteristic <strong>of</strong> the correspond<strong>in</strong>g<br />
tumor type. The genomes <strong>of</strong> these cancers were therefore shaped<br />
by selection at chromosomal arm-level resolution before doubl<strong>in</strong>g and<br />
further clonal outgrowth (Fig. 6d and Supplementary Fig. 10).<br />
These f<strong>in</strong>d<strong>in</strong>gs are broadly consistent with an earlier <strong>in</strong>terpretation<br />
<strong>of</strong> primary breast cancer FACS/SKY pr<strong>of</strong>iles 47 , and has recently<br />
been recapitulated <strong>in</strong> studies <strong>of</strong> macro-dissected and ploidy-sorted cell<br />
populations 14 , and s<strong>in</strong>gle-cell sequenc<strong>in</strong>g 15 <strong>of</strong> primary breast tumors.<br />
We note that this model represents a departure from the idea that tetraploidization<br />
is an <strong>in</strong>itiat<strong>in</strong>g event 13,26,48–50 . In addition, the association<br />
<strong>of</strong> genome doubl<strong>in</strong>g with epithelial l<strong>in</strong>eage (Fig. 6c) and with age at<br />
diagnosis <strong>in</strong> ovarian carc<strong>in</strong>oma (Fig. 7d) is consistent with a recently<br />
described mechanism l<strong>in</strong>k<strong>in</strong>g telomere crisis, <strong>DNA</strong> damage response,<br />
and genome doubl<strong>in</strong>g <strong>in</strong> cultured mouse embryonic fibroblasts 49 .<br />
The analysis <strong>of</strong> clonality presented <strong>in</strong> this work <strong>of</strong>fers a path forward<br />
for cl<strong>in</strong>ical sequenc<strong>in</strong>g <strong>of</strong> cancer, and provides the means to<br />
address recently reported concerns regard<strong>in</strong>g <strong>in</strong>tratumor heterogeneity<br />
14,15,45,46,51–53 . Analysis us<strong>in</strong>g ABSOLUTE can identify <strong>alterations</strong><br />
present <strong>in</strong> all cancer cells contribut<strong>in</strong>g to the <strong>DNA</strong> aliquot (Fig. 1),<br />
even if such clonal <strong>alterations</strong> correspond to the m<strong>in</strong>ority <strong>of</strong> observed<br />
mutations. Such <strong>alterations</strong> are candidate found<strong>in</strong>g oncogenic drivers<br />
for a given cancer, which may be the preferred therapeutic targets.<br />
Further characterization <strong>of</strong> subclonal <strong>somatic</strong> <strong>alterations</strong> <strong>in</strong> cancer<br />
may become important for understand<strong>in</strong>g variable response to targeted<br />
therapeutics, with the clonality <strong>of</strong> targeted mutations potentially<br />
affect<strong>in</strong>g response level.<br />
METhODS<br />
Methods and any associated references are available <strong>in</strong> the onl<strong>in</strong>e version<br />
<strong>of</strong> the paper at http://www.nature.com/naturebiotechnology/.<br />
Note: Supplementary <strong>in</strong>formation is available on the <strong>Nature</strong> Biotechnology website.<br />
ACKnOWLEDGMEnTS<br />
This work was supported by grants from the National Cancer Institute as part <strong>of</strong><br />
The Cancer Genome Atlas project: U24CA126546 (M.M.), U24CA143867 (M.M.),<br />
and U24CA143845 (G.G.). S.L.C. and E.H. were supported by tra<strong>in</strong><strong>in</strong>g grant T32<br />
420 VOLUME 30 NUMBER 5 MAY 2012 nature biotechnology<br />
**<br />
NS<br />
Fraction <strong>of</strong> patients<br />
recurrence free<br />
1.0<br />
0.8<br />
0.6<br />
0.4<br />
0.2<br />
0<br />
Time (years)<br />
Figure 7 Genetic and cl<strong>in</strong>ical associations with genome doubl<strong>in</strong>g <strong>in</strong> primary HGS-OvCa samples. (a–c) Number <strong>of</strong> mutations <strong>in</strong> <strong>in</strong>dicated classes as a<br />
function <strong>of</strong> genome doubl<strong>in</strong>gs. Error bars <strong>in</strong>dicate s.e.m. (a–d) P-values were calculated with the two-sided Wilcox<strong>in</strong> rank-sum test. (e) P-values were<br />
calculated us<strong>in</strong>g the log-rank test. Colors correspond to putative genome-doubl<strong>in</strong>g status, as <strong>in</strong>dicated. **, P < 10 −5 ; *, P < 0.05; NS, P > 0.05.<br />
P = 0.0084
npg © 2012 <strong>Nature</strong> America, Inc. All rights reserved.<br />
HG002295 from the National Human Genome Research Institute. In addition,<br />
D.P. was supported by the US National Institutes <strong>of</strong> Health (NIH) - 5R01<br />
GM083299-14; D.A.L. by Department <strong>of</strong> Defense W81XWH-10-1-0222;<br />
T.Z. by NIH/National Institute <strong>of</strong> General Medical Sciences 5 T32 GM008313; R.B.<br />
by NIH K08CA122833 and U54CA143798. B.A.W. was supported by National<br />
Research Service Award grant F32CA113126.<br />
AUTHOR COnTRIBUTIOnS<br />
M.M. posed the concept <strong>of</strong> us<strong>in</strong>g allelic copy number analysis to assess tumor<br />
genomic purity. G.G. and S.L.C. conceived and designed the analysis. S.L.C.<br />
designed and implemented the ABSOLUTE algorithm, and performed data<br />
analysis. K.C. assisted with mutation call<strong>in</strong>g and validation. E.H. performed<br />
analysis with ASCAT and assisted with multiplicity analysis. A.M. assisted with<br />
the determ<strong>in</strong>ation <strong>of</strong> statistical power for the ovarian cancer data. T.Z. assisted<br />
with analysis <strong>of</strong> the SCNA length distribution versus genome doubl<strong>in</strong>g. R.C.O.<br />
and W.W. processed the SNP array experiments. W.W. designed and executed the<br />
<strong>DNA</strong> mix<strong>in</strong>g experiment. H.S. and P.W.L. conceived and executed the leukocyte<br />
methylation signature analysis. B.A.W. contributed <strong>in</strong>sight <strong>in</strong>to allelic analysis<br />
<strong>of</strong> SNP array data. D.A.L. managed the FACS analysis <strong>of</strong> specimens for ploidy<br />
determ<strong>in</strong>ation. All authors contributed to the f<strong>in</strong>al manuscript. D.P. and<br />
R.B. provided critical review <strong>of</strong> the manuscript. S.L.C., M.M., G.G. and E.S.L.<br />
wrote the manuscript. R.B., M.M. and G.G. provided leadership for the project.<br />
COMPETInG FInAnCIAL InTERESTS<br />
The authors declare compet<strong>in</strong>g f<strong>in</strong>ancial <strong>in</strong>terests: details accompany the full-text<br />
HTML version <strong>of</strong> the paper at http://www.nature.com/naturebiotechnology/.<br />
Published onl<strong>in</strong>e at http://www.nature.com/naturebiotechnology/.<br />
Repr<strong>in</strong>ts and permissions <strong>in</strong>formation is available onl<strong>in</strong>e at http://www.nature.com/<br />
repr<strong>in</strong>ts/<strong>in</strong>dex.html.<br />
1. P<strong>in</strong>kel, D. et al. High resolution analysis <strong>of</strong> <strong>DNA</strong> copy number variation us<strong>in</strong>g comparative<br />
genomic hybridization to microarrays. Nat. Genet. 20, 207–211 (1998).<br />
2. Mei, R. et al. Genome-wide detection <strong>of</strong> allelic imbalance us<strong>in</strong>g human SNPs and<br />
high-density <strong>DNA</strong> arrays. Genome Res. 10, 1126–1137 (2000).<br />
3. L<strong>in</strong>dblad-Toh, K. et al. Loss-<strong>of</strong>-heterozygosity analysis <strong>of</strong> small-cell lung carc<strong>in</strong>omas<br />
us<strong>in</strong>g s<strong>in</strong>gle-nucleotide polymorphism arrays. Nat. Biotechnol. 18, 1001–1005<br />
(2000).<br />
4. Zhao, X. et al. An <strong>in</strong>tegrated view <strong>of</strong> copy number and allelic <strong>alterations</strong> <strong>in</strong> the<br />
cancer genome us<strong>in</strong>g s<strong>in</strong>gle nucleotide polymorphism arrays. Cancer Res. 64,<br />
3060–3071 (2004).<br />
5. Bignell, G.R. et al. High-resolution analysis <strong>of</strong> <strong>DNA</strong> copy number us<strong>in</strong>g oligonucleotide<br />
microarrays. Genome Res. 14, 287–295 (2004).<br />
6. Campbell, P.J. et al. Identification <strong>of</strong> <strong>somatic</strong>ally acquired rearrangements <strong>in</strong> cancer<br />
us<strong>in</strong>g genome-wide massively parallel paired-end sequenc<strong>in</strong>g. Nat. Genet. 40,<br />
722–729 (2008).<br />
7. Chiang, D.Y. et al. High-resolution mapp<strong>in</strong>g <strong>of</strong> copy-number <strong>alterations</strong> with<br />
massively parallel sequenc<strong>in</strong>g. Nat. Methods 6, 99–103 (2009).<br />
8. Kallioniemi, A. et al. Comparative genomic hybridization for molecular cytogenetic<br />
analysis <strong>of</strong> solid tumors. Science 258, 818–821 (1992).<br />
9. Boveri, T. J. Cell Sci. 121 (Suppl.1), 1–84 (2008).<br />
10. Mitelman, F. Recurrent chromosome aberrations <strong>in</strong> cancer. Mutat. Res. 462,<br />
247–253 (2000).<br />
11. Albertson, D.G., Coll<strong>in</strong>s, C., McCormick, F. & Gray, J.W. Chromosome aberrations<br />
<strong>in</strong> solid tumors. Nat. Genet. 34, 369–376 (2003).<br />
12. Storchova, Z. & Pellman, D. From polyploidy to aneuploidy, genome <strong>in</strong>stability and<br />
cancer. Nat. Rev. Mol. Cell Biol. 5, 45–54 (2004).<br />
13. Storchova, Z. & Kuffer, C. The consequences <strong>of</strong> tetraploidy and aneuploidy. J. Cell<br />
Sci. 121, 3859–3866 (2008).<br />
14. Nav<strong>in</strong>, N. et al. Inferr<strong>in</strong>g tumor progression from genomic heterogeneity. Genome<br />
Res. 20, 68–80 (2010).<br />
15. Nav<strong>in</strong>, N. et al. Tumour evolution <strong>in</strong>ferred by s<strong>in</strong>gle-cell sequenc<strong>in</strong>g. <strong>Nature</strong> 472,<br />
90–94 (2011).<br />
16. Hicks, J. et al. High-resolution ROMA CGH and FISH analysis <strong>of</strong> aneuploid and<br />
diploid breast tumors. Cold Spr<strong>in</strong>g Harb. Symp. Quant. Biol. 70, 51–63 (2005).<br />
17. Mullighan, C.G. et al. Genome-wide analysis <strong>of</strong> genetic <strong>alterations</strong> <strong>in</strong> acute<br />
lymphoblastic leukaemia. <strong>Nature</strong> 446, 758–764 (2007).<br />
18. Lyng, H. et al. GeneCount: genome-wide calculation <strong>of</strong> absolute tumor <strong>DNA</strong> copy numbers<br />
from array comparative genomic hybridization data. Genome Biol. 9, R86 (2008).<br />
19. Hudson, T.J. et al. International network <strong>of</strong> cancer genome projects. <strong>Nature</strong> 464,<br />
993–998 (2010).<br />
20. Weir, B.A. et al. Characteriz<strong>in</strong>g the cancer genome <strong>in</strong> lung adenocarc<strong>in</strong>oma. <strong>Nature</strong><br />
450, 893–898 (2007).<br />
A n A ly s i s<br />
21. The Cancer Genome Atlas Research Network. Comprehensive genomic characterization<br />
def<strong>in</strong>es human glioblastoma genes and core pathways. <strong>Nature</strong> 455,<br />
1061–1068 (2008).<br />
22. Berger, M.F. et al. The genomic complexity <strong>of</strong> primary human prostate cancer.<br />
<strong>Nature</strong> 470, 214–220 (2011).<br />
23. Stransky, N. et al. The mutational landscape <strong>of</strong> head and neck squamous cell<br />
carc<strong>in</strong>oma. Science 333, 1157–1160 (2011).<br />
24. Bass, A.J. et al. Genomic sequenc<strong>in</strong>g <strong>of</strong> colorectal adenocarc<strong>in</strong>omas identifies a<br />
recurrent VTI1A–TCF7L2 fusion. Nat. Genet. 43, 964–968 (2011).<br />
25. Fujiwara, T. et al. Cytok<strong>in</strong>esis failure generat<strong>in</strong>g tetraploids promotes tumorigenesis<br />
<strong>in</strong> p53-null cells. <strong>Nature</strong> 437, 1043–1047 (2005).<br />
26. Holland, A.J. & Cleveland, D.W. Boveri revisited: chromosomal <strong>in</strong>stability, aneuploidy<br />
and tumorigenesis. Nat. Rev. Mol. Cell Biol. 10, 478–487 (2009).<br />
27. Pleasance, E.D. et al. A comprehensive catalogue <strong>of</strong> <strong>somatic</strong> mutations from a<br />
human cancer genome. <strong>Nature</strong> 463, 191–196 (2010).<br />
28. Attiyeh, E.F. et al. Genomic copy number determ<strong>in</strong>ation <strong>in</strong> cancer cells from s<strong>in</strong>gle<br />
nucleotide polymorphism microarrays based on quantitative genotyp<strong>in</strong>g corrected<br />
for aneuploidy. Genome Res. 19, 276–283 (2009).<br />
29. Popova, T. et al. Genome Alteration Pr<strong>in</strong>t (GAP): a tool to visualize and m<strong>in</strong>e complex<br />
cancer genomic pr<strong>of</strong>iles obta<strong>in</strong>ed by SNP arrays. Genome Biol. 10, R128<br />
(2009).<br />
30. Greenman, C.D. et al. PICNIC: an algorithm to predict absolute allelic copy number<br />
variation with microarray cancer data. Biostatistics 11, 164–175 (2010).<br />
31. Van Loo, P. et al. Allele-specific copy number analysis <strong>of</strong> tumors. Proc. Natl. Acad.<br />
Sci. USA 107, 16910–16915 (2010).<br />
32. Yau, C. et al. A statistical approach for detect<strong>in</strong>g genomic aberrations <strong>in</strong><br />
heterogeneous tumor samples from s<strong>in</strong>gle nucleotide polymorphism genotyp<strong>in</strong>g data.<br />
Genome Biol. 11, R92 (2010).<br />
33. Li, A. et al. GPHMM: an <strong>in</strong>tegrated hidden Markov model for identification <strong>of</strong> copy<br />
number alteration and loss <strong>of</strong> heterozygosity <strong>in</strong> complex tumor samples us<strong>in</strong>g whole<br />
genome SNP arrays. Nucleic Acids Res. 39, 4928–4941 (2011).<br />
34. The Cancer Genome Atlas Research Network. Integrated genomic analyses <strong>of</strong> ovarian<br />
carc<strong>in</strong>oma. <strong>Nature</strong> 474, 609–615 (2011).<br />
35. Roschke, A.V. et al. Karyotypic complexity <strong>of</strong> the NCI-60 drug-screen<strong>in</strong>g panel.<br />
Cancer Res. 63, 8634–8647 (2003).<br />
36. Beroukhim, R. et al. The landscape <strong>of</strong> <strong>somatic</strong> copy-number alteration across human<br />
cancers. <strong>Nature</strong> 463, 899–905 (2010).<br />
37. Gnirke, A. et al. Solution hybrid selection with ultra-long oligonucleotides for<br />
massively parallel targeted sequenc<strong>in</strong>g. Nat. Biotechnol. 27, 182–189<br />
(2009).<br />
38. Levanon, K., Crum, C. & Drapk<strong>in</strong>, R. New <strong>in</strong>sights <strong>in</strong>to the pathogenesis <strong>of</strong><br />
serous ovarian cancer and its cl<strong>in</strong>ical impact. J. Cl<strong>in</strong>. Oncol. 26, 5284–5293<br />
(2008).<br />
39. Galipeau, P.C. et al. 17p (p53) allelic losses, 4N (G2/tetraploid) populations, and<br />
progression to aneuploidy <strong>in</strong> Barrett’s esophagus. Proc. Natl. Acad. Sci. USA 93,<br />
7081–7084 (1996).<br />
40. Barrett, M.T. et al. Evolution <strong>of</strong> neoplastic cell l<strong>in</strong>eages <strong>in</strong> Barrett oesophagus.<br />
Nat. Genet. 22, 106–109 (1999).<br />
41. Mermel, C.H. et al. GISTIC2.0 facilitates sensitive and confident localization <strong>of</strong> the<br />
targets <strong>of</strong> focal <strong>somatic</strong> copy-number alteration <strong>in</strong> human cancers. Genome Biol.<br />
12, R41 (2011).<br />
42. Fudenberg, G., Getz, G., Meyerson, M. & Mirny, L.A. High order chromat<strong>in</strong><br />
architecture shapes the landscape <strong>of</strong> chromosomal <strong>alterations</strong> <strong>in</strong> cancer. Nat.<br />
Biotechnol. 29, 1109–1113 (2011).<br />
43. Ganem, N.J., God<strong>in</strong>ho, S.A. & Pellman, D. A mechanism l<strong>in</strong>k<strong>in</strong>g extra centrosomes<br />
to chromosomal <strong>in</strong>stability. <strong>Nature</strong> 460, 278–282 (2009).<br />
44. Campbell, P.J. et al. Subclonal phylogenetic structures <strong>in</strong> cancer revealed by ultradeep<br />
sequenc<strong>in</strong>g. Proc. Natl. Acad. Sci. USA 105, 13081–13086 (2008).<br />
45. Yachida, S. et al. Distant metastasis occurs late dur<strong>in</strong>g the genetic evolution <strong>of</strong><br />
pancreatic cancer. <strong>Nature</strong> 467, 1114–1117 (2010).<br />
46. D<strong>in</strong>g, L. et al. Clonal evolution <strong>in</strong> relapsed acute myeloid leukaemia revealed by<br />
whole-genome sequenc<strong>in</strong>g. <strong>Nature</strong> 481, 506–510 (2012).<br />
47. Dutrillaux, B., Gerbault-Seureau, M., Remvikos, Y., Zafrani, B. & Prieur, M. Breast<br />
cancer genetic evolution: I. Data from cytogenetics and <strong>DNA</strong> content. Breast Cancer<br />
Res. Treat. 19, 245–255 (1991).<br />
48. Ganem, N.J., Storchova, Z. & Pellman, D. Tetraploidy, aneuploidy and cancer. Curr.<br />
Op<strong>in</strong>. Genet. Dev. 17, 157–162 (2007).<br />
49. Davoli, T., Denchi, E.L. & de Lange, T. Persistent telomere damage <strong>in</strong>duces bypass<br />
<strong>of</strong> mitosis and tetraploidy. Cell 141, 81–93 (2010).<br />
50. Bazeley, P.S. et al. A model for random genetic damage direct<strong>in</strong>g selection <strong>of</strong> diploid<br />
or aneuploid tumours. Cell Prolif. 44, 212–223 (2011).<br />
51. Liu, W. et al. Copy number analysis <strong>in</strong>dicates monoclonal orig<strong>in</strong> <strong>of</strong> lethal metastatic<br />
prostate cancer. Nat. Med. 15, 559–565 (2009).<br />
52. Walter, M.J. et al. Clonal architecture <strong>of</strong> secondary acute myeloid leukemia.<br />
N. Engl. J. Med. 366, 1090–1098 (2012).<br />
53. Gerl<strong>in</strong>ger, M. et al. Intratumor heterogeneity and branched evolution revealed by<br />
multiregion sequenc<strong>in</strong>g. N. Engl. J. Med. 366, 883–892 (2012).<br />
nature biotechnology VOLUME 30 NUMBER 5 MAY 2012 421
npg © 2012 <strong>Nature</strong> America, Inc. All rights reserved.<br />
ONLINE METhODS<br />
Inference <strong>of</strong> purity, ploidy, and absolute <strong>somatic</strong> copy-numbers. Homologuespecific<br />
copy ratios (HSCRs; copy-ratio estimates <strong>of</strong> both homologous chromosomes)<br />
are preferred for analysis with ABSOLUTE, and were used for all analyses<br />
<strong>in</strong> this study. Although ABSOLUTE can be run on total copy-ratio data (e.g. from<br />
array CGH or low-pass sequenc<strong>in</strong>g data), we do not present such results here. The<br />
use <strong>of</strong> HSCRs reduces the ambiguity <strong>of</strong> copy pr<strong>of</strong>iles. For example, the total copyratio<br />
pr<strong>of</strong>ile <strong>of</strong> a sample without SCNAs would be equivalent for ploidy values <strong>of</strong><br />
1,2,3, etc., however the HSCR pr<strong>of</strong>ile would rule out odd ploidy values, s<strong>in</strong>ce these<br />
would not be consistent with equal homologous copy-numbers. In addition, s<strong>in</strong>ce<br />
subclonal SCNAs will generally affect only one <strong>of</strong> the two HSCR values <strong>in</strong> a given<br />
genomic segment, the ratio <strong>of</strong> clonal to subclonal SCNAs genome-wide is generally<br />
higher when consider<strong>in</strong>g HSCRs rather than only total copy-numbers.<br />
HSCRs were derived from segmental estimates <strong>of</strong> phased multipo<strong>in</strong>t allelic<br />
copy-ratios at heterozygous loci us<strong>in</strong>g the program HAPSEG 54 on data from<br />
Affymetrix SNP arrays. As part <strong>of</strong> this procedure, haplotype panels from population<br />
l<strong>in</strong>kage analysis (HAPMAP3) 55 were used <strong>in</strong> conjunction with statistical phas<strong>in</strong>g<br />
s<strong>of</strong>tware (BEAGLE) 56 <strong>in</strong> order to estimate the phased germl<strong>in</strong>e genotypes at<br />
SNP markers <strong>in</strong> each cancer sample. This <strong>in</strong>creased our sensitivity for resolv<strong>in</strong>g<br />
genotypes, s<strong>in</strong>ce it naturally exploited the local statistical dependencies between<br />
SNPs 54 . In addition, this allowed greater resolution <strong>of</strong> small differences between<br />
homologous copy-ratios, s<strong>in</strong>ce phase <strong>in</strong>formation from allelic imbalance <strong>of</strong> heterozygous<br />
markers due to SCNA could be comb<strong>in</strong>ed with the statistical phas<strong>in</strong>g<br />
from the haplotype panels 54 .<br />
Identification and evaluation <strong>of</strong> candidate tumor purity and ploidy values.<br />
We describe identification <strong>of</strong> candidate tumor purity and ploidy values and<br />
calculation <strong>of</strong> their SCNA-fit log-likelihood scores us<strong>in</strong>g a probabilistic model.<br />
This is accomplished by fitt<strong>in</strong>g the <strong>in</strong>put HSCR estimates with a Gaussian<br />
mixture model, with components centered at the discrete concentrationratios<br />
implied by equation (1). The model also supports a moderate fraction<br />
<strong>of</strong> subclonal events which are not restricted to the discrete levels. Candidate<br />
solutions are identified by search<strong>in</strong>g for local optima <strong>of</strong> this likelihood over<br />
a large range <strong>of</strong> purity and ploidy values. This results <strong>in</strong> a discrete set <strong>of</strong><br />
candidate solutions with correspond<strong>in</strong>g SCNA-fit likelihoods (equation (1),<br />
Fig. 1e–g, Supplementary Fig. 1c–e).<br />
The SCNA-fit scores quantify the evidence for each solution contributed by<br />
explanation <strong>of</strong> the observed HSCRs as <strong>in</strong>teger SCNAs. These computations are<br />
<strong>in</strong>dependent for each sample. The <strong>in</strong>put data consist <strong>of</strong> N HSCRs xi , i ∈{1,…, N}.<br />
Each <strong>of</strong> these is observed with standard error σi , and corresponds to a genomic<br />
fraction denoted wi . Each <strong>of</strong> the xi is assumed to have arisen from either one<br />
<strong>of</strong> Q <strong>in</strong>teger copy-number states: Q = {0,1,…,Q − 1}, or an additional state Z<br />
correspond<strong>in</strong>g to subclonal copy-number. We refer to the collection <strong>of</strong> possible<br />
copy-states as S = Q < Z. We def<strong>in</strong>e Q + 1 <strong>in</strong>dicators s for the copy-state <strong>of</strong><br />
each segment, with p(si ) represent<strong>in</strong>g the probability <strong>of</strong> segment i hav<strong>in</strong>g been<br />
generated from state s∈S. The <strong>in</strong>teger copy-states <strong>of</strong> S are <strong>in</strong>dexed by q ∈Q; the<br />
non-<strong>in</strong>teger state is denoted by z.<br />
The expected copy-ratio correspond<strong>in</strong>g to each <strong>in</strong>teger copy-number q(x)<br />
<strong>in</strong> a tumor sample is given by equation (1). Note that when homologous copyratios<br />
are used, this equation becomes:<br />
a<br />
a<br />
mq<br />
= q x<br />
D D<br />
⎡ ⎤ ⎡2(<br />
1 − ) ⎤<br />
2 ( ) +<br />
⎣⎢ ⎦⎥ ⎢ ⎥<br />
(3)<br />
⎣ ⎦<br />
s<strong>in</strong>ce HSCRs are measured relative to haploid concentrations, as opposed to<br />
the diploid values assumed by equation 1. D is related to tumor purity and<br />
ploidy (α and τ) (equation (1), Fig. 1). The observed xi are modeled with a<br />
mixture <strong>of</strong> Q Gaussian components located at µ = {µ q ∈Q } represent<strong>in</strong>g <strong>in</strong>teger<br />
copy-states Q and an additional uniform component Z. The mixture Z allows<br />
segments to be assigned non-<strong>in</strong>teger copy values so that subclonal <strong>alterations</strong><br />
or artifacts do not dramatically impact the likelihood.<br />
si ~ Mult<strong>in</strong>om(<br />
p( si | wi,<br />
q))<br />
⎧mq<br />
+ Œi<br />
if si ∈Q<br />
xi<br />
= ⎨<br />
⎩u<br />
if si = Z<br />
2 2<br />
Œi ~ N ( 0,<br />
si<br />
+ sH )<br />
u ~ U(<br />
d)<br />
(4)<br />
N and U denote the normal and uniform densities, respectively. The free parameter<br />
σ H represents sample-level noise <strong>in</strong> excess <strong>of</strong> the HSCR standard-error<br />
σ i , which might represent a moderate number <strong>of</strong> related clones <strong>in</strong> the malignant<br />
cell population, ongo<strong>in</strong>g genomic <strong>in</strong>stability, or excessive noise due to variable<br />
experimental conditions. The mixture weights θ = {θ s∈S } specify the expected<br />
genomic fraction allocated to each copy-state. The parameter d represents the<br />
doma<strong>in</strong> <strong>of</strong> the uniform density, correspond<strong>in</strong>g to the range <strong>of</strong> plausible copy-ratio<br />
values (we used d = 7).<br />
Some complication arises due to the fact that the data consist <strong>of</strong> copy-ratios<br />
calculated from a segmentation <strong>of</strong> the genome. For consistent <strong>in</strong>terpretation,<br />
the mixture weights P(s i |w i , θ) must be calculated for each segment separately,<br />
tak<strong>in</strong>g <strong>in</strong>to account the variable genomic fraction w i . This is accomplished by<br />
constra<strong>in</strong><strong>in</strong>g the canonical averages <strong>of</strong> genomic mass allocated to each copystate<br />
to match those specified by θ:<br />
N<br />
∀ s∈S , ∑ siwi = qs<br />
i = 1<br />
C<br />
where 〈⋅〉 C denotes the average over all configurations {si }, weighted by the<br />
function C = P(si |wi , λ). This density corresponds to the maximum entropy<br />
distribution over s subject to these constra<strong>in</strong>ts:<br />
e s<br />
P si wi<br />
s wi k S e kk w −l<br />
#<br />
( | , l)<br />
=<br />
l #<br />
∈ i − ∑<br />
where s # <strong>in</strong>dicates the order <strong>of</strong> state s <strong>in</strong> a sequence <strong>of</strong> copy-states, beg<strong>in</strong>n<strong>in</strong>g<br />
with 0. Values <strong>of</strong> the Q Lagrange multipliers λ are determ<strong>in</strong>ed via Nelder-Mead<br />
optimization <strong>of</strong> L2 loss:<br />
l = l ⎡<br />
⎣ l ⎤<br />
⎦ q −<br />
1<br />
⎛ ⎡<br />
2<br />
⎛<br />
⎞ ⎤⎞<br />
2<br />
N<br />
⎜ ⎢<br />
⎢<br />
⎜<br />
⎟<br />
⎥⎟<br />
argm<strong>in</strong> ⎜ ∑ ∑ wiP( si | wi,<br />
) s<br />
⎢<br />
⎜<br />
⎟<br />
⎥⎟<br />
⎜ s∈S ⎝ ⎝i<br />
= 1<br />
⎠ ⎥<br />
⎣<br />
⎦⎠<br />
⎟<br />
This approximation allows for robustness <strong>of</strong> the SCNA-fit score to over-segmentation<br />
<strong>of</strong> the data. The likelihood <strong>of</strong> a given segment i is then calculated as:<br />
2 2<br />
L( xi | m, si , sH , q, wi) = [ P( qi | wi, l) N ( xi | mq, si + sH<br />
)] + P( zi | wi,<br />
l) U(<br />
d)<br />
q∈Q nature biotechnology doi:10.1038/nbt.2203<br />
∑<br />
and the full log-likelihood <strong>of</strong> the data is then:<br />
N<br />
∑ log L(<br />
xi | m, si , sH , q,<br />
wi)<br />
i = 1<br />
We def<strong>in</strong>e the parameterization<br />
a<br />
b = 2( 1 − a),<br />
δτ =<br />
D<br />
(5)<br />
which determ<strong>in</strong>es µ via equation (3). Candidate purity and ploidy solutions for<br />
a tumor sample are identified by optimization <strong>of</strong> equation (5) with respect to b<br />
and δτ . Calculation <strong>of</strong> equation (5) requires estimates <strong>of</strong> θ and σH , which are not<br />
known a priori. We make an approximation (scale-separation) assum<strong>in</strong>g that locations<br />
<strong>of</strong> the modes <strong>of</strong> equation (5) are <strong>in</strong>variant to moderate fluctuations <strong>in</strong> these<br />
parameters. A provisional likelihood for each xi may then be calculated by<br />
2 2<br />
LP ( xi | m, si , s) = ∑ [ N ( xi | mq, si + s )] + U(<br />
d)<br />
q∈Q Candidate purity and ploidy solutions are then identified by optimization <strong>of</strong><br />
N<br />
∑ log LP ( xi | m, si , sP<br />
)<br />
i = 1<br />
<strong>in</strong>itiated from all po<strong>in</strong>ts <strong>in</strong> a regular lattice spann<strong>in</strong>g the doma<strong>in</strong> <strong>of</strong> b and δ τ .<br />
The parameter σ P was set to 0.01 for this study. We verified that the above<br />
approximation identified modes equivalent to those obta<strong>in</strong>ed through a full<br />
Metropolis-Hast<strong>in</strong>gs Markov cha<strong>in</strong> Monte Carlo (MCMC) simulation (data not<br />
shown). The approximation allows for much simpler computations to be used.
npg © 2012 <strong>Nature</strong> America, Inc. All rights reserved.<br />
The SCNA-fit score for each solution is calculated after optimization <strong>of</strong> σH :<br />
N<br />
sˆ H = argmax ∑ log L(<br />
xi | mˆ , si , sH<br />
, q,<br />
wi)<br />
sH<br />
i = 1<br />
with the elements <strong>of</strong> θ calculated for each value <strong>of</strong> σH by:<br />
N<br />
2 2<br />
N ( xi<br />
| mˆ q, si + s N<br />
H<br />
qˆ<br />
)<br />
U d<br />
q = ∑ wi<br />
; qˆ<br />
( )<br />
z = wi<br />
m s s<br />
i P ( xi<br />
i H )<br />
∑<br />
L | ˆ, ,<br />
L<br />
i P x<br />
= 1<br />
= 1 i | mˆ , si , sH<br />
doi:10.1038/nbt.2203<br />
( )<br />
The f<strong>in</strong>al calculation <strong>of</strong> the SCNA-fit log-likelihood for each mode is obta<strong>in</strong>ed<br />
by <strong>in</strong>sert<strong>in</strong>g m^, u ^ and σˆ H <strong>in</strong>to equation (5). Estimates <strong>of</strong> the copy-state <strong>in</strong>dicators<br />
for each segment are calculated as:<br />
( )<br />
N xi<br />
| mˆ 2<br />
q, si + sˆ<br />
2<br />
H<br />
qˆ i = P ( qi | wi,<br />
l)<br />
L xi | mˆ , si , sˆ H , qˆ<br />
, wi<br />
( )<br />
zˆ i = P zi | wi,<br />
l<br />
L<br />
( )<br />
U(<br />
d)<br />
( xi | mˆ , si , sˆ H , qˆ<br />
, wi<br />
)<br />
Note that each qˆ i is a vector represent<strong>in</strong>g the posterior probability <strong>of</strong> each<br />
Q ∈ Q <strong>in</strong>teger copy-states, correspond<strong>in</strong>g to the copy-ratios (locations) µ.<br />
Genome-wide absolute copy-pr<strong>of</strong>iles are over-determ<strong>in</strong>ed with respect to<br />
<strong>DNA</strong> ploidy estimates. An alternate estimate <strong>of</strong> ploidy may be calculated as<br />
the expected absolute copy-number over the genome:<br />
N ⎛ Q −1<br />
⎞<br />
tˆ g = ∑ ⎜wi<br />
∑ qqˆ<br />
iq<br />
⎟<br />
⎜ ⎟<br />
i = 1⎝ q = 0 ⎠<br />
By def<strong>in</strong>ition, this quantity (τˆ g) is an alternate estimate <strong>of</strong> cancer ploidy (note<br />
an additional factor <strong>of</strong> 2 is added when HSCRs are used). Because τˆ g is a<br />
weighted average over discrete states <strong>in</strong> the modeled data, it is expected to be<br />
more robust to experimental fluctuations that shift or scale the copy-pr<strong>of</strong>ile<br />
slightly. Note that, for this computation, the ˆq ij were calculated with qz ˆ = 0,<br />
so that the above expectation is over <strong>in</strong>teger states only.<br />
We verified that these estimates were generally close to the values <strong>of</strong><br />
τˆ obta<strong>in</strong>ed by optimization <strong>of</strong> the SCNA-fit likelihood (RMSE = 0.26,<br />
Supplementary Fig. 11a). However, we noted a relationship between the level<br />
<strong>of</strong> discordance between ploidy estimators and the mean <strong>of</strong> the calibrated data<br />
(Supplementary Fig. 11b). Not<strong>in</strong>g that correctly calibrated copy-ratio data<br />
always has mean = 1, we exam<strong>in</strong>ed whether the miscalibration was due to scal<strong>in</strong>g<br />
bias <strong>in</strong> the data. We found that this model expla<strong>in</strong>ed nearly two thirds <strong>of</strong> the<br />
discordance between the two estimates (corrected RMSE = 0.09, Supplementary<br />
Fig. 11c), by which we <strong>in</strong>ferred that scal<strong>in</strong>g biases dom<strong>in</strong>ated our miscalibration.<br />
This is significant, as such biases do not effect the estimation <strong>of</strong> tumor<br />
purity (Supplementary Fig. 11).<br />
Two additional transformations <strong>of</strong> the copy-state locations µ are used when<br />
copy-ratios are measured us<strong>in</strong>g microarrays. The first <strong>of</strong> these accounts for the<br />
effect <strong>of</strong> attenuation with an isothermal adsorbtion model7 :<br />
x(<br />
1 + fˆ<br />
)<br />
g( x)<br />
=<br />
( 1 + xfˆ<br />
)<br />
where the value ˆ f parameterizes the attenuation response <strong>in</strong> a given sample,<br />
and is estimated via HAPSEG. The second transformation is a variance stabilization<br />
for microarray data adapted from57 :<br />
⎛ s<br />
2<br />
xe<br />
h ⎞<br />
−<br />
h( x)<br />
= arcs<strong>in</strong> ⎜ 1<br />
h ⎟<br />
⎜ ⎟<br />
⎝<br />
⎜ sŒ<br />
⎠<br />
⎟<br />
where σ η and σ ∈ represent multiplicative and additive noise scales for each<br />
microarray, estimated by HAPSEG. This transformation is applied to the<br />
marker-level data dur<strong>in</strong>g estimation <strong>of</strong> the x i values, after which their distribution<br />
is approximately normal. The normal mixture component specified <strong>in</strong><br />
(6)<br />
(7)<br />
(4) then becomes h( xi) = h( g(<br />
mq)) + Πi,<br />
and the correspond<strong>in</strong>g likelihood<br />
calculations are performed under these transformations.<br />
Karyotype models. Additional <strong>in</strong>formation is generally required <strong>in</strong> order to<br />
reliably select the correct tumor purity and ploidy solution from the set <strong>of</strong><br />
candidates identified by fitt<strong>in</strong>g the model <strong>in</strong> (4). In a given tumor sample,<br />
several comb<strong>in</strong>ations <strong>of</strong> theoretically possible purity, ploidy, and copy number<br />
values may map to equivalent copy ratios (Fig. 1e–g, Supplementary Fig. 1).<br />
Furthermore, the presence <strong>of</strong> subclonal SCNAs may result <strong>in</strong> a spuriously high<br />
ploidy solution with an implausible karyotype receiv<strong>in</strong>g a greater SCNA-fit<br />
likelihood by over-discretiz<strong>in</strong>g the copy pr<strong>of</strong>ile, allow<strong>in</strong>g their assignment to<br />
<strong>in</strong>teger copy-levels (Supplementary Fig. 1c–e).<br />
ABSOLUTE models common cancer karyotypes by group<strong>in</strong>g tumor sets<br />
accord<strong>in</strong>g to similarities <strong>in</strong> their absolute homologous copy-number pr<strong>of</strong>iles<br />
(Supplementary Fig. 2). These models are constructed directly from the tumor<br />
data <strong>in</strong> a ’boot-strapp<strong>in</strong>g’ fashion, whereby a subset <strong>of</strong> tumors with relatively<br />
unambiguous pr<strong>of</strong>iles (e.g., due to high purity values) is used <strong>in</strong>itialize the<br />
models, iteratively allow<strong>in</strong>g more tumors to be called, etc. Previous cytogenetic<br />
characterizations <strong>of</strong> human cancer were used to guide this process 13 . These<br />
models enable calculation <strong>of</strong> a karyotype likelihood, for each candidate purity/<br />
ploidy solution, reflect<strong>in</strong>g the similarity <strong>of</strong> the correspond<strong>in</strong>g karyotype to<br />
models associated with the specified disease <strong>of</strong> the <strong>in</strong>put tumor sample (8).<br />
Integration <strong>of</strong> the SCNA-fit and karyotype likelihoods favors robust and unambiguous<br />
identification <strong>of</strong> the correct purity and ploidy values <strong>in</strong> many tumor<br />
samples ( Fig. 1g, Supplementary Fig. 1e).The selection <strong>of</strong> a solution imply<strong>in</strong>g<br />
a less common karyotype requires greater evidence from the SCNA-fit <strong>of</strong><br />
the copy pr<strong>of</strong>ile.<br />
Prior knowledge <strong>of</strong> karyotypes characteristic <strong>of</strong> a particular disease is<br />
summarized as a mixture <strong>of</strong> K multivariate mult<strong>in</strong>omial distributions over<br />
the <strong>in</strong>teger homologous copy-states Q = [0,7] <strong>of</strong> each chromosome arm. For<br />
a given candidate purity and ploidy solution, the correspond<strong>in</strong>g segmental<br />
copy-state <strong>in</strong>dicators for each segment i, ˆq ij , are summarized <strong>in</strong>to estimates <strong>of</strong><br />
the J arm-level homologous copy-numbers, denoted C ^ . The karyotype log-<br />
likelihood score is calculated as:<br />
L K<br />
K J<br />
jq<br />
C K wi<br />
Kijq i j q<br />
C<br />
⎡<br />
ˆ ⎤<br />
ˆ|<br />
log ⎢<br />
⎥<br />
∑ ⎢ ∏ ∏ ⎥<br />
= 1⎣ = 1 ∈Q<br />
⎦<br />
( ) =<br />
(8)<br />
where wi denotes the weight <strong>of</strong> each mixture component. The karyotype models<br />
Ki are J × Q SCNA probability matrices obta<strong>in</strong>ed by cluster<strong>in</strong>g arm-level<br />
homologous copy-states <strong>of</strong> modeled copy-pr<strong>of</strong>iles us<strong>in</strong>g the standard expectation-maximization<br />
(EM) algorithm58 for mult<strong>in</strong>omial mixtures. This calculation<br />
identifies groups <strong>of</strong> disease subtypes with similar genomic copy pr<strong>of</strong>iles<br />
(Supplementary Fig. 2). Note that copy-states for both homologues <strong>of</strong> each<br />
arm are modeled (J = 78). Karyotype scores for samples with only total copyratio<br />
data are calculated us<strong>in</strong>g convolution <strong>of</strong> the mult<strong>in</strong>omial probabilities<br />
for the two homologous chromosomes.<br />
The number <strong>of</strong> clusters K for each disease was chosen by m<strong>in</strong>imiz<strong>in</strong>g the<br />
Bayesian <strong>in</strong>formation criterion (BIC) complexity penalty: − 2Lˆ k + KJ log ( N)<br />
,<br />
where Lˆ k <strong>in</strong>dicates the sum <strong>of</strong> LK values over the N <strong>in</strong>put samples, computed<br />
us<strong>in</strong>g K clusters. In order to avoid local m<strong>in</strong>ima, the EM algorithm was run<br />
25 times for each value <strong>of</strong> K ∈ [2,8] with randomized start<strong>in</strong>g po<strong>in</strong>ts and the<br />
best model was reta<strong>in</strong>ed.<br />
The models were constructed <strong>in</strong> a semi-automated fashion by seed<strong>in</strong>g<br />
with relatively unambiguous copy-pr<strong>of</strong>iles. As tumors were added, the use <strong>of</strong><br />
recurrent karyotypes clearly identified the correct solutions <strong>of</strong> additional<br />
samples, etc. For example, LOH <strong>of</strong> chr17 occurs <strong>in</strong> nearly 100% <strong>of</strong> ovarian carc<strong>in</strong>oma<br />
samples34 , allow<strong>in</strong>g the model to learn that solutions imply<strong>in</strong>g LOH<br />
<strong>of</strong> chr17 are likely to be correct. In total, models for 14 disease types were<br />
created. Diseases with fewer than 40 samples called by ABSOLUTE were omitted<br />
nature biotechnology
npg © 2012 <strong>Nature</strong> America, Inc. All rights reserved.<br />
from this procedure. In addition, a “master” model was created by comb<strong>in</strong><strong>in</strong>g<br />
called primary cancer pr<strong>of</strong>iles. This model was used for diseases with no specific<br />
karyotype model.<br />
Limitations <strong>of</strong> jo<strong>in</strong>t purity/ploidy <strong>in</strong>ference from copy-pr<strong>of</strong>ile data.<br />
Accurate calibration <strong>of</strong> both the SCNA-fit and karyotype models to the true<br />
level <strong>of</strong> certa<strong>in</strong>ty implied by the data would allow for assignment <strong>of</strong> probabilities<br />
to each candidate solution; we do not believe that the models we<br />
have presented here sufficiently capture the complexity <strong>of</strong> cancer genomes<br />
to allow for such <strong>in</strong>terpretations. Even with manual review, analysis with<br />
ABSOLUTE may occasionally result <strong>in</strong> <strong>in</strong>correct <strong>in</strong>terpretations, for example<br />
genome-doubl<strong>in</strong>g without subsequent detectable ga<strong>in</strong>s or losses would<br />
result <strong>in</strong> a solution imply<strong>in</strong>g half the true ploidy value, which <strong>in</strong> some cases<br />
may correspond to a plausible karyotype model. Alternately, when multiple<br />
subclonal SCNAs appear close to the midpo<strong>in</strong>ts between adjacent clonal<br />
peaks, a solution imply<strong>in</strong>g twice the true ploidy may be chosen. We note<br />
that samples with no reliably detected SCNAs could not be called <strong>in</strong> our<br />
framework (ploidy 2n or 4n; purity undeterm<strong>in</strong>ed). Such samples were<br />
therefore excluded from downstream analysis (see below). Estimation <strong>of</strong><br />
<strong>in</strong>ference error-rate requires <strong>in</strong>dependent measurement <strong>of</strong> sample ploidy.<br />
Further validation experiments <strong>in</strong> diverse tumor types will help to clarify<br />
any disease specific caveats.<br />
We note that the use <strong>of</strong> <strong>somatic</strong> mutation allelic-fractions, comb<strong>in</strong>ed with<br />
the SCNA copy-ratios, generally allows for <strong>in</strong>creased sensitivity for samples<br />
with few SCNAs. In addition, the mutation data helps dist<strong>in</strong>guish genomedoubl<strong>in</strong>g<br />
ambiguity <strong>in</strong> purity/ploidy estimation, although it does not <strong>in</strong>form<br />
ambiguities <strong>of</strong> the type b′ = b + 2(1–α)/D (Fig. 1f, Supplementary Fig. 1d,<br />
equation (1)). Thus, comb<strong>in</strong>ed analysis generally facilitates obta<strong>in</strong><strong>in</strong>g higher<br />
call-rates us<strong>in</strong>g ABSOLUTE (not shown).<br />
Fortunately, many samples <strong>in</strong> our pan-cancer SNP array dataset were consistent<br />
with frequent SCNA both before and after genome doubl<strong>in</strong>g, enabl<strong>in</strong>g<br />
unambiguous <strong>in</strong>ference for many samples without use <strong>of</strong> <strong>somatic</strong> po<strong>in</strong>t-<br />
mutation data. This aspect <strong>of</strong> cancer genome evolution was noted previously <strong>in</strong><br />
breast cancer cytogenetic data 47 . We note that manual review <strong>of</strong> ABSOLUTE<br />
results was performed prior to generation <strong>of</strong> the FACS validation data or analysis<br />
<strong>of</strong> the NCI60 cell-l<strong>in</strong>e ploidy estimates (Fig. 2a,b).<br />
Identification <strong>of</strong> samples refractory to purity/ploidy <strong>in</strong>ference. In order to<br />
facilitate rapid analysis <strong>of</strong> many cancer samples used <strong>in</strong> this study, ABSOLUTE<br />
was programed to automatically identify copy pr<strong>of</strong>iles that cannot be reliably<br />
called and to classify them <strong>in</strong>to <strong>in</strong>formative failure categories (Fig. 3a),<br />
which were def<strong>in</strong>ed by the follow<strong>in</strong>g criteria. Def<strong>in</strong>e mˆ as the sorted vector<br />
<strong>of</strong> posterior genome-wide copy-state allocations ( q) ˆ , so that mˆ 1 represents<br />
the greatest element <strong>of</strong> qˆ (the modal copy-state). This vector was constructed<br />
with θ0 replaced by 0 if θ0 0. 2.<br />
These criteria were applied to the top-ranked mode for each sample (comb<strong>in</strong>ed<br />
SCNA-fit and karyotype scores). Several examples <strong>of</strong> each outcome are shown<br />
<strong>in</strong> Supplementary Figure 5. The above designations led to reasonably good<br />
concordance <strong>of</strong> automated calls with those obta<strong>in</strong>ed after manual review. We<br />
note that the use <strong>of</strong> <strong>somatic</strong> po<strong>in</strong>t-mutation data <strong>in</strong>creases the call<strong>in</strong>g sensitivity<br />
with<strong>in</strong> these sample categories.<br />
Cancer cell-l<strong>in</strong>e <strong>DNA</strong> mix<strong>in</strong>g experiment. <strong>DNA</strong> extracted from two cancer<br />
cell l<strong>in</strong>es (HCC38, HCC1143) was mixed with <strong>DNA</strong> from matched<br />
B-lymphocyte cell l<strong>in</strong>es (HCC38BL, HCC1143BL) <strong>in</strong> various proportions, and<br />
hybridized to Affymetrix 250 K Sty SNP arrays. Stock <strong>DNA</strong> aliquots were<br />
created for each cell-l<strong>in</strong>e by normalization <strong>of</strong> <strong>DNA</strong> concentration to 50 ng/µl.<br />
Mix<strong>in</strong>g <strong>of</strong> cancer and matched B-lymphocyte <strong>DNA</strong> to each required mix<strong>in</strong>g<br />
fraction was done by volume.<br />
FACS analysis <strong>of</strong> primary tumor samples. Formal<strong>in</strong>-fixed and paraff<strong>in</strong>embedded<br />
blocks from ovarian serous carc<strong>in</strong>oma cases were available from<br />
tumor-sections correspond<strong>in</strong>g to the frozen blocks from which <strong>DNA</strong>-aliquots<br />
were obta<strong>in</strong>ed for SNP-array hybridization. Multiple curls conta<strong>in</strong><strong>in</strong>g at least<br />
70% tumor cell nuclei were cut to an aggregate thickness <strong>of</strong> 150 µm. Sections<br />
were disaggregated and labeled with propidium iodide (<strong>DNA</strong> sta<strong>in</strong>). FACS was<br />
performed to determ<strong>in</strong>e ploidy.<br />
Determ<strong>in</strong>ation <strong>of</strong> tumor purity via pathology review. Frozen ovarian serous<br />
cystadenocarc<strong>in</strong>oma specimens were collected from multiple hospital tissue<br />
banks and ma<strong>in</strong>ta<strong>in</strong>ed frozen <strong>in</strong> liquid nitrogen vapors. A tissue portion was<br />
created with two flank<strong>in</strong>g H&E slides (arbitrarily named top and bottom) as<br />
follows: tissues were mounted <strong>in</strong> optimal cutt<strong>in</strong>g temperature media (OCT)<br />
and brought to −20 °C. A 4 µm frozen section (top slide) was cut with a<br />
cryostat (Leica Microsystems, Wetzlar, Germany). A specimen for molecular<br />
extraction was created by shav<strong>in</strong>g 100 mg <strong>of</strong> tumor tissue from the tissue face<br />
with a scalpel, then a second 4 µm frozen section was cut (bottom slide). An<br />
H&E sta<strong>in</strong> was conducted on both slide tissue sections us<strong>in</strong>g an Autosta<strong>in</strong>er<br />
XL with <strong>in</strong>tegrated coverslipper (Leica). Digital images <strong>of</strong> slides were created<br />
at 20× resolution us<strong>in</strong>g a Scanscope XT (Aperio, Vista, CA, USA). Board-<br />
certified pathologists conducted the pathology review remotely via ImageScope<br />
s<strong>of</strong>tware (Aperio). Pathologists <strong>in</strong>itially reviewed each slide at low magnification<br />
to determ<strong>in</strong>e low power microscopic morphology, then <strong>in</strong>creased magnification<br />
to 20× and reviewed 10 representative high power fields on each<br />
slide. Diagnosis <strong>of</strong> ovarian serous cystadenocarc<strong>in</strong>oma was verified, and tumor<br />
purity was determ<strong>in</strong>ed as the proportion <strong>of</strong> tumor nuclei present compared<br />
to the total nuclei present on the slide. The tumor purity <strong>of</strong> the extracted<br />
specimen was calculated as the average purity score <strong>of</strong> the top and bottom<br />
slides. Quality control <strong>in</strong>cluded a random review <strong>of</strong> 10% <strong>of</strong> slides by a second<br />
pathologist to verify consistency <strong>of</strong> reads.<br />
Leukocyte methylation signature. <strong>DNA</strong> methylation data for 489 high stage,<br />
high grade serous ovarian tumors and eight normal fallopian tube samples<br />
was obta<strong>in</strong>ed from http://tcga.cancer.gov/dataportal/. In addition, buffy coat<br />
samples from two female <strong>in</strong>dividuals were obta<strong>in</strong>ed. All data were generated<br />
with Illum<strong>in</strong>a Inf<strong>in</strong>ium HumanMethylation27 arrays, which <strong>in</strong>terrogate 27,578<br />
CpG sites located <strong>in</strong> proximity to the transcription start sites <strong>of</strong> 14,475 consensus<br />
cod<strong>in</strong>g sequenc<strong>in</strong>g <strong>in</strong> the NCBI Database (Genome Build 36). The level<br />
<strong>of</strong> <strong>DNA</strong> methylation at each probe was summarized with beta values rang<strong>in</strong>g<br />
from 0 (unmethylated) to 1 (methylated) 59 .<br />
The leukocyte methylation signature was derived as follows. Each probe was<br />
ranked by the difference <strong>in</strong> mean beta value <strong>in</strong> buffy coat and fallopian tube<br />
samples. We reta<strong>in</strong>ed the 100 probes with the largest positive difference and<br />
the 100 with the largest negative difference between mean <strong>DNA</strong> methylation <strong>in</strong><br />
normal fallopian tube tissues and peripheral blood leukocytes, designated BC<br />
and FT (buffy coat and fallopian tube enriched, respectively). Let Tik denote the<br />
beta value for probe k <strong>in</strong> tumor sample i. Let Bk denote the average beta value <strong>of</strong><br />
buffy coat samples for each probe. Let Tk denote the m<strong>in</strong>imum observed beta<br />
value across all tumor samples for the BC probes and the maximum for the<br />
FT probes. Denote by fB the fraction <strong>of</strong> buffy coat components <strong>in</strong> the sample,<br />
then we have the follow<strong>in</strong>g equation for each probe: Tik = Bk fB + Tk ( 1 − fB<br />
) .<br />
Solv<strong>in</strong>g this equation for fB gives: fB = ( Tik − Tk )/( Bk − Tk<br />
). The values <strong>of</strong><br />
fB for each <strong>of</strong> the 200 probes <strong>in</strong> the signature were calculated and a kernel<br />
density estimate was obta<strong>in</strong>ed. The leukocyte signature was then calculated<br />
as the mode <strong>of</strong> this density estimate.<br />
nature biotechnology doi:10.1038/nbt.2203
npg © 2012 <strong>Nature</strong> America, Inc. All rights reserved.<br />
Selection <strong>of</strong> data sets. We analyzed 2,445 Affymetrix 250 K Sty SNP samples<br />
from a previous pan cancer survey 36 conta<strong>in</strong><strong>in</strong>g 3,131 cancer samples. Because<br />
our process<strong>in</strong>g <strong>of</strong> the data required use <strong>of</strong> the Birdseed algorithm 60 , external<br />
data sets lack<strong>in</strong>g diploid PCR controls could not be used. In addition, cancer<br />
types with fewer than 20 samples were excluded. In addition, 680 Affymetrix<br />
SNP6.0 samples were taken from the TCGA GBM 21 and HGS-OvCa 34<br />
studies, as well as 30 cell-l<strong>in</strong>e samples, br<strong>in</strong>g<strong>in</strong>g total sample count to<br />
3,155. The complete table <strong>of</strong> cancer samples analyzed is available as<br />
Supplementary Table 1. The complete table <strong>of</strong> ABSOLUTE results is available<br />
as Supplementary Tables 1 and 2.<br />
Power calculation for <strong>somatic</strong> mutation detection <strong>in</strong> cancer tissue samples.<br />
We develop a framework for calculation <strong>of</strong> statistical power for the detection <strong>of</strong><br />
mutations. Power to detect a variant depends on the allelic fraction f and local<br />
depth <strong>of</strong> coverage n. To calculate power, we model the idealized scenario <strong>in</strong><br />
which random sequenc<strong>in</strong>g errors occur uniformly with rate ∈. We calculate a<br />
m<strong>in</strong>imum number <strong>of</strong> support<strong>in</strong>g reads k such that the probability <strong>of</strong> observ<strong>in</strong>g<br />
k or more identical non-reference reads due to sequenc<strong>in</strong>g error is less than a<br />
def<strong>in</strong>ed false-positive rate (FPR):<br />
where<br />
k = argm<strong>in</strong>| P( m)<br />
≤ FPR<br />
m<br />
⎧1<br />
⎪ m−1<br />
P( m)<br />
= ⎨<br />
⎪<br />
1 − ∑ B<strong>in</strong>om( i| n, Œ/<br />
3) ⎩⎪<br />
i = 0<br />
if m = 0<br />
if m ≥ 1<br />
Variants with ≥k support<strong>in</strong>g reads are then considered detected. We specified<br />
the sequenc<strong>in</strong>g error rate ∈ = 1 × 10⁻³ and FPR = 5 × 10⁻⁷ for all computations<br />
<strong>in</strong> this study. Power is then calculated as:<br />
k −1<br />
Pow( n, f ) = 1 − ∑B<strong>in</strong>om<br />
( i| n, f ) + d B<strong>in</strong>om(<br />
k| n, f )<br />
i = 0<br />
(9)<br />
where<br />
FPR − P( k)<br />
d =<br />
P( k − 1)<br />
− P( k)<br />
We consider the case <strong>of</strong> detect<strong>in</strong>g clonal <strong>somatic</strong> variants present at a s<strong>in</strong>gle<br />
copy per cancer cell <strong>in</strong> cancer-tissue derived <strong>DNA</strong> samples. Given estimates<br />
<strong>of</strong> purity (α) and local absolute copy-number (qt ), the allelic fraction <strong>of</strong> such<br />
variants is:<br />
doi:10.1038/nbt.2203<br />
a<br />
d =<br />
2( 1 − a) + aqt<br />
(10)<br />
Power is calculated <strong>in</strong> such cases as Pow(n,δ).<br />
In order to simplify the relationship between power and tumor purity/<br />
ploidy for presentation <strong>in</strong> Supplementary Figure 7, we considered the detection<br />
power <strong>of</strong> the expected locus, over the genome-wide copy average. Power<br />
as such is determ<strong>in</strong>ed by the sample allelic <strong>in</strong>dex δ τ = α/D, which is solely a<br />
function <strong>of</strong> tumor purity/ploidy (equation 1). Expected power is obta<strong>in</strong>ed by<br />
us<strong>in</strong>g allelic fraction f = δ τ <strong>in</strong> equation (9). This calculation differs only <strong>in</strong> the<br />
substitution <strong>of</strong> expected genomic copy-number, i.e. ploidy (τ), for the local<br />
copy-number q t <strong>in</strong> equation (10).<br />
Power for expected subclonal variants present <strong>in</strong> fraction s f <strong>of</strong> cancer<br />
cells is given by Pow(n,s fδ τ ). This calculation was used for Supplementary<br />
Figure 7c,e. Local copy calculations us<strong>in</strong>g Pow(n,s fδ) were used for<br />
Supplementary Figures 7f and 12.<br />
Detection <strong>of</strong> <strong>somatic</strong> po<strong>in</strong>t mutations <strong>in</strong> ovarian carc<strong>in</strong>oma. We analyzed<br />
whole-exome hybrid capture Illum<strong>in</strong>a sequenc<strong>in</strong>g (WES) 37 data from 214 ovarian<br />
carc<strong>in</strong>oma tumor-normal pairs previously analyzed by the TCGA consortium 34 .<br />
We used the program muTect (K. Cibulskis et al., <strong>in</strong> preparation) We have used<br />
a newer version <strong>of</strong> the program muTect than used <strong>in</strong> previous analysis <strong>of</strong> this<br />
data 34 . The primary improvement <strong>in</strong> the new version is a reduction <strong>in</strong> the prior<br />
that <strong>somatic</strong> mutations be at an allelic fraction <strong>of</strong> 0.5, allow<strong>in</strong>g greater sensitivity<br />
at low allelic-fraction mutations, such as clonal events <strong>in</strong> impure samples, or to<br />
subclonal mutations. This procedure resulted <strong>in</strong> 29,268 <strong>somatic</strong> mutations.<br />
Inference <strong>of</strong> po<strong>in</strong>t mutation multiplicity. We develop a probabilistic model<br />
for <strong>in</strong>ference <strong>of</strong> the <strong>in</strong>teger multiplicities for both germl<strong>in</strong>e and <strong>somatic</strong><br />
variants, based on knowledge <strong>of</strong> tumor purity and genome-wide absolute<br />
copy-numbers. Denote the absolute homologous copy-numbers at a mutant<br />
locus as q1 and q2 , with q1 ≤ q2 . The possible multiplicities <strong>of</strong> germl<strong>in</strong>e variants<br />
are then:<br />
gq = { q1, q2, qt }<br />
where qt = q1 + q2 . Under the assumption that all <strong>somatic</strong> po<strong>in</strong>t-mutations arise<br />
uniquely on a s<strong>in</strong>gle haplotype, the possible multiplicities are:<br />
sq = { 1, …, q2}<br />
Note that when only total copy-ratio data are available, q 2 above is unknown,<br />
and q t is used <strong>in</strong>stead.<br />
Germl<strong>in</strong>e mutations are generally present <strong>in</strong> both the cancer and normal<br />
cell populations, with <strong>somatic</strong> copy-number <strong>alterations</strong> affect<strong>in</strong>g the allelic<br />
fraction. A heterozygous variant <strong>in</strong> the germl<strong>in</strong>e, with multiplicity g q <strong>in</strong> the<br />
cancer genome, has allelic fraction:<br />
( 1 − a) + a gq<br />
fg<br />
=<br />
q 2( 1 − a) + aqt<br />
whereas the allelic fraction <strong>of</strong> homozygous germl<strong>in</strong>e variants is 1 regardless<br />
<strong>of</strong> α. For <strong>somatic</strong> po<strong>in</strong>t mutations, the expected allelic fraction at multiplicity<br />
s q is f sq = s qδ, with δ as <strong>in</strong> equation (10).<br />
Consider an observed <strong>somatic</strong> po<strong>in</strong>t-mutation <strong>of</strong> unknown copy s q ∈ s q ,<br />
observed allelic fraction f ˆ , and with n total reads cover<strong>in</strong>g the locus. The<br />
complete likelihood <strong>of</strong> f ˆ may be represented as a mixture <strong>of</strong> Beta distributions<br />
correspond<strong>in</strong>g to each element <strong>of</strong> s q , plus an additional component S<br />
correspond<strong>in</strong>g to subclonal states:<br />
( )<br />
Lm fˆ| n, sq , wq<br />
, wsc<br />
=<br />
⎡<br />
ws f<br />
q s | nf + , n( − f ) +<br />
⎤<br />
∑ Beta ˆ ( 1 1 ˆ 1<br />
⎣⎢<br />
q<br />
) ⎦⎥<br />
sq ∈sq<br />
+ ws<br />
S( fˆ| n,<br />
l)<br />
c<br />
where w sq ∈w q specify mixture weights for each state <strong>in</strong> sq and wsc specifies<br />
the subclonal component weight. The subclonal component S is specified<br />
by compos<strong>in</strong>g a Beta distribution (model<strong>in</strong>g sampl<strong>in</strong>g noise) with an<br />
exponential distribution over subclonal cancer-cell fractions, hav<strong>in</strong>g a s<strong>in</strong>gle<br />
parameter λ:<br />
( ) −<br />
S( fˆ 1<br />
| n, l) = ∫ Beta f | nfˆ + 1, n( 1 − fˆ 1<br />
) + 1 Exp(<br />
f / d | l) d df<br />
0<br />
Note the change <strong>of</strong> coord<strong>in</strong>ates <strong>in</strong> the exponential component us<strong>in</strong>g δ; this<br />
allows model<strong>in</strong>g <strong>in</strong> consistent units <strong>of</strong> cancer-cell fractions, regardless <strong>of</strong><br />
tumor purity and local copy-number (note this distribution is renormalized<br />
on the unit <strong>in</strong>terval). The probability <strong>of</strong> a given <strong>in</strong>teger copy-state s q may then<br />
be calculated as:<br />
( )<br />
ws<br />
Beta f nf n f<br />
q s | ˆ + 1, ( 1 − ˆ)<br />
+ 1<br />
q<br />
sˆ<br />
q =<br />
q2<br />
Lm ( fˆ| n, sq , wq<br />
, wsc<br />
)<br />
Similarly, the probability that a given mutation is subclonal is calculated as:<br />
S( ˆf<br />
| n,<br />
l)<br />
sˆ c = ws q<br />
c 2<br />
.<br />
Lm ( fˆ| n, sq , wq<br />
, wsc<br />
)<br />
(11)<br />
(12)<br />
nature biotechnology
npg © 2012 <strong>Nature</strong> America, Inc. All rights reserved.<br />
For the computations <strong>in</strong> this study, we fixed λ = 25, w sq to 0.25, and w sc<br />
to 0.75, which produced a fit to the comb<strong>in</strong>ed-sample mutation-fraction<br />
distribution (Fig. 4b). The results presented <strong>in</strong> Figure 4 were robust to<br />
various sett<strong>in</strong>gs.<br />
Optimization <strong>of</strong> mixture components weights correspond<strong>in</strong>g to <strong>in</strong>teger<br />
<strong>somatic</strong> multiplicities may be accomplished <strong>in</strong> a manner similar to that<br />
described for the SNCA mixture model <strong>in</strong> equation (6). A Dirichlet prior may<br />
be specified as a vector <strong>of</strong> pseudo-counts equivalent to prior observations <strong>of</strong><br />
each multiplicity value. Weights are then calculated as the mode <strong>of</strong> the posterior<br />
Dirichlet calculated from the observed counts. These computations are<br />
used to calculate a mutation-score likelihood for each purity ploidy mode when<br />
ABSOLUTE is run with paired SCNA and <strong>somatic</strong> po<strong>in</strong>t mutation data.<br />
Simulation <strong>of</strong> cancer-genome evolution to support genome-doubl<strong>in</strong>g <strong>in</strong>ferences.<br />
A simple simulation was performed to obta<strong>in</strong> P-values for the probability<br />
that an observed configuration <strong>of</strong> homologous copy-numbers could be<br />
produced from a serial process <strong>of</strong> <strong>in</strong>dependent ga<strong>in</strong>s and losses. Genome-wide<br />
homologous copy-numbers are summarized at chromosome-arm resolution as<br />
<strong>in</strong>teger ga<strong>in</strong>s/losses (total <strong>of</strong> 78 states). We then fix the total number <strong>of</strong> ga<strong>in</strong>s/<br />
losses N for the sample, and calculate rates for each arm, which are normalized to<br />
probabilities. Simulation <strong>of</strong> the sample is performed by <strong>in</strong>dependently sampl<strong>in</strong>g<br />
N ga<strong>in</strong>s and losses from these probabilities. This was repeated 1,000 times for<br />
each sample, keep<strong>in</strong>g track <strong>of</strong> the number <strong>of</strong> times M that the extent <strong>of</strong> even<br />
high homologous copy-number present <strong>in</strong> the observed sample was atta<strong>in</strong>ed or<br />
M<br />
exceeded. The P-value is then: P = , if M > 0, otherwise P < 0.0001.<br />
1, 000<br />
54. Carter, S.L, Meyerson, M., & Getz, G. Accurate estimation <strong>of</strong> homologue-specific<br />
<strong>DNA</strong> concentration ratios <strong>in</strong> cancer samples allows long-range haplotyp<strong>in</strong>g.<br />
Prepr<strong>in</strong>t at http://preced<strong>in</strong>gs.nature.com/documents/6494/version/1/ (2011).<br />
55. Altshuler, D.M. et al. Integrat<strong>in</strong>g common and rare genetic variation <strong>in</strong> diverse<br />
human populations. <strong>Nature</strong> 467, 52–58 (2010).<br />
56. Brown<strong>in</strong>g, B.L. & Yu, Z. Simultaneous genotype call<strong>in</strong>g and haplotype phas<strong>in</strong>g<br />
improves genotype accuracy and reduces false-positive associations for genome-wide<br />
association studies. Am. J. Hum. Genet. 85, 847–861 (2009).<br />
57. Huber, W., von Heydebreck, A., Sultmann, H., Poustka, A. & V<strong>in</strong>gron, M. Variance<br />
stabilization applied to microarray data calibration and to the <strong>quantification</strong> <strong>of</strong><br />
differential expression. Bio<strong>in</strong>formatics 18 (suppl 1), S96–S104 (2002).<br />
58. Dempster, A.P., Laird, N.M. & Rub<strong>in</strong>, D.B. Maximum Likelihood from Incomplete<br />
Data via the EM Algorithm. J. Roy. Stat. Soc. Ser. B 39, 1–38 (1977).<br />
59. Noushmehr, H. et al. Identification <strong>of</strong> a CpG island methylator phenotype that<br />
def<strong>in</strong>es a dist<strong>in</strong>ct subgroup <strong>of</strong> glioma. Cancer Cell 17, 510–522 (2010).<br />
60. Korn, J.M. et al. Integrated genotype call<strong>in</strong>g and association analysis <strong>of</strong> SNPs,<br />
common copy number polymorphisms and rare CNVs. Nat. Genet. 40, 1253–1260<br />
(2008).<br />
nature biotechnology doi:10.1038/nbt.2203