

Observations on the Specificity of Breath-Alcohol Analyzers ... - Library
Observations on the Specificity of Breath-Alcohol Analyzers ... - Library
Observations on the Specificity of Breath-Alcohol Analyzers ... - Library

Create successful ePaper yourself
Turn your PDF publications into a flip-book with our unique Google optimized e-Paper software.
JONES 9 SPECIFICITY OF BREATH-ALCOHOL ANALYZERS 845<br />
matogram for this analysis. Several o<strong>the</strong>r low molecular volatile substances besides ethanol<br />
were obviously present in <strong>the</strong> blood specimen. These peaks were identified from <strong>the</strong>ir mass<br />
spectra by comparis<strong>on</strong> with standard reference substances. Table 1 gives <strong>the</strong> principal mass<br />
fragments and <strong>the</strong> percent intensity for <strong>the</strong> main i<strong>on</strong> fragments for <strong>the</strong>se chromatographic<br />
peaks numbered 1 through 7 in Fig. 1. The opti<strong>on</strong> <strong>of</strong> running mass chromatograms is illus-<br />
trated in Fig. 2. This mode <strong>of</strong> operati<strong>on</strong> has <strong>the</strong> advantage that actual mass fragments within<br />
each peak <strong>of</strong> <strong>the</strong> TIC trace are displayed as a functi<strong>on</strong> <strong>of</strong> time during <strong>the</strong> chromatographic<br />
run.<br />
31<br />
43<br />
4/+<br />
45<br />
46<br />
58<br />
59<br />
72<br />
TABLE 1--Principal mass fragments and in brackets <strong>the</strong>ir percent intensity<br />
obtained from electr<strong>on</strong> impact (70-eV) mass spectra <strong>of</strong> <strong>the</strong> GC Peaks l<br />
through 7 in Fig. 1. These fragment i<strong>on</strong>s were compared with standard<br />
reference substances analyzed under <strong>the</strong> same GC/MS c<strong>on</strong>diti<strong>on</strong>s.<br />
Molecular<br />
Peak Substance I<strong>on</strong> Base Peak re~z"<br />
1 Methanol 32 (60) 31 (100) 29 (30)<br />
2 Acetaldehyde 44 (85) 29 (100) 43 (29)<br />
3 Ethanol 46 (20) 31 (100) 45 (50)<br />
4 Acet<strong>on</strong>e 58 (33) 43 (100) 15 (34)<br />
5 2-Propanol 59 (10) 45 (100) 43 (20)<br />
6 2-Butan<strong>on</strong>e 72 (25) 43 (100) 29 (12)<br />
7 2-Butanol 74 (2) 45 (100) 31 (20)<br />
"Next most intense i<strong>on</strong> fragment.<br />
J~ 44<br />
A<br />
9 ~ ~ ~ . - - ,,,-- -i "-"r-7. 46<br />
I I I TIC-Chrom<br />
0 10 2~0 :30 r~,n<br />
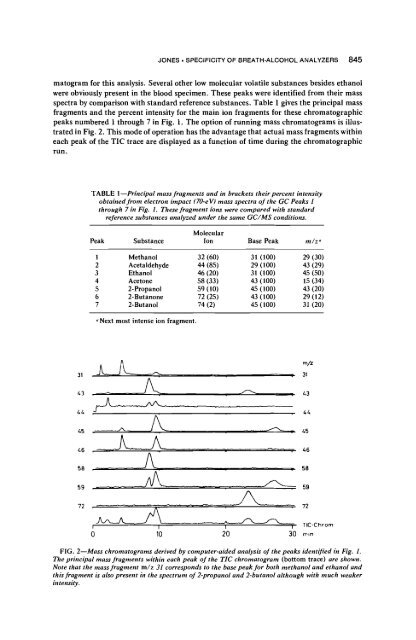
FIG. 2--Mass chromatograms derived by computer-aided analysis <strong>of</strong> <strong>the</strong> peaks identified in Fig. 1.<br />
The principal mass fragments within each peak <strong>of</strong> <strong>the</strong> TIC chromatogram (bottom trace) are shown.<br />
Note that <strong>the</strong> mass fragment m/z 31 corresp<strong>on</strong>ds to <strong>the</strong> base peak for both methanol and ethanol and<br />
this fragment is also present in <strong>the</strong> spectrum <strong>of</strong> 2-propanol and 2-butanol although with much weaker<br />
intensity.<br />
m/z<br />
31<br />
43<br />
58


