

Altus Feasibility Study (pdf) - Maison Senior Living
Altus Feasibility Study (pdf) - Maison Senior Living
Altus Feasibility Study (pdf) - Maison Senior Living

You also want an ePaper? Increase the reach of your titles
YUMPU automatically turns print PDFs into web optimized ePapers that Google loves.
4904 ‐ 4920 Elbow Drive, Calgary, AB<br />
Milliken Developments<br />
October 28, 2010<br />
Visible minorities represent 11.3% of the population within the PMA. The top visible minorities are: Chinese (3.4%)<br />
and South Asian (1.8%). The PMA has a lower percentage of visible minority population than Calgary CMA.<br />
Mobility<br />
Visible Minority Population<br />
PMA Calgary CMA<br />
Not a visible minority 88.7% 77.8%<br />
Total visible minority pop 11.3% 22.2%<br />
Chinese 3.4% 6.2%<br />
South Asian 1.8% 5.4%<br />
Black 1.1% 2.0%<br />
Filipino 1.6% 2.4%<br />
Latin American 0.9% 1.3%<br />
Southeast Asian 0.4% 1.5%<br />
Arab 0.4% 1.1%<br />
West Asian 0.3% 0.6%<br />
Korean 0.4% 0.6%<br />
Japanese 0.5% 0.4%<br />
Visible Minority n.i.e 0.1% 0.2%<br />
Mulitple visible minority 0.3% 0.6%<br />
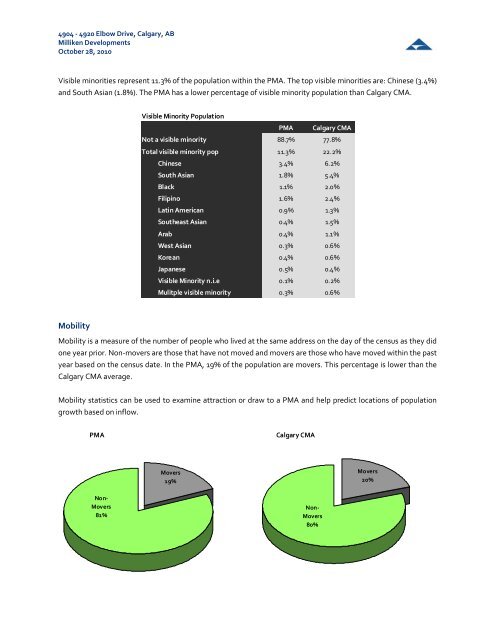
Mobility is a measure of the number of people who lived at the same address on the day of the census as they did<br />
one year prior. Non‐movers are those that have not moved and movers are those who have moved within the past<br />
year based on the census date. In the PMA, 19% of the population are movers. This percentage is lower than the<br />
Calgary CMA average.<br />
Mobility statistics can be used to examine attraction or draw to a PMA and help predict locations of population<br />
growth based on inflow.<br />
PMA Calgary CMA<br />
Non‐<br />
Movers<br />
81%<br />
Movers<br />
19%<br />
Non‐<br />
Movers<br />
80%<br />
Movers<br />
20%