

pdf, 2.4Mb - TUIO
pdf, 2.4Mb - TUIO
pdf, 2.4Mb - TUIO

Create successful ePaper yourself
Turn your PDF publications into a flip-book with our unique Google optimized e-Paper software.
Proceedings of the 14 th International Conference on Auditory Display, Paris, France June 24 - 27, 2008<br />
DURCHEINANDER<br />
UNDERSTANDING CLUSTERING VIA INTERACTIVE SONIFICATION<br />
Till Bovermann 1 , Julian Rohrhuber 2 , Helge Ritter 1<br />
Bielefeld University 1<br />
Neuroinformatics Group<br />
Bielefeld, Germany<br />
[tboverma|helge]@techfak.uni-bielefeld.de<br />
ABSTRACT<br />
With Durcheinander we present a system to help understand Agglomerative<br />
Clustering processes as they appear in various datamining<br />
tasks. Durcheinander consists of a toy dataset represented by<br />
several small objects on a tabletop surface. A computer vision<br />
systems tracks their position and computes a cluster dendrogram<br />
which is sonified every time a substantial change in this dendrogram<br />
takes place. Durcheinander may be used to answer questions<br />
concerning the behavior of clustering algorithms under various<br />
conditions. We propose its usage as a didactical and explorative<br />
platform for single- and multi-user operation.<br />
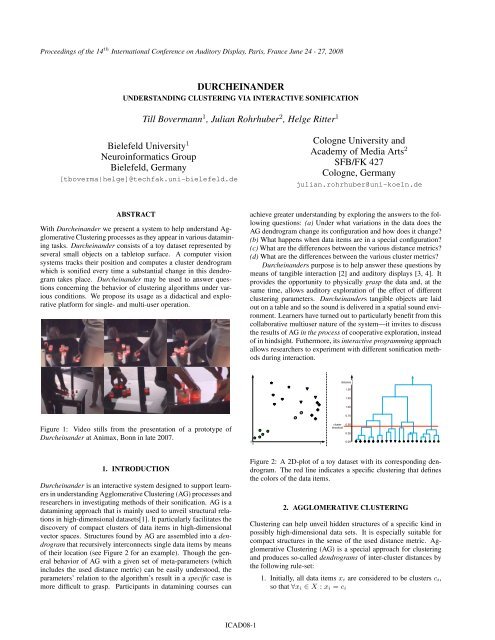
Figure 1: Video stills from the presentation of a prototype of<br />
Durcheinander at Animax, Bonn in late 2007.<br />
1. INTRODUCTION<br />
Durcheinander is an interactive system designed to support learners<br />
in understanding Agglomerative Clustering (AG) processes and<br />
researchers in investigating methods of their sonification. AG is a<br />
datamining approach that is mainly used to unveil structural relations<br />
in high-dimensional datasets[1]. It particularly facilitates the<br />
discovery of compact clusters of data items in high-dimensional<br />
vector spaces. Structures found by AG are assembled into a dendrogram<br />
that recursively interconnects single data items by means<br />
of their location (see Figure 2 for an example). Though the general<br />
behavior of AG with a given set of meta-parameters (which<br />
includes the used distance metric) can be easily understood, the<br />
parameters’ relation to the algorithm’s result in a specific case is<br />
more difficult to grasp. Participants in datamining courses can<br />
Cologne University and<br />
Academy of Media Arts 2<br />
SFB/FK 427<br />
Cologne, Germany<br />
julian.rohrhuber@uni-koeln.de<br />
achieve greater understanding by exploring the answers to the following<br />
questions: (a) Under what variations in the data does the<br />
AG dendrogram change its configuration and how does it change?<br />
(b) What happens when data items are in a special configuration?<br />
(c) What are the differences between the various distance metrics?<br />
(d) What are the differences between the various cluster metrics?<br />
Durcheinanders purpose is to help answer these questions by<br />
means of tangible interaction [2] and auditory displays [3, 4]. It<br />
provides the opportunity to physically grasp the data and, at the<br />
same time, allows auditory exploration of the effect of different<br />
clustering parameters. Durcheinanders tangible objects are laid<br />
out on a table and so the sound is delivered in a spatial sound environment.<br />
Learners have turned out to particularly benefit from this<br />
collaborative multiuser nature of the system—it invites to discuss<br />
the results of AG in the process of cooperative exploration, instead<br />
of in hindsight. Futhermore, its interactive programming approach<br />
allows researchers to experiment with different sonification methods<br />
during interaction.<br />
0<br />
0<br />
ICAD08-1<br />
1<br />
1<br />
cluster<br />
threshold<br />
distance<br />
1.50<br />
1.25<br />
1.00<br />
0.75<br />
0.50<br />
0.25<br />
0.00<br />
Figure 2: A 2D-plot of a toy dataset with its corresponding dendrogram.<br />
The red line indicates a specific clustering that defines<br />
the colors of the data items.<br />
2. AGGLOMERATIVE CLUSTERING<br />
Clustering can help unveil hidden structures of a specific kind in<br />
possibly high-dimensional data sets. It is especially suitable for<br />
compact structures in the sense of the used distance metric. Agglomerative<br />
Clustering (AG) is a special approach for clustering<br />
and produces so-called dendrograms of inter-cluster distances by<br />
the following rule-set:<br />
1. Initially, all data items xi are considered to be clusters ci,<br />
so that ∀xi ∈ X : xi = ci
Proceedings of the 14 th International Conference on Auditory Display, Paris, France June 24 - 27, 2008<br />
2. Compute distances between all pairs of clusters and find the<br />
smallest distance:<br />
minpair = argmin i,j d(ci, cj)<br />
mindist = mini,j d(ci, cj)<br />
3. Join ci and cj at the distance mindist. This joint 〈ci, cj〉<br />
represents the new cluster ck<br />
4. Add ck to the list of clusters, remove ci, cj from this list<br />
5. If more then one cluster is in the list of clusters GOTO 2,<br />
else END.<br />
A cut at a specific distance in the resulting dendrogram represents<br />
one possible clustering of the given dataset. For example applying<br />
AG to the dataset shown in Figure 2a results in the dendrogram<br />
shown in Figure 2b. The red line represents a possible cut.<br />
Though it seems natural to use the standard euclidean metric<br />
to measure object distances, it is also possible to use other metrics<br />
which may fit better to the domain of the given dataset. The<br />
choice of the inter-object metric as well as the choice of how to determine<br />
cluster distances 1 heavily affects the structure of the AG’s<br />
outcome and therefore the resulting dendrogram. Although it is<br />
relatively easy to understand the general global behavior of the<br />
clustering algorithm, it is difficult to understand the way in which<br />
local variations such as the exact position of data items affect the<br />
algorithm’s output. This is particularly interesting since AG is usually<br />
applied to data with measuring errors that cause variations in<br />
data item locations.<br />
A dynamically changing structure may not necessarily be best<br />
represented in form of a visual dendrogram; sonification allows us<br />
to explore its recursive (re-)configuration without a projection onto<br />
the plane of geometry.<br />
3. IMPLEMENTING DURCHEINANDER<br />
As a basis for Durcheinander we use the tDesk [5], a tabletop tangible<br />
computing environment designed and built in the interaction<br />
laboratory at Bielefeld University. By design, the dimensions of<br />
the surface allow groups of people to work on tangible applications,<br />
providing each member direct access to the physical objects.<br />
We use a digital camera below the tDesk to capture the 2D positions<br />
of the objects used as the data set in our system. This method<br />
prevents possible visual object occlusions by the users such that<br />
all 20 objects are all the time recognizable by the vision-engine.<br />
A blob recognition algorithm then detects number and position of<br />
the objects, which is fed into the actual clustering algorithm which<br />
computes the dendrogram.<br />
The dendrogram structure is translated into a corresponding<br />
sound synthesis graph which may be triggered externally by knocking<br />
on the surface of the tDesk. The resulting sound is played in<br />
real time to the users by the multi-channel audio system surrounding<br />
the table. Here, each physical data item produces a sound<br />
that is spatially related to its position on the surface—every object<br />
sound again consists of sub-sounds determined by other nodes<br />
of the dendrogram. 2 The graph structure is being continually updated,<br />
and whenever its configuration differs substantially from its<br />
1 These metrics differentiate AG into e.g. single-linkage, completelinkage,<br />
or average based clustering.<br />
2 In order to realize such a framework, we implemented a modular<br />
sound architecture in SuperCollider, a higher-level programming language<br />
that is specially suited for real time sound rendering [6].<br />
ICAD08-2<br />
Figure 3: Definition of a node’s sound subgraph.<br />
predecessor, the system generates a trigger that propagates through<br />
the synthesis graph; a series of reconfigurations may be heard as<br />
a series of differing sounds in context. The sonification algorithm<br />
constructs a computation graph where each node (representing a<br />
cluster ci) takes an n-tuple of streams as input, provided by its<br />
enclosing cluster. In addition to this, a variable number of arguments<br />
allow parametric control and triggering of each node (see<br />
Figure 3). Each node passes on an n-tuple of streams to both of<br />
its two adjacent nodes. The algorithm that defines this flow-graph<br />
can be rewritten conveniently at runtime, so that different synthesis<br />
techniques may be experimented with while listening.<br />
4. FIRST INSIGHTS<br />
In late 2007 we presented Durcheinander at a workshop 3 for children<br />
at the Animax in Bonn. There we had the chance to extensively<br />
work with visitors to adjust Durcheinanders auditory display<br />
in real time (Figure 1) At ICAD 2008 we present a live demonstration<br />
of Durcheinander, and explain its particular usefulness in<br />
more detail. A video showing Durcheinander in action can be<br />
viewed at http://tuio.LFSaw.de/durcheinander.shtml.<br />
5. REFERENCES<br />
[1] B. S. Everitt, S. Landau, and M. Leese, Cluster analysis,<br />
Arnold, London, 4. edition, 2001.<br />
[2] Hiroshi Ishii and Brygg Ullmer, “Tangible bits: towards seamless<br />
interfaces between people, bits and atoms,” in CHI ’97:<br />
Proceedings of the SIGCHI conference on Human factors in<br />
computing systems, New York, NY, USA, 1997, pp. 234–241,<br />
ACM.<br />
[3] G. Kramer, Ed., Auditory Display, Addison-Wesley, 1994.<br />
[4] T. Hermann and A. Hunt, “Interactive sonification,” IEEE<br />
MultiMedia, vol. 12, no. 2, pp. 20–24, 04 2005.<br />
[5] T. Hermann, T. Bovermann, E Riedenklau, and H. Ritter,<br />
“Tangible computing for interactive sonification of multivariate<br />
data,” in Proceedings of the 2nd Interactive Sonification<br />
Workshop, February 2007.<br />
[6] J. McCartney, “Supercollider hub,” URL, July 2004,<br />
http://supercollider.sourceforge.net/.<br />
3 This workshop was held by the DFG-funded research project Artistic<br />
Interactivity in Hybrid Networks as part of the German Jahr der Geisteswissenschaften<br />
2007.