WHO Anthro for personal computers - World Health Organization
WHO Anthro for personal computers - World Health Organization
WHO Anthro for personal computers - World Health Organization
You also want an ePaper? Increase the reach of your titles
YUMPU automatically turns print PDFs into web optimized ePapers that Google loves.
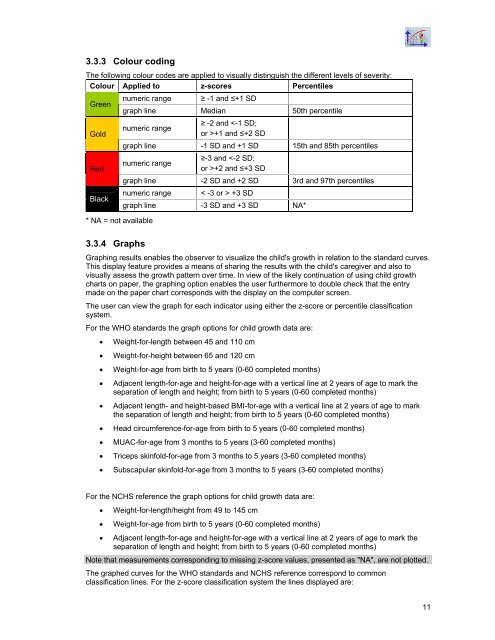
3.3.3 Colour coding<br />
The following colour codes are applied to visually distinguish the different levels of severity:<br />
Colour Applied to z-scores Percentiles<br />
Green<br />
numeric range<br />
graph line<br />
≥ -1 and ≤+1 SD<br />
Median 50th percentile<br />
Gold<br />
Red<br />
Black<br />
* NA = not available<br />
numeric range<br />
≥ -2 and +1 and ≤+2 SD<br />
graph line -1 SD and +1 SD 15th and 85th percentiles<br />
numeric range<br />
≥-3 and +2 and ≤+3 SD<br />
graph line -2 SD and +2 SD 3rd and 97th percentiles<br />
numeric range < -3 or > +3 SD<br />
graph line -3 SD and +3 SD NA*<br />
3.3.4 Graphs<br />
Graphing results enables the observer to visualize the child's growth in relation to the standard curves.<br />
This display feature provides a means of sharing the results with the child's caregiver and also to<br />
visually assess the growth pattern over time. In view of the likely continuation of using child growth<br />
charts on paper, the graphing option enables the user furthermore to double check that the entry<br />
made on the paper chart corresponds with the display on the computer screen.<br />
The user can view the graph <strong>for</strong> each indicator using either the z-score or percentile classification<br />
system.<br />
For the <strong>WHO</strong> standards the graph options <strong>for</strong> child growth data are:<br />
• Weight-<strong>for</strong>-length between 45 and 110 cm<br />
• Weight-<strong>for</strong>-height between 65 and 120 cm<br />
• Weight-<strong>for</strong>-age from birth to 5 years (0-60 completed months)<br />
• Adjacent length-<strong>for</strong>-age and height-<strong>for</strong>-age with a vertical line at 2 years of age to mark the<br />
separation of length and height; from birth to 5 years (0-60 completed months)<br />
• Adjacent length- and height-based BMI-<strong>for</strong>-age with a vertical line at 2 years of age to mark<br />
the separation of length and height; from birth to 5 years (0-60 completed months)<br />
• Head circumference-<strong>for</strong>-age from birth to 5 years (0-60 completed months)<br />
• MUAC-<strong>for</strong>-age from 3 months to 5 years (3-60 completed months)<br />
• Triceps skinfold-<strong>for</strong>-age from 3 months to 5 years (3-60 completed months)<br />
• Subscapular skinfold-<strong>for</strong>-age from 3 months to 5 years (3-60 completed months)<br />
For the NCHS reference the graph options <strong>for</strong> child growth data are:<br />
• Weight-<strong>for</strong>-length/height from 49 to 145 cm<br />
• Weight-<strong>for</strong>-age from birth to 5 years (0-60 completed months)<br />
• Adjacent length-<strong>for</strong>-age and height-<strong>for</strong>-age with a vertical line at 2 years of age to mark the<br />
separation of length and height; from birth to 5 years (0-60 completed months)<br />
Note that measurements corresponding to missing z-score values, presented as "NA", are not plotted.<br />
The graphed curves <strong>for</strong> the <strong>WHO</strong> standards and NCHS reference correspond to common<br />
classification lines. For the z-score classification system the lines displayed are:<br />
11


