Berlin
Berlin
Berlin

You also want an ePaper? Increase the reach of your titles
YUMPU automatically turns print PDFs into web optimized ePapers that Google loves.
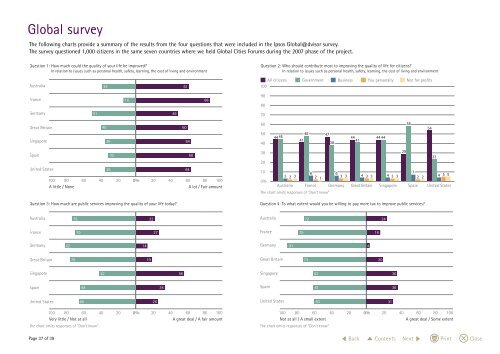
Global survey<br />
The following charts provide a summary of the results from the four questions that were included in the Ipsos Global@dvisor survey.<br />
The survey questioned 1,000 citizens in the same seven countries where we held Global Cities Forums during the 2007 phase of the project.<br />
Question 1: How much could the quality of your life be improved?<br />
In relation to issues such as personal health, safety, learning, the cost of living and environment<br />
Australia<br />
France<br />
Germany<br />
Great Britain<br />
Singapore<br />
Spain<br />
United States<br />
51<br />
39<br />
40<br />
36<br />
36<br />
32<br />
14<br />
100 80 60 40 20 0% 20 40 60 80 100<br />
A little / None A lot / Fair amount<br />
Question 3: How much are public services improving the quality of your life today?<br />
Australia<br />
France<br />
Germany<br />
Great Britain<br />
Singapore<br />
Spain<br />
United States<br />
82<br />
76<br />
75<br />
70<br />
64<br />
66<br />
100 80 60 40 20 0% 20 40 60 80 100<br />
Very little / Not at all A great deal / A fair amount<br />
The chart omits responses of "Don't know"<br />
42<br />
14<br />
19<br />
22<br />
27<br />
26<br />
34<br />
49<br />
56<br />
61<br />
60<br />
64<br />
64<br />
68<br />
86<br />
Question 2: Who should contribute most to improving the quality of life for citizens?<br />
In relation to issues such as personal health, safety, learning, the cost of living and environment<br />
All citizens Government Business You personally Not for profits<br />
100<br />
Page 37 of 39 Back Contents Next Print Close<br />
90<br />
80<br />
70<br />
60<br />
50<br />
40<br />
30<br />
20<br />
10<br />
0%<br />
44 45<br />
3 2 3<br />
Australia<br />
48 47<br />
41<br />
38<br />
6<br />
2 1<br />
The chart omits responses of "Don't know"<br />
6<br />
3 3<br />
44 41<br />
4 3 3<br />
44 44<br />
4 3 3<br />
France Germany Great Britain Singapore Spain United States<br />
29<br />
58<br />
7<br />
2 2<br />
Question 4: To what extent would you be willing to pay more tax to improve public services?<br />
Australia<br />
France<br />
Germany<br />
Great Britain<br />
Singapore<br />
Spain<br />
United States<br />
91<br />
79<br />
72<br />
73<br />
62<br />
61<br />
60<br />
54<br />
23<br />
4 5 5<br />
100 80 60 40 20 0% 20 40 60 80 100<br />
Not at all / A small extent A great deal / Some extent<br />
The chart omits responses of "Don't know"<br />
4<br />
16<br />
20<br />
24<br />
31<br />
36<br />
36