Global Chemicals Outlook - UNEP
Global Chemicals Outlook - UNEP
Global Chemicals Outlook - UNEP

Create successful ePaper yourself
Turn your PDF publications into a flip-book with our unique Google optimized e-Paper software.
14<br />
OECD member countries as a group still account for the bulk of world chemical production, but developing countries and countries with<br />
economies in transition are increasingly signifi cant. Over the last decade, chemical production in the BRICS countries has far exceeded<br />
the growth rates of the OECD countries (Figures 1 and 2). For example, from 2000 to 2010, chemical production in China and India<br />
grew at an average annual rate of 24% and 14%, respectively, whereas the growth rate in the United States, Japan and Germany was<br />
between 5 and 8%.<br />
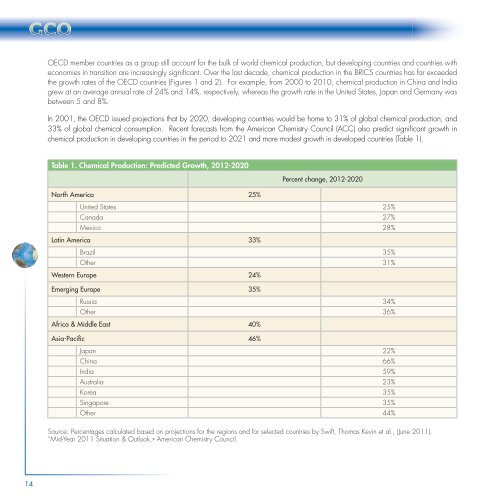
In 2001, the OECD issued projections that by 2020, developing countries would be home to 31% of global chemical production, and<br />
33% of global chemical consumption. Recent forecasts from the American Chemistry Council (ACC) also predict signifi cant growth in<br />
chemical production in developing countries in the period to 2021 and more modest growth in developed countries (Table 1).<br />
Table 1. Chemical Production: Predicted Growth, 2012-2020<br />
North America 25%<br />
Percent change, 2012-2020<br />
United States 25%<br />
Canada 27%<br />
Mexico 28%<br />
Latin America 33%<br />
Brazil 35%<br />
Other 31%<br />
Western Europe 24%<br />
Emerging Europe 35%<br />
Russia 34%<br />
Other 36%<br />
Africa & Middle East 40%<br />
Asia-Pacifi c 46%<br />
Japan 22%<br />
China 66%<br />
India 59%<br />
Australia 23%<br />
Korea 35%<br />
Singapore 35%<br />
Other 44%<br />
Source: Percentages calculated based on projections for the regions and for selected countries by Swift, Thomas Kevin et al., (June 2011).<br />
“Mid-Year 2011 Situation & <strong>Outlook</strong>,» American Chemistry Council.