Box plot for Excel 2007 | Excel tutorials, templates and tips - People
Box plot for Excel 2007 | Excel tutorials, templates and tips - People
Box plot for Excel 2007 | Excel tutorials, templates and tips - People

Create successful ePaper yourself
Turn your PDF publications into a flip-book with our unique Google optimized e-Paper software.
<strong>Box</strong> <strong>plot</strong> <strong>for</strong> <strong>Excel</strong> <strong>2007</strong> | <strong>Excel</strong> <strong>tutorials</strong>, <strong>templates</strong> <strong>and</strong> <strong>tips</strong> http://www.bloggpro.com/box-<strong>plot</strong>-<strong>for</strong>-excel-<strong>2007</strong>/<br />
Produced with a Trial Version of PDF Annotator - www.PDFAnnotator.com<br />
<strong>Excel</strong> <strong>tutorials</strong>, <strong>templates</strong> <strong>and</strong> <strong>tips</strong><br />
October 15, <strong>2007</strong> Jesper <strong>Excel</strong><br />
Keywords: <strong>Box</strong><strong>plot</strong>, box <strong>plot</strong>, stem <strong>and</strong> leaf <strong>plot</strong>s, <strong>Excel</strong> <strong>2007</strong>, how to make<br />
Version: <strong>Excel</strong> <strong>2007</strong><br />
Dowload:<br />
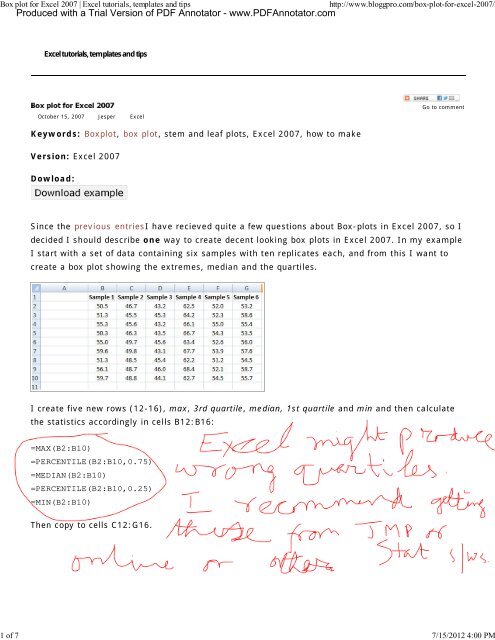
Since the previous entriesI have recieved quite a few questions about <strong>Box</strong>-<strong>plot</strong>s in <strong>Excel</strong> <strong>2007</strong>, so I<br />
decided I should describe one way to create decent looking box <strong>plot</strong>s in <strong>Excel</strong> <strong>2007</strong>. In my example<br />
I start with a set of data containing six samples with ten replicates each, <strong>and</strong> from this I want to<br />
create a box <strong>plot</strong> showing the extremes, median <strong>and</strong> the quartiles.<br />
I create five new rows (12-16), max, 3rd quartile, median, 1st quartile <strong>and</strong> min <strong>and</strong> then calculate<br />
the statistics accordingly in cells B12:B16:<br />
=MAX(B2:B10)<br />
=PERCENTILE(B2:B10,0.75)<br />
=MEDIAN(B2:B10)<br />
=PERCENTILE(B2:B10,0.25)<br />
=MIN(B2:B10)<br />
Then copy to cells C12:G16.<br />
Go to comment<br />
1 of 7 7/15/2012 4:00 PM
<strong>Box</strong> <strong>plot</strong> <strong>for</strong> <strong>Excel</strong> <strong>2007</strong> | <strong>Excel</strong> <strong>tutorials</strong>, <strong>templates</strong> <strong>and</strong> <strong>tips</strong> http://www.bloggpro.com/box-<strong>plot</strong>-<strong>for</strong>-excel-<strong>2007</strong>/<br />
Since we will “trick” <strong>Excel</strong> to draw a box-<strong>plot</strong> <strong>and</strong> use a stacked column chart we have to modify our<br />
data slightly. The first segment of the stacked column will be invisible <strong>and</strong> end where the lower<br />
boundary of the 2nd quartile begins ( =PERCENTILE(B2:B10,0.25) ). The next segment will consist<br />
of the 2nd quartile (median-1st quartile, or B14-B15). The third segment is the 3rd quartile (3rd<br />
quartile – median, or B13-B14). The length of the whiskers representing the max <strong>and</strong> min values<br />
are calculated as 1st quartile – min or B15-B16 <strong>and</strong> max – 3rd quartile, or B12-B13.<br />
These values are calculated in a new range, see image below.<br />
Now I’m ready to insert the chart. I select the range B19:G21 (see image below) <strong>and</strong> select a 2D<br />
stacked column from the Insert–>Table menu.<br />
2 of 7 7/15/2012 4:00 PM
<strong>Box</strong> <strong>plot</strong> <strong>for</strong> <strong>Excel</strong> <strong>2007</strong> | <strong>Excel</strong> <strong>tutorials</strong>, <strong>templates</strong> <strong>and</strong> <strong>tips</strong> http://www.bloggpro.com/box-<strong>plot</strong>-<strong>for</strong>-excel-<strong>2007</strong>/<br />
Next we add the whiskers. Select the second segment, click on Chart Tools –> Layou –> Select<br />
Error bars –> More error bars options <strong>and</strong> pick the Display Direction: Minus, indicate the Error<br />
Amount: Custom <strong>and</strong> click the Specify Value button. Leave the Positive Error Value as is <strong>and</strong> select<br />
the range containing the Min values <strong>for</strong> the Negative Error bar.<br />
Repeat <strong>for</strong> the max value whiskers. The chart now should look like the one in the image below.<br />
To make the chart a bit neater, right-click the lower segment series (green series in the image) <strong>and</strong><br />
select properties <strong>and</strong> make invisible. Format the rest of the chart to your liking. Done!<br />
3 of 7 7/15/2012 4:00 PM
<strong>Box</strong> <strong>plot</strong> <strong>for</strong> <strong>Excel</strong> <strong>2007</strong> | <strong>Excel</strong> <strong>tutorials</strong>, <strong>templates</strong> <strong>and</strong> <strong>tips</strong> http://www.bloggpro.com/box-<strong>plot</strong>-<strong>for</strong>-excel-<strong>2007</strong>/<br />
Good luck, <strong>and</strong> enjoy your new <strong>Box</strong> <strong>plot</strong>s.<br />
Popularity: 100% [?]<br />
locked | #41<br />
On November 15, 2010 4:24 pm<br />
Thanks a lot <strong>for</strong> the tutorial.<br />
I was sure, <strong>Excel</strong> could do that out of the box but okay. Using your guide saved me quite some time.<br />
ali | #42<br />
On November 11, 2010 5:49 pm<br />
Great post!! un<strong>for</strong>tunately this method breaks when some of the quartiles are negative. there you would need to split your data Table into two tables (<br />
one <strong>for</strong> the positive values only <strong>and</strong> another one <strong>for</strong> the negative values only ). only then can you start calculating the differences <strong>and</strong> <strong>plot</strong>ting the bars.<br />
There is a post on this blog with a method to h<strong>and</strong>le negative values as well, look it up if you like.<br />
Jesper On November 16, 2010 12:43 am<br />
Talha Ahmed | #43<br />
On November 10, 2010 2:27 pm<br />
You just made my day better. Thank YOU!!<br />
<strong>Excel</strong>lent tutorial!<br />
Snorfalorpagus | #44<br />
On November 5, 2010 1:28 pm<br />
4 of 7 7/15/2012 4:00 PM
<strong>Box</strong> <strong>plot</strong> <strong>for</strong> <strong>Excel</strong> <strong>2007</strong> | <strong>Excel</strong> <strong>tutorials</strong>, <strong>templates</strong> <strong>and</strong> <strong>tips</strong> http://www.bloggpro.com/box-<strong>plot</strong>-<strong>for</strong>-excel-<strong>2007</strong>/<br />
aa | #45<br />
On October 25, 2010 5:03 am<br />
thanks u so much,, u just save me<br />
GOOD!<br />
Hi there,<br />
DAVID FADARE | #46<br />
On October 14, 2010 11:25 pm<br />
Tina | #47<br />
On September 21, 2010 4:29 pm<br />
I have the same question as Celeste — how to tweak <strong>for</strong>mula <strong>for</strong> negative numbers. I have a data set that is a calculation of the percentage change<br />
between FY 10 <strong>and</strong> FY 08. the results range from negative to positive. The data set is widely varied <strong>and</strong> I’d like to remove some of the outliers.<br />
thanks <strong>for</strong> your advice!<br />
Hey,<br />
You can find a guide <strong>for</strong> that here: http://www.bloggpro.com/creating-a-box<strong>plot</strong>-in-excel-<strong>2007</strong>-with-negative-values-in-dataset/<br />
Jesper On September 26, 2010 4:10 pm<br />
Celeste | #48<br />
On September 11, 2010 11:44 pm<br />
I was very happy to find your description, however, I was wondering how the second step, where you tweak the max, min… et c, would work if you had<br />
negative numbers? The reason that I ask is because I have a project where the numbers range from positive values to negative values.<br />
Thanks <strong>for</strong> your help!!<br />
kr | #49<br />
On September 9, 2010 9:09 am<br />
Hi, I need to do a box <strong>and</strong> whisker <strong>plot</strong> in excel <strong>2007</strong>, but first I have a whole bunch of data that I need to find the median <strong>for</strong>. However, I am having<br />
trouble finding the median because I have used the filtering option in excel <strong>and</strong> the median includes all the hidden rows – does anyone know how I can<br />
get around this?? I have a relatively limited knowledge of excel, so if someone has a simple solution, that would be great!!<br />
Chris | #50<br />
On September 8, 2010 10:03 pm<br />
Another way of making a box <strong>plot</strong>, a little simpler <strong>and</strong> faster but with not quite as elegant a result, is to use the Volume-High-Low-Open-Close stock<br />
chart.<br />
1. Array your data as shown above, with the quartiles, median, etc.<br />
2. Arrange it so that the data appears in the following order in successive rows:<br />
- Titles<br />
- Median<br />
- 3rd Quartile<br />
- Maximum<br />
- Minimum<br />
- 1st Quartile<br />
This is necessitated by the data order that the chart expects.<br />
3. Create the chart. The primary axis is the “volume” <strong>and</strong> represents the median. The secondary axis is the “stock price (high-low-etc)” <strong>and</strong> represents<br />
5 of 7 7/15/2012 4:00 PM
<strong>Box</strong> <strong>plot</strong> <strong>for</strong> <strong>Excel</strong> <strong>2007</strong> | <strong>Excel</strong> <strong>tutorials</strong>, <strong>templates</strong> <strong>and</strong> <strong>tips</strong> http://www.bloggpro.com/box-<strong>plot</strong>-<strong>for</strong>-excel-<strong>2007</strong>/<br />
the boxes.<br />
4. Select the primary axis <strong>and</strong> change the maximum to be equal to the maximum on the secondary axis. This moves the top of the median bar to its<br />
correct place.<br />
5. Select the <strong>plot</strong>ted boxes <strong>and</strong> change the fill to be semi-transparent. You want the median bar to show through. It will divide the boxes at the median<br />
value.<br />
Though the median bar show up below the <strong>plot</strong>ted boxes, with careful colour selections you can minimize the impact of this.<br />
If you really need to draw a lot of box <strong>plot</strong>s, you should probably be investing in Minitab (which is what I usually use).<br />
Fr. | #51<br />
On August 7, 2010 2:46 am<br />
The best method <strong>for</strong> <strong>Excel</strong> 2008 Mac is there: http://www.coventry.ac.uk/ec/~nhunt/box<strong>plot</strong>.htm<br />
It gives you the right y-range, but the median is marked as a marker instead of the conventional line across the box.<br />
Peter | #52<br />
On July 10, 2010 10:14 am<br />
This was very useful. It did not quite work in <strong>Excel</strong> 2008 <strong>for</strong> Macintosh because the ordering in the stack was different <strong>and</strong> the error bars are set up very<br />
differently. However, with this as a starting point I was able to get the <strong>plot</strong>s that I needed. Thanks.<br />
Hi,<br />
Suresh | #53<br />
Please help me…<br />
On July 5, 2010 9:48 am<br />
I am unable to get the error bar (both minus <strong>and</strong> plus simlatneously) when I apply <strong>for</strong> minus, i get the result, <strong>and</strong> then when you try to apply fror the<br />
plus, the minus error bar disappears.. I am using <strong>2007</strong>. Please let me know where i am going wrong?<br />
NOR | #54<br />
On May 21, 2010 6:20 am<br />
i need a box<strong>plot</strong> <strong>for</strong> my values..please help me..i have already watched how was the trick done on youtube but my values are reall sumthing..pls help..<br />
here are the values..<br />
A<br />
1.63<br />
1.63<br />
1.62<br />
1.63<br />
1.62<br />
1.63<br />
1.63<br />
1.63<br />
1.63<br />
1.63<br />
1.63<br />
1.63<br />
1.62<br />
1.63<br />
1.63<br />
———<br />
B<br />
1.61<br />
6 of 7 7/15/2012 4:00 PM
<strong>Box</strong> <strong>plot</strong> <strong>for</strong> <strong>Excel</strong> <strong>2007</strong> | <strong>Excel</strong> <strong>tutorials</strong>, <strong>templates</strong> <strong>and</strong> <strong>tips</strong> http://www.bloggpro.com/box-<strong>plot</strong>-<strong>for</strong>-excel-<strong>2007</strong>/<br />
1.6<br />
1.6<br />
1.6<br />
1.61<br />
1.62<br />
1.61<br />
1.61<br />
1.54<br />
1.54<br />
1.57<br />
1.54<br />
1.62<br />
1.61<br />
1.61<br />
1. Concours commun dans six Instituts d’Études Politiques | Polit’bistro : des politiques, du café<br />
2. Statistics Resources « verktygsprojektet<br />
3. Using Microsoft <strong>Excel</strong> <strong>2007</strong> to Make <strong>Box</strong> Plots - Let’s Pk<br />
4. How to Make <strong>Box</strong> Plots by Using Microsoft <strong>Excel</strong> <strong>2007</strong> | Technical Communication Center<br />
Go Top<br />
Chelsea | #55<br />
On May 12, 2010 8:14 pm<br />
I don’t underst<strong>and</strong> any of this.<br />
Pages of Comments: « Previous 1 2 3<br />
Copyright © 2010 <strong>Excel</strong> <strong>tutorials</strong>, <strong>templates</strong> <strong>and</strong> <strong>tips</strong>. Theme G-White by Alan Ouyang.<br />
7 of 7 7/15/2012 4:00 PM