Determination of Free Fatty Acids in Palm Oil by Near-Infrared ...
Determination of Free Fatty Acids in Palm Oil by Near-Infrared ...
Determination of Free Fatty Acids in Palm Oil by Near-Infrared ...

You also want an ePaper? Increase the reach of your titles
YUMPU automatically turns print PDFs into web optimized ePapers that Google loves.
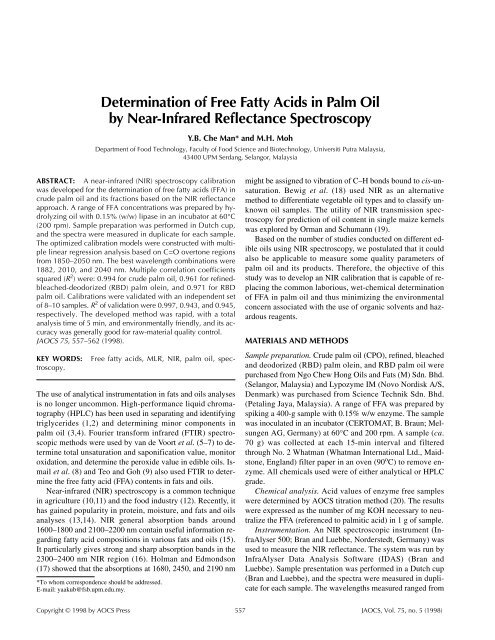
ABSTRACT: A near-<strong>in</strong>frared (NIR) spectroscopy calibration<br />
was developed for the determ<strong>in</strong>ation <strong>of</strong> free fatty acids (FFA) <strong>in</strong><br />
crude palm oil and its fractions based on the NIR reflectance<br />
approach. A range <strong>of</strong> FFA concentrations was prepared <strong>by</strong> hydrolyz<strong>in</strong>g<br />
oil with 0.15% (w/w) lipase <strong>in</strong> an <strong>in</strong>cubator at 60°C<br />
(200 rpm). Sample preparation was performed <strong>in</strong> Dutch cup,<br />
and the spectra were measured <strong>in</strong> duplicate for each sample.<br />
The optimized calibration models were constructed with multiple<br />
l<strong>in</strong>ear regression analysis based on C=O overtone regions<br />
from 1850–2050 nm. The best wavelength comb<strong>in</strong>ations were<br />
1882, 2010, and 2040 nm. Multiple correlation coefficients<br />
squared (R 2 ) were: 0.994 for crude palm oil, 0.961 for ref<strong>in</strong>edbleached-deodorized<br />
(RBD) palm ole<strong>in</strong>, and 0.971 for RBD<br />
palm oil. Calibrations were validated with an <strong>in</strong>dependent set<br />
<strong>of</strong> 8–10 samples. R 2 <strong>of</strong> validation were 0.997, 0.943, and 0.945,<br />
respectively. The developed method was rapid, with a total<br />
analysis time <strong>of</strong> 5 m<strong>in</strong>, and environmentally friendly, and its accuracy<br />
was generally good for raw-material quality control.<br />
JAOCS 75, 557–562 (1998).<br />
KEY WORDS: <strong>Free</strong> fatty acids, MLR, NIR, palm oil, spectroscopy.<br />
The use <strong>of</strong> analytical <strong>in</strong>strumentation <strong>in</strong> fats and oils analyses<br />
is no longer uncommon. High-performance liquid chromatography<br />
(HPLC) has been used <strong>in</strong> separat<strong>in</strong>g and identify<strong>in</strong>g<br />
triglycerides (1,2) and determ<strong>in</strong><strong>in</strong>g m<strong>in</strong>or components <strong>in</strong><br />
palm oil (3,4). Fourier transform <strong>in</strong>frared (FTIR) spectroscopic<br />
methods were used <strong>by</strong> van de Voort et al. (5–7) to determ<strong>in</strong>e<br />
total unsaturation and saponification value, monitor<br />
oxidation, and determ<strong>in</strong>e the peroxide value <strong>in</strong> edible oils. Ismail<br />
et al. (8) and Teo and Goh (9) also used FTIR to determ<strong>in</strong>e<br />
the free fatty acid (FFA) contents <strong>in</strong> fats and oils.<br />
<strong>Near</strong>-<strong>in</strong>frared (NIR) spectroscopy is a common technique<br />
<strong>in</strong> agriculture (10,11) and the food <strong>in</strong>dustry (12). Recently, it<br />
has ga<strong>in</strong>ed popularity <strong>in</strong> prote<strong>in</strong>, moisture, and fats and oils<br />
analyses (13,14). NIR general absorption bands around<br />
1600–1800 and 2100–2200 nm conta<strong>in</strong> useful <strong>in</strong>formation regard<strong>in</strong>g<br />
fatty acid compositions <strong>in</strong> various fats and oils (15).<br />
It particularly gives strong and sharp absorption bands <strong>in</strong> the<br />
2300–2400 nm NIR region (16). Holman and Edmondson<br />
(17) showed that the absorptions at 1680, 2450, and 2190 nm<br />
*To whom correspondence should be addressed.<br />
E-mail: yaakub@fsb.upm.edu.my.<br />
<strong>Determ<strong>in</strong>ation</strong> <strong>of</strong> <strong>Free</strong> <strong>Fatty</strong> <strong>Acids</strong> <strong>in</strong> <strong>Palm</strong> <strong>Oil</strong><br />
<strong>by</strong> <strong>Near</strong>-<strong>Infrared</strong> Reflectance Spectroscopy<br />
Y.B. Che Man* and M.H. Moh<br />
Department <strong>of</strong> Food Technology, Faculty <strong>of</strong> Food Science and Biotechnology, Universiti Putra Malaysia,<br />
43400 UPM Serdang, Selangor, Malaysia<br />
might be assigned to vibration <strong>of</strong> C–H bonds bound to cis-unsaturation.<br />
Bewig et al. (18) used NIR as an alternative<br />
method to differentiate vegetable oil types and to classify unknown<br />
oil samples. The utility <strong>of</strong> NIR transmission spectroscopy<br />
for prediction <strong>of</strong> oil content <strong>in</strong> s<strong>in</strong>gle maize kernels<br />
was explored <strong>by</strong> Orman and Schumann (19).<br />
Based on the number <strong>of</strong> studies conducted on different edible<br />
oils us<strong>in</strong>g NIR spectroscopy, we postulated that it could<br />
also be applicable to measure some quality parameters <strong>of</strong><br />
palm oil and its products. Therefore, the objective <strong>of</strong> this<br />
study was to develop an NIR calibration that is capable <strong>of</strong> replac<strong>in</strong>g<br />
the common laborious, wet-chemical determ<strong>in</strong>ation<br />
<strong>of</strong> FFA <strong>in</strong> palm oil and thus m<strong>in</strong>imiz<strong>in</strong>g the environmental<br />
concern associated with the use <strong>of</strong> organic solvents and hazardous<br />
reagents.<br />
MATERIALS AND METHODS<br />
Sample preparation. Crude palm oil (CPO), ref<strong>in</strong>ed, bleached<br />
and deodorized (RBD) palm ole<strong>in</strong>, and RBD palm oil were<br />
purchased from Ngo Chew Hong <strong>Oil</strong>s and Fats (M) Sdn. Bhd.<br />
(Selangor, Malaysia) and Lypozyme IM (Novo Nordisk A/S,<br />
Denmark) was purchased from Science Technik Sdn. Bhd.<br />
(Petal<strong>in</strong>g Jaya, Malaysia). A range <strong>of</strong> FFA was prepared <strong>by</strong><br />
spik<strong>in</strong>g a 400-g sample with 0.15% w/w enzyme. The sample<br />
was <strong>in</strong>oculated <strong>in</strong> an <strong>in</strong>cubator (CERTOMAT, B. Braun; Melsungen<br />
AG, Germany) at 60°C and 200 rpm. A sample (ca.<br />
70 g) was collected at each 15-m<strong>in</strong> <strong>in</strong>terval and filtered<br />
through No. 2 Whatman (Whatman International Ltd., Maidstone,<br />
England) filter paper <strong>in</strong> an oven (90 o C) to remove enzyme.<br />
All chemicals used were <strong>of</strong> either analytical or HPLC<br />
grade.<br />
Chemical analysis. Acid values <strong>of</strong> enzyme free samples<br />
were determ<strong>in</strong>ed <strong>by</strong> AOCS titration method (20). The results<br />
were expressed as the number <strong>of</strong> mg KOH necessary to neutralize<br />
the FFA (referenced to palmitic acid) <strong>in</strong> 1 g <strong>of</strong> sample.<br />
Instrumentation. An NIR spectroscopic <strong>in</strong>strument (InfraAlyser<br />
500; Bran and Luebbe, Norderstedt, Germany) was<br />
used to measure the NIR reflectance. The system was run <strong>by</strong><br />
InfraAlyser Data Analysis S<strong>of</strong>tware (IDAS) (Bran and<br />
Luebbe). Sample presentation was performed <strong>in</strong> a Dutch cup<br />
(Bran and Luebbe), and the spectra were measured <strong>in</strong> duplicate<br />
for each sample. The wavelengths measured ranged from<br />
Copyright © 1998 <strong>by</strong> AOCS Press 557 JAOCS, Vol. 75, no. 5 (1998)
558 Y.B. CHE MAN AND M.H. MOH<br />
TABLE 1<br />
Samples Used <strong>in</strong> Calibration and Validation Analyzed <strong>by</strong> Standard<br />
Chemical Methodsa FFA (%)<br />
No. <strong>of</strong> samples No. <strong>of</strong> sample Mean<br />
Samples for calibration for validation <strong>of</strong> duplicates Range<br />
CPO<br />
RBD palm<br />
25 10 4.89 3.46–6.20<br />
ole<strong>in</strong><br />
RBD palm<br />
25 10 0.31 0.07–0.52<br />
oil 20 8 0.18 0.07–0.44<br />
aFFA, free fatty acids; CPO, crude palm oil; RBD, ref<strong>in</strong>ed-bleached-deodorized.<br />
1100 to 2500 nm <strong>in</strong> 2-nm <strong>in</strong>tervals (701 data po<strong>in</strong>ts) to obta<strong>in</strong><br />
the entire spectrum.<br />
Calibration and validation procedure. Samples (20–25) <strong>of</strong><br />
each oil type were used as calibration sets for NIR analysis<br />
(Table 1). Data from chemical analysis were entered for each<br />
sample scan. Wavelengths for determ<strong>in</strong>ation <strong>of</strong> FFA were selected<br />
<strong>by</strong> tak<strong>in</strong>g measurements <strong>of</strong> the energy log 1/R values,<br />
where R is reflectance energy, directly from 1850–2050 nm<br />
without any mathematical transformation, followed <strong>by</strong> stepwise<br />
multiple l<strong>in</strong>ear regression (MLR) analysis <strong>of</strong> the reflected<br />
energy at each wavelength po<strong>in</strong>t aga<strong>in</strong>st the concentration.<br />
Separate sets <strong>of</strong> 8–10 samples were used for validation<br />
to verify the reliability <strong>of</strong> the calibration constant.<br />
RESULTS AND DISCUSSION<br />
General concepts. FFA develop naturally <strong>in</strong> CPO and can be<br />
<strong>in</strong>creased <strong>by</strong> the action <strong>of</strong> enzymes <strong>in</strong> the palm fruit and <strong>by</strong><br />
microbial lipases. Dur<strong>in</strong>g storage, FFA were produced <strong>by</strong> reaction<br />
<strong>of</strong> oil with water. Accord<strong>in</strong>g to the <strong>Palm</strong> <strong>Oil</strong> Ref<strong>in</strong>ers<br />
Association <strong>of</strong> Malaysia (PORAM), standard specifications<br />
for the FFA content (as palmitic acid) are: CPO, max. 5.0%;<br />
RBD palm ole<strong>in</strong>, max. 0.1%; and RBD palm oil, max. 0.1%.<br />
For trad<strong>in</strong>g purposes, such standards have to be accomplished.<br />
The rout<strong>in</strong>e procedure to determ<strong>in</strong>e the FFA content <strong>in</strong><br />
palm oil is through the conventional wet-chemical method.<br />
For preparation <strong>of</strong> the standard reagent, analysis, and expression<br />
<strong>of</strong> the result, substantial personnel time and glassware<br />
are required. Therefore, an alternative to reduce the problem<br />
is needed. Based on previous work with FTIR (21), FFA are<br />
characterized <strong>by</strong> their carboxylic acid, C=O, absorption <strong>in</strong> the<br />
mid IR region (1711 cm−1 ). Thus, the determ<strong>in</strong>ation <strong>of</strong> FFA<br />
<strong>in</strong> palm oil <strong>by</strong> NIR is proposed based on the C=O stretch<strong>in</strong>g<br />
bands that lie <strong>in</strong> the overlap region <strong>of</strong> the first overtone and<br />
the comb<strong>in</strong>ation region (1850–2050 nm), as presented <strong>in</strong><br />
Table 2.<br />
Development <strong>of</strong> calibration equations. The orig<strong>in</strong>al FFA<br />
contents used <strong>in</strong> this study were 3.45, 0.07, and 0.07% for<br />
CPO, RBD palm ole<strong>in</strong>, and RBD palm oil, respectively. To<br />
develop a calibration set with a wider range <strong>of</strong> concentration,<br />
the oils were subjected to hydrolysis. In this experiment, the<br />
lipase broke down the fatty acid cha<strong>in</strong>s <strong>of</strong> the triglyceride randomly.<br />
The hydrolysis was accelerated <strong>in</strong> an <strong>in</strong>cubator at<br />
JAOCS, Vol. 75, no. 5 (1998)<br />
TABLE 2<br />
Major Analytical Bands and Their Relative Peak Position<br />
<strong>of</strong> NIR Spectroscopy from 1850–2050 nm<br />
Functional groups Approximate band position (nm)<br />
RCO2H 1880–1900a H2O 1940<br />
RCO2R′ 1900–1950a CO 2020–2050<br />
a Wheeler (Ref. 24). NIR, near <strong>in</strong>frared.<br />
60°C. At 15-m<strong>in</strong> <strong>in</strong>tervals, samples were collected and filtered,<br />
and the FFA contents were determ<strong>in</strong>ed <strong>by</strong> conventional<br />
method. The samples were kept frozen pend<strong>in</strong>g NIR analysis.<br />
Because NIR spectroscopy determ<strong>in</strong>ed the total C=O functional<br />
groups, it was not important which fatty acid was favored<br />
<strong>in</strong> hydrolysis.<br />
Figure 1 represents an overlaid spectrum <strong>of</strong> palm oil from<br />
1100 to 2500 nm. The absorption bands at 2140 and 2190 nm<br />
are due to cis-unsaturation <strong>in</strong> fatty acids (17), whereas<br />
1700–1800 nm and 2200–2400 nm are due to CH stretch<strong>in</strong>g.<br />
The OH absorption band is located at approximately 1940<br />
(22).<br />
For a multiple component system such as palm oil, the relationship<br />
between the absorbance and concentration is not<br />
l<strong>in</strong>ear for a s<strong>in</strong>gle wavelength <strong>by</strong> the NIR spectroscopic<br />
method. The deviations are due to chemical <strong>in</strong>teractions, such<br />
as association, dissociation or <strong>in</strong>teraction <strong>of</strong> the absorb<strong>in</strong>g<br />
species or molecules, or to the difference <strong>in</strong> scatter<strong>in</strong>g and reflect<strong>in</strong>g<br />
<strong>of</strong> radiant power. To overcome the problem, the equation<br />
is expanded to <strong>in</strong>clude more than one wavelength <strong>in</strong> the<br />
MLR analysis. The MLR analysis showed that a three-wavelength<br />
(λ) comb<strong>in</strong>ation (λ 1 , λ 2 , λ 3 ) was adequate to produce<br />
good calibration (Table 3). Addition <strong>of</strong> one other wavelength<br />
(e.g., 1902 nm) did not improve the calibration results. The<br />
determ<strong>in</strong>ation was based on the highest multiple correlation<br />
coefficient (R 2 ) with smallest standard error <strong>of</strong> estimate (SEE)<br />
<strong>of</strong> calibration. The regression models to predict FFA contents<br />
<strong>by</strong> NIR spectroscopy can be written <strong>in</strong> equation form as<br />
below:<br />
FFA = −4.26 + 15.47λ 1 − 831.71λ 2 + 844.87λ 3<br />
FFA = −5.53 − 98.61λ 1 − 474.30λ 2 + 591.38λ 3<br />
FFA = −8.47 − 57.61λ 1 − 522.62λ 2 + 608.65λ 3<br />
TABLE 3<br />
Effect <strong>of</strong> Different Wavelengths with 2040 nm as Measurement<br />
Wavelength <strong>in</strong> Construct<strong>in</strong>g the Calibrations <strong>in</strong> <strong>Palm</strong> <strong>Oil</strong> Samples<br />
Reference<br />
CPO RBD palm ole<strong>in</strong> RBD palm oil<br />
wavelengths (nm) SEEa R2a SEE R2 SEE R2 None 0.52 0.81 0.11 0.59 0.08 0.16<br />
2010 0.09 0.99 0.06 0.92 0.04 0.85<br />
2010, 1882 0.09 0.99 0.04 0.96 0.03 0.97<br />
a SEE = standard error <strong>of</strong> estimate. R 2 = multiple correlation coefficient. For<br />
other abbreviations see Table 1.<br />
[1]<br />
[2]<br />
[3]
where Equation 1 is for determ<strong>in</strong><strong>in</strong>g FFA content <strong>in</strong> CPO,<br />
Equation 2 for RBD palm ole<strong>in</strong>, and Equation 3 for RBD<br />
palm oil, respectively.<br />
The standard deviations (SD) for all samples at the selected<br />
wavelengths are given <strong>in</strong> Table 4. The multiple correlation<br />
coefficient <strong>of</strong> calibration, R 2 , for CPO is 0.994, for<br />
RBD palm ole<strong>in</strong> 0.961, and for RBD palm oil 0.971. The high<br />
DETERMINATION OF FREE FATTY ACIDS IN PALM OIL 559<br />
FIG. 1. Orig<strong>in</strong>al (A) and first-derivative (B) near-<strong>in</strong>frared spectra <strong>of</strong> palm oil samples.<br />
coefficients were the result <strong>of</strong> repeated calibration processes<br />
(two times) that excluded large outliers. For the calibration<br />
set, the stepwise regression process excluded two sets <strong>of</strong> values<br />
as outliers from CPO, one set from RBD palm ole<strong>in</strong>, and<br />
one set from RBD palm oil. The values <strong>of</strong> SEE for calibration<br />
decrease as the number <strong>of</strong> the wavelengths <strong>in</strong>creases<br />
(Table 3). The f<strong>in</strong>al SEE values from three wavelengths for<br />
TABLE 4<br />
Standard Deviation Values at Selected Wavelengths Obta<strong>in</strong>ed for Both Calibration<br />
and Validation Sets <strong>by</strong> Multiple L<strong>in</strong>ear Regressiona Wavelengths (nm)<br />
1882 2010 2040 R2 Bias RMSEP<br />
Calibration sets<br />
CPO 0.003 0.003 0.004 0.994 — 0.008<br />
RBD palm ole<strong>in</strong> 0.002 0.002 0.003 0.961 — 0.041<br />
RBD palm oil 0.002 0.002 0.002 0.971 — 0.026<br />
Validation sets<br />
CPO 0.004 0.004 0.004 0.997 0.002 0.077<br />
RBD palm ole<strong>in</strong> 0.002 0.002 0.002 0.943 −0.003 0.041<br />
RBD palm oil 0.004 0.004 0.004 0.945 −0.003 0.059<br />
a 2 R , multiple correlation coefficient; RMSEP, root mean square error <strong>of</strong> prediction. For other abbreviations<br />
see Table 1.<br />
JAOCS, Vol. 75, no. 5 (1998)
560 Y.B. CHE MAN AND M.H. MOH<br />
CPO were 0.09, for RBD palm ole<strong>in</strong> 0.04, and for RBD palm<br />
oil 0.03.<br />
Validation <strong>of</strong> calibration equations. Once the calibration<br />
equations were developed, the applicability <strong>of</strong> the equations<br />
was confirmed through validation <strong>of</strong> the calibration with 8–10<br />
external sets <strong>of</strong> samples, which were not <strong>in</strong>cluded <strong>in</strong> construct<strong>in</strong>g<br />
the calibration. The multiple corrrelation coefficients<br />
<strong>of</strong> validation, R 2 , obta<strong>in</strong>ed were: 0.997, 0.943, and<br />
0.945, respectively. These R 2 for validation samples were<br />
close to those <strong>of</strong> calibration samples, though no outliers were<br />
<strong>in</strong>cluded. The equations for the validation sets were: FFA =<br />
3.13 + 103.38λ 1 − 1059.65λ 2 + 965.43λ 3 for CPO, FFA =<br />
−2.40 − 102.35λ 1 − 586.39λ 2 + 698.39λ 3 for RBD palm ole<strong>in</strong>,<br />
and FFA = −3.52 − 117.00λ 1 − 418.42λ 2 + 548.15λ 3 for RBD<br />
palm oil.<br />
Figures 2, 3, and 4 illustrate the distribution <strong>of</strong> the predicted<br />
data <strong>in</strong> reference to the calibration regressions for the<br />
NIR method (%)<br />
FIG. 2. Scatter diagrams <strong>of</strong> calibration (A) and validation (B) data <strong>of</strong> free<br />
fatty acid content <strong>in</strong> percentage for crude palm oil. R 2 , multiple correlation<br />
coefficient; NIR, near <strong>in</strong>frared.<br />
JAOCS, Vol. 75, no. 5 (1998)<br />
FIG. 3. Scatter diagrams <strong>of</strong> calibration (A) and validation (B) data <strong>of</strong> free<br />
fatty acid content <strong>in</strong> percentage for ref<strong>in</strong>ed, bleached, deodorized palm<br />
ole<strong>in</strong>. For other abbreviations see Figure 2.<br />
CPO, RBD palm ole<strong>in</strong>, and RBD palm oil, respectively. The<br />
data <strong>in</strong>dicate that prediction <strong>by</strong> NIR spectroscopy with MLR<br />
analysis is l<strong>in</strong>ear (23) throughout the ranges tested. The quality<br />
<strong>of</strong> the predictive ability <strong>of</strong> calibration can be further justified<br />
from the m<strong>in</strong>or squared differences <strong>of</strong> the root mean<br />
square error <strong>of</strong> prediction between the chemical and NIR values<br />
(Table 3). The close-to-zero bias values (≤ ±0.03) <strong>in</strong>dicate<br />
that there were no systematic error <strong>in</strong> the predicted values,<br />
and the slopes <strong>of</strong> the regression l<strong>in</strong>es or the skew values<br />
were close to one (i.e., CPO 0.993, RBD palm ole<strong>in</strong> 1.005,<br />
and RBD palm oil 0.956 and also showed that there was significant<br />
systematic variation <strong>in</strong> the predicted values.<br />
Results from this study <strong>in</strong>dicate that NIR spectroscopy is a<br />
useful technique for measur<strong>in</strong>g palm oil quality parameters<br />
such as FFA. The total analysis takes less than 5 m<strong>in</strong> once the<br />
spectrometer is precalibrated. Compared to the conventional
FIG. 4. Scatter diagrams <strong>of</strong> calibration (A) and validation (B) data <strong>of</strong> free<br />
fatty acid content <strong>in</strong> percentage for ref<strong>in</strong>ed, bleached, deodorized palm<br />
oil. For other abbreviations see Figure 2.<br />
wet chemical analysis, NIR spectroscopy is capable <strong>of</strong> measur<strong>in</strong>g<br />
a hundred samples <strong>in</strong> a day and yet still meets the trad<strong>in</strong>g<br />
specification. In addition, <strong>by</strong> apply<strong>in</strong>g this technique, the<br />
amount <strong>of</strong> hazardous solvents can be reduced dramatically as<br />
well as the cost <strong>of</strong> labor.<br />
ACKNOWLEDGMENTS<br />
The authors are grateful to the Universiti Putra Malaysia for provid<strong>in</strong>g<br />
fund<strong>in</strong>g (IRPA No. 03-02-04-048)for this work. Gratitude is also<br />
expressed to T.S. Tang <strong>of</strong> PORIM for his technical assistance and<br />
Chemopharm Sdn. Bhd. for the NIR spectroscopic <strong>in</strong>strument.<br />
REFERENCES<br />
1. Plattner, R.D., G.F. Spencer, and R. Kleiman, Triglyceride Separation<br />
<strong>by</strong> Reversed Phase High Performance Liquid Chromatography,<br />
J. Am. <strong>Oil</strong> Chem. Soc. 54:511–515 (1977).<br />
DETERMINATION OF FREE FATTY ACIDS IN PALM OIL 561<br />
2. Swe, P.Z., Y.B. Che Man, and H.M. Ghazali, Improved NARP-<br />
HPLC Method for Separat<strong>in</strong>g Triglycerides <strong>of</strong> <strong>Palm</strong> Ole<strong>in</strong> and<br />
Its Solid Fractions Obta<strong>in</strong>ed at Low Temperature Storage, Food<br />
Chem. 56:181–186 (1996).<br />
3. Choo, Y.M., and A. Gapor, M<strong>in</strong>or Components from <strong>Palm</strong><br />
Methyl Ester, <strong>Palm</strong> <strong>Oil</strong> Developments, <strong>Palm</strong> <strong>Oil</strong> Research Institute<br />
<strong>of</strong> Malaysia, M<strong>in</strong>istry <strong>of</strong> Primary Industries, Malaysia 14:<br />
39–44 (1990).<br />
4. Yap, S.C., Y.M. Choo, C.K. Ooi, A.S.H. Ong, and S.H. Goh,<br />
Quantitative Analysis <strong>of</strong> Carotenes <strong>in</strong> <strong>Palm</strong> <strong>Oil</strong>, ELAEIS, <strong>Palm</strong><br />
<strong>Oil</strong> Research Institute <strong>of</strong> Malaysia, M<strong>in</strong>istry <strong>of</strong> Primary Industries,<br />
Malaysia 2:369–377 (1991).<br />
5. van de Voort, F.R., J. Sedman, G. Emo, and A.A. Ismail, Rapid<br />
and Direct Iod<strong>in</strong>e Value and Saponification Number <strong>Determ<strong>in</strong>ation</strong><br />
<strong>of</strong> Fats and <strong>Oil</strong>s <strong>by</strong> Attenuated Total Reflectance/Fourier<br />
Transform <strong>Infrared</strong> Spectroscopy, J. Am. <strong>Oil</strong> Chem. Soc. 69:<br />
1118–1123 (1992).<br />
6. van de Voort, F.R., A.A. Isamil, J. Sedman, and G. Emo, Monitor<strong>in</strong>g<br />
the Oxidation <strong>of</strong> Edible <strong>Oil</strong>s <strong>by</strong> Fourier Transform <strong>Infrared</strong><br />
Spectroscopy, Ibid. 71:243–253 (1994).<br />
7. van de Voort, F.R., A.A. Isamil, J. Dubois, and T. Nicodemo,<br />
The <strong>Determ<strong>in</strong>ation</strong> <strong>of</strong> Peroxide Value <strong>by</strong> Fourier Transform <strong>Infrared</strong><br />
Spectroscopy, Ibid. 71:921–926 (1994).<br />
8. Ismail, A.A., F.R. van de Voort, G. Emo, and J. Sedman, Rapid<br />
Quantitative <strong>Determ<strong>in</strong>ation</strong> <strong>of</strong> <strong>Free</strong> <strong>Fatty</strong> <strong>Acids</strong> <strong>in</strong> Fats and <strong>Oil</strong>s<br />
<strong>by</strong> Fourier Transform <strong>Infrared</strong> Spectroscopy, Ibid. 70:335–341<br />
(1993).<br />
9. Teo, W.B., and E.M. Goh, <strong>Determ<strong>in</strong>ation</strong> <strong>of</strong> the Total Unsaturation,<br />
<strong>Free</strong> <strong>Fatty</strong> Acid Content and Saponification Value <strong>in</strong> <strong>Palm</strong><br />
<strong>Oil</strong> <strong>by</strong> Fourier Transform <strong>Infrared</strong> Spectroscopy, Mal. <strong>Oil</strong> Sci.<br />
Tech. 4:178–181 (1995).<br />
10. Albanell, E., J. Plaixats, A. Ferret, L. Bosch, and F. Casanas,<br />
Evaluation <strong>of</strong> <strong>Near</strong>-<strong>Infrared</strong> Reflectance Spectroscopy for Predict<strong>in</strong>g<br />
Stover Quality Trait <strong>in</strong> Semi-Exotic Populations <strong>of</strong><br />
Maize, J. Sci. Food Agric. 69:269–273 (1995).<br />
11. Delwiche, S.R., K.S. McKenzie, and B.D. Webb, Quality Characteristics<br />
<strong>in</strong> Rice <strong>by</strong> <strong>Near</strong>-<strong>Infrared</strong> Reflectance Analysis <strong>of</strong><br />
Whole-Gra<strong>in</strong> Milled Samples, Cereal Chem. 73:257–263<br />
(1996).<br />
12. Ja<strong>in</strong>, P.C., <strong>Near</strong> <strong>Infrared</strong> Spectroscopy—A New Technique for<br />
Sugar Analysis, Indian Sugar 45:303–304 (1995).<br />
13. Hurburgh, C.R., Jr., Y. Wu, and J. Siska, Effect <strong>of</strong> Seed Size and<br />
Density on <strong>Near</strong>-<strong>Infrared</strong> Transmittance Analysis <strong>of</strong> Corn and<br />
Soybeans, Appl. Eng. Agric. 11:677–684 (1995).<br />
14. Wold, J.P., T. Jakobsen, and L. Krane, Atlantic Salmon Average<br />
Fat Content Estimated <strong>by</strong> <strong>Near</strong>-<strong>Infrared</strong> Transmittance<br />
Spectroscopy, J. Food Sci. 61:74–77 (1996).<br />
15. Sato, T., S. Kawano, and M. Iwamoto, <strong>Near</strong> <strong>Infrared</strong> Spectral<br />
Patterns <strong>of</strong> <strong>Fatty</strong> Acid Analysis from Fats and <strong>Oil</strong>s, J. Am. <strong>Oil</strong><br />
Chem. Soc. 68:827–833 (1991).<br />
16. Sato, T., Application <strong>of</strong> Pr<strong>in</strong>cipal-Component Analysis on <strong>Near</strong>-<br />
<strong>Infrared</strong> Spectroscopic Data <strong>of</strong> Vegetable <strong>Oil</strong>s for Their Classification,<br />
Ibid. 71:293–298 (1994).<br />
17. Holman, R.T., and P.R. Edmondson, <strong>Near</strong> <strong>Infrared</strong> Spectra <strong>of</strong><br />
<strong>Fatty</strong> <strong>Acids</strong> and Related Substances, Anal. Chem. 28:1533–1538<br />
(1956).<br />
18. Bewig, K.M., A.D. Clarke, C. Robert, and N. Unklesbay, Discrim<strong>in</strong>ant<br />
Analysis <strong>of</strong> <strong>Oil</strong>s <strong>by</strong> <strong>Near</strong>-<strong>Infrared</strong> Reflectance Spectroscopy,<br />
J. Am. <strong>Oil</strong> Chem. Soc. 71:195–200 (1994).<br />
19. Orman, B.A., and R.A. Schumann, Jr., Nondestructive S<strong>in</strong>gle-<br />
Kernel <strong>Oil</strong> <strong>Determ<strong>in</strong>ation</strong> <strong>of</strong> Maize <strong>by</strong> <strong>Near</strong>-<strong>Infrared</strong> Transmission<br />
Spectroscopy, Ibid. 69:1036–1038 (1992).<br />
20. AOCS, Official Methods and Recommended Practices <strong>of</strong> the<br />
American <strong>Oil</strong> Chemists’ Society, 4th edn., American <strong>Oil</strong><br />
Chemists’ Society, Champaign, 1989.<br />
21. Moh, M.H., Y.B. Che Man, and B.S. Badlishah, A Prelim<strong>in</strong>ary<br />
Study on Quantitative <strong>Determ<strong>in</strong>ation</strong> <strong>of</strong> <strong>Free</strong> <strong>Fatty</strong> <strong>Acids</strong> <strong>in</strong><br />
JAOCS, Vol. 75, no. 5 (1998)
562 Y.B. CHE MAN AND M.H. MOH<br />
Crude <strong>Palm</strong> <strong>Oil</strong> <strong>by</strong> Fourier Transform <strong>Infrared</strong> Spectroscopy, <strong>in</strong><br />
National Conference on Industry 2000: Technology and Opportunities,<br />
Kuala Lumpur, 1997.<br />
22. Curcio, J.A., and C.C. Petty, The <strong>Near</strong> <strong>Infrared</strong> Absorption<br />
Spectrum <strong>of</strong> Liquid Water, J. Optical Soc. Am. 41:302–304<br />
(1951).<br />
JAOCS, Vol. 75, no. 5 (1998)<br />
23. DiFoggio, R., Exam<strong>in</strong>ation <strong>of</strong> Some Misconceptions About<br />
<strong>Near</strong>-<strong>Infrared</strong> Analysis, Appl. Spectrosc. 49:67–75 (1995).<br />
24. Wheeler, O.H., <strong>Near</strong> <strong>Infrared</strong> Spectra <strong>of</strong> Organic Compounds,<br />
Chem. Rev. 59:629–666 (1959).<br />
[Received August 4, 1997; accepted December 1, 1997]