The 2/20-Day EMA Breakout System by - Forex Factory
The 2/20-Day EMA Breakout System by - Forex Factory
The 2/20-Day EMA Breakout System by - Forex Factory
You also want an ePaper? Increase the reach of your titles
YUMPU automatically turns print PDFs into web optimized ePapers that Google loves.
Stocks & Commodities V14:12 (526-529): <strong>The</strong> 2/<strong>20</strong>-<strong>Day</strong> <strong>EMA</strong> <strong>Breakout</strong> <strong>System</strong> <strong>by</strong> David S. Landry<br />
TRADING TECHNIQUES<br />
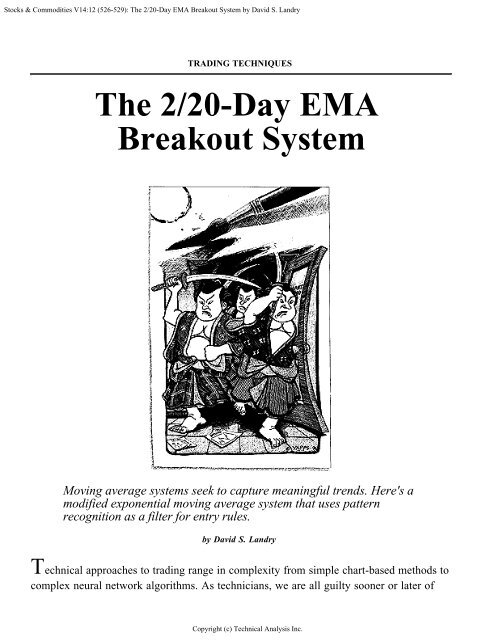
<strong>The</strong> 2/<strong>20</strong>-<strong>Day</strong> <strong>EMA</strong><br />
<strong>Breakout</strong> <strong>System</strong><br />
Moving average systems seek to capture meaningful trends. Here's a<br />
modified exponential moving average system that uses pattern<br />
recognition as a filter for entry rules.<br />
<strong>by</strong> David S. Landry<br />
Technical approaches to trading range in complexity from simple chart-based methods to<br />
complex neural network algorithms. As technicians, we are all guilty sooner or later of<br />
Copyright (c) Technical Analysis Inc.
Stocks & Commodities V14:12 (526-529): <strong>The</strong> 2/<strong>20</strong>-<strong>Day</strong> <strong>EMA</strong> <strong>Breakout</strong> <strong>System</strong> <strong>by</strong> David S. Landry<br />
trying to reinvent the wheel with elaborate technical analysis. We'd all like to find the Holy<br />
Grail of an indicator that will make us rich. I have spent countless hours searching for<br />
such an indicator, only to rediscover something far less complex. <strong>The</strong> truth is this: <strong>The</strong>re<br />
is no perfect indicator or system that will lead to riches while avoiding all risk.<br />
Should you give up? Quite the contrary; the fact is that many simple indicators work well.<br />
You can use numerous off-the-shelf indicators and be quite effective as a technician. Let<br />
me explain how I rediscovered the moving average and developed a system based on it.<br />
I've always found the <strong>20</strong>-day moving average useful. It represents<br />
approximately one month of trading and provides a simple but<br />
accurate representation of the trend direction of a commodity<br />
market.<br />
ALWAYS USEFUL<br />
I've always found the <strong>20</strong>-day moving average useful. It represents approximately one<br />
month of trading and provides a simple but accurate representation of the trend direction<br />
of a commodity market. An exponential moving average (<strong>EMA</strong>) is even better because it<br />
weights the most recent periods heavier than it does previous periods, unlike the simple<br />
moving average, which weights each price equally. Early on in my technical studies, I<br />
spent a great deal of time working with moving averages but soon became enticed <strong>by</strong> more<br />
complex studies while searching for the perfect indicator.<br />
While developing my latest system, I began to get frustrated when the indicator failed to<br />
test out. As I pondered how I could make it more complex, I noticed that the <strong>20</strong>-day <strong>EMA</strong><br />
I had plotted as a default seemed to work much better at predicting prices than my latest<br />
system did. As time passed, I began to pay more attention to how the prices behaved<br />
around the <strong>20</strong>-day <strong>EMA</strong>.<br />
I found it intriguing that the <strong>20</strong>-day <strong>EMA</strong> seemed to perform better than an indicator I had<br />
spent months developing. I began an in-depth study of the behavior of prices in respect to<br />
their <strong>20</strong>-day <strong>EMA</strong>s; in some cases, I went back as far as 30 years. At first glance I was<br />
amazed, as numerous moves involved a simple breakout from the <strong>20</strong>-day <strong>EMA</strong>. Many of<br />
these prices stayed above or below the moving average for the majority of the trend.<br />
And as you might have expected, my optimistic eye picked out all of the perfect trades and<br />
well-chosen examples. Classic historical moves such as gold in the early 1980s, sugar in the<br />
mid-1970s, coffee in 1994 and the yen in 1995 sparked my interest (Figures 1 through 4).<br />
Copyright (c) Technical Analysis Inc.
Stocks & Commodities V14:12 (526-529): <strong>The</strong> 2/<strong>20</strong>-<strong>Day</strong> <strong>EMA</strong> <strong>Breakout</strong> <strong>System</strong> <strong>by</strong> David S. Landry<br />
FIGURE 1: APRIL 1980 GOLD. A <strong>20</strong>-day moving average-based trend-following system can be on the<br />
right side of powerful trends, such as the bull market in gold in late 1979 and into early 1980.<br />
Copyright (c) Technical Analysis Inc.
Stocks & Commodities V14:12 (526-529): <strong>The</strong> 2/<strong>20</strong>-<strong>Day</strong> <strong>EMA</strong> <strong>Breakout</strong> <strong>System</strong> <strong>by</strong> David S. Landry<br />
FIGURE 2: SEPTEMBER 1995 YEN. <strong>The</strong> currency markets have offered some very strong trends in the<br />
past.<br />
FIGURE 3: MARCH 1975 SUGAR. Sometimes a trend is so strong that the futures contract will not<br />
trade due to exchange-imposed price limits (the dashes) for the trading day.<br />
Copyright (c) Technical Analysis Inc.
Stocks & Commodities V14:12 (526-529): <strong>The</strong> 2/<strong>20</strong>-<strong>Day</strong> <strong>EMA</strong> <strong>Breakout</strong> <strong>System</strong> <strong>by</strong> David S. Landry<br />
FIGURE 4: DECEMBER 1994 COFFEE. Again, the <strong>20</strong>-day moving average-based trend-following system<br />
captured some nice trends.<br />
DEFINING A FILTER<br />
After the initial euphoria of my "rediscovery" wore off, I began to take more of a<br />
pragmatic view of the moving average. I noticed that although there were large trends,<br />
significant market movements were often preceded or followed <strong>by</strong> periods of trendless<br />
price activity. <strong>The</strong>se were extended periods of sideways movement where the price would<br />
penetrate the moving average, only to trade back to and sometimes through it, resulting in<br />
what system designers refer to as whipsawing †. In many cases, there would be numerous<br />
false reversal signals.<br />
Copyright (c) Technical Analysis Inc.
Stocks & Commodities V14:12 (526-529): <strong>The</strong> 2/<strong>20</strong>-<strong>Day</strong> <strong>EMA</strong> <strong>Breakout</strong> <strong>System</strong> <strong>by</strong> David S. Landry<br />
FIGURE 5: AUGUST 1992 FEEDER CATTLE. During period A, the trend-following system suffered<br />
numerous false signals until the breakout at point B. <strong>The</strong> upward trend stayed above the <strong>20</strong>-day moving<br />
average all the way to point C.<br />
From this experience, I realized that a breakout filter would be needed in an attempt to<br />
avoid false signals. Although <strong>by</strong> simply buying when prices rose above the moving average<br />
and selling when prices fell below would be profitable in the long run, in the short term<br />
you could get whipsawed. Further, you could become discouraged, lose your confidence<br />
and not take the next trade - and that trade would invariably have been the inevitable big<br />
winner. Remember, markets only trend around 30% of the time. Figure 5, showing<br />
August 1992 feeder cattle, is a good example.<br />
Continuing my search for a filter, I observed that the price has a tendency to return to the<br />
<strong>20</strong>-day <strong>EMA</strong> (technically, this is known as mean reverting ). As long as there were no<br />
breakouts, the price range remains close to or intersects the <strong>20</strong>-day <strong>EMA</strong>.<br />
In most cases, true breakouts occurred only after the entire day's range in price had<br />
cleared the <strong>20</strong>-day <strong>EMA</strong>. During an upside breakout, the low of the price bar shouldn't<br />
intersect the <strong>EMA</strong>. For a downside breakout, the high should be lower than the <strong>20</strong>-day<br />
<strong>EMA</strong>. Upon further observation, in most cases profitable trends began after the prices<br />
Copyright (c) Technical Analysis Inc.
Stocks & Commodities V14:12 (526-529): <strong>The</strong> 2/<strong>20</strong>-<strong>Day</strong> <strong>EMA</strong> <strong>Breakout</strong> <strong>System</strong> <strong>by</strong> David S. Landry<br />
cleared the <strong>20</strong>-day <strong>EMA</strong> for at least two days. <strong>The</strong>refore, for a buy alert the last two lows<br />
should not intersect the <strong>20</strong>-day <strong>EMA</strong>. For sell signals, the highs should not intersect the<br />
<strong>20</strong>-day <strong>EMA</strong>. (See sidebar, "2/<strong>20</strong>-day <strong>EMA</strong> breakout system defined.")<br />
DETAILS<br />
In most cases, after a setup is alerted, prices either break away and begin to trend nicely or<br />
move back toward the <strong>20</strong>-day <strong>EMA</strong> to consolidate. To ensure that the trade is placed<br />
correctly in the trend direction of the possible breakout, use an open-stop order placed 10<br />
ticks above the highest high in the two-day setup for buy signals or 10 ticks below the<br />
lowest low in the two-day setup for sell signals. This is akin to a secondary filter, and is<br />
one additional check to avoid whipsaws.<br />
Setting stops. Once in a position, setting stops poses a dilemma. Too tight a stop will<br />
almost always be hit and guarantee a loss on a trade. This can be frustrating, as all too<br />
often, the commodity resumes its original trend. Too loose a stop, on the other hand, gives<br />
the position a chance to work, but puts too much at risk. Because this system is based on a<br />
breakout of the <strong>20</strong>-day <strong>EMA</strong>, if the contract trades back to the <strong>20</strong>-day <strong>EMA</strong>, it is a sign of<br />
a possible reversal. With this in mind, this is the maximum point at which the stop should<br />
be placed to limit the loss.<br />
Contract selection. What contracts to trade? I have found that the system works<br />
especially well in contracts such as currencies where breakouts holding for more than two<br />
days are usually followed <strong>by</strong> some intermediate- to long-term fundamentals. Before<br />
trading any commodity with this or any other system, you should test it thoroughly.<br />
Remember, each market will have its own nuances. What works with one commodity<br />
won't necessarily work with others. No system should be blindly applied to all markets.<br />
Number of contracts to trade. This is a breakout system that attempts to catch large<br />
moves that may take some time to develop. Catching a longer-term move requires a wider<br />
stop (see the paragraph on setting stops). Although a wider stop will increase your<br />
potential losses per trade, it should decrease the number of trades and reward you with<br />
larger profits once the elusive trend is caught. With this in mind, the idea is to trade fewer<br />
contracts in an attempt to catch larger moves. Resist the temptation of maximizing<br />
leverage. You can make healthy profits with a good breakout system <strong>by</strong> trading only<br />
singles with one contract per signal.<br />
Copyright (c) Technical Analysis Inc.
Stocks & Commodities V14:12 (526-529): <strong>The</strong> 2/<strong>20</strong>-<strong>Day</strong> <strong>EMA</strong> <strong>Breakout</strong> <strong>System</strong> <strong>by</strong> David S. Landry<br />
FIGURE 6: TRADING RESULTS. Here are the results of using the trading rules on continuous data for<br />
the yen futures contract from January 1990 through October 1995. <strong>The</strong> line represents the equity and<br />
the histograms are the individual profits and losses.<br />
Results. <strong>The</strong> continuous yen futures contract from January 1990 through October 1995<br />
was used as an example of possible results (Figure 6). No commissions or slippage were<br />
used; the reader can insert relevant values. Overnight gap openings were taken into<br />
consideration <strong>by</strong> setting the entry equal to the open.<br />
BEFORE YOU DIVE IN<br />
Before using any system, you should paper-trade it in both historical and real time until<br />
you are comfortable with its nuances and risks. Resist the temptation of having your<br />
computer do all the work for you. <strong>The</strong>re is no way to simulate the emotions that you will<br />
encounter with real money on the line, but at least through hand-testing, you will be forced<br />
to look at and question every trade. Just as I have used the two-day breakout as a filter for<br />
trading the <strong>20</strong>-day <strong>EMA</strong>, the entire system could be used as a filter in a larger system. Just<br />
remember to limit the degree of complexity of the system and don't bother looking for the<br />
Holy Grail. What you've got in front of you may well be just what you need.<br />
David Landry is a Commodity Trading Advisor and president of Sentive Trading<br />
Copyright (c) Technical Analysis Inc.
Stocks & Commodities V14:12 (526-529): <strong>The</strong> 2/<strong>20</strong>-<strong>Day</strong> <strong>EMA</strong> <strong>Breakout</strong> <strong>System</strong> <strong>by</strong> David S. Landry<br />
Company. He has an MBA and an undergraduate degree in computer science. He may be<br />
reached <strong>by</strong> E-mail at sentivetradingco@prodigy.com.<br />
RELATED READING<br />
Achelis, Steven B. [1995]. Technical Analysis from A to Z, Irwin Publishing.<br />
end<br />
end<br />
end<br />
end<br />
end<br />
end<br />
end<br />
Copyright (c) Technical Analysis Inc.
Stocks & Commodities V14:12 (526-529): Sidebar: 2/<strong>20</strong>-<strong>Day</strong> <strong>EMA</strong> <strong>Breakout</strong> <strong>System</strong> Defined<br />
SYSTEM DEFINED<br />
2/<strong>20</strong>-DAY <strong>EMA</strong> BREAKOUT<br />
Buy alert: If today's low and yesterday's low is greater than the <strong>20</strong>-day <strong>EMA</strong>. This<br />
signal remains valid until the low touches or falls below the <strong>20</strong>-day <strong>EMA</strong>.<br />
Buy entry: Place a stop order 10 ticks above the two-day high. This will help ensure<br />
buying with the new trend and help to avoid false signals. Keep order until filled or as<br />
long as the buy alert is still valid.<br />
Long exit: Place a stop equal to the <strong>20</strong>-day <strong>EMA</strong>. Continue to update this stop daily to<br />
form a trailing stop.<br />
Sell alert: If today's high and yesterday's high is less than the <strong>20</strong>-day <strong>EMA</strong>. This signal<br />
remains valid until the high touches or rises above the <strong>20</strong>-day <strong>EMA</strong>.<br />
Sell entry: Place a stop order 10 ticks below the two-day low. This will help ensure that<br />
you will sell with the new trend and help to avoid false signals. Keep order until filled or<br />
as long as the sell alert is still valid.<br />
Short exit: Place a stop equal to the <strong>20</strong>-day <strong>EMA</strong>. Continue to update this stop daily to<br />
form a trailing stop.<br />
end<br />
end<br />
end<br />
Copyright (c) Technical Analysis Inc.


