


You also want an ePaper? Increase the reach of your titles
YUMPU automatically turns print PDFs into web optimized ePapers that Google loves.
National Association of State Boards of Education<br />
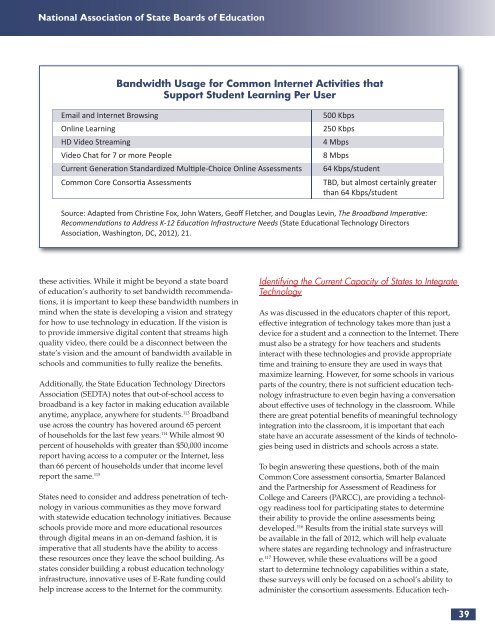
Bandwidth Usage for Common Internet Activities that<br />
Support Student Learning Per User<br />
Email and Internet Browsing 500 Kbps<br />
Online Learning 250 Kbps<br />
HD Video Streaming 4 Mbps<br />
Video Chat for 7 or more People 8 Mbps<br />
Current Genera� on Standardized Mul� ple-Choice Online Assessments 64 Kbps/student<br />
Common Core Consor� a Assessments TBD, but almost certainly greater<br />
than 64 Kbps/student<br />
Source: Adapted from Chris� ne Fox, John Waters, Geoff Fletcher, and Douglas Levin, The Broadband Impera� ve:<br />
Recommenda� ons to Address K-12 Educa� on Infrastructure Needs (State Educa� onal Technology Directors<br />
Associa� on, Washington, DC, 2012), 21.<br />
these activities. While it might be beyond a state board<br />
of education’s authority to set bandwidth recommendations,<br />
it is important to keep these bandwidth numbers in<br />
mind when the state is developing a vision and strategy<br />
for how to use technology in education. If the vision is<br />
to provide immersive digital content that streams high<br />
quality video, there could be a disconnect between the<br />
state’s vision and the amount of bandwidth available in<br />
schools and communities to fully realize the benefi ts.<br />
Additionally, the State Education Technology Directors<br />
Association (SEDTA) notes that out-of-school access to<br />
broadband is a key factor in making education available<br />
anytime, anyplace, anywhere for students. 113 Broadband<br />
use across the country has hovered around 65 percent<br />
of households for the last few years. 114 While almost 90<br />
percent of households with greater than $50,000 income<br />
report having access to a computer or the Internet, less<br />
than 66 percent of households under that income level<br />
report the same. 115<br />
States need to consider and address penetration of technology<br />
in various communities as they move forward<br />
with statewide education technology initiatives. Because<br />
schools provide more and more educational resources<br />
through digital means in an on-demand fashion, it is<br />
imperative that all students have the ability to access<br />
these resources once they leave the school building. As<br />
states consider building a robust education technology<br />
infrastructure, innovative uses of E-Rate funding could<br />
help increase access to the Internet for the community.<br />
Identifying the Current Capacity of States to Integrate<br />
Technology<br />
As was discussed in the educators chapter of this report,<br />
effective integration of technology takes more than just a<br />
device for a student and a connection to the Internet. There<br />
must also be a strategy for how teachers and students<br />
interact with these technologies and provide appropriate<br />
time and training to ensure they are used in ways that<br />
maximize learning. However, for some schools in various<br />
parts of the country, there is not suffi cient education technology<br />
infrastructure to even begin having a conversation<br />
about effective uses of technology in the classroom. While<br />
there are great potential benefi ts of meaningful technology<br />
integration into the classroom, it is important that each<br />
state have an accurate assessment of the kinds of technologies<br />
being used in districts and schools across a state.<br />
To begin answering these questions, both of the main<br />
Common Core assessment consortia, Smarter Balanced<br />
and the Partnership for Assessment of Readiness for<br />
College and Careers (PARCC), are providing a technology<br />
readiness tool for participating states to determine<br />
their ability to provide the online assessments being<br />
developed. 116 Results from the initial state surveys will<br />
be available in the fall of 2012, which will help evaluate<br />
where states are regarding technology and infrastructure<br />
e. 117 However, while these evaluations will be a good<br />
start to determine technology capabilities within a state,<br />
these surveys will only be focused on a school’s ability to<br />
administer the consortium assessments. Education tech-<br />
39