

Geo11_89_Baltanas_Danielopol_Geometric_Morphometrics
Geo11_89_Baltanas_Danielopol_Geometric_Morphometrics
Geo11_89_Baltanas_Danielopol_Geometric_Morphometrics

You also want an ePaper? Increase the reach of your titles
YUMPU automatically turns print PDFs into web optimized ePapers that Google loves.
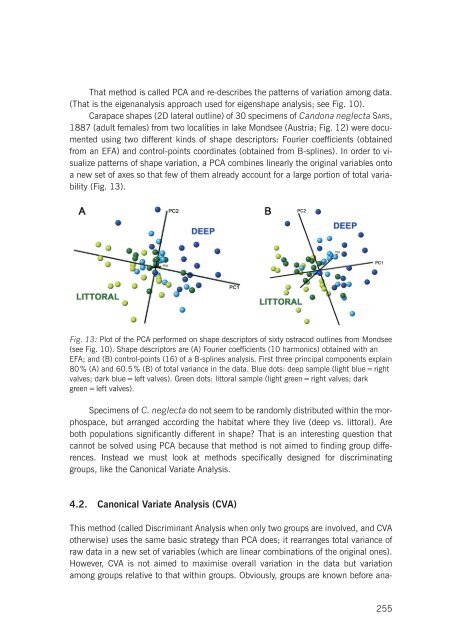
That method is called PCA and re-describes the patterns of variation among data.<br />
(That is the eigenanalysis approach used for eigenshape analysis; see Fig. 10).<br />
Carapace shapes (2D lateral outline) of 30 specimens of Candona neglecta SARS,<br />
1887 (adult females) from two localities in lake Mondsee (Austria; Fig. 12) were documented<br />
using two different kinds of shape descriptors: Fourier coefficients (obtained<br />
from an EFA) and control-points coordinates (obtained from B-splines). In order to visualize<br />
patterns of shape variation, a PCA combines linearly the original variables onto<br />
a new set of axes so that few of them already account for a large portion of total variability<br />
(Fig. 13).<br />
Fig. 13: Plot of the PCA performed on shape descriptors of sixty ostracod outlines from Mondsee<br />
(see Fig. 10). Shape descriptors are (A) Fourier coefficients (10 harmonics) obtained with an<br />
EFA; and (B) control-points (16) of a B-splines analysis. First three principal components explain<br />
80 % (A) and 60.5 % (B) of total variance in the data. Blue dots: deep sample (light blue = right<br />
valves; dark blue = left valves). Green dots: littoral sample (light green = right valves; dark<br />
green = left valves).<br />
Specimens of C. neglecta do not seem to be randomly distributed within the morphospace,<br />
but arranged according the habitat where they live (deep vs. littoral). Are<br />
both populations significantly different in shape? That is an interesting question that<br />
cannot be solved using PCA because that method is not aimed to finding group differences.<br />
Instead we must look at methods specifically designed for discriminating<br />
groups, like the Canonical Variate Analysis.<br />
4.2. Canonical Variate Analysis (CVA)<br />
This method (called Discriminant Analysis when only two groups are involved, and CVA<br />
otherwise) uses the same basic strategy than PCA does; it rearranges total variance of<br />
raw data in a new set of variables (which are linear combinations of the original ones).<br />
However, CVA is not aimed to maximise overall variation in the data but variation<br />
among groups relative to that within groups. Obviously, groups are known before ana-<br />
255