
Create successful ePaper yourself
Turn your PDF publications into a flip-book with our unique Google optimized e-Paper software.
<strong>NEWSWAVE</strong><br />
T HE H AMBURG S HIP M ODEL B ASIN N EWSLETTER 2006/2<br />
Dear Reader,<br />
I would like to welcome<br />
you to the latest<br />
edition of <strong>NEWSWAVE</strong>.<br />
Today the integrated procedure which<br />
combines numerical predictions with model<br />
experiments represents a vast improvement<br />
in design efficiency compared with the old<br />
days. Present service procedures of model<br />
basins include a combination of an initial<br />
set of calculations which are complemented<br />
by a focussed set of experiments.<br />
Nevertheless, often very quick answers are<br />
required. Therefore <strong>HSVA</strong> has introduced<br />
“Quick Check”, an assessment service for<br />
new designs based on comparison with<br />
<strong>HSVA</strong> data bases. This allows for rapid<br />
checks of principal design parameters to be<br />
made at a very early project stage, and can<br />
give guidance to the customer for further<br />
optimisation. “Quick Check” is another step<br />
forward in our effort to continuously<br />
improve services in response to our industry’s<br />
needs.<br />
During the last two months we have<br />
invested in our large towing tank, mainly in<br />
the towing carriage which has been totally<br />
overhauled, upgraded and modernised.<br />
The SMM in Hamburg is approaching in<br />
September, and I hope we will have a<br />
chance to meet you during this unique<br />
event for our industry. The team of <strong>HSVA</strong><br />
welcomes you to visit us at our stand<br />
no. 220 in hall 12 where we are prepared<br />
to answer any question you may have.<br />
Juergen Friesch<br />
Managing Director<br />
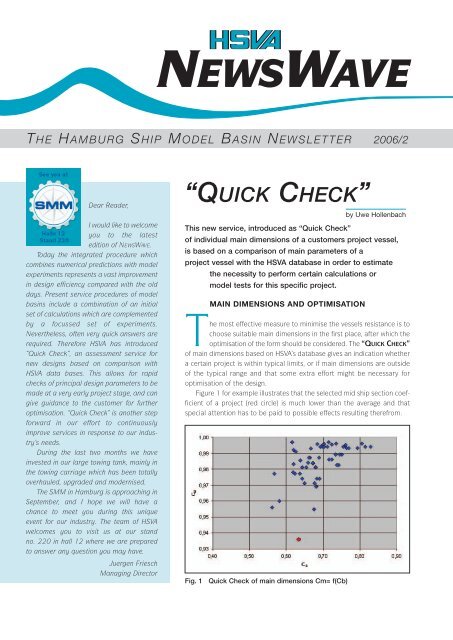
“QUICK CHECK”<br />
MAIN DIMENSIONS AND OPTIMISATION<br />
by Uwe Hollenbach<br />
This new service, introduced as “Quick Check”<br />
of individual main dimensions of a customers project vessel,<br />
is based on a comparison of main parameters of a<br />
project vessel with the <strong>HSVA</strong> database in order to estimate<br />
the necessity to perform certain calculations or<br />
model tests for this specific project.<br />
The most effective measure to minimise the vessels resistance is to<br />
choose suitable main dimensions in the first place, after which the<br />
optimisation of the form should be considered. The “QUICK CHECK”<br />
of main dimensions based on <strong>HSVA</strong>’s database gives an indication whether<br />
a certain project is within typical limits, or if main dimensions are outside<br />
of the typical range and that some extra effort might be necessary for<br />
optimisation of the design.<br />
Figure 1 for example illustrates that the selected mid ship section coefficient<br />
of a project (red circle) is much lower than the average and that<br />
special attention has to be paid to possible effects resulting therefrom.<br />
Fig. 1 Quick Check of main dimensions Cm= f(Cb)
For the optimisation process two<br />
different strategies can be observed<br />
today. On the one hand most of the<br />
shipyards follow the strategy of increasing<br />
the block coefficient without<br />
increasing the resistance. On the other<br />
hand ship owners and a few shipyards<br />
investigate variants with lower block<br />
coefficient and therefore lower resistance,<br />
especially for vessels in a seaway.<br />
Having in mind the actual fuel prices<br />
which have almost doubled during the<br />
last years, this strategy may be more<br />
successful to cover future demands of<br />
ship owners and operators.<br />
The “QUICK CHECK” of the<br />
speed/power characteristics based on<br />
<strong>HSVA</strong>’s database can serve as input for<br />
a cash flow analysis comparing different<br />
design variants featuring different main<br />
parameters. The results of this analysis<br />
can be the basis on which decision makers<br />
can consider which variant shall be<br />
chosen for optimisation of the overall<br />
economy of a certain design.<br />
SERVICE SPEED<br />
AND SEA MARGIN<br />
This “QUICK CHECK” includes advise<br />
regarding a maximum economical<br />
speed for the customers vessel which<br />
should not be exceeded in service in<br />
order to avoid an excessive fuel consumption.<br />
This will help designers at<br />
shipyards and in design offices as well<br />
as decision makers at shipping companies<br />
when selecting main dimensions in<br />
an early stage of project development.<br />
Figure 2 illustrates that the economic<br />
speed of a project vessel (red line)<br />
can be expected to be in the range of<br />
FN between 0.225 and 0.255. The<br />
upper value can be achieved with well<br />
optimised lines.<br />
For service speed a sea margin of<br />
15% is often applied to the power,<br />
independent of the type and size of the<br />
vessel and any environmental and operational<br />
requirements. Having in mind<br />
the increasing fuel prices this simple<br />
procedure can no longer be recommended.<br />
Instead, the speed/power<br />
prognosis of a project vessel should<br />
2 <strong>NEWSWAVE</strong> 2006/2<br />
Fig. 2 Quick Check of the economic speed<br />
take into account the actual environmental<br />
conditions expected during<br />
normal operation.<br />
The “QUICK CHECK” of additional<br />
power demand which can be expected<br />
for actual environmental conditions<br />
(wind, sea state, restricted water) will<br />
give an indication if a charter contract<br />
based on 15% sea margin as service<br />
allowance will fall short, either in<br />
respect to the guaranteed speed or in<br />
respect to the guaranteed fuel consumption.<br />
PROPELLER DESIGN<br />
AND PRESSURE PULSES<br />
The “QUICK CHECK” of the propeller<br />
parameters, the tip speed, the power<br />
density and the pressure pulses to be<br />
expected for the actual design give an<br />
indication if the selected propeller in<br />
combination with the selected main<br />
parameters of the hull may face problems<br />
with respect to efficiency and cavitation<br />
induced pressure pulses.<br />
In this case the designer should consider<br />
not only using potential flow<br />
codes for optimising the hull, but also<br />
using more advanced numerical CFD<br />
tools for calculating the wake field and<br />
the expected pressure pulses for the<br />
actual design well in advance of model<br />
tests. Furthermore this check is helpful<br />
to decide upon the necessity of cavitation<br />
tests with the design propeller.<br />
INTERACTION OF SHIP<br />
AND PROPELLER<br />
Few shipyards spend time and money<br />
to improve the interaction between the<br />
ship, the propeller and the rudder.<br />
When the results of resistance and self<br />
propulsion tests are satisfactory (i.e. the<br />
target speed has been reached), the<br />
customer is often not willing to improve<br />
a wake field of average quality by further<br />
modifications to the aft body of the<br />
vessel. It is sometimes overseen that a<br />
wake field of good quality not only<br />
helps to reduce the pressure pulses of<br />
the propeller, thus minimising the danger<br />
of propeller induced vibrations in<br />
the structure, it is also the basis for<br />
reducing frictional losses of the propeller<br />
by allowing selection of the lowest<br />
area ratio Ae/Ao possible.<br />
The “QUICK CHECK” of the quality<br />
of the wake field based on <strong>HSVA</strong>’s database<br />
will give an indication whether<br />
further improvements of the wake field<br />
can be expected.
MANOEUVRING<br />
CHARACTERISTICS<br />
Generally, the higher the block coefficient,<br />
the lower the length-breath ratio<br />
and the higher the speed in relation to<br />
the block coefficient, the higher is the<br />
risk to fail some of the IMO criteria for<br />
manoeuvrability. The “QUICK CHECK”<br />
comparison of the project vessels main<br />
parameters with the <strong>HSVA</strong> database will<br />
give an indication what manoeuvring<br />
characteristics may be expected, and if<br />
measures have to be taken to meet the<br />
IMO manoeuvring recommendations<br />
and to improve the yaw stability of the<br />
project vessel.<br />
The following Figure 3 shows the<br />
estimated and exact figures for the<br />
1st overshoot angle during 10°/10°<br />
zig-zag manoeuvre in our database and<br />
the expected figures (red line) for a project<br />
vessel.<br />
Model tests with different hull form<br />
variants of a full block vessel have<br />
shown that a variant with a lower resistance<br />
is more exposed to the risk being<br />
unstable in yaw for a larger range of<br />
rudder angles and that for this variant<br />
the IMO criteria for the overshoot<br />
angles at 10°/10° and 20°/20° zigzag<br />
manoeuvres will be exceeded. For hull<br />
forms which have demonstrated a supe-<br />
rior speed / power characteristic during<br />
calm water tests we therefore recommend<br />
to consider either additional<br />
numerical investigations and/or<br />
manoeuvring tests to check compliance<br />
with IMO criteria.<br />
SEA-KEEPING<br />
CHARACTERISTICS<br />
Fig. 3 Quick Check of the manoeuvring characteristics<br />
Ships main dimensions and the hull<br />
form are largely determined by other<br />
design factors than ships motions in<br />
waves. After the main dimensions and<br />
hull form are fixed, there is not much to<br />
be done to reduce ship motions or the<br />
related derived responses.<br />
The “QUICK CHECK” of the most<br />
important motion components heave,<br />
pitch and roll can give an indication in<br />
an early stage of the design, when the<br />
main dimensions are selected. The<br />
uncoupled, undamped natural periods<br />
can be estimated on the basis of a few<br />
main dimensions like length, breadth,<br />
water plane area coefficient and metacentric<br />
height and are compared with<br />
the wave encounter periods to be<br />
expected for a ship in the operational<br />
sea area. As a standard, wave<br />
encounter periods of the Baltic Sea, the<br />
North Sea, the Bay of Biscay, the<br />
Mediterranean Sea and the North<br />
Atlantic are checked, but this can be<br />
extended to suit the customer needs.<br />
In cases, where the natural and the<br />
wave encounter periods are nearly the<br />
same, violent resonant ship motions<br />
may occur. For these cases it is good<br />
practice to perform sea-keeping calculations<br />
in an early stage of the design<br />
or, in a later stage, to perform sea-keeping<br />
model tests. In addition to the ship<br />
motions and loads, various associated<br />
dynamic effects or derived responses<br />
can be used in comparison of different<br />
designs.<br />
OPERATION IN ICE<br />
Due to the increasing amount of crude<br />
oil exported from Russia a quickly growing<br />
fleet of tankers is employed in seasonally<br />
ice-infested waters like the<br />
Baltic Sea, the Southern Barents Sea<br />
(Petchora), and the waters around<br />
Sakhalin (Far East). For a number of<br />
tanker projects the transit performance<br />
in brash ice channels has been proven<br />
by model tests. The power derived from<br />
the model test was in no case higher<br />
than the power calculated by the FSIR<br />
formulas. In some cases the tanker<br />
models were transiting through the<br />
brash ice channel with only 70% of the<br />
power calculated by the FSIR formulas.<br />
A “QUICK CHECK” of the required<br />
engine output based on previous model<br />
tests performed at <strong>HSVA</strong> will give advice<br />
if there is a possibility for upgrading the<br />
ice class of a project, without increasing<br />
the installed engine power.<br />
CONCLUSION<br />
The “QUICK CHECK” of a customer’s<br />
project vessel gives designers at shipyards<br />
and decision makers in shipping<br />
companies advice if there is potential<br />
for optimisation in an early design stage<br />
when main dimensions are selected and<br />
the feasibility of a project is investigated.<br />
And what is also important - the<br />
“QUICK CHECK” will take no more time<br />
than is necessary to read this article.<br />
2006/2<br />
<strong>NEWSWAVE</strong><br />
3
CALCULATION OF<br />
HYDRODYNAMIC BODY<br />
FORCE COEFFICIENTS FOR<br />
TThe motion of a ship can be predicted if the hydrodynamic forces on the<br />
hull, rudder and propeller are known. The forces are a function of ship<br />
velocity and acceleration (higher order time-derivatives can usually be<br />
neglected). With a polynomial approach like:<br />
the time dependent forces can be calculated. The unknown coefficients are determined<br />
either by model-testing or calculations. A sufficiently accurate set of these<br />
coefficients is vital for a reliable prediction of the manoeuvring capabilities and<br />
thus for the design of the manoeuvring devices like rudder and thrusters in an early<br />
state of the design process.<br />
Since 1 st January 2005 the European Integrated Project (IP) VIRTUE,<br />
“The Virtual Tank Utility in Europe” works on advanced numerical simulation tools.<br />
“The Numerical Manoeuvring Tank”, being one of the 4 different CFD development<br />
fields in the project, focuses on numerical manoeuvring predictions. Within this<br />
work package a major task is a substantial improvement in accuracy, efficiency and<br />
consistency of computations for simple modes of motion like steady drift and rotation.<br />
Fig. 1 Forces and Moments on<br />
the “Hamburg Test Case”<br />
at 1.05 m/s model speed<br />
4 <strong>NEWSWAVE</strong> 2006/2<br />
News from the VIRTUE labs<br />
MANOEUVRING PREDICTIONS<br />
by Marco Schneider<br />
X=Xu u+X 2 u u u2 u+Xu u+Xu 2u 2 +Xυ 2υ 2 +Xr 2r 2 • •<br />
• •<br />
+...<br />
Fig. 2 Forces and Moments on<br />
the “Hamburg Test Case”<br />
at 1.89 m/s model speed<br />
Wake field of the<br />
“Hamburg Test Case”<br />
at 30° drift angle<br />
Comprehensive investigations on<br />
numerical discretisation, turbulence<br />
modelling, free surface flow and scale<br />
effects are performed that yield recommendations<br />
for practical applications.<br />
Based on these developments <strong>HSVA</strong><br />
sets out to deliver CFD based manoeuvring<br />
coefficients.<br />
Figure1 shows the comparison of<br />
the calculated non-dimensional forces<br />
and moments at different drift angles<br />
and velocities of the “Hamburg Test<br />
Case” with experiments. The calculations<br />
were performed with the<br />
Reynolds-Averaged Navier-Stokes<br />
Equations (RANSE) solver Comet. In a<br />
first approach the deformation of the<br />
free surface at speed was neglected.<br />
A double body model that uses a<br />
symmetry plane located at the undisturbed<br />
free surface has been employed.<br />
At lower ship speeds the double body<br />
model gives good agreements between<br />
experiment and simulation for the X<br />
and Y forces and the N moment. At<br />
higher speed the hydrostatic pressure<br />
generated by the bow wave (shown in<br />
Figure3) has a significant influence on<br />
the forces and thus cannot be neglected<br />
any more. Here the volume of fluid<br />
(VOF) free-surface model implemented<br />
in Comet was used to predict the forces<br />
and moments more accurately (shown<br />
in Figure2) at the cost of a significant<br />
increase of the computation time.
Further investigations on turbulence<br />
modelling and scale effects and the<br />
investigation of unsteady ship motions<br />
are scheduled. The promising results<br />
achieved so far will soon allow to integrate<br />
numerical manoeuvring computations<br />
into the portfolio of <strong>HSVA</strong>’s CFD<br />
services.<br />
MINIMISE OPERATING COSTS BY TRIM VARIATION TESTS<br />
RoRo-Vessel Heavy-Lift-Vessel<br />
Full Scantling Draught 18 kn 21 kn 23 kn 15 kn 17 kn 18 kn<br />
Trimming by head 97% 98% 95% 106% 105% 105%<br />
Trimming to the stern 105% 102% 99% 105% 97% 95%<br />
Design Draught 18 kn 21 kn 23 kn 15 kn 17 kn 18 kn<br />
Trimming by head 89% 95% 98% 105% 104% 104%<br />
Trimming to the stern 110% 106% 104% 105% 94% 90%<br />
Ballast Draught 18 kn 22 kn 24 kn 15 kn 17 kn 18 kn<br />
Trimming by head 100% 96% 103% 99% 103% 106%<br />
Trimming to the stern 111% 104% 103% 108% 99% 91%<br />
Table 1 – Results of Trim Variation Tests for two Newbuildings<br />
Fig. 3<br />
Bow wave in the<br />
experiment<br />
by Uwe Hollenbach<br />
In the past three years costs for fuel oil have almost doubled.<br />
To face this problem more and more ship owners order numerical calculations, or take the<br />
opportunity to use an existing ship model of their newbuildings for additional model tests.<br />
The aim of these tests and calculations is to provide decision support to<br />
their nautical officers on board their ships to minimise operating costs.<br />
In addition to manoeuvring tests to<br />
check the fulfilment of IMO<br />
manoeuvring criteria, sea-keeping<br />
tests to determine the speed loss for<br />
contracted environmental conditions,<br />
tests and numerical investigations to<br />
determine the squat effect and to find<br />
out the economical speed in shallow<br />
water, some ship owners order trim variation<br />
tests for their actual newbuildings<br />
in order to quantify the effect of trim<br />
on the power demand and the fuel oil<br />
consumption.<br />
Most recently such tests have been<br />
ordered for newbuildings of a RoRoand<br />
a Heavy-Lift-Vessel. When compared<br />
to the even keel condition,<br />
remarkable differences in power<br />
demand have been found for calm<br />
water conditions on various draughts<br />
and different ship speeds. Some results<br />
are given below, with the even keel condition<br />
as reference (100%).<br />
While for the RoRo-Vessel the<br />
largest power saving (-11%) has been<br />
found when the vessel is trimmed by<br />
the head, the largest power saving<br />
(-9%) of the Heavy-Lift-Vessel has been<br />
found when trimming by the stern. The<br />
largest differences in power demand<br />
between the best and the most<br />
unfavourable trim condition are more<br />
than 20% for the RoRo-Vessel and<br />
about 15% for the Heavy-Lift-Vessel.<br />
It should be mentioned that the<br />
differences in the power demand may<br />
be lower for other size and type of<br />
ships.<br />
2006/2 <strong>NEWSWAVE</strong><br />
5
6 <strong>NEWSWAVE</strong> 2006/2<br />
RESEARCH PROJECT “SINSEE”<br />
SUCCESSFULLY FINISHED<br />
by Walter L. Kuehnlein<br />
Final results of the German research project “SinSee” were presented<br />
at a colloquium held at <strong>HSVA</strong> on June 22nd. Within the framework of<br />
“SinSee”, <strong>HSVA</strong> cooperated with four partners<br />
(FSG, TUB, TUHH, and OceanWaves) on the<br />
evaluation of safety issues of vessels in severe seas.<br />
Topics like numerical analysis and<br />
simulation, validation by means of<br />
model test investigations, full scale<br />
measurements and evaluation of capsizing<br />
risks were covered within this project.<br />
Available means for investigating the<br />
sea-keeping performance of vessels are<br />
model tests and/or numerical simulations.<br />
Both model tests and numerical motion<br />
simulations are often used post-accidental<br />
in order to investigate the causes. Standard<br />
seakeeping tests (tank or numerical) are<br />
available for investigating several phenomena<br />
such as slamming, green water, capsizing,<br />
etc. but are only occasionally used –<br />
mainly for rather unusual designs, or in<br />
cases where sea keeping characteristics are<br />
more vital than for standard vessels.<br />
Within the research project “SinSee”,<br />
<strong>HSVA</strong> developed the following concept of<br />
computer controlled capsizing tests in<br />
order to ensure that the processes of large<br />
rolling and capsizing take into account the<br />
following wave characteristics:<br />
➢ Extreme wave height and wave steepness,<br />
➢ Wave grouping, and<br />
➢ Propagation velocity and direction.<br />
Unfavourable phase relationships between<br />
wave components as well as wave / structure<br />
interactions may lead to dangerous situations<br />
such as:<br />
➢ Loss of stability at the wave crest,<br />
➢ Resonant excitation, especially<br />
parametric rolling, and<br />
➢ Broaching due to a loss of course<br />
stability.<br />
The analysis of this complex, non-linear<br />
behaviour puts high demands on the<br />
capsizing test set-up and procedure:<br />
➢ Exact correlation of cause (wave<br />
excitation) and reaction (ship motion),<br />
➢ Reproducibility, high accuracy of<br />
measurement and control units,<br />
and<br />
➢ Deterministic performance of test<br />
events.<br />
These demands require a highly sophisticated<br />
testing procedure. Figure 1<br />
shows a schematic test configuration for<br />
computer controlled seakeeping tests.<br />
Three main system components have to<br />
be coordinated:<br />
➢ Wave maker,<br />
➢ Towing carriage (including the transverse<br />
carriage), and<br />
➢ Ship model.<br />
In head seas, the ship is positioned at<br />
the end of the tank opposite to the<br />
wave maker. In seas from astern, the<br />
ship model has to wait close to the wave<br />
maker until a defined sequence of the<br />
wave train has passed.<br />
The ship model is controlled by the<br />
master computer which via telemetry<br />
commands a z-manoeuvre at constant<br />
course angle and model velocity. These<br />
test parameters as well as the model<br />
sea parameters are chosen according to<br />
the metacentric height GM of the<br />
model, the expected rolling mode and<br />
occurrence of resonance. Both the towing<br />
carriage and the transverse horizontal<br />
carriage are computer controlled.
During the entire test run, the ship<br />
model stays within the view field of the<br />
optical system’s line cameras, and ship<br />
motions in six degrees of freedom are<br />
registered precisely. Additionally, the<br />
wave train is measured at several fixed<br />
positions along the wave tank.<br />
Thus the tests are performed and<br />
monitored in a manner which allows a<br />
reproducible correlation of wave excitation<br />
and ship motion. Figure 2 illustrates<br />
some sequences of a capsizing<br />
test in <strong>HSVA</strong>’s model basin.<br />
WAVE GENERATION<br />
Fig. 1 Schematic Test Configuration for Computer<br />
Controlled Seakeeping Tests<br />
The experimental investigation of<br />
extreme behaviour such as excessive<br />
rolling and capsizing also requires an<br />
appropriate approach for generating<br />
the harsh wave environment:<br />
➢ Definition of the target wave train,<br />
➢ Transformation of the target wave<br />
train to the position of the wave<br />
maker,<br />
➢ Calculation of the wave maker<br />
control signals, and<br />
➢ Performance of the model test.<br />
DETERMINISTIC WAVE TRAINS<br />
Applying the non-linear approach all<br />
kinds of waves can be tailored for each<br />
individual test scenario and generated<br />
in the model tank:<br />
➢ Wave packets,<br />
➢ Extreme waves such as<br />
”Three Sisters”,<br />
➢ Storm seas,<br />
➢ Random seas with embedded high<br />
wave sequences,<br />
➢ Regular waves with embedded high<br />
wave groups, and<br />
➢ Realization of natural wave<br />
scenarios.<br />
CALCULATION OF WAVE TRAINS<br />
IN THE MOVING REFERENCE<br />
FRAME OF CRUISING SHIPS<br />
For the deterministic analysis of motions<br />
and forces of ships, the wave excitation<br />
denotes the beginning of a complex causereaction<br />
chain. This requires knowledge of<br />
the wave evolution in time and space in<br />
order to correlate wave excitation with the<br />
structural response. Especially when the<br />
ship is sailing at non-constant speed it is<br />
not a state of the art task to determine the<br />
wave excitation with respect to a moving<br />
reference point as wave probes can be<br />
installed at defined positions, but usually<br />
not at the position of the model (due to<br />
relative motions and disturbances).<br />
As all model tests are fully reproducible,<br />
even a statistical analysis of extreme<br />
behaviour like capsizing events is conceivable.<br />
ACKNOWLEDGEMENTS<br />
<strong>HSVA</strong> is indebted to the German Ministry of<br />
Education, Research, and Technology,<br />
BMBF, for funding the project “SinSee” and<br />
the new successor project “LaSSe”, which<br />
allows the five partners to continue their<br />
very successful work on improving the<br />
safety of modern vessels.<br />
Fig. 2<br />
Sequences of a<br />
Capsizing Model Test<br />
(model length approx. 6 m)<br />
2006/2<br />
<strong>NEWSWAVE</strong><br />
7
Fig. 1 Brash ice test<br />
These power requirements can<br />
be calculated with the formulae<br />
given in the regulations or as an<br />
alternative they can be obtained in ice<br />
model tests, i.e. the performance of the<br />
ship is demonstrated in model tests in<br />
brash ice channels. Figure 1 illustrates a<br />
typical brash ice model test setup<br />
The guidelines for the verification of<br />
the ship’s performance for ice classes<br />
through model tests have changed in<br />
December 2005.<br />
The main changes are:<br />
➢ Increase of the thickness of the<br />
brash ice channel<br />
➢ Increase of the friction coefficient<br />
between model surface and ice from<br />
µ = 0.05 to 0.10.<br />
8 <strong>NEWSWAVE</strong> 2006/2<br />
BRASH ICE MODEL TESTS –<br />
CONSEQUENCES OF THE<br />
CHANGES IN THE GUIDELINES<br />
FROM DECEMBER 2005<br />
The Finnish – Swedish Ice Classes 1C to 1AS were developed<br />
in order to provide power requirements<br />
which ensure a certain ship’s performance in brash ice channels.<br />
As compared to the old guidelines<br />
for brash ice model tests, these changes<br />
result in a higher power requirement.<br />
Figure 2 illustrates the increase in delivered<br />
power due to the change in the<br />
guidelines for ice class 1B and 1A for a<br />
PANMAX tanker. But also with the new<br />
guidelines it can be stated that the performance<br />
of model tests leads to lower<br />
power requirements compared to that<br />
required by the given formulae. In some<br />
cases a reduction of up to 30% of the<br />
required power can be achieved.<br />
If the vessel is equipped with a controllable<br />
pitch propeller the engine<br />
which has been chosen for good open<br />
water performance will be able to deliver<br />
the required power in brash ice channels.<br />
by Karl-Heinz Rupp<br />
In the case of a fixed pitch propeller<br />
the motor limit curve restricts the available<br />
power in brash ice as the propeller<br />
loading is significantly higher. Figure 3<br />
illustrates that in these cases <strong>HSVA</strong> can<br />
assist you to find a solution where the<br />
vessel is able to fulfil the new power<br />
requirement guidelines without any<br />
change in the ship design for ice class 1A.<br />
However, in other cases changes may<br />
be necessary. But of course especially<br />
in these cases, <strong>HSVA</strong> can offer you<br />
assistance in finding cost efficient<br />
solutions.<br />
Fig. 2<br />
Comparison<br />
of old and new<br />
guidelines,<br />
delivered power<br />
vs. brash ice<br />
thickness
The oil produced will be transferred<br />
via a sub-sea pipeline<br />
from an ice-resistant fixed<br />
production platform to the FSO. The oil<br />
shall be stored in FSO tanks and<br />
periodically offloaded into shuttle<br />
tankers moored at the FSO.<br />
Ice load calculations have been carried<br />
out previously to estimate the ice<br />
loads acting on the bow and the stern<br />
of the FSO when the ice drift direction is<br />
in-line with the FSO tanker.<br />
A change in wind direction is associated<br />
with a change of the ice drift direction<br />
which introduces a “weather vaning”<br />
effect and as a consequence the FSO<br />
tanker starts to rotate around the SPM<br />
(single point mooring) as shown in<br />
Figure 1. In this particular case the ice<br />
will fail along the vertical hull of the FSO<br />
tanker, resulting in higher ice forces on<br />
the soft yoke mooring system. It is<br />
expected that the ice drift change is the<br />
2006/2<br />
Fig. 2<br />
Effect of the change<br />
in guidelines for a<br />
fixed pitch propeller in<br />
the area of the motor<br />
limit curve.<br />
OPERATIONS OF A FSO WITH<br />
A SOFT YOKE MOORING SYSTEM (SYMS) IN SEA ICE<br />
Bluewater Energy Services B.V.<br />
has recently performed ice model tests<br />
at <strong>HSVA</strong> for a permanently moored “Floating<br />
Offshore Storage” system (FSO).<br />
Fig. 1 FSO with SYMS connected<br />
to a Single Point Mooring Tower (SPM)<br />
controlling parameter with respect to<br />
maximum ice forces and the attention is<br />
focussed on the “weather vaning” effect.<br />
Ice model tests have been carried<br />
out in <strong>HSVA</strong>’s Large Ice Tank simulating<br />
level ice conditions. The SYMS-FSO<br />
tanker model was tested in different<br />
scenarios, i.e. straight astern and ahead<br />
penetration into level ice, turning astern<br />
and ahead in level ice for different ice<br />
by Karl-Ulrich Evers<br />
drift changes and turning 90 degree<br />
ahead in level ice.<br />
From the ice model tests the maximum<br />
ice loads acting on the SYMS-FSO<br />
tanker system were derived. The model<br />
test results validate the ice forces calculated<br />
for the bow and the stern sections<br />
of the FSO. In terms of improvement of<br />
the SYMS design, these kind of ice<br />
model tests are of high value.<br />
<strong>NEWSWAVE</strong><br />
9
ACTUAL RESEARCH ACTIVITIES<br />
ON PROPELLER AND RUDDER CAVITATION<br />
HHigh-Speed-Video recordings<br />
during the systematic model<br />
tests revealed that the propeller<br />
tip vortex bursting can be divided<br />
into two different types. First there is<br />
the vortex bursting due to hydrodynamic<br />
instability which can be found<br />
on marine propellers as well as in the<br />
field of aerodynamics. The second type<br />
is also called bursting of a propeller tip<br />
vortex, where its calm structure is<br />
“destroyed” by the rolled-up sheet cavity<br />
and looks like a bursting vortex. Both<br />
patterns are observed on marine propellers<br />
(see Figures 1 and 2) but they<br />
have different governing mechanisms.<br />
The bursting due to hydrodynamic<br />
instability can be related to the radial<br />
gradients of the tangential and axial<br />
velocities (Vt, Vx) inside the vortex.<br />
Under consideration of the Ludwieg’s<br />
stability criterion for vortical flows, the<br />
danger of vortex bursting was determined<br />
by applying the Betz vortex<br />
model outside the viscously dominated<br />
vortex core. Figures 3 and 4 show the<br />
10 <strong>NEWSWAVE</strong> 2006/2<br />
by Thomas Luecke<br />
At the end of last year <strong>HSVA</strong> successfully completed the BMBF research project PROTIP.<br />
The purpose of this project was to investigate the basic parameters influencing propeller tip vortex<br />
bursting. High speed video recordings were made during model tests with a periodically moving<br />
hydrofoil and a model propeller. These pictures gave insight into the<br />
temporal vortex behavior during the bursting process.<br />
Fig. 1 Bursting trailing vortex (type 1)<br />
Fig. 2 Bursting vortex due to rolled<br />
up sheet cavity (type 2)<br />
Fig. 3 Non bursting vortex Fig. 4 bursting vortex<br />
predicted radial velocity distributions<br />
(blue: Vx/U red: Vt/U) and the stability<br />
criterion (blue dots) within a vortex<br />
without and with bursting respectively.<br />
It has been found that the vortex<br />
bursting due to the roll-up of sheet cavitation<br />
is driven by the boundary layer<br />
on the propeller blade with high vorticity<br />
created at the leading edge or at its<br />
further developed edge vortex. RANS<br />
calculations were made for the investigated<br />
propeller in different wake fields<br />
in order to correlate their results with<br />
the observations made in the cavitation<br />
tunnel. The results show a good correlation<br />
between the predicted edge vortex<br />
(Figure 6) and the observed vortex<br />
bursting. The result calculated for the<br />
propeller in the smooth wake showed<br />
no vortex trace (Figure 5). This corresponded<br />
well with the calm vortex<br />
behavior observed.<br />
This challenging research topic will<br />
be further investigated in the future in<br />
order to extend our consultancy capabilities.
Fig. 5 Non bursting vortex, smooth wake Fig. 6 Bursting vortex, sharp wake<br />
<strong>HSVA</strong>’s interest is also focused on<br />
rudder cavitation. This topic is investigated<br />
in the research project RUKAV. Its<br />
aim is to investigate the scale effects of<br />
erosive cavitation on semi spade rudders,<br />
which are often faced with severe<br />
erosion problems around the pintle<br />
area, see Figure 7. The erosive cavitation<br />
phenomenon will be investigated<br />
by model tests in the HYKAT facility on<br />
a rudder placed behind a ship as well as<br />
on a partial rudder model of much larger<br />
scale (about 3:1!). High-Speed-Video and<br />
Particle-Image-Velocimetry recordings<br />
During June <strong>HSVA</strong>’s large towing<br />
tank has been closed<br />
down due to a major upgrade<br />
of the main carriage. The energy supply,<br />
the electric drive motors and the entire<br />
control and monitoring equipment of<br />
the main towing carriage and of the<br />
manoeuvring carriage CPMC (computerized<br />
planar motion carriage) have<br />
been renewed.<br />
vortex trace<br />
will resolve the cavitation pattern and<br />
the related flow field around the pintle.<br />
Based on these test results a correlation<br />
between model and full scale will<br />
be derived which will facilitate the<br />
detection of erosive cavitation patterns<br />
during cavitation tests at normal model<br />
scales. Special cavitation models for<br />
CFD-codes will be developed in order to<br />
predict the cavitation behavior and its<br />
erosive character through calculations.<br />
A presentation of the results will follow<br />
in the future at this place.<br />
Fig. 7 Erosion at the lower pintle<br />
MODERNISATION OF THE MAIN CARRIAGE FINISHED<br />
The modernisation aimed at:<br />
1. Increasing the maximum speed from<br />
8 m/s to 10 m/s.<br />
2. Increasing the measurement time<br />
by higher acceleration performance.<br />
3. Improving the measurement<br />
tolerances for rigid coupled models.<br />
4. Introducing a free programmable<br />
control system:<br />
– to automate tests and<br />
– to increase the flexibility<br />
5. Reducing the vibration of the<br />
carriage.<br />
6. Minimizing deviations from the<br />
selected carriage speed.<br />
7. Improving the reliability and<br />
maintainability of the carriage.<br />
by Uwe Hollenbach & Jürgen Friesch<br />
The entire work has been done right in<br />
time and the tank is back in operation<br />
since the beginning of July and nearly<br />
all requirements have been fulfilled in<br />
the short time. Reference tests with<br />
models of different ship types (Tankers,<br />
Container Vessels and Fast Ships) have<br />
shown good reproducibility compared<br />
with tests performed prior to the modernisation.<br />
This ensures the consistency<br />
with all our former data.<br />
2006/2<br />
<strong>NEWSWAVE</strong><br />
11
notes<br />
5 th <strong>HSVA</strong> -Customer Seminar 2006 on<br />
“CFD in Ship Design”<br />
25 October 2006<br />
The 5 th Customer Seminar on “CFD in Ship Design” will inform our customers about<br />
the present range of developments and how these will translate into current and<br />
future CFD services available at <strong>HSVA</strong>.<br />
Key personnel involved in in-house CFD work, together with invited speakers<br />
from industry and academia will present latest research results obtained in such<br />
European projects as Leading Edge, EFFORT and VIRTUE, as well as a range of<br />
advanced design applications.<br />
The seminar will be held at:<br />
Hamburgische Schiffbau-Versuchsanstalt GmbH<br />
Bramfelder Str. 164<br />
D-22305 Hamburg<br />
Date: 25 October 2006, Start: 10.00 hrs<br />
Fees: Seminar incl. Proceedings ? 100.-<br />
For reservations please contact Ms. A. Breitfeld e-mail: breitfeld@hsva.de<br />
Shipbuilding • Machinery &<br />
Marine Technology<br />
26 – 29 September 2006<br />
Visit us at SMM 2006: Hall 12, Stand 220<br />
Ensure your presence at this unique event for our industry.<br />
MEMBER OF STAFF<br />
JOHANNES PIEPER<br />
Johannes Pieper joined our staff in<br />
May 2006 and will be the<br />
successor of Karl-Heinz Koop who<br />
will retire at the end of 2006.<br />
Mr. Pieper works as a project manager<br />
in the propeller and cavitation<br />
department.<br />
He is responsible for cavitation<br />
tests for new projects in the HYKAT<br />
tunnel, in particular propeller and<br />
rudder cavitation tests for all kinds<br />
of vessels.<br />
He studied naval architecture at<br />
the University of Applied Science in<br />
Kiel. His master thesis dealt with<br />
the design of a sailing yacht model<br />
for a twist-flow wind tunnel.<br />
Following graduation he worked for<br />
the Yacht Research Unit in Kiel<br />
before joining <strong>HSVA</strong>.<br />
Johannes Pieper is married and<br />
lives in Kiel. In his spare time he<br />
enjoys sailing the Kiel Bay, travelling<br />
and spending time with his<br />
friends.<br />
THE HAMBURG SHIP MODEL BASIN ❙ Bramfelder Straße 164 ❙ D-22305 Hamburg<br />
Phone + 49 – 40 – 69 203 – 0 ❙ Fax + 49 – 40 – 69 203 345 ❙ E-mail info@hsva.de ❙ Internet http://www.hsva.de