

Towards clinico-pathological application of Raman spectroscopy
Towards clinico-pathological application of Raman spectroscopy
Towards clinico-pathological application of Raman spectroscopy

Create successful ePaper yourself
Turn your PDF publications into a flip-book with our unique Google optimized e-Paper software.
<strong>Raman</strong> Spectroscopic Characterization <strong>of</strong> Porcine Brain Tissue Using a Single Fiber-Optic Probe<br />
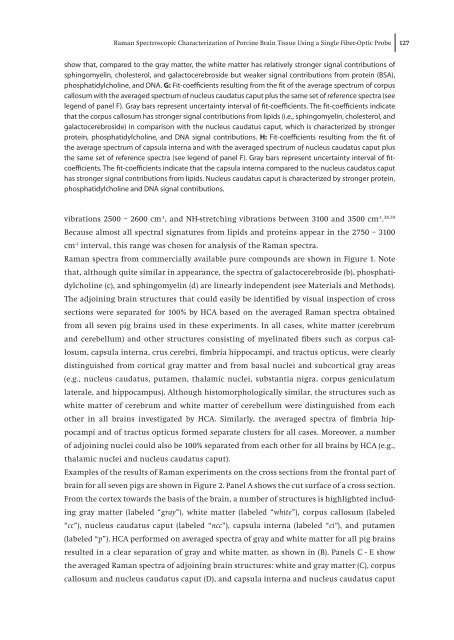
show that, compared to the gray matter, the white matter has relatively stronger signal contributions <strong>of</strong><br />
sphingomyelin, cholesterol, and galactocerebroside but weaker signal contributions from protein (BSA),<br />
phosphatidylcholine, and DNA. G: Fit-coefficients resulting from the fit <strong>of</strong> the average spectrum <strong>of</strong> corpus<br />
callosum with the averaged spectrum <strong>of</strong> nucleus caudatus caput plus the same set <strong>of</strong> reference spectra (see<br />
legend <strong>of</strong> panel F). Gray bars represent uncertainty interval <strong>of</strong> fit-coefficients. The fit-coefficients indicate<br />
that the corpus callosum has stronger signal contributions from lipids (i.e., sphingomyelin, cholesterol, and<br />
galactocerebroside) in comparison with the nucleus caudatus caput, which is characterized by stronger<br />
protein, phosphatidylcholine, and DNA signal contributions. H: Fit-coefficients resulting from the fit <strong>of</strong><br />
the average spectrum <strong>of</strong> capsula interna and with the averaged spectrum <strong>of</strong> nucleus caudatus caput plus<br />
the same set <strong>of</strong> reference spectra (see legend <strong>of</strong> panel F). Gray bars represent uncertainty interval <strong>of</strong> fitcoefficients.<br />
The fit-coefficients indicate that the capsula interna compared to the nucleus caudatus caput<br />
has stronger signal contributions from lipids. Nucleus caudatus caput is characterized by stronger protein,<br />
phosphatidylcholine and DNA signal contributions.<br />
vibrations 2500 – 2600 cm -1 , and NH-stretching vibrations between 3100 and 3500 cm -1 . 38,39<br />
Because almost all spectral signatures from lipids and proteins appear in the 2750 – 3100<br />
cm-1 interval, this range was chosen for analysis <strong>of</strong> the <strong>Raman</strong> spectra.<br />
<strong>Raman</strong> spectra from commercially available pure compounds are shown in Figure 1. Note<br />
that, although quite similar in appearance, the spectra <strong>of</strong> galactocerebroside (b), phosphatidylcholine<br />
(c), and sphingomyelin (d) are linearly independent (see Materials and Methods).<br />
The adjoining brain structures that could easily be identified by visual inspection <strong>of</strong> cross<br />
sections were separated for 100% by HCA based on the averaged <strong>Raman</strong> spectra obtained<br />
from all seven pig brains used in these experiments. In all cases, white matter (cerebrum<br />
and cerebellum) and other structures consisting <strong>of</strong> myelinated fibers such as corpus callosum,<br />
capsula interna, crus cerebri, fimbria hippocampi, and tractus opticus, were clearly<br />
distinguished from cortical gray matter and from basal nuclei and subcortical gray areas<br />
(e.g., nucleus caudatus, putamen, thalamic nuclei, substantia nigra, corpus geniculatum<br />
laterale, and hippocampus). Although histomorphologically similar, the structures such as<br />
white matter <strong>of</strong> cerebrum and white matter <strong>of</strong> cerebellum were distinguished from each<br />
other in all brains investigated by HCA. Similarly, the averaged spectra <strong>of</strong> fimbria hippocampi<br />
and <strong>of</strong> tractus opticus formed separate clusters for all cases. Moreover, a number<br />
<strong>of</strong> adjoining nuclei could also be 100% separated from each other for all brains by HCA (e.g.,<br />
thalamic nuclei and nucleus caudatus caput).<br />
Examples <strong>of</strong> the results <strong>of</strong> <strong>Raman</strong> experiments on the cross sections from the frontal part <strong>of</strong><br />
brain for all seven pigs are shown in Figure 2. Panel A shows the cut surface <strong>of</strong> a cross section.<br />
From the cortex towards the basis <strong>of</strong> the brain, a number <strong>of</strong> structures is highlighted including<br />
gray matter (labeled “gray”), white matter (labeled “white”), corpus callosum (labeled<br />
“cc”), nucleus caudatus caput (labeled “ncc”), capsula interna (labeled “ci”), and putamen<br />
(labeled “p”). HCA performed on averaged spectra <strong>of</strong> gray and white matter for all pig brains<br />
resulted in a clear separation <strong>of</strong> gray and white matter, as shown in (B). Panels C - E show<br />
the averaged <strong>Raman</strong> spectra <strong>of</strong> adjoining brain structures: white and gray matter (C), corpus<br />
callosum and nucleus caudatus caput (D), and capsula interna and nucleus caudatus caput<br />
127


