

Towards clinico-pathological application of Raman spectroscopy
Towards clinico-pathological application of Raman spectroscopy
Towards clinico-pathological application of Raman spectroscopy

You also want an ePaper? Increase the reach of your titles
YUMPU automatically turns print PDFs into web optimized ePapers that Google loves.
76 Chapter 4<br />
(Size:28 x 24µm)<br />
Figure 7.<br />
A<br />
B<br />
Intensity (a.u.)<br />
400 600 800 1000 1200 1400 1600 1800<br />
<strong>Raman</strong> shift (cm –1 )<br />
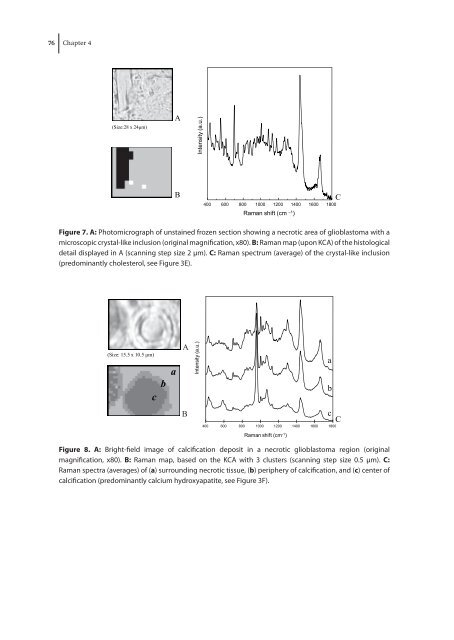
Figure 7. A: Photomicrograph <strong>of</strong> unstained frozen section showing a necrotic area <strong>of</strong> glioblastoma with a<br />
microscopic crystal-like inclusion (original magnification, x80). B: <strong>Raman</strong> map (upon KCA) <strong>of</strong> the histological<br />
detail displayed in A (scanning step size 2 μm). C: <strong>Raman</strong> spectrum (average) <strong>of</strong> the crystal-like inclusion<br />
(predominantly cholesterol, see Figure 3E).<br />
(Size: 15.5 x 10.5 �m)<br />
c<br />
b<br />
a<br />
A<br />
B<br />
Intensity (a.u.)<br />
C<br />
c<br />
C<br />
400 600 800 1000 1200 1400 1600 1800<br />
<strong>Raman</strong> shift (cm -1 )<br />
Figure 8. A: Bright-field image <strong>of</strong> calcification deposit in a necrotic glioblastoma region (original<br />
magnification, x80). B: <strong>Raman</strong> map, based on the KCA with 3 clusters (scanning step size 0.5 μm). C:<br />
<strong>Raman</strong> spectra (averages) <strong>of</strong> (a) surrounding necrotic tissue, (b) periphery <strong>of</strong> calcification, and (c) center <strong>of</strong><br />
calcification (predominantly calcium hydroxyapatite, see Figure 3F).<br />
Figure 8.<br />
a<br />
b


