Correlation of microbiological water quality parameters with - S-can
Correlation of microbiological water quality parameters with - S-can
Correlation of microbiological water quality parameters with - S-can

You also want an ePaper? Increase the reach of your titles
YUMPU automatically turns print PDFs into web optimized ePapers that Google loves.
Poster session AutMoNet 2002<br />
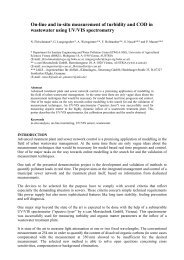
calibrations to other <strong>parameters</strong> like organic carbons (e.g. TOC) or Nitrate <strong>can</strong> be calculated from the<br />
spectral information.<br />
Particle counter 1 (Abakus mobil fluid from Klotz Analytische Messtechnik, Germany) covers a particle<br />
size range <strong>of</strong> 1 µm to 120 µm <strong>with</strong> 32 selectable size channels. An implemented sampling pump<br />
guarantees that the number <strong>of</strong> particles is always related to the same volume <strong>of</strong> <strong>water</strong>.<br />
This is different <strong>with</strong> particle counter 2 (WPC 2000 from ART Instruments, Inc.), where an optional<br />
drain extension installation should take over this function. The unit 2 covers a particle size range <strong>of</strong> 1<br />
µm to 100 µm <strong>with</strong> 8 selectable size channels.<br />
Over the project period the E.coli and coliforms numbers in the spring <strong>water</strong> have been determined<br />
almost daily using the Colilert test from IDEXX laboratories, Inc., the meteorological data air<br />
temperature, precipitation and snow height have been recorded.<br />
The relation between the collected data have been determined by calculating the correlation coefficient<br />
ρX,Y.<br />
RESULTS AND CONCLUSIONS<br />
While the already existing monitoring system worked well, several problems occurred <strong>with</strong> the<br />
additionally installed instruments causing gaps in the time series. High particle loads after heavy<br />
rainfalls are probably the reason why both particle counters failed several times. Problems <strong>with</strong> the drain<br />
extension installation <strong>of</strong> particle counter 2 caused changes in the sample flow; the numbers <strong>of</strong> particles<br />
counted <strong>with</strong> this instrument were not related to a constant <strong>water</strong> volume.<br />
With the UV-VIS-spectrometer wrong references have been used at the beginning <strong>of</strong> the measurement<br />
campaign. A too small sample flow through the additional ByPass-System caused problems.<br />
<strong>Correlation</strong> <strong>of</strong> <strong>microbiological</strong> <strong>water</strong> <strong>quality</strong> <strong>parameters</strong> <strong>with</strong> chemical-physical and meteorological data<br />
High numbers <strong>of</strong> coliforms and E.coli in the spring <strong>water</strong> have been found during the warm season from<br />
June till October. After heavy or long lasting rainfall the numbers are increasing dramatically. The same<br />
is true for the SAC(254nm) <strong>with</strong> the difference, that this parameter increases after rainfall over the<br />
whole year and not during the warm season only (comp. Figure 1).<br />
Figure 1. Time series <strong>of</strong> coliforms, E.coli and SAC(254nm)<br />
This observation was confirmed, when calculating the correlation coefficients between the<br />
<strong>microbiological</strong> <strong>parameters</strong> and the other data series. With SAC(254 nm) the highest value was found<br />
followed by the particle counts for small particle size classes (comp. Table 1). Even higher is the<br />
442