Correlation of microbiological water quality parameters with - S-can
Correlation of microbiological water quality parameters with - S-can
Correlation of microbiological water quality parameters with - S-can

Create successful ePaper yourself
Turn your PDF publications into a flip-book with our unique Google optimized e-Paper software.
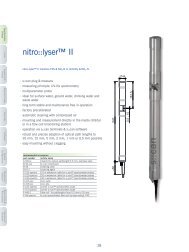
<strong>Correlation</strong> <strong>of</strong> <strong>microbiological</strong> <strong>water</strong> <strong>quality</strong> <strong>parameters</strong> <strong>with</strong><br />
chemical-physical and meteorological data at a karstic spring<br />
used as a source for drinking <strong>water</strong> supply<br />
K. Staubmann*, R. Perfler* and F. H<strong>of</strong>städter**<br />
* Department for Sanitary Engineering and Water Pollution Control (IWGA -SIG)<br />
University <strong>of</strong> Agricultural Sciences Vienna (BOKU), Muthgasse 18, A-1190 Vienna, AUSTRIA<br />
(E-mail: staubmann@iwga-sig.boku.ac.at (corresp. author), perfler@iwga-sig.boku.ac.at)<br />
** s::<strong>can</strong> Messtechnik GmbH, Herminengasse 10, A-1020 Vienna, AUSTRIA (www.s-<strong>can</strong>.at)<br />
(E-mail: fhotstaedter@s-<strong>can</strong>.at)<br />
Abstract<br />
At a carstic spring in Austria several <strong>microbiological</strong>, chemical-physical and meteorological data<br />
have been measured over a 10 month period. The intention was to find easy to measure <strong>parameters</strong><br />
to describe the <strong>microbiological</strong> <strong>quality</strong> <strong>of</strong> the spring. The strongest relation <strong>of</strong> the coliforms and<br />
E.coli counts was found <strong>with</strong> the product <strong>of</strong> SAC(254nm) and air temperature. From the additional<br />
information gathered from particle counting compared to turbidity measurement it was not<br />
possible to deduce advantages for the practical management <strong>of</strong> the examined spring. The<br />
SAC(254nm) data measured <strong>with</strong> a novel submersible UV-VIS-spectrometer were <strong>of</strong> the same<br />
<strong>quality</strong> like the conventional measured data <strong>with</strong> a prior membrane filtration.<br />
Keywords<br />
Water <strong>quality</strong>; carstic spring; data correlation<br />
BACKGROUND AND OBJECTIVES<br />
Springs in geological regions <strong>with</strong> karstic rock formations are the source for public drinking <strong>water</strong><br />
supply for about 60% <strong>of</strong> the Austrian population. Unfortunately the <strong>water</strong> <strong>quality</strong> from these springs<br />
shows temporary instabilities for some <strong>parameters</strong>. High turbidity fluctuations, elevated DOC and<br />
increased bacteria counts typically occur in an almost unpredictable way during storm weather. For the<br />
<strong>water</strong> suppliers the bacteria counts are the most important <strong>parameters</strong>, since these <strong>parameters</strong> determine,<br />
whether disinfection is necessary.<br />
The aim <strong>of</strong> the study was to find out, whether chemical-physical <strong>water</strong> <strong>quality</strong> <strong>parameters</strong> and<br />
meteorological data, which <strong>can</strong> be easily measured online, <strong>can</strong> be used to predict the number <strong>of</strong> faecal<br />
indicator bacteria at a typical karstic spring in Austria. Further objectives have been to judge, whether<br />
particle counting gives additional information compared to turbidity measurement, and if conventional<br />
turbidity and SAC(254nm) measurement <strong>can</strong> be replaced by the use <strong>of</strong> a novel submersable UV-VIS<br />
spectrometer.<br />
MATERIALS AND METHODS<br />
From the already existing monitoring system measuring the spectral absorption coefficient at 254nm<br />
(SAC(254nm)), turbidity, electrical conductivity, pH, and O2-concentration hourly averages have been<br />
provided by the <strong>water</strong> supply company over the project period <strong>of</strong> March to December 2001.<br />
Additionally a novel submersible UV-VIS-spectrometer and two particle counters have been installed at<br />
the spring and compared. For all three units a measurement interval <strong>of</strong> 15 min has been fixed.<br />
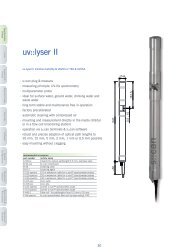
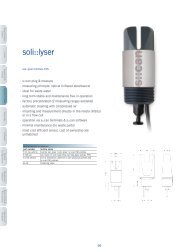
The UV-VIS-spectrometer (spectro::lyser from s::<strong>can</strong> Messtechnik GesmbH. Vienna) measures the light<br />
absorption in the spectral range <strong>of</strong> 200 nm to 750 nm. While in the existing monitoring system a<br />
membrane filtration is installed prior to SAC(254 nm)–measurement, the spectro::lyser-unit is able to<br />
calculate the SAC (254 nm) and the turbidity from the UV-VIS-spectra <strong>of</strong> the unfiltered sample. Also<br />
441
Poster session AutMoNet 2002<br />
calibrations to other <strong>parameters</strong> like organic carbons (e.g. TOC) or Nitrate <strong>can</strong> be calculated from the<br />
spectral information.<br />
Particle counter 1 (Abakus mobil fluid from Klotz Analytische Messtechnik, Germany) covers a particle<br />
size range <strong>of</strong> 1 µm to 120 µm <strong>with</strong> 32 selectable size channels. An implemented sampling pump<br />
guarantees that the number <strong>of</strong> particles is always related to the same volume <strong>of</strong> <strong>water</strong>.<br />
This is different <strong>with</strong> particle counter 2 (WPC 2000 from ART Instruments, Inc.), where an optional<br />
drain extension installation should take over this function. The unit 2 covers a particle size range <strong>of</strong> 1<br />
µm to 100 µm <strong>with</strong> 8 selectable size channels.<br />
Over the project period the E.coli and coliforms numbers in the spring <strong>water</strong> have been determined<br />
almost daily using the Colilert test from IDEXX laboratories, Inc., the meteorological data air<br />
temperature, precipitation and snow height have been recorded.<br />
The relation between the collected data have been determined by calculating the correlation coefficient<br />
ρX,Y.<br />
RESULTS AND CONCLUSIONS<br />
While the already existing monitoring system worked well, several problems occurred <strong>with</strong> the<br />
additionally installed instruments causing gaps in the time series. High particle loads after heavy<br />
rainfalls are probably the reason why both particle counters failed several times. Problems <strong>with</strong> the drain<br />
extension installation <strong>of</strong> particle counter 2 caused changes in the sample flow; the numbers <strong>of</strong> particles<br />
counted <strong>with</strong> this instrument were not related to a constant <strong>water</strong> volume.<br />
With the UV-VIS-spectrometer wrong references have been used at the beginning <strong>of</strong> the measurement<br />
campaign. A too small sample flow through the additional ByPass-System caused problems.<br />
<strong>Correlation</strong> <strong>of</strong> <strong>microbiological</strong> <strong>water</strong> <strong>quality</strong> <strong>parameters</strong> <strong>with</strong> chemical-physical and meteorological data<br />
High numbers <strong>of</strong> coliforms and E.coli in the spring <strong>water</strong> have been found during the warm season from<br />
June till October. After heavy or long lasting rainfall the numbers are increasing dramatically. The same<br />
is true for the SAC(254nm) <strong>with</strong> the difference, that this parameter increases after rainfall over the<br />
whole year and not during the warm season only (comp. Figure 1).<br />
Figure 1. Time series <strong>of</strong> coliforms, E.coli and SAC(254nm)<br />
This observation was confirmed, when calculating the correlation coefficients between the<br />
<strong>microbiological</strong> <strong>parameters</strong> and the other data series. With SAC(254 nm) the highest value was found<br />
followed by the particle counts for small particle size classes (comp. Table 1). Even higher is the<br />
442
AutMoNet 2002 Staubmann et al.<br />
relation between the bacteria numbers and the product <strong>of</strong> (SAC 254nm) and the air temperature. This is<br />
one simple way to bring the seasonal variation <strong>of</strong> the bacteria counts into the relation. Plotting this<br />
product versus col<strong>of</strong>orms and E.coli counts (comp. Figure 2) shows, that the correlation is too weak for<br />
exact quantitative statements but <strong>can</strong> be used as an <strong>water</strong> <strong>quality</strong> information in order to produce an<br />
early warning parameter.<br />
Table 1. <strong>Correlation</strong> coefficients X,Y <strong>of</strong> coliforms and E -coli. counts <strong>with</strong> chemical-physical <strong>water</strong><br />
<strong>quality</strong> <strong>parameters</strong> and meteorological data<br />
Figure 2. SAC(254 nm) times air temperature vs. coliforms and E.coli counts<br />
Particle counting<br />
The particle counts follow well the turbidity data having a ρX,Y value <strong>of</strong> 0,98 for the smallest particle<br />
size class (2-5 µm) (comp. Figure 3). The distribution <strong>of</strong> particle sizes varied over the examination<br />
period, but a relation between the particle size distribution and the occurrence <strong>of</strong> high numbers <strong>of</strong><br />
bacteria in the spring <strong>water</strong> was not found. From the additional information gathered from particle<br />
counting compared to turbidity measurement, which are the particle size distribution and the higher<br />
443
Poster session AutMoNet 2002<br />
resolution at low turbidity values, it was not possible to deduce advantages for the practical management<br />
<strong>of</strong> the examined spring.<br />
Figure 3. Time series <strong>of</strong> turbidity and particle counts (2-5 µm)<br />
UV-VIS-spectrometer<br />
The SAC(254nm) values determined <strong>with</strong> the spectro::lyser-instrument are <strong>of</strong> the same <strong>quality</strong> like the<br />
conventional measured data <strong>with</strong> membrane filtration (comp. Figure 4). This is different <strong>with</strong> the<br />
turbidity measurement, where still measurements under improved conditions concerning the whole<br />
measuring system (probe and ByPass-system) take place to verify the possibility <strong>of</strong> spectral<br />
measurements <strong>of</strong> the turbidity.<br />
The correlation coefficients (comp. Figure 4) are calculated from measuring data obtained over long<br />
time periods <strong>of</strong> various months and show the equivalence <strong>of</strong> both measurement methods. There are three<br />
different graphs as two times not distilled <strong>water</strong> has been used as the correct reference media. Although<br />
the probe has been mounted in a ByPass-system the spectro::lyser is primarily designed for making<br />
InSitu measurements in order to <strong>of</strong>fer OnLine data from the original <strong>water</strong> <strong>quality</strong>.<br />
Figure 4. SAC(254 nm) from a conventional measurement instrument after membrane filtration vs.<br />
SAC(254 nm) data measured <strong>with</strong> spectro::lyser <strong>with</strong>out filtration<br />
444