Envisioning Knowledge (and Expertise) - IVL - Indiana University
Envisioning Knowledge (and Expertise) - IVL - Indiana University
Envisioning Knowledge (and Expertise) - IVL - Indiana University

Create successful ePaper yourself
Turn your PDF publications into a flip-book with our unique Google optimized e-Paper software.
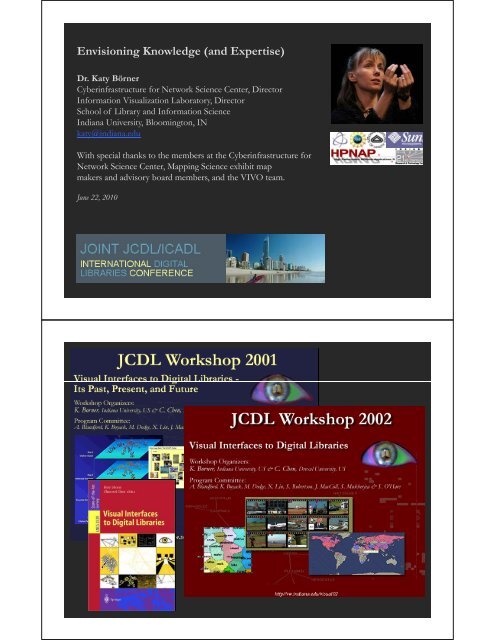
<strong>Envisioning</strong> <strong>Knowledge</strong> (<strong>and</strong> <strong>Expertise</strong>)<br />
Dr. Katy Börner<br />
Cyberinfrastructure for Network Science Center, Director<br />
Information Visualization Laboratory Laboratory, Director<br />
School of Library <strong>and</strong> Information Science<br />
<strong>Indiana</strong> <strong>University</strong>, Bloomington, IN<br />
katy@indiana.edu<br />
With special thanks to the members at the Cyberinfrastructure for<br />
Network Science Center, Mapping Science exhibit map<br />
makers <strong>and</strong> advisory board members, <strong>and</strong> the VIVO team.<br />
June 22, 2010
TRINITY COLLEGE LIBRARY DUBLIN<br />
REAL GABINETE PORTUGUES DE LEITURA RIO DE JANEIRO<br />
Börner, Katy (2010) Atlas of Science. MIT Press. http://scimaps.org/atlas<br />
STIFTSBIBLIOTHEK ST. GALLEN<br />
http://www.pleon.it/web/blogs/geektalk.nsf/archive?openview&ty<br />
pe=Month&month=8&year=2006&title=August+2006&<br />
4
Börner, Katy (2010) Atlas of Science. MIT Press. http://scimaps.org/atlas<br />
Börner, Katy (2010) Atlas of Science. MIT Press. http://scimaps.org/atlas<br />
5<br />
6
Börner, Katy (2010) Atlas of Science. MIT Press. http://scimaps.org/atlas<br />
By Ludwig Gatzke. Uploaded to Flickr in January 2006<br />
http://www.flickr.com/photos/stabilo-boss/93136022<br />
7
Navigate knowledge <strong>and</strong> expertise<br />
Find <strong>and</strong> stay in contact with collaborators<br />
Identify patterns, trends, outliers
Some Tools That Scholars Use<br />
to access data, knowledge, expertise<br />
Sharing talks, tutorials,<br />
instructions<br />
S&T Navigation, Management Tools that Different Stakeholders Want<br />
Funding Agencies<br />
� Need to monitor (long-term) money flow <strong>and</strong> research developments, identify<br />
areas for future development, p , stimulate new research areas, , evaluate funding g<br />
strategies for different programs, decide on project durations, funding<br />
patterns.<br />
Scholars<br />
� Want easy access to research results, relevant funding programs <strong>and</strong> their<br />
success rates, potential collaborators, competitors, related<br />
projects/publications (research push).<br />
IIndustry d t<br />
� Is interested in fast <strong>and</strong> easy access to major results, experts, etc. Influences<br />
the direction of research by entering information on needed technologies<br />
(industry-pull).<br />
(industry pull).<br />
Advantages for Publishers<br />
� Need easy to use interfaces to massive amounts of interlinked data. Need to<br />
communicate data provenance, p , qquality, y, <strong>and</strong> context.<br />
Society<br />
� Needs easy access to scientific knowledge <strong>and</strong> expertise.
Scholars Have Different Roles/Needs<br />
Researchers <strong>and</strong> Authors—need to select promising p gresearch topics, p , students, , collaborators, ,<br />
<strong>and</strong> publication venues to increase their reputation. They benefit from a global view of<br />
competencies, reputation <strong>and</strong> connectivity of scholars; hot <strong>and</strong> cold research topics <strong>and</strong><br />
bursts of activity, <strong>and</strong> funding available per research area.<br />
Editors—have to determine editorial board members, assign g papers p p to reviewers, <strong>and</strong><br />
ultimately accept or reject papers. Editors need to know the position of their journals in<br />
the evolving world of science. They need to advertise their journals appropriately <strong>and</strong><br />
attract high-quality submissions, which will in turn increase the journal’s reputation <strong>and</strong><br />
lead to higher quality submissions.<br />
RReviewers—read, i d critique, i i <strong>and</strong> d suggest changes h to hhelp l iimprove the h quality li of fpapers <strong>and</strong> d<br />
funding proposals. They need to identify related works that should be cited or<br />
complementary skills that authors might consider when selecting project collaborators.<br />
Teachers—teach classes, train doctoral students, <strong>and</strong> supervise postdoctoral researchers. They<br />
need to identify key works, works experts, experts <strong>and</strong> examples relevant to a topic area <strong>and</strong> teach them<br />
in the context of global science.<br />
Inventors—create intellectual property <strong>and</strong> obtain patents, thus needing to navigate <strong>and</strong> make<br />
sense of research spaces as well as intellectual property spaces.<br />
Investigators Investigators—scholars scholars acquire funding to support students students, hire staff staff, purchase equipment, equipment<br />
or attend conferences. Here, research interests <strong>and</strong> proposals have to be matched with<br />
existing federal <strong>and</strong> commercial funding opportunities, possible industry collaborators <strong>and</strong><br />
sponsors.<br />
Team Leads <strong>and</strong> Science Administrators Administrators—many many scholars direct multiple research projects<br />
simultaneously. Some have full-time staff, research scientists, <strong>and</strong> technicians in their<br />
laboratories <strong>and</strong> centers. Leaders need to evaluate performance <strong>and</strong> provide references for<br />
current or previous members; report the progress of different projects to funding agencies.
Type yp of Analysis y vs. Level of Analysis y<br />
Statistical<br />
Analysis/Profiling<br />
Temporal Analysis<br />
(When)<br />
Geospatial Analysis<br />
(Where)<br />
Micro/Individual Meso/Local Macro/Global<br />
(1 (1-100 100 records) d ) (101 (101–10,000 10 000 records) d ) (10 (10,000 000 < records) d )<br />
Individual person <strong>and</strong><br />
their expertise profiles<br />
Funding portfolio of<br />
one individual<br />
Career trajectory of one<br />
individual<br />
Larger labs, centers,<br />
universities, research<br />
domains, , or states<br />
Mapping topic bursts<br />
in 20-years of PNAS<br />
Mapping a states<br />
intellectual l<strong>and</strong>scape<br />
All of NSF, all of USA,<br />
all of science.<br />
113 Years of Physics<br />
Research<br />
PNAS publications<br />
Topical Analysis Base knowledge from <strong>Knowledge</strong> flows in VxOrd/Topic maps of<br />
(What)<br />
which one grant draws. Chemistry research NIH funding<br />
Network Analysis NSF Co-PI network of<br />
(With Whom?) one individual<br />
Co-author network NIH’s core competency<br />
16
Mapping <strong>Indiana</strong>’s Intellect Intellectual al Space<br />
Id Identify if<br />
� Pockets of innovation<br />
� Pathways from ideas to products<br />
�� IInterplay l of f industry i d <strong>and</strong> dacademia d i<br />
Research Collaborations by the Chinese Academy of Sciences<br />
By Weixia (Bonnie) Huang, Russell J. Duhon, Elisha F. Hardy, Katy Börner, <strong>Indiana</strong> <strong>University</strong>, USA<br />
This map highlights the research co-authorship collaborations of the Chinese Academy of<br />
Sciences with locations in China <strong>and</strong> countries around the world. The large geographic map<br />
shows the research collaborations of all CAS institutes. Each smaller geographic map shows the<br />
research collaborations by the CAS researchers in one province-level administrative division division.<br />
Collaborations between CAS researchers are not included in the data. On each map, locations<br />
are colored on a logarithmic scale by the number of collaborations from red to yellow. The<br />
darkest red is 3,395 collaborations by all of CAS with researchers in Beijing. Also, flow lines are<br />
drawn from the location of focus to all locations collaborated with with. The width of the flow line is<br />
linearly proportional to the number of collaborations with the locations it goes to, with the<br />
smallest flow lines representing one collaboration <strong>and</strong> the largest representing differing amounts<br />
on each geographic map.<br />
18
Mapping the Evolution of Co-Authorship Networks<br />
Ke, Visvanath & Börner, (2004) Won 1st price at the IEEE InfoVis Contest.<br />
19<br />
20
Studying the Emerging Global Brain: Analyzing <strong>and</strong> Visualizing the Impact of<br />
Co-Authorship Teams<br />
Börner Börner, Dall’Asta Dall Asta, Ke & Vespignani (2005) Complexity, Complexity 10(4):58 10(4):58-67. 67<br />
Research question:<br />
• Is ssce science ced driven ve by bypo prolific cs single gee experts pets<br />
or by high-impact co-authorship teams?<br />
Contributions:<br />
• New approach to allocate citational<br />
credit.<br />
• Novel weighted graph representation.<br />
• Visualization of the growth of weighted<br />
co-author network.<br />
• Centrality measures to identify author<br />
impact.<br />
• Global statistical analysis of paper<br />
production <strong>and</strong> citations in correlation<br />
with co co-authorship authorship team size over time time.<br />
• Local, author-centered entropy measure.<br />
Mapping Topic Bursts<br />
Co-word space of<br />
the top 50 highly<br />
frequent <strong>and</strong> bursty<br />
words used in the<br />
top 10% most<br />
highly cited PNAS<br />
publications in<br />
1982-2001.<br />
Mane & Börner. (2004)<br />
PNAS, 101(Suppl. 1):<br />
5287-5290.<br />
21<br />
22
Spatio-Temporal Information Production <strong>and</strong> Consumption of Major U.S.<br />
Research Institutions<br />
Börner, Katy, Penumarthy, Shashikant, Meiss, Mark <strong>and</strong> Ke, Weimao. (2006)<br />
MMapping i the h Diffusion Diff i of f Scholarly S h l l <strong>Knowledge</strong> K l d Among A Major M j U.S. US Research R h<br />
Institutions. Scientometrics. 68(3), pp. 415-426.<br />
Research questions:<br />
11. Does space still matter<br />
in the Internet age?<br />
2. Does one still have to<br />
study y <strong>and</strong> work at major j research<br />
institutions in order to have access to<br />
high quality data <strong>and</strong> expertise <strong>and</strong> to produce high<br />
quality research?<br />
33. Does D the h IInternet llead d to more global l b lcitation i i<br />
patterns, i.e., more citation links between papers<br />
produced at geographically distant research<br />
instructions?<br />
Contributions:<br />
� Answer to Qs 1 + 2 is YES.<br />
� Answer to Qs 3 is NO.<br />
�� NNovel lapproach hto analyzing l i the h ddual l role l of f<br />
institutions as information producers <strong>and</strong><br />
consumers <strong>and</strong> to study <strong>and</strong> visualize the diffusion<br />
of information among them. 23<br />
Mapping Transdisciplinary Tobacco Use Research<br />
Centers Publications<br />
CCompare R01 investigator i i based b d funding f di with i h TTURC<br />
Center awards in terms of number of publications <strong>and</strong><br />
evolving co-author networks.<br />
ZZoss & Bö Börner, forthcoming.<br />
f th i
2002 Base Map of Science<br />
Kevin W. Boyack, Katy Börner, & Richard Klavans (2007). Mapping the Structure <strong>and</strong> Evolution of Chemistry Research.<br />
11th IInternational t ti l CConference f on SScientometrics i t t i <strong>and</strong> d IInformetrics. f t i pp pp. 112-123. 112 123<br />
� Uses combined SCI/SSCI<br />
from 2002<br />
• 1.07M papers, 24.5M<br />
references, 7,300 journals<br />
• Bibliographic coupling of<br />
ppr papers, aggregated r tdtto<br />
journals<br />
� Initial ordination <strong>and</strong> clustering<br />
of journals gave 671 clusters<br />
� Coupling counts were<br />
reaggregated at the journal<br />
cluster level to calculate the<br />
• (x,y) positions for each<br />
journal cluster<br />
• by association, (x,y)<br />
positions ii for f each hjjournall Education<br />
Psychology<br />
Psychiatry<br />
Policy<br />
Law<br />
Economics<br />
Disease &<br />
Treatments<br />
Statistics<br />
Math<br />
CompSci<br />
Computer Tech<br />
Phys-Chem<br />
Vision Physics<br />
Chemistry<br />
Brain<br />
MRI<br />
Bio-<br />
Materials<br />
Cancer<br />
Virology<br />
Science map applications: Identifying core competency<br />
Kevin W. Boyack, Katy Börner, & Richard Klavans (2007).<br />
BioChem<br />
Environment<br />
Animal<br />
Pl Plantt<br />
Infectious Diseases<br />
Funding patterns of the US Department of Energy (DOE)<br />
Education<br />
Psychology<br />
Psychiatry<br />
Law<br />
Policy Statistics<br />
Economics<br />
GI<br />
Vision<br />
Brain<br />
MRI<br />
Bi Bio-<br />
Materials<br />
Cancer<br />
Math<br />
CompSci<br />
Virology<br />
Physics<br />
BioChem<br />
Computer Tech<br />
Environment<br />
Animal<br />
Phys-Chem<br />
Chemistry<br />
Plant<br />
Infectious Diseases<br />
GeoScience<br />
Biology<br />
Microbiology<br />
GeoScience<br />
Biology<br />
Microbiology<br />
26
Science map applications: Identifying core competency<br />
Kevin W. Boyack, Katy Börner, & Richard Klavans (2007).<br />
Funding Patterns of the National Science Foundation (NSF)<br />
Education<br />
Psychology<br />
Psychiatry<br />
Law<br />
Policy Statistics<br />
Economics<br />
GI<br />
Vision<br />
Brain<br />
MRI<br />
Bi Bio-<br />
Materials<br />
Cancer<br />
Math<br />
CompSci<br />
Virology<br />
Physics<br />
BioChem<br />
Computer Tech<br />
Environment<br />
Animal<br />
Phys-Chem<br />
Chemistry<br />
Plant<br />
Infectious Diseases<br />
Science map applications: Identifying core competency<br />
Kevin W. Boyack, Katy Börner, & Richard Klavans (2007).<br />
GeoScience<br />
Biology<br />
Microbiology<br />
Funding Patterns of the National Institutes of Health (NIH)<br />
Education<br />
Psychology<br />
Psychiatry<br />
Law<br />
Policy Statistics<br />
Economics<br />
GI<br />
Vision<br />
Brain<br />
MRI<br />
Bi Bio-<br />
Materials<br />
Cancer<br />
Math<br />
CompSci<br />
Virology<br />
Physics<br />
BioChem<br />
Computer Tech<br />
Environment<br />
Animal<br />
Phys-Chem<br />
Chemistry<br />
Plant<br />
Infectious Diseases<br />
GeoScience<br />
Biology<br />
Microbiology<br />
27<br />
28
Science map applications: Identifying core competency<br />
Kevin W. Boyack, Katy Börner, & Richard Klavans (2007).<br />
Funding Patterns of the National Institutes of Health (NIH)<br />
Education<br />
Psychology<br />
Psychiatry<br />
Law<br />
Policy Statistics<br />
Economics<br />
GI<br />
Vision<br />
Brain<br />
MRI<br />
Bi Bio-<br />
Materials<br />
Cancer<br />
Math<br />
CompSci<br />
Virology<br />
Physics<br />
BioChem<br />
Computer Tech<br />
Environment<br />
Animal<br />
Phys-Chem<br />
Chemistry<br />
Plant<br />
Infectious Diseases<br />
GeoScience<br />
Biology<br />
Microbiology<br />
Where Are the Academic Jobs? Interactive Exploration of Job Advertisements<br />
in Geospatial <strong>and</strong> Topical Space<br />
Angela g Zoss, Michael Connover, Katy y Börner ( (2010) )<br />
http://cns-nd3.slis.indiana.edu/mapjobs/geo<br />
29<br />
30
Bollen, Johan, Herbert Van de Sompel, Aric Hagberg, Luis M.A. Bettencourt, Ryan Chute, Marko A. Rodriquez,<br />
Lyudmila Balakireva. 2008. A Clickstream Map of Science. 31<br />
Council for Chemical Research. 2009. Chemical R&D Powers the U.S. Innovation Engine.<br />
Washington, DC. Courtesy of the Council for Chemical Research.<br />
32
Mapping Science Exhibit – 10 Iterations in 10 years<br />
http://scimaps.org<br />
The Power of Maps (2005) Science Maps for Economic Decision Makers (2008)<br />
The Power of Reference Systems (2006) Science Maps for Science Policy Makers (2009)<br />
The Power of Forecasts (2007) Science Maps for Scholars (2010)<br />
SScience i MMaps as Vi Visual l IInterfaces t f to t Digital Di it l Libraries Lib i (2011)<br />
Science Maps for Kids (2012)<br />
Science Forecasts (2013)<br />
How to Lie with Science Maps (2014)<br />
Exhibit has been shown in 72 venues on four continents. Currently at<br />
- NSF, 10th Floor, 4201 Wilson Boulevard, Arlington, VA<br />
- Marston Science Library, <strong>University</strong> of Florida, Gainesville, FL<br />
- Center of Advanced European Studies <strong>and</strong> Research, Bonn, Germany<br />
- Science Train, Germany.<br />
Db f5th Debut of 5 I i f M i S i E hibi MEDIA X M 18 2009 W ll b H ll<br />
th Iteration of Mapping Science Exhibit at MEDIA X was on May 18, 2009 at Wallenberg Hall,<br />
Stanford <strong>University</strong>, http://mediax.stanford.edu, http://scaleindependentthought.typepad.com/photos/scimaps<br />
33<br />
34
Illuminated Diagram Display<br />
W. Bradford Paley, Kevin W. Boyack, Richard Kalvans, <strong>and</strong> Katy Börner (2007)<br />
Mapping, Illuminating, <strong>and</strong> Interacting with Science. SIGGRAPH 2007.<br />
Questions:<br />
• Who is doing g research on what Large-scale, high<br />
topic <strong>and</strong> where?<br />
• What is the ‘footprint’ of<br />
interdisciplinary research fields?<br />
• What impact have scientists?<br />
Contributions:<br />
• Interactive, high g resolution<br />
interface to access <strong>and</strong> make sense<br />
of data about scholarly activity.<br />
resolution prints<br />
illuminated via projector<br />
or screen.<br />
Interactive touch panel.<br />
Katy Börner, Network Workbench: A CI-Marketplace for Network Scientists<br />
35
Science Maps in “Expedition Expedition Zukunft Zukunft” science train visiting 62 cities in 7 months<br />
12 coaches, 300 m long<br />
Opening was on April 23rd , 2009 by German Chancellor Merkel<br />
http://www.expedition-zukunft.de 37<br />
Computational Scientometrics<br />
References<br />
Börner, Katy, Chen, Chaomei, <strong>and</strong> Boyack, Kevin. (2003).<br />
Visualizing <strong>Knowledge</strong> Domains. In Blaise Cronin<br />
(Ed (Ed.), ) ARIST ARIST, Medford Medford, NJ: Information Today, Today<br />
Inc./American Society for Information Science <strong>and</strong><br />
Technology, Volume 37, Chapter 5, pp. 179-255.<br />
http://ivl.slis.indiana.edu/km/pub/2003-borner-arist.pdf<br />
Shiffrin, Richard M. <strong>and</strong> Börner, Katy (Eds.) (2004).<br />
Mapping <strong>Knowledge</strong> Domains. Proceedings of the<br />
National Academy of Sciences of the United States of America,<br />
101(Suppl_1).<br />
http://wwwpnas http://www.pnas.org/content/vol101/suppl_1/<br />
org/content/vol101/suppl 1/<br />
Börner, Katy, Sanyal, Soma <strong>and</strong> Vespignani, Aless<strong>and</strong>ro<br />
(2007). Network Science. In Blaise Cronin (Ed.), ARIST,<br />
Information Today, dy, Inc./American / Society yfor<br />
Information Science <strong>and</strong> Technology, Medford, NJ,<br />
Volume 41, Chapter 12, pp. 537-607.<br />
http://ivl.slis.indiana.edu/km/pub/2007-borner-arist.pdf<br />
Börner, Katy (2010) Atlas of Science. MIT Press.<br />
http://scimaps.org/atlas<br />
38
VIVO: A Semantic Approach to Creating a National Network<br />
of Researchers (http://vivoweb.org)<br />
• Semantic web application pp <strong>and</strong> ontology gy<br />
editor originally developed at Cornell U.<br />
• Integrates research <strong>and</strong> scholarship info<br />
from systems of record across<br />
institution(s)<br />
institution(s).<br />
• Facilitates research discovery <strong>and</strong> crossdisciplinary<br />
collaboration.<br />
Soon:<br />
• Simplify reporting tasks, e.g., generate<br />
biosketch, department report.<br />
Cornell <strong>University</strong>: Dean Krafft (Cornell PI) Manolo Bevia Jim Blake Nick Cappadona Brian Caruso Jon Corson-Rikert Elly Cramer Medha Devare<br />
Cornell <strong>University</strong>: Dean Krafft (Cornell PI), Manolo Bevia, Jim Blake, Nick Cappadona, Brian Caruso, Jon Corson-Rikert, Elly Cramer, Medha Devare,<br />
John Fereira, Brian Lowe, Stella Mitchell, Holly Mistlebauer, Anup Sawant, Christopher Westling, Rebecca Younes. <strong>University</strong> of Florida: Mike Conlon<br />
(VIVO <strong>and</strong> UF PI), Cecilia Botero, Kerry Britt, Erin Brooks, Amy Buhler, Ellie Bushhousen, Chris Case, Valrie Davis, Nita Ferree, Chris Haines, Rae Jesano,<br />
Margeaux Johnson, Sara Kreinest, Yang Li, Paula Markes, Sara Russell Gonzalez, Alex<strong>and</strong>er Rockwell, Nancy Schaefer, Michele R. Tennant, George Hack,<br />
Chris Barnes, Narayan Raum, Brenda Stevens, Alicia Turner, Stephen Williams. <strong>Indiana</strong> <strong>University</strong>: Katy Borner (IU PI), William Barnett, Shanshan Chen,<br />
Ying Ding, Russell Duhon, Jon Dunn, Micah Linnemeier, Nianli Ma, Robert McDonald, Barbara Ann O'Leary, Mark Price, Yuyin Sun, Alan Walsh, Brian<br />
Wheeler, Angela Zoss. Ponce School of Medicine: Richard Noel (Ponce PI), Ricardo Espada, Damaris Torres. The Scripps Research Institute: Gerald<br />
Joyce (Scripps PI), Greg Dunlap, Catherine Dunn, Brant Kelley, Paula King, Angela Murrell, Barbara Noble, Cary Thomas, Michaeleen<br />
Trimarchi. Washington <strong>University</strong>, St. Louis: Rakesh Nagarajan (WUSTL PI), Kristi L. Holmes, Sunita B. Koul, Leslie D. McIntosh. Weill Cornell<br />
Medical College: Curtis Cole (Weill PI), Paul Albert, Victor Brodsky, Adam Cheriff, Oscar Cruz, Dan Dickinson, Chris Huang, Itay Klaz, Peter Michelini,<br />
Grace Migliorisi, John Ruffing, Jason Specl<strong>and</strong>, Tru Tran, Jesse Turner, Vinay Varughese.
VIVO Users <strong>and</strong> Needs<br />
• Faculty/Researchers<br />
▫ Customize profile created via feeds; find potential collaborators collaborators, “people people like<br />
me”; discovery via high search rankings; info on activity of colleagues…<br />
• Students<br />
▫ CCreate t profiles; fil easily il fi find d mentors t + collaborators; ll b t llocate t ffacilities, iliti events, t<br />
funding opportunities…<br />
• Administrators<br />
▫ Quickly find cross-disciplinary expertise (research area; geography); centralize<br />
public data from diverse sources; easily repurpose information for consumers;<br />
improve faculty collaboration within or across departments <strong>and</strong> institutions…<br />
• Funding, donor, legislative agencies<br />
▫ Discover projects, grants, expertise (e.g. for review panels; targets for funding)…<br />
• General public<br />
▫ Find expertise, learn about research in a region/institution…
VIVO Web Pages<br />
http://cals-experts.mannlib.cornell.edu/<br />
http://research.cals.cornell.edu<br />
http://gradeducation.lifesciences.cornell.edu<br />
VIVO Data Providers & Users<br />
• Eagle-i (“enabling resource discovery” U24 award)<br />
• Federal agencies – NIH (NIH RePORTER), NSF, USDA, …<br />
• Search Sea c Providers o de s – Google, Goog e, Bing, g, Yahoo, a oo, …<br />
• Professional Societies – AAAS, …<br />
• Publishers/vendors – PubMed PubMed, Elsevier Elsevier, Collexis Collexis, ISI ISI…<br />
• Semantic Web community – DERI, …<br />
• CConsortia i of f schools h l – SSURA, A CCTSA… SA<br />
• Producers, consumers of semantic web-compliant data
IInstitutional tit ti l AArchitecture hit t<br />
• Three sources of<br />
VIVO information<br />
▫ User data<br />
▫ Institutional data<br />
▫ Provider data<br />
• Two formats for<br />
output<br />
▫ Web Pages for<br />
users<br />
▫ Resource<br />
Description<br />
Framework for<br />
applications<br />
Data Representation using RDF Triples<br />
Detailed relationships for a researcher at Cornell U.<br />
Open source code (BSD) <strong>and</strong> ontology available at http://vivoweb.org.<br />
Mining the record: Historical evidence for…<br />
CSS 4830<br />
featured in<br />
has author<br />
author of<br />
Andrew McDonald<br />
research area<br />
author of<br />
has author<br />
research area for academic staff<br />
taught by<br />
research area crop management<br />
teaches<br />
Susan Riha<br />
research area for<br />
features<br />
person<br />
faculty appointment in<br />
headed by<br />
head of<br />
faculty members<br />
Cornell’s supercomputers crunch weather data to help farmers manage<br />
chemicals<br />
Earth <strong>and</strong> Atmospheric<br />
Sciences<br />
NYS WRI<br />
academic staff<br />
in
VIVO & Linked Open p Data<br />
2010 National VIVO Conference August 12&13, NYC<br />
http://conferences.dce.ufl.edu/vivo<br />
VIVO makes high coverage,<br />
high quality data from<br />
systems of record<br />
• available online<br />
• for free, <strong>and</strong><br />
• in machine readable<br />
format.<br />
VIVO O ontology o oogyis s aged aligned<br />
with many existing Web 2.0<br />
<strong>and</strong> scholarly ontologies to<br />
ease interoperability.<br />
interoperability<br />
http://www4.wiwiss.fu-berlin.de/bizer/pub/lod-datasets_2009-07-14_colored.png<br />
Visualization created by: Katy Börner (concept), Jeni Coffey (design), Kaveh Ekbia (ArcGIS) <strong>and</strong> Justin Peters (ArcGIS).<br />
02/2010<br />
The National Research Network: VIVO: Enabling g National Networking g of Scientists NIH U24RR029822<br />
Start: Sept 2009<br />
PI: Michael Conlon, <strong>University</strong> of Florida<br />
Award amount: $12,300,000
Visualization created by: Katy Börner (concept), Jeni Coffey (design), Kaveh Ekbia (ArcGIS) <strong>and</strong> Justin Peters (ArcGIS).<br />
Shown are the number of people p p pprofiles<br />
in the 7 different installation sites.<br />
Email contacts by data <strong>and</strong> service providers as well as institutions interested to adopt VIVO.<br />
The number of visitors on http://vivoweb.org<br />
Visualization created by: Katy Börner (concept), Jeni Coffey (design), Kaveh Ekbia (ArcGIS) <strong>and</strong> Justin Peters (ArcGIS).<br />
04/2010<br />
06/2010<br />
VIVO 1.0 source code was publicly p yreleased on April p 14, , 2010<br />
87 Downloads by June 11, 2010<br />
The more institutions adopt VIVO, the more high quality data will be available to underst<strong>and</strong>, navigate,<br />
manage, utilize, <strong>and</strong> communicate progress in science <strong>and</strong> technology.
Computational Scientometrics<br />
Cyberinfrastructures<br />
Scholarly Database: 23 million scholarly records<br />
http://sdb.slis.indiana.edu<br />
VIVO Research Networking<br />
h http://vivoweb.org<br />
// i b<br />
Information Visualization Cyberinfrastructure<br />
http://iv.slis.indiana.edu<br />
p<br />
Network Workbench Tool & Community Wiki<br />
http://nwb.slis.indiana.edu<br />
Science of Science (Sci 2 ) Tool <strong>and</strong> CI Portal<br />
http://sci.slis.indiana.edu<br />
Epidemics Cyberinfrastructure<br />
http://epic.slis.indiana.edu/<br />
Thi This is i the th only l mockup k in i this thi slide lid show. h<br />
E Everything hi else l i is available il bl today.<br />
d<br />
51
All papers, maps, cyberinfrastructures, talks, press are linked<br />
from http://cns.slis.indiana.edu