reviewed paper Towards True Underground Infrastructure ... - CORP
reviewed paper Towards True Underground Infrastructure ... - CORP
reviewed paper Towards True Underground Infrastructure ... - CORP

You also want an ePaper? Increase the reach of your titles
YUMPU automatically turns print PDFs into web optimized ePapers that Google loves.
REAL <strong>CORP</strong> 2010 Proceedings/Tagungsband<br />
Vienna, 18-20 May 2010 – http://www.corp.at<br />
� <strong>reviewed</strong> <strong>paper</strong><br />
<strong>Towards</strong> <strong>True</strong> <strong>Underground</strong> <strong>Infrastructure</strong> Surface Documentation<br />
Thomas Ortner, Gerhard Paar, Gerd Hesina, Robert F. Tobler. Bernhard Nauschnegg<br />
(Thomas Ortner MMSc, VRVis, Donau-City-Straße 1,Vienna A-1220, ortner@vrvis.at)<br />
(DI. Gerhard Paar, Joanneum Research, Graz A-8010, gerhard.paar@joanneum.at)<br />
(Dr. Gerd Hesina, VRVis, Donau-City-Straße 1,Vienna A-1220, hesina@vrvis.at)<br />
(Dr. Robert F. Tobler, VRVis, Donau-City-Straße 1,Vienna A-1220, rft@vrvis.at)<br />
(DI (FH) Bernhard Nauschnegg, Joanneum Research, Graz A-8010, bernhard.nauschnegg@joanneum.at)<br />
1 ABSTRACT<br />
<strong>Underground</strong> infrastructure becomes more and more important in urban development. Building and<br />
maintaining tunnels typically involves three phases: construction, monitoring and repair. Throughout all<br />
three phases engineers increasingly demand a visually and geometrically exact digital representation of a<br />
tunnel surface involving both high resolution imagery and laser scan data. These requirements pose a<br />
challenge to all phases of the visualization pipeline.<br />
After retrieving geo-referenced geometric and image data with a surface resolution in the range of 1mm and<br />
better, novel processing and mapping techniques are applied to enable a fast and efficient rendering while<br />
preserving high sensor data quality.<br />
Visualization of such data requires the handling of huge amounts of 3D Points, high-resolution textures and<br />
additional graphical elements that explain the context of the displayed data. Without additional processing<br />
the sum of this data exceeds the capacities of both the graphics card and the main memory.<br />
The <strong>paper</strong> describes how a tunnel of several kilometers length is digitalized by range laser scanners and<br />
cameras, processed into an efficient data structure and finally integrated into a fully interactive 3D<br />
visualization combining multiple data sources for real-time display and interpretation.<br />
2 INTRODUCTION<br />
The quality assessment and - control of roads, tunnels, railroad tracks, water channels, airport runways and<br />
other linear structures has been an issue ever since such structures were in use. The documentation of surface<br />
defects in terms of location, physical and geometrical properties, amount of damage, and visual appearance<br />
is not only important for safety reasons. Frequent maintenance relies on the detection of potentially<br />
hazardous defects to initiate focused correction measures at an early state to save costs due to small<br />
interventions, keep the risk level low, and avoid unexpected closures of traffic lines.<br />
First means of inspection were based on the human visual system, assisted by mechanical measurement<br />
devices, chemical and physical tests on manually selected points of interest, and the installation of simple<br />
geodetic monitoring devices. Hand- drawings and notes were used for localization and context description of<br />
defects, followed by photographic documentation. The history of changes became important when a unified<br />
quality management came into existence.<br />
Nowadays high-resolution vision sensors are available to map the surface of linear structures. Laser<br />
scanners, digital cameras, mobile platforms that host sophisticated suites of such devices in combination with<br />
navigation abilities, and the relating on-site Hardware and Software data acquisition means collect consistent<br />
sets of geo-coded 3D structure and texture information. A solution to the challenge of maintaining the huge<br />
amounts of data involved, while providing an ergonomic and user-friendly access to the relevant stages of<br />
information is content of this <strong>paper</strong>.<br />
3 RELEVANT WORK<br />
The measurement and visual surface inspection of linear structures using passive and active vision sensors<br />
started to be a well established application area of digital vision metrology about 10 years ago. Several<br />
systems for linear structure surveying, in particular tunnels, are on the market with different approaches and<br />
sensor configurations, most of them using laser scanners in frame scan (Amberg 2010, Fröhlich 2004), or<br />
line scan mode (Spacetec 2010). Road profiling with a resolution of several cm has been covered by mobile<br />
mapping approaches using Inertial Measurement Unit (IMU) and Global Positioning System (GPS), for<br />
example with the MoSES (Gräfe 2004) system which also applies digital cameras, or the Austrian road<br />
condition monitoring device RoadStar (Arsenal 2010). With the Dibit system (Dibit 2010) a first<br />
Editors: Manfred SCHRENK, Vasily V. POPOVICH, Peter ZEILE<br />
783
<strong>Towards</strong> <strong>True</strong> <strong>Underground</strong> <strong>Infrastructure</strong> Surface Documentation<br />
photogrammetry-based solution for tunnel excavation monitoring was presented in 1999. This application<br />
segment is also covered by an Austrian provider using static laser scanning (Geoconsult 2010). For geologic<br />
excavation documentation the high spatial and radiometric resolution of digital stereo images has been well<br />
established (Gaich 2004).<br />
The combination of laser scanning and high-resolution digital images underwent some recent research<br />
(Abmayr 2004, Ulrich 2003). A combination between laser scanning and digital camera (Paar 2005) turned<br />
out to be robust in the tunnel case. In the first stages of application the measurement of tunnel surfaces<br />
during different construction phases (excavation, shotcrete, segments of TBM-Tunnel Boring Machines,<br />
final lining) was emphasized. With growing textural surface resolution the technology is also suited for the<br />
inspection and the inventing of existing tunnels and it is even able to support the remote mapping of cracks<br />
(Paar 2006).<br />
Although great strides have been done during the last years in bringing visualization to the attention of the<br />
engineering community, it has not yet been universally accepted as a tool for typical engineering tasks.<br />
Visualization of linear structures such as tunnels represents a great opportunity to remedy this lack, and<br />
apply some of the recent visualization techniques of multi-dimensional data (Aigner 2007) to a technical<br />
problem. One of the main features of structure visualization is the time-dependent nature of the data (i.e.<br />
there are multiple data sets from the same structure, representing different snapshots of its state). Although<br />
some of the work on time dependent data (Kosara 2004, Piringer 2005) can be applied to this task, it has to<br />
be adapted, since in previous research time is mostly represented by a continuous dimension, as opposed to<br />
the discrete nature of the time-dimension in the problem at hand. Nevertheless some of the techniques for<br />
handling large data can be applied and extended in order to deal with the huge amount of data provided by<br />
structure scanning.<br />
Since it was possible to acquire and export data in an ordered fashion the data at hand can be processed<br />
similar to a height map. Since graphics cards of the last two generations offer a high triangle throughput a<br />
simple multiresolution level of detail rendering approach was chosen as described in Lübke (2001, p.187).<br />
Since laser scan data is point based one could also consider a system similar to QSplat (Rusinkiewicz 2000).<br />
QSplat assumes arbitrary points and does not consider the advantage of ordered point sets, it offers however<br />
a sophisticated data management approach to deal with large point sets.<br />
As it will be discussed in later sections specific data requires to be rendered as polygonal lines in 3d space.<br />
Shader based approaches as discussed in Akenine-Möller (2008, p.528) have been considered, but neglected<br />
since they might be difficult to integrate and combine with the other rendering. Volumetric lines (Nvidia<br />
2010) did not yield convincing results due to artifacts. In the end a simple and fast polygonal approach was<br />
chosen as it is described in more detail in section 5.<br />
4 DATA ACQUISITION & PROCESSING<br />
4.1 Data Acquisition<br />
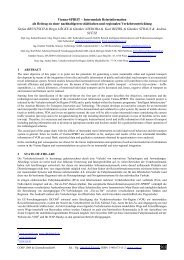
The data acquisition system is based on state-of-art vision sensors (e.g. laser scanners, digital cameras). The<br />
whole system is moved through the tunnel by means of a mobile platform (Figure 1). Data acquisition takes<br />
place either on certain positions (stop-and-go mode, using spherical laser scans) or continuously moving<br />
(dynamic mode, using a stream of laser lines). It typically produces data consisting of rectangular arrays of<br />
scan points, and a number of images that overlap this scan area. A number of such – ideally overlapping –<br />
3D and texture data sets represent a tunnel.<br />
784<br />
REAL <strong>CORP</strong> 2010:<br />
CITIES FOR EVERYONE. Liveable, Healthy, Prosperous
REAL <strong>CORP</strong> 2010 Proceedings/Tagungsband<br />
Vienna, 18-20 May 2010 – http://www.corp.at<br />
Thomas Ortner, Gerhard Paar, Gerd Hesina, Robert F. Tobler. Bernhard Nauschnegg<br />
Figure 1: Data acquisition platform equipped with laser scanner and camera (left, center), tunnel site(right)<br />
In order to facilitate merging of several scans the global orientation of the system must be known. It is<br />
determined either by exterior measurement using a radio-controlled theodolite, by vision data acquisition of<br />
known targets (Kaltenböck, 2004) or by using odometry in combination with an inertial navigation system<br />
(INS). The individual sensors are oriented relatively to each other in a pre-calibration step. The orientation<br />
between different vision sensors on the same sensor platform is further refined by texture matching on<br />
measurement data level (Paar et al., 2005).<br />
4.2 Processing Workflow Sketch<br />
Passive and active vision sensor data (e.g. Camera images and laser scans) are processed independently from<br />
each other as far as possible, since one camera image generally can overlap several laser scans and vice<br />
versa. Further, pre-processing of the measurement data is kept to a minimum to avoid artifacts or texture<br />
blurring. This leads to a workflow as depicted in Figure 2. The mapping of the laser data on the tunnel<br />
surface uses a parameterized tunnel model and a regular grid as a digital surface model on top of it (Bauer &<br />
Paar, 1997). Co-registration of adjacent measurements takes place using textured point cloud matching<br />
(Pottmann et al, 1995).<br />
4.3 Visualization Data Preparation<br />
Figure 2: Processing workflow, resulting in an Ordered Point Cloud (OPC)<br />
The data acquisition system produces huge amounts of data for a tunnel of several kilometers length.<br />
Assuming a texture resolution of about 1 mm and a geometric resolution of about 1 cm, close to 200 GB of<br />
raw data for a tunnel of one km length are to be expected. To facilitate fast and efficient rendering of such<br />
data amounts with affordable hardware, the measurement data is converted into a data structure which allows<br />
the renderer to be dynamically fed with manageable data and supports multiple levels-of-detail (LoD).<br />
The so-called Ordered Point Cloud (OPC) consists of a multiresolution structure both for the 3D surface and<br />
the texture represented as individual grids. For the following rendering it allows the access to the processed<br />
data in various resolution levels, thus ensuring the efficient usability of LoD concepts.<br />
5 VISUALIZATION<br />
The demands to a visualization system grow with increasing resolution. As soon as the data quality at the end<br />
of the processing pipeline exceeds the ability of <strong>paper</strong> plots (as used in standard construction and quality<br />
engineering processes), the user needs to get access to the data by a real-time rendering system, providing an<br />
Editors: Manfred SCHRENK, Vasily V. POPOVICH, Peter ZEILE<br />
785
<strong>Towards</strong> <strong>True</strong> <strong>Underground</strong> <strong>Infrastructure</strong> Surface Documentation<br />
“immersive” view on one or more computer screens, compared to the situation of physically moving around<br />
in the displayed environment. Arbitrarily changing the distance and viewing position allows a quick<br />
orientation and the effective microscopic investigation of artifacts almost at the same time.<br />
After data acquisition and pre-processing several challenges are therefore posed to the visualization stage<br />
which can be divided into the following three categories:<br />
• Handling and rendering data that exceeds the size of the main memory or the graphics card’s<br />
memory, respectively<br />
• Simultaneously visualizing data of various forms without creating visual clutter<br />
• Interacting with data in a manner desired by the future users of the described application<br />
In the following these three challenges are dealt with in detail.<br />
5.1 Rendering Massive Amounts of Data<br />
Considering a tunnel of several kilometers length and the resulting processing resolutions described in 4.3<br />
the exported OPC data may easily exceed the limits of customer end system resources. Further, tunnels often<br />
consist of multiple tubes and the end-user might want to compare multiple phases, so the memory<br />
consumption may easily increase.<br />
A computer graphics-based solution designed to navigate through large data sets at interactive frame rates<br />
typically facilitates two strategies: An out-of-core (OOC) data management and a LoD rendering algorithm,<br />
which are responsible for not running out of main memory and efficiently stream and display data. To<br />
navigate through the scene, the user moves the so called camera by changing its position and / or viewport.<br />
5.1.1 Out-Of-Core Data Management<br />
The first step of an OOC strategy is to decide which subset of the whole data is crucial to support the current<br />
view and therefore is to be streamed from the hard drive to main memory. In our case this is decided for each<br />
OPC based on the distance to the camera position and the closest point on an OPC’s bounding box. For<br />
instance, being inside the tunnel there is no need to load OPCs outside of a radius of 300 meters. Further<br />
OPCs outside the viewing frustum, i.e. behind the viewer or outside of the peripheral sight, are ignored.<br />
786<br />
Figure 3: Illustration of capture density – point grid with 0.7 cm average distance between two points<br />
When constantly streaming more data, while navigating through the tunnel the viewed data still might<br />
exceed the system’s main memory at some point. Consequently the OOC algorithm has to remove OPCs<br />
which have become irrelevant. Rendered OPCs are constantly enqueued in a least recently used (LRU)<br />
manner, which keeps its element ordered by age. In regular intervals all OPCs exceeding a certain age are<br />
removed from the system memory.<br />
REAL <strong>CORP</strong> 2010:<br />
CITIES FOR EVERYONE. Liveable, Healthy, Prosperous
REAL <strong>CORP</strong> 2010 Proceedings/Tagungsband<br />
Vienna, 18-20 May 2010 – http://www.corp.at<br />
Thomas Ortner, Gerhard Paar, Gerd Hesina, Robert F. Tobler. Bernhard Nauschnegg<br />
Assuming a constant viewing distance, and that the OPCs in a data set are exported at about the same length<br />
the number of OPCs processed at once is constant. At this point the user might adjust the distance constraint<br />
to meet the desired balance between performance and sight.<br />
5.1.2 Level of Detail Rendering<br />
According to Luebke (2001 p.10) LoD rendering dynamically selects the most appropriate level of detail to<br />
support the current view. The previously discussed OPC hierarchy consists of multiple resolution levels,<br />
where each level spatially encloses its child levels.<br />
Figure 4: Multiresolution hierarchy<br />
Since the hierarchy is created in a bottom up fashion the level 0 at the bottom contains the highest detail<br />
(original scan resolution). Considering a 3 level hierarchy level 1 is a simplification of level 0, whereas level<br />
2 is a simplification of level 1 as depicted in Figure 4.<br />
Keeping in mind that all levels consist of an ordered sequence of points an OPC can be thought of as a<br />
pyramid of multiple grids. Except of residing on the tunnels curved surface the given data itself does not<br />
show any significant difference to height maps or terrain data as seen in Luebke (2001, p.186). Applying a<br />
straight-forward view-dependent terrain LoD algorithm carefully combines various LoDs according to the<br />
camera’s position and viewport, i.e. scan data at a distance of 200m is barely visible so there is no need to<br />
render it at full detail whereas data directly in front of the viewer is desired to present itself at full detail.<br />
Due to the nature of the data structure all LoDs on the path to the desired level are streamed and rendered<br />
subsequently, which results in a gradual refinement of the visible surface data. Although Figure 5a shows a<br />
significant simplification at the end of the tunnel this lack of detail is barely perceivable in Figure 5b. The<br />
image artefacts might be further reduced by applying anisotropic filtering directly offered by the graphics<br />
hardware, but this might impose a considerable performance penalty on lower-end and medium- priced<br />
graphics cards.<br />
Figure 5: Different levels of detail shown in point (a) and solid mode (b)<br />
Which LoD is ought to be displayed at which distance depends on the users current aims so their association<br />
is chosen semi-automatically. Distances are calculated by a quadratic function taking the real world scan<br />
resolution into account. Coefficients can be adjusted through a simple slider to find a good balance between<br />
speed and quality.<br />
Editors: Manfred SCHRENK, Vasily V. POPOVICH, Peter ZEILE<br />
787
<strong>Towards</strong> <strong>True</strong> <strong>Underground</strong> <strong>Infrastructure</strong> Surface Documentation<br />
5.1.3 Rendering and Intersection Optimizations<br />
As depicted in Figure 3 positions are arranged in order as a 2 dimensional grid. This attribute allows creating<br />
a triangulated mesh by computing index arrays at runtime. Since the data exporter strives for creating patches<br />
of the same size the index arrays are identical for most of the grids and can be cached.<br />
To optimize upload times of index arrays to the graphics card triangle strip indices are used as suggested in<br />
Akenine-Möller (2008, p.549-552). Their size is reduced to about a third in comparison to triangle list<br />
indices.<br />
Although the layout of the OPC data structure is identical to the typical structure of terrain data the curvature<br />
of the tunnel poses a significant challenge to the distance computation. Where it is sufficient for terrain<br />
rendering to compute the distance between the viewer and the bounds of a certain level in the hierarchy this<br />
method turned out to be too inaccurate for a curved surface. Therefore a kd-tree data structure is created for<br />
the highest level in an OPC hierarchy. The key advantage of a kd-tree is to greatly speed up ray / triangle<br />
intersections. By shooting random rays into the viewing direction the viewed surface is intersected with<br />
spoken-of rays and yields far more accurate distance to the surface itself.<br />
5.2 System Exploitation Use Cases<br />
So far the described rendering application solely dealt with the presentation of acquired real world data at<br />
high visual fidelity while not exceeding the system’s resources and maintaining interactive framerates. At<br />
this point data from other sources is introduced to create a mixed reality allowing the user to draw new<br />
conclusions by putting them into context. This step marks the transition from a presentation to actual<br />
visualization. In the following the different elements and integration will be discussed such as database<br />
objects, deviations, axes and marker planes.<br />
5.2.1 Line Based Objects<br />
With a certain tunnel a set of polygonal objects is associated. Such a polygon is described by its positions as<br />
a list of line segments, its color and a flag defining whether it is closed or not. Since these objects emerge<br />
from CAD (Computer Aided Design) programs they are also desired to be represented in the scene as lines.<br />
These polygons are typically used to indicate niches, cables, hatches and especially cracks (semiautomatically<br />
mapped (Paar et al, 2006)) and damaged spots on the tunnel surface.<br />
Figure 6: Cracks and surface defects of different classifications / Viewer embedded in Dibit7 framework with project tree and viewer<br />
map to the left<br />
788<br />
REAL <strong>CORP</strong> 2010:<br />
CITIES FOR EVERYONE. Liveable, Healthy, Prosperous
REAL <strong>CORP</strong> 2010 Proceedings/Tagungsband<br />
Vienna, 18-20 May 2010 – http://www.corp.at<br />
Thomas Ortner, Gerhard Paar, Gerd Hesina, Robert F. Tobler. Bernhard Nauschnegg<br />
Although the used graphics API DirectX offers line rendering, lines can only be displayed at a width of one<br />
pixel and are not hardware accelerated by customer-end graphics cards. To overcome these limitations each<br />
line segment is rendered as a triangulated cylinder with its vertices displaced by the vertex shader. The<br />
displacement factor is modulated by distance so the lines always occupy the approximately same width in<br />
pixels on screen. By introducing a scale factor the line width may also be adjusted in real-time by the user.<br />
5.2.2 Dynamic and Static Planes<br />
To indicate a tunnel’s profile at a specific station of the tunnel axis a plane orthogonal to the axis is<br />
constructed. Planes are represented by a semi - transparent quad (i.e. a small elementary patch, defined by 4<br />
3D points accurately or approximately lying on the same plane) of given size and color. Since the graphics<br />
card blends the solid tunnel geometry with the protruding semi - transparent quad the course of the profile<br />
can be seen as a change in color tone (see Figure 7).<br />
Figure 7: Static planes and billboards on the left (axis, cracks and cables as poly-lines), dynamic axis aligned plane on the right<br />
A list of static planes is sent to the renderer defined by a position and a normal vector, whereas the dynamic<br />
plane is computed in real-time while navigating along the tunnel axis. To assure correct blending, solid<br />
surfaces have to be rendered before transparent ones. Since it is necessary to display more than one plane at<br />
once the respective transparent quads have to be rendered in a view-dependent order, otherwise blending<br />
artifacts may occur. The user may also specify a maximum number of planes to be rendered, to avoid visual<br />
clutter.<br />
5.2.3 Data Maps<br />
So far an OPC was rendered as triangulated geometry with its associated image. More generally the texture<br />
can be referred to as a map. The attached coordinate file defines which portion of the map applies to the<br />
respective vertex. Consequently various data map pyramids can be associated with an OPC. Encoding data in<br />
an image allows the patch and the data to be in different resolutions. Values are interpolated through the<br />
graphics card by using the mapping coordinates.<br />
Figure 8: False color rendering of deviations<br />
Editors: Manfred SCHRENK, Vasily V. POPOVICH, Peter ZEILE<br />
789
<strong>Towards</strong> <strong>True</strong> <strong>Underground</strong> <strong>Infrastructure</strong> Surface Documentation<br />
At the moment only deviation maps are taken into account. The scalar values in these maps represent the<br />
geometry’s absolute deviation from a given norm geometry. After clamping the values at certain deviation<br />
levels they can be used to index into a color map resulting in a false color visualization of deviations as it can<br />
be seen in Figure 8.<br />
5.2.4 Transparent Surfaces<br />
Certain use cases might require the rendering of two phases of a tunnel on top of each other where one of<br />
them is rendered transparent. At the current stage of the application this mode is utilized to perform a visual<br />
structural clearance intersection. Therefore a triangulated mesh is extrapolated from structural clearance<br />
profiles along the axis by the exporter. Rendering the structural clearance mesh transparent over the solid<br />
tunnel geometry indicates an intersection between surfaces as a change in color (see Figure 9.).<br />
790<br />
Figure 9: Transparent surface rendered on top of solid surface<br />
This approach is similar to transparent planes in 5.2.2, however the more complex form of the transparent<br />
surface requires a view-dependent sorting of every single triangle. Therefore a binary space partition (BSP)<br />
tree is created as a pre processing step, which allows accessing all triangles in the sequence they are seen in.<br />
5.3 Passive Interaction with Data<br />
Beyond rendering data, in the given scenario of quality engineering and inspection a specific interaction with<br />
the data is required. At this point of the application only passive interaction with data will be discussed since<br />
no manipulation of the data occurs. In the following some typical aspects of interaction are covered.<br />
5.3.1 Axis Navigation<br />
When navigating through a tunnel it is often desired to focus the user’s movement to remain along the tunnel<br />
axis instead of free-fly navigation through the scene. The tunnel axis is discretized by a polygon, thus by<br />
applying straight forward mathematic concepts any positions and viewing vectors along the axis can be<br />
computed. Offsets in x and y dimensions in respect to the course of the axis allow to navigate along paths<br />
parallel to it.<br />
5.3.2 Time aware Rendering, Switchable Nodes & Markup Colors<br />
When displaying numerous data sets and different forms of data it is useful to mask objects or highlight them<br />
in a certain color. The user may mask certain construction phases or whole building projects to avoid visual<br />
clutter or to increase loading and rendering performance.<br />
Since OPCs contain a timestamp it is possible to use a time frame as mask criteria. The boundaries of the<br />
time frame can be adjusted in real time so it illustrates the growing of the tunnel over time. Including the<br />
latest working tunnel face for a given time frame conveys an even more convincing visualization of the<br />
tunnel driving during construction.<br />
REAL <strong>CORP</strong> 2010:<br />
CITIES FOR EVERYONE. Liveable, Healthy, Prosperous
REAL <strong>CORP</strong> 2010 Proceedings/Tagungsband<br />
Vienna, 18-20 May 2010 – http://www.corp.at<br />
Thomas Ortner, Gerhard Paar, Gerd Hesina, Robert F. Tobler. Bernhard Nauschnegg<br />
6 CONCLUSION<br />
Using lasers scanners and other vision sensors is a rather young approach to conduct surface documentation<br />
of urban infrastructure installations. The acceptance of 3D visualization systems is still limited among<br />
potential users but steadily growing.<br />
The presented visualization is part of the newest version of a commercial software lineage. Since previous<br />
versions only offered limited 3D rendering capabilities the visualization of and interaction with the acquired<br />
data were brought a considerable step forward. At this point the discussed features represent a basic subset<br />
by providing efficient rendering of large data sets, concise visualization of additional information and<br />
intuitive interaction, including movement.<br />
Although the presented results look promising the application lacks two features, which may be considered<br />
as crucial for the acceptance among the tunnel construction community: Measurement and manipulation or<br />
creation of new data.<br />
Improved measurement may include the computation of the volume between virtually designed tunnel<br />
geometry and a real-world scanned rough excavation. Consequently it is possible to calculate the amount of<br />
concrete needed to pave the tunnel surface. Further simple measurements such as direct and on the surface<br />
distances have to be included.<br />
Integration of previous modules would offer great improvements in usability, such as performing the semiautomatic<br />
crack detection while navigating through the scene.<br />
In this way the ability of a real-time graphical representation of as-built underground scenes and attached<br />
visualization of relevant additional information has reached the maturity to sustainably replace <strong>paper</strong> printouts<br />
and the necessity to ensure on-site expert presence. This represents a considerable step forward in Urban<br />
planning, safety management and the objective and repeatable monitoring & maintenance of public transport<br />
installations.<br />
7 ACKNOWLEDGEMENTS<br />
This work is part of the “FIT-IT” (www.fit-it.at) Project VILMA (contract number 815991/14444<br />
GLE/ROD), funded by the Austrian Federal Ministry for Transport, Innovation and Technology and FFG<br />
(www.ffg.at)<br />
8 REFERENCES<br />
Abmayr T., Härtl F., Mettenleiter M., Heinz I., Hildebrand A., Neumann B., Fröhlich C. “Realistic 3d Reconstruction – Combining<br />
Laserscan Data With Rgb Color Information”. Proc. XXth ISPRS Congress, 12-23 July 2004 Istanbul, Turkey.<br />
Aigner, Miksch, Müller, Schumann, Tominski: "Visualizing Time-Oriented Data: A Systematic View" in Computers&Graphics,<br />
2007.<br />
Akenine-Möller, T., Haines, E., Real-Time Rendering. 3rd Ed. Natick: A. K. Peters. 2008.<br />
Amberg, http://www.amberg.ch/at/uploads/media/Brochure_TMSTunnelscan_en.pdf, 2009<br />
Dibtit, http://www.dibit.at, 2010<br />
Fröhlich, C., Mettenleiter, M. Terrestrial Laser Scanning – New Perspectives in 3D Surveying. In: International Archives of<br />
Photogrammetry, Remote Sensing and Spatial Information Sciences, Vol XXXVI – 8/W2, Freiburg, Germany, 2004,<br />
pp. 7-13<br />
Gaich, A., Schubert, W., Pötsch, M. “Reproducible rock mass description in 3D using JointMetriX3D system”, Eurock 2004, Proc. of<br />
the ISRM Regional Symposium Eurock 2004 & 53rd Geomechanics Colloquy, Salzburg, Austria, pp. 61-64, 2004.<br />
Geoconsult, http://www.geoconsult.at, 2010<br />
Gräfe, G., Caspary, W., Heister, H., Klemm, J., Lang, M. Erfahrungen bei der kinematischen Erfassung von Verkehrswegen mit<br />
MoSES. 14th International Conference on Engineering Surveying Zürich, March 15. – 19. 2004<br />
Helmut Doleisch, Martin Gasser, Helwig Hauser: "Interactive feature specification for focus+ context visualization of complex<br />
simulation data", Proceedings of the symposium on Data visualisation 2003<br />
Kosara, Bendix, Hauser: "Timehistograms for large, time-dependent data", Joint Eurographics – IEEE Symposium on Visualization,<br />
2004.<br />
Luebke, D., Reddy, M., Cohen, J., Varschney, A., Watson, B., Huebner, R., Level of Detail for 3D Graphics. Morgan Kaufmann,<br />
2002<br />
Nvidia, Volumetric Lines<br />
http://http.download.nvidia.com/developer/SDK/Individual_Samples/screenshots/samples/VolumeLine.html, 2010.<br />
Paar G., Kontrus H., Bauer A.: Texture Based Fusion Between Laser Scanner and Camera for Tunnel Surface Documentation. In: 7th<br />
ISPRS Conference on Optical 3-D Measurement Techniques. Vienna, 2005.<br />
Paar, G., Caballo-Perucha, M., Kontrus, H., Sidla, O., Optical Crack Following on Tunnel Surfaces; Proc. SPIE OpticsEast,<br />
Photonics for Applications in Industry, Life Sciences, and Communications, Boston, USA; October 1-4, 2006<br />
Piringer H., Design guidelines and concepts of the infovis library. Technical report, VRVis, 2005, TR-VRVis-2005-034.<br />
Editors: Manfred SCHRENK, Vasily V. POPOVICH, Peter ZEILE<br />
791
<strong>Towards</strong> <strong>True</strong> <strong>Underground</strong> <strong>Infrastructure</strong> Surface Documentation<br />
Rusinkiewicz, S., Levoy, M., QSplat: A Multiresolution Point Rendering System for Large Meshes. Proceedings of ACM SIG-<br />
GRAPH 2000, Computer Graphics Proceedings, 2000.<br />
Spacetec, http://www.spacetec.de, 2009<br />
792<br />
REAL <strong>CORP</strong> 2010:<br />
CITIES FOR EVERYONE. Liveable, Healthy, Prosperous