

Download - Amazon Web Services
Download - Amazon Web Services
Download - Amazon Web Services

Create successful ePaper yourself
Turn your PDF publications into a flip-book with our unique Google optimized e-Paper software.
vernier data share <br />
web app<br />
data collection and analysis with the versatility of<br />
modern web technology<br />
students use Vernier data share and mobile devices<br />
with compatible browsers to wirelessly collect<br />
LabQuest 2 and Logger Pro data from sensors. Lab<br />
group members collaboratively collect data from an<br />
experiment, and each student analyzes a copy of the<br />
data on an individual device. students use analysis tools<br />
in class or at home and print graphs or save data for lab<br />
reports and further analysis.<br />
Vernier data share is included with LabQuest 2 and<br />
Logger Pro.<br />
www.vernier.com/data-share<br />
vernier data share<br />
versatility – any device with a network connection and<br />
a compatible browser can collect, graph, analyze, and<br />
save data. Vernier data share supports iPad, iPhone ® ,<br />
iPod ® touch, android phones and tablets, Chromebooks,<br />
notebook computers, and more.<br />
advanced features of data sharing apps<br />
1-to-1 Learning – each member of a lab group can access<br />
data collected from a single data sharing source, such<br />
as LabQuest 2 or Logger Pro. Lab groups cooperate on<br />
an experiment, and each student receives an individual<br />
copy of the data for analysis. students can individually<br />
annotate the data, perform curve fi ts, and make<br />
statistical calculations.<br />
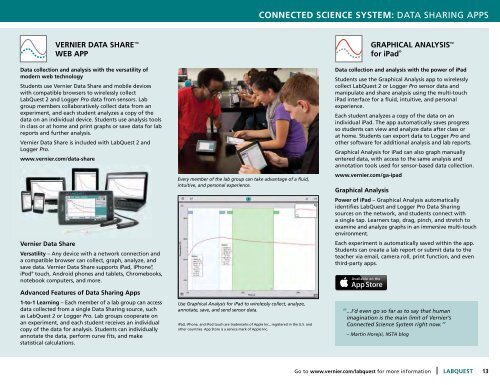
Every member of the lab group can take advantage of a fluid,<br />
intuitive, and personal experience.<br />
Use Graphical Analysis for iPad to wirelessly collect, analyze,<br />
annotate, save, and send sensor data.<br />
iPad, iPhone, and iPod touch are trademarks of apple inc., registered in the U.s. and<br />
other countries. app store is a service mark of apple inc.<br />
connected science systeM: data sHarinG aPPs<br />
graphicaL anaLysis <br />
for ipad ®<br />
data collection and analysis with the power of ipad<br />
students use the Graphical analysis app to wirelessly<br />
collect LabQuest 2 or Logger Pro sensor data and<br />
manipulate and share analysis using the multi-touch<br />
iPad interface for a fl uid, intuitive, and personal<br />
experience.<br />
each student analyzes a copy of the data on an<br />
individual iPad. the app automatically saves progress<br />
so students can view and analyze data after class or<br />
at home. students can export data to Logger Pro and<br />
other software for additional analysis and lab reports.<br />
Graphical analysis for iPad can also graph manually<br />
entered data, with access to the same analysis and<br />
annotation tools used for sensor-based data collection.<br />
www.vernier.com/ga-ipad<br />
graphical analysis<br />
power of ipad – Graphical analysis automatically<br />
identifi es LabQuest and Logger Pro data sharing<br />
sources on the network, and students connect with<br />
a single tap. Learners tap, drag, pinch, and stretch to<br />
examine and analyze graphs in an immersive multi-touch<br />
environment.<br />
each experiment is automatically saved within the app.<br />
students can create a lab report or submit data to the<br />
teacher via email, camera roll, print function, and even<br />
third-party apps.<br />
“ ...I’d even go so far as to say that human<br />
imagination is the main limit of Vernier’s<br />
Connected Science System right now.”<br />
– Martin Horejsi, NSTA blog<br />
Go to www.vernier.com/labquest for more information | Labquest<br />
13